Reading view

There are new articles available, click to refresh the page.

Bitcoin Price Mirroring Key Patterns From 2021 – Is History About To Repeat?

The Bitcoin price is showing signs of history repeating itself, as current price action mirrors key patterns from the 2021 cluster. With resistance near $91,000–$92,000 and the macro downtrend looming, traders are watching closely to see if BTC will break higher or face renewed pressure. The coming days could prove decisive in shaping the next major move.

Bitcoin Mirrors 2021 Cluster: History In Motion

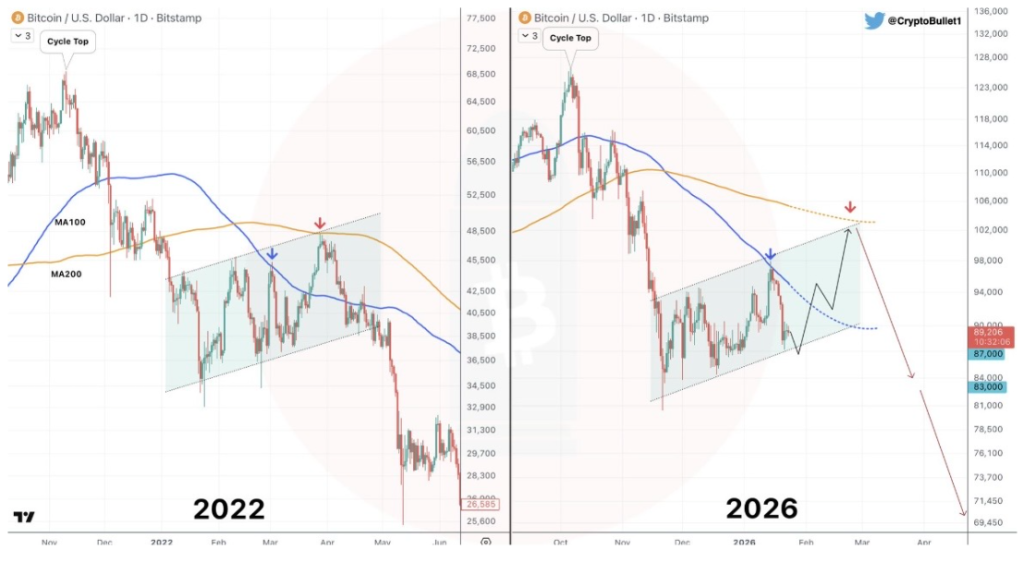
Bitcoin continues to mirror the price patterns seen during the 2021 cluster. Crypto analyst Rekt Capital noted that the current market structure is echoing historical behavior, suggesting that similar dynamics are at play. Traders are closely watching these familiar patterns to gauge whether the cycle is repeating itself or if new trends may emerge.

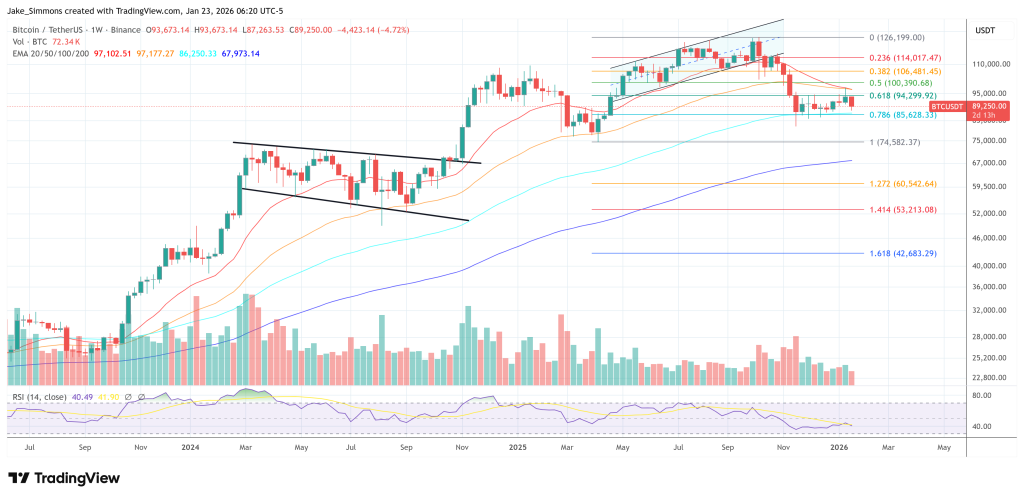
The rules of the game remain consistent. A bearish acceleration would likely be triggered if Bitcoin breaks down from the macro descending triangle base, currently positioned around $82,000. Conversely, a bullish bias would require a decisive break above the macro downtrend, which sits near $100,000. These levels serve as critical decision points for the market, dictating whether bulls or bears gain control in the coming sessions.

Bitcoin

So far, Bitcoin has encountered rejection in the high $90,000s, falling just short of the macro downtrend. This mirrors previous market behavior, in which the asset developed a basing structure near the triangle’s base before attempting to push higher toward the downtrend’s upper boundary. It demonstrates that history is repeating itself for now, with the market consolidating and preparing for its next directional move.

If the macro downtrend continues to act as resistance, the triangle’s base may gradually weaken over time. Such a development would increase the risk of further downside, making the reaction at both the base and the downtrend crucial. 

BTC Surpasses $91,000 Before Facing Selling Pressure

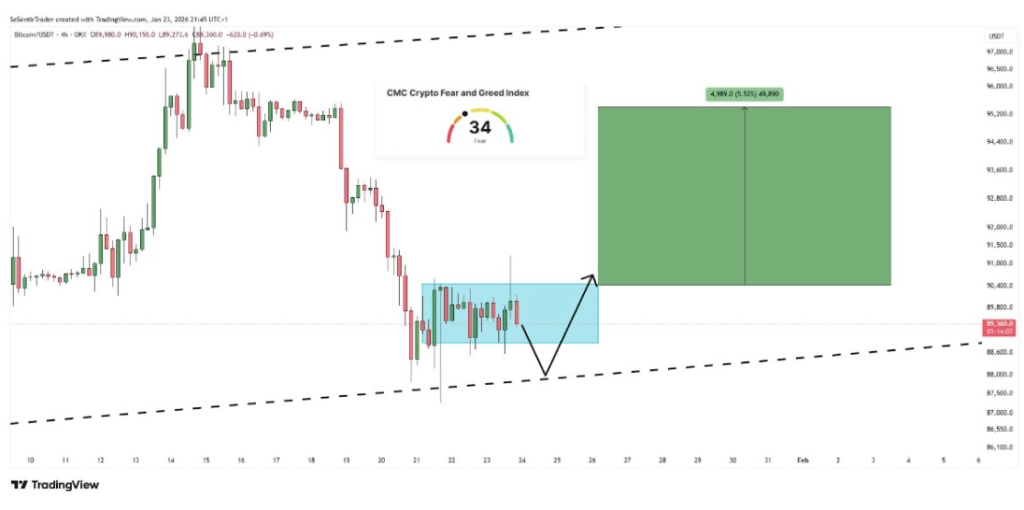
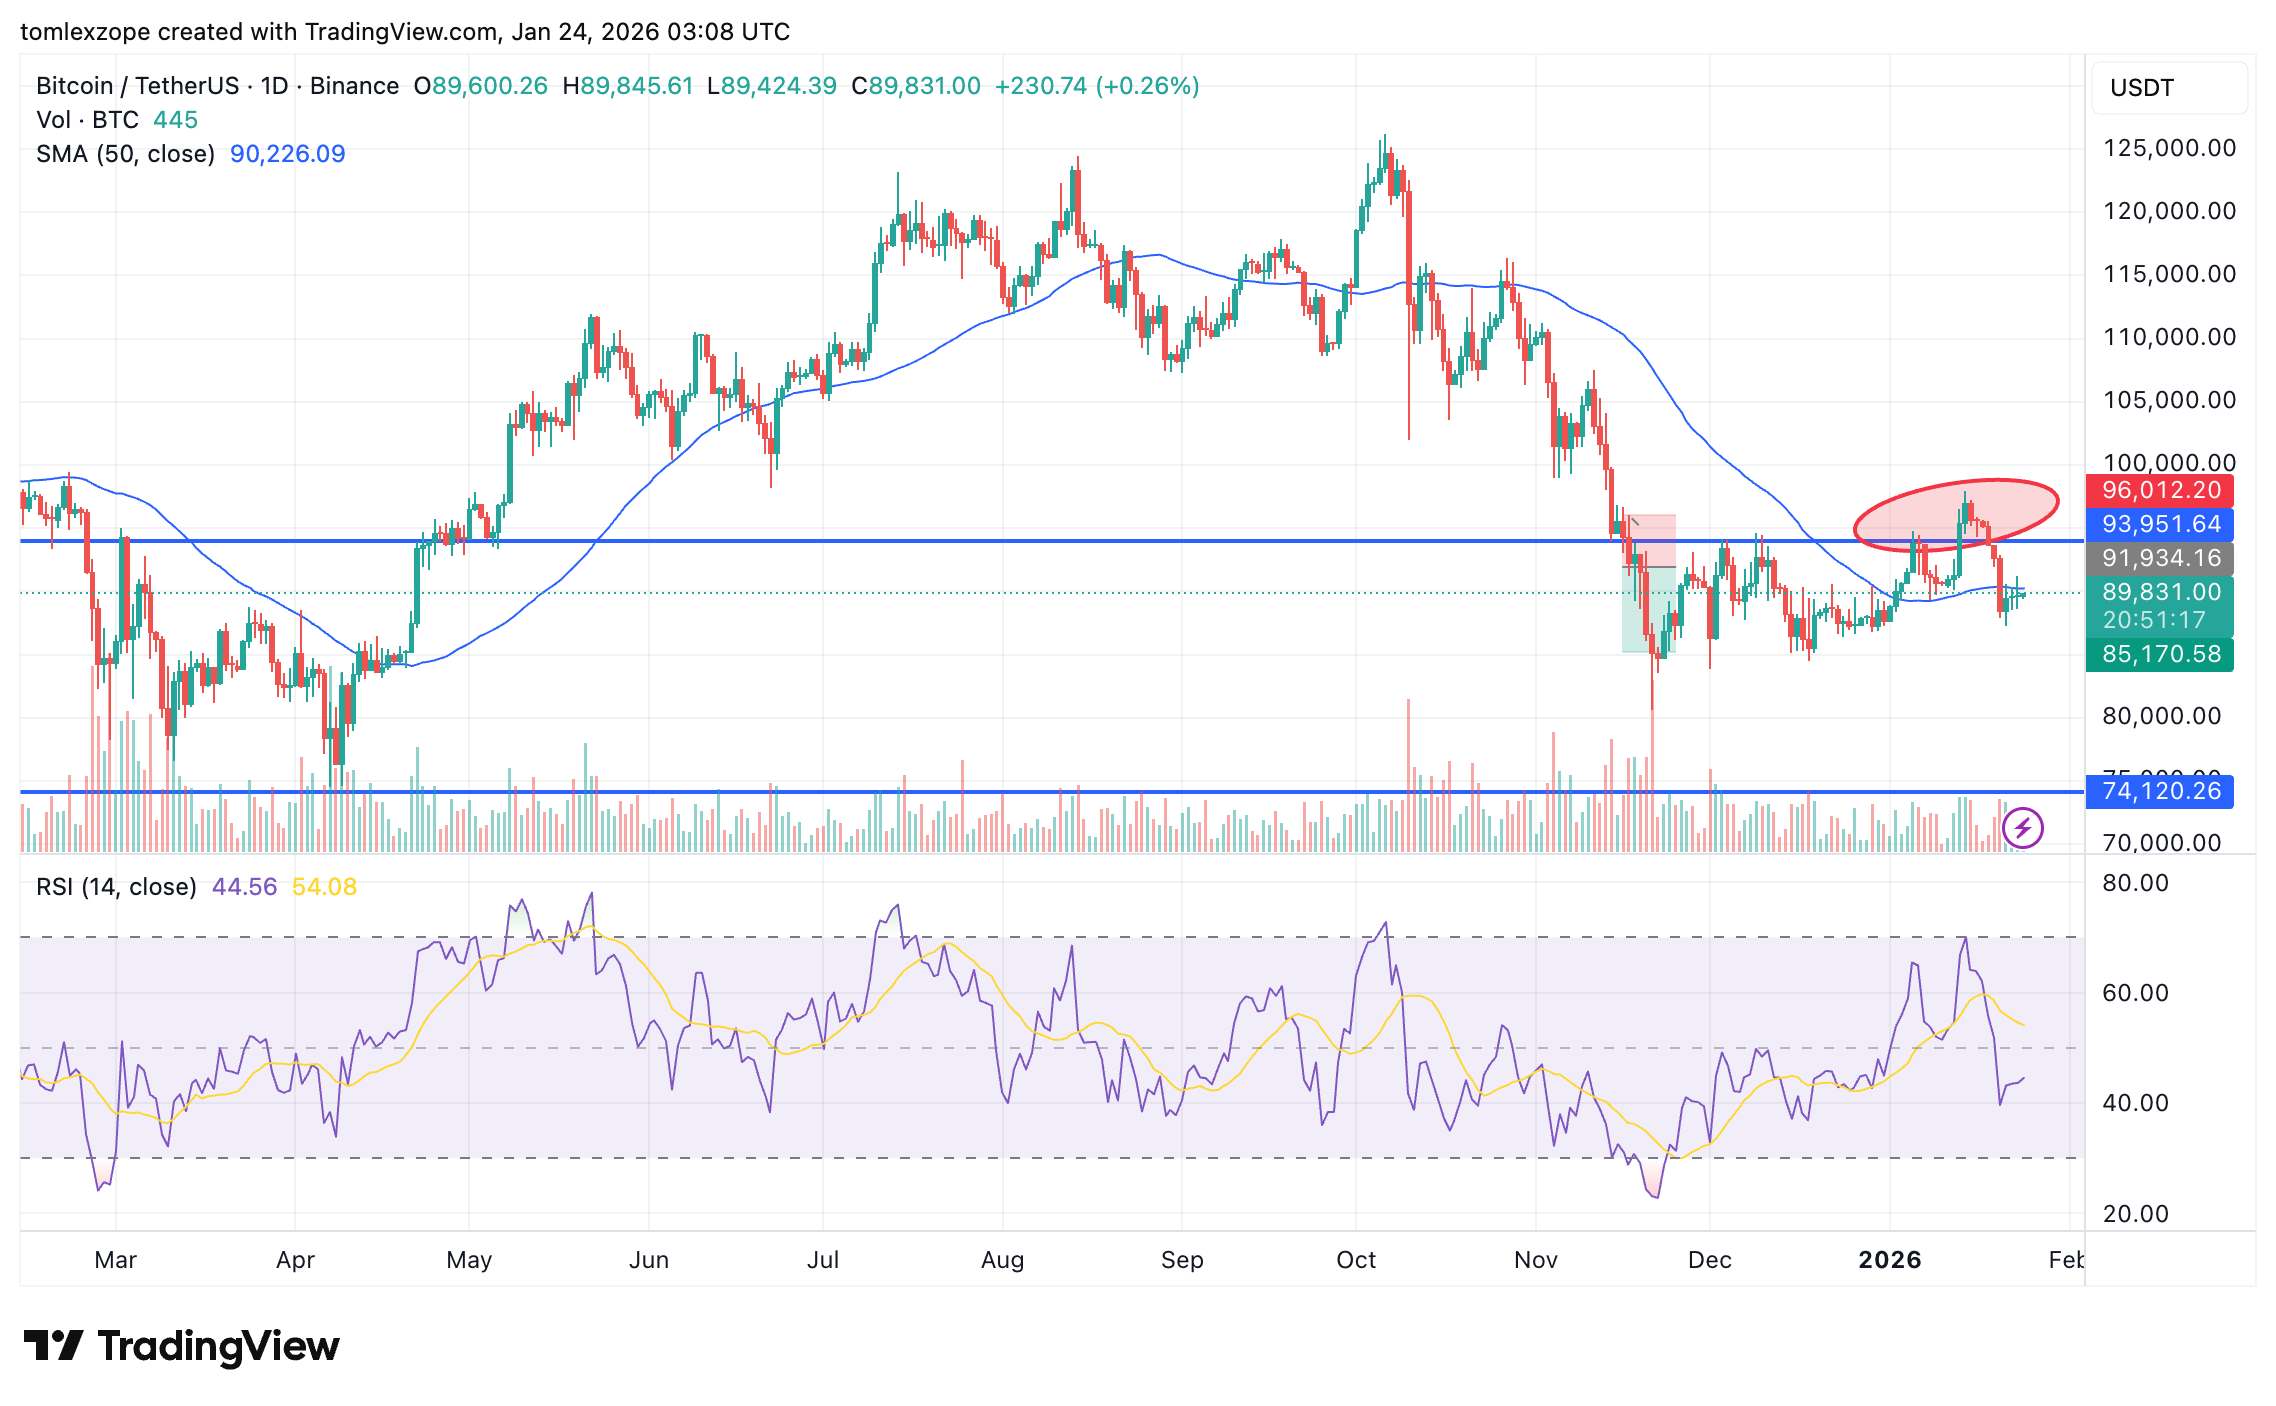
In a recent market update by Ted, it was noted that while Bitcoin broke above the $91,000 threshold yesterday, the rally met significant resistance. Sellers entered the market with substantial force at these local highs, effectively capping the momentum and preventing a sustained breakout.

As a result of this rejection, Bitcoin has retreated into the “no-trading zone.” Ted suggests that this period of sideways price action is likely to persist through the next couple of days, largely driven by the typical low-liquidity environment seen during the weekend.

Looking ahead, the outlook remains cautious. Ted emphasizes that any upward movements will likely be short-lived until BTC can decisively clear the $91,000 to $92,000 resistance zone. Meanwhile, such a move must be backed by strong spot demand to prove its validity.

Bitcoin

$7 Trillion Player Is Moving Into Bitcoin, Can This Trigger A Surge To $200,000?

Swiss banking giant UBS, with assets under management (AuM) of up to $7 trillion, is set to launch Bitcoin trading for some of its clients. This comes amid predictions that regulatory clarity and broader adoption could send the BTC price to as high as $200,000. 

UBS To Offer Bitcoin Trading To Some Wealth Clients

Bloomberg reported that UBS is planning to launch crypto trading for some of its wealth clients, starting with its private bank clients in Switzerland. The bank will reportedly begin by offering these clients the opportunity to invest in Bitcoin and Ethereum. At the same time, the crypto offering could further expand to clients in the Pacific-Asia region and the U.S.

The banking giant is currently in discussions with potential partners, and there is no clear timeline for when it could launch Bitcoin and Ethereum trading for clients. This move is said to be partly due to increased demand from wealth clients for crypto exposure. UBS also faces increased competition as other Wall Street giants are working to offer crypto trading. 

Morgan Stanley, in partnership with Zerohash, announced plans to launch crypto trading in the first half of this year, starting with Bitcoin, Ethereum, and Solana. The banking giant may soon also be able to offer its crypto products, as it has filed with the SEC to launch spot BTC, ETH, and SOL ETFs. 

Furthermore, JPMorgan, another of UBS’ competitors, is considering offering crypto trading to institutional clients, although this plan is still in the early stages. The bank already accepts Bitcoin and Ethereum as collateral from its clients. Last year, it also filed to offer BTC structured notes that will track the performance of the BlackRock Bitcoin ETF.

Can Bank’s Entry Trigger A BTC Rally To $200,000  

Kevin O’Leary predicted that Bitcoin could rally to between $150,000 and $200,000 this year, driven by the passage of the CLARITY Act. His prediction came just as White House Crypto Czar David Sacks said banks would fully enter crypto once the bill passes. As such, there is a possibility that BTC could reach this $200,000 psychological level in anticipation of the amount of new capital that could flow into BTC from these banks once the bill passes. 

BitMine’s Chairman, Tom Lee, also predicted during a CNBC interview that Bitcoin could reach between $200,000 and $250,000 this year, partly due to growing institutional adoption by Wall Street giants. Meanwhile, Binance founder Changpeng “CZ” Zhao said that a BTC rally to $200,000 is the “most obvious thing in the world” to him.

At the time of writing, the Bitcoin price is trading at around $89,600, up in the last 24 hours, according to data from CoinMarketCap.

Bitcoin

End Of This Reaccumulation Phase Could Trigger Most Aggressive XRP Rally Ever

XRP has spent most of the past few months trading with lower highs since July 2025, frustrating traders and compressing price action into an increasingly tight range. 

However, a technical breakdown shared by crypto analyst ChartNerd argued that what looks like stagnation may actually be the final preparation phase before a historic move. The price structure suggests something far bigger that sends XRP on its most aggressive rally in eight years, but the implications only become clear when the full setup is examined.

A 400-Day Rectangular Reaccumulation Still Holding Structure

According to technical analysis done by ChartNerd, XRP’s price action has been locked inside a rectangular reaccumulation zone for about 400 days, and this has led to the formation of what looks like a rectangular bull flag on a macro timeframe. The technical chart shows a strong impulsive move from July 2024 to December 2024 acting as the flagpole, right when XRP peaked at the $3.4 price zone back then.

This impulsive flagpole has been followed by a long period of sideways trading where XRP’s price has repeatedly respected a clearly defined support around $1.8 and resistance boundaries around $3.6. This type of structure is associated with reaccumulation within the support and resistance zones, especially when it is playing out after a sharp expansion move and holding for this length of time.

Each dip into reaccumulation support has been absorbed, preventing any sustained breakdown and keeping the broader pattern intact. ChartNerd noted that the rectangular flag will be valid as long as this support level is defended, and this will activate the expansion journey.

XRP Price Chart. Source: @ChartNerdTA on X

Macro Breakout Projection Puts XRP Price Target At $23

According to ChartNerd, bearish participants are increasingly pressured by the fact that this fractal is still holding despite repeated attempts to invalidate it. The longer XRP’s price action is trapped inside the rectangle without breaking down, the more likely it becomes that the eventual resolution favors the dominant trend that preceded the consolidation. In this case, that trend was bullish, which strengthens the case for an upside breakout once resistance is cleared.

If the rectangular bull flag resolves to the upside as projected, the chart outlines a breakout trajectory that would carry XRP into double-digit territory, with a long-term target region near $23. This price target projection is derived from the height of the flagpole extended from the top of the reaccumulation range.

ChartNerd labelled this possible move as one of the most aggressive rallies XRP could see in seven to eight years. At the time of writing, XRP is trading around $1.92, meaning a move toward the $23 region would represent a gain of over 1,000% from current levels, which is a type of percentage expansion XRP has played out well in the past.

Featured image from Unsplash, chart from TradingView

XRP Ledger Enters The AI Era As Ripple Merges Two Mega Trends

The XRP Ledger has entered a new phase of innovation as Ripple integrates to bring together two of the most powerful technology trends shaping the global economy. Long known for its speed, low transaction costs, and enterprise-grade reliability, the Ledger is now expanding beyond payments to data-driven and automated financial applications. By merging AI with decentralized settlement, Ripple is positioning the Ledger to support smarter workflows and more efficient liquidity management.

How Ripple Is Embedding Intelligence Into On-Chain Systems

An analyst known as SMQKE on X has shared a case study of an AI implementation in the cross-border payment, in which Ripple has successfully combined blockchain technology and artificial intelligence to enhance the efficiency, speed, and cost-effectiveness of global transactions.  As a leading provider of real-time cross-border payment solutions, Ripple leverages the XRP Ledger, a decentralized blockchain that enables real-time cross-border settlement. 

Related Reading: Surge In XRP Transactions: 1.45 Million Daily Users Could Signal Price Rally Ahead, Says Expert

What sets this integration apart is the use of AI to optimize transaction flows and routing decisions in real time. Ripple AI-powered systems continuously process large volumes of payment data in real time, allowing financial institutions to make dynamic decisions on the most effective payment paths. 

BlackRock is now using Ripple’s RLUSD as collateral, which is extremely bullish for XRP. JackTheRippler revealed that the altcoin is being positioned as the future infrastructure, which is being built with the potential to hit over $10,000 per coin. With the REAL token launching on January 26th, trillions in global capital could flood into the XRP Ledger. According to JackTheRippler, some projections suggest up to $800 billion could flow into the REAL token on XRP Ledger, potentially sparking a powerful supply shock.

Why The Comeback Feels Different This Time

The rise of the phoenix XRP is here. Crypto analyst Xfinancebull highlighted that Caroline Pham isn’t just another name in crypto. Pham played a role in pushing utility regulation into the Commodity Futures Trading Commission (CFTC), helping shift policy toward real-world use cases. Currently, she is at MoonPlay and posting about the phoenix on X.

Related Reading: How Donald Trump’s Latest Crypto Move Will Boost Demand For XRP

Years ago, Brad Garlinghouse drew that same phoenix, and it became one of the biggest pieces of XRP lore. While the market chased narratives, Ripple has been building institutional-grade crypto products for years. Meanwhile, the token, RLUSD, and the XRP Ledger are now live operating, and recognized among the most compliant blockchain assets in the crypto world.

This is the same asset that survived the SEC’s biggest regulatory battles in crypto history, and is now on the other side with legal clarity, growing integration, and increasing relevance to government infrastructure in its favor. Xfinancebull concluded that Caroline has helped clear the regulatory path, Brad and Ripple built what actually runs on that path, and they have been aligning all along, which is how the real adoption happens.

XRP

Chainlink On Standby: A Big Move Is Loading, But Bitcoin Decides

Chainlink remains on standby as daily candles continue to show indecision, keeping traders on edge. The next significant move for LINK largely depends on Bitcoin’s momentum, with bulls and bears waiting for a clear signal before committing. Until then, the market is in a holding pattern, building tension for the breakout or breakdown.

Traders Await Clear Direction For Chainlink

According to an update from CryptoWzrd, the daily candles for both Chainlink and LINKBTC continue to print indecisive price action, reflecting a lack of strong conviction from either side of the market. Despite recent movements, neither buyers nor sellers have been able to establish a clear directional edge, keeping the broader outlook neutral for now.

To gain a reliable directional bias and unlock higher-probability trade opportunities, healthier and more decisive daily candles are required, as price could continue to chop within its current range. Bitcoin is expected to remain the primary driver of the next significant move. In particular, LINKBTC needs to print another bullish daily candle in the coming week to maintain any constructive momentum. 

Chainlink

Failure to do so could shift the balance back in favor of the bears and increase downside pressure. A continuation of weakness would likely result in a break of the daily lower-high trendline, followed by a loss of the critical $12 support level. 

On the bullish side, if Bitcoin provides the necessary support, LINK could attempt a recovery rally toward the $16 resistance zone. Until a clearer higher-timeframe structure emerges, the trading focus remains tactical. Attention will be placed on the lower-timeframe charts, particularly over the weekend, to capitalize on quick, short-term opportunities while avoiding unnecessary exposure to indecisive daily conditions.

Intraday Chart Shows Tight Range, Market Lacks Clear Direction

The analyst concluded that the intraday chart remains choppy, with price action tightly compressed within a narrow range. Such conditions point to persistent market indecision, in which neither bulls nor bears have shown sufficient conviction to drive a sustained move in either direction. As a result, trade setups lack clarity and carry elevated risk.

From a tactical perspective, a retest of the $13 resistance level, followed by clear signs of rejection or fading momentum, could open the door to a short opportunity. However, if price holds above $13 with strong acceptance, that would place the market in more constructive territory and tilt the bias back in favor of the bulls.

Until one of these scenarios plays out decisively, the analyst emphasized the importance of waiting. A more mature and well-defined chart structure is needed before engaging in the next trade, ensuring better confirmation, cleaner entries, and improved risk-to-reward conditions.

Chainlink

XRP Dev Shares How To Retire In A Few Years

A recent statement from an XRP Ledger (XRPL) developer suggests that XRP could be the key to an early retirement shortcut. Unlike steady paychecks or slow-growing investments in traditional assets, cryptocurrencies have the ability to create generational wealth rapidly, due to their penchant for sudden and explosive price moves. Among the thousands of digital assets on the market, the developer highlighted the token as his primary choice for investors seeking substantial returns, even sharing strategies for how the coin can help them retire in a few years. 

XRP Emerges As Shortcut To Early Retirement

A DropCoin XRPL developer, identified as ‘Bird’ on X, announced on Thursday, January 22, that buying and holding XRP at current prices could help investors retire within a few years. The bold claim quickly caught the attention of many in the crypto community, with some asking the developers to elaborate on the strategies involved and the expected timeline for achieving such wealth. 

Related Reading: XRP Price Obliteration Is Not A Matter Of If, New All-Time Highs Are Coming

Not stopping there, Bird claimed that investing in the token could eliminate the need for a job, suggesting that long-term investors may eventually rely on the potential profits from their holdings as a primary source of income. His statements were in response to a post by Watcher.Guru, which the developer directly referenced to support his optimistic long-term outlook. 

In that post, Watcher Guru quoted a statement reportedly made by Binance’s founder ChangPeng Zhao, who also agreed that holding crypto assets over time could make jobs unnecessary and allow investors to retire sooner than planned. The Ledger developer shared a screenshot of Zhao making similar remarks about Artificial Intelligence, suggesting that the Binance founder views both crypto and AI as powerful tools for achieving long-term financial freedom

A crypto community member who responded to Bird’s post questioned how long an investor has to hold XRP before retiring early. The developer answered humorously that it could be held indefinitely, adding that some investors could reach early retirement this year, while others may need a few more years. He emphasized that the timeline ultimately depends on how many tokens an investor holds.  

How High The Altcoin Could Rise To Enable Early Retirement

Addressing questions from the crypto community members, Bird shared his outlook on how high he believes XRP’s price could rise, helping investors achieve early retirement. He predicted that within the next few years, the cryptocurrency could rise to $100 and beyond—a significant jump from its current market price of around $1.90. 

Related Reading: How Donald Trump’s Latest Crypto Move Will Boost Demand For XRP

The Ledger developer suggested that reaching $100 could be a gradual process for the altcoin, forecasting an initial rally to $10 in the First Quarter (Q1) of 2026. Notably, Bird’s remarks reflect a classic buy-the-dip and hold strategy, where investors accumulate during downtrends and patiently wait for the price to rally explosively before taking profits.

XRP

XRP To $11, And Then $70: The Next Impulse Wave To Watch Out For

Crypto analyst CryptoBull has highlighted targets that XRP could reach as it eyes double digits. The analyst is confident the altcoin could reach these targets, noting that current price action is mirroring the previous bull run. 

XRP Eyes Rally To $11 And Then $70

In an X post, Crypto Bull stated that the next impulse will take XRP to $11 and that the last wave will take the altcoin to $70. This came as he noted that the price pattern is mirroring the previous bull run, with the only difference being time, which he claimed makes sense, as the altcoin needs longer accumulation to reach higher prices. 

The analyst also indicated that it could take a year of accumulation for XRP to reach the $11 price target, meaning the last wave to $70 could take much longer. This prediction comes despite the current decline in the crypto market, with XRP trading below the psychological $2 price level.  

XRP

Despite the current bearish sentiment, crypto analyst CW has also declared that the XRP rally is about to begin and that the road to $21.5 is just the beginning. He noted that this is the Phase 4 peak while the first goal is for the altcoin to break its current all-time high (ATH)

His accompanying chart showed that XRP could reach this $21 target by year-end. Meanwhile, there is the possibility of the altcoin rallying above $100 in the next Phase 1, which could happen next year. Crypto Pundit X Finance Bull recently highlighted the CLARITY Act and Trump’s tariffs as factors that could boost XRP’s demand and lead to higher prices for the altcoin. 

He expects the CLARITY Act to boost XRP’s demand, especially with Trump’s Crypto Czar predicting that more banks will enter into crypto once the bill passes. X Finance Bull predicts that XRP will be the token of choice for these banks based on his belief that Ripple will provide the rails to onboard them. 

XRP Breaking Out Of Multi-Year Triangle

Crypto analyst XForce revealed in an X post that XRP is breaking out of the largest 6+ year triangle in history, yet people are calling it a fakeout. He added that he is not a permabull or permanbear on the altcoin but that he follows trends and plays macro breakout patterns. His accompanying chart indicated that XRP was on the verge of a move to the upside, with a potential rally above $11.50. 

On the lower timeframe, crypto analyst Chart Nerd stated that XRP is currently breaking out of a two-week falling wedge structure. He noted that this is a bullish reversal pattern that could send the altcoin back to $2.40 in the short term, as this is where the wedge formed. He highlighted a key resistance between $2.13 and $2.20, which the altcoin will need to break above to confirm a reversal. 

At the time of writing, the XRP price is trading at around $1.92, up in the last 24 hours, according to data from CoinMarketCap.

XRP

Bitcoin Pattern From 2022 That Led To Crash To $20,000 Reappears

Bitcoin (BTC) is mirroring the same setup from its 2022 bull cycle, which led to a massive price crash to $20,000. According to market expert Crypto Bullet, this recurring structure could signal another major correction for BTC ahead. However, this time the leading cryptocurrency could give up almost a quarter of its current value. 

2022 Bitcoin Chart Pattern Signals Over 20% Crash

In his technical analysis released on X, Crypto Bullet revealed that Bitcoin is currently repeating a 2022 structure that could lead to a more than 20% decline in its value. To support his bearish outlook, the analyst presented a parallel chart comparing Bitcoin’s price action from 2023-2022 and 2025-2026, highlighting similar technical patterns, price behavior, and Moving Averages (MA). 

During the 2022 cycle, Bitcoin experienced a similar pattern, beginning with a test of the 100-day Moving Average (MA100), highlighted as the blue trendline on the chart. After facing rejection at that level, the price pulled back to a nearby support zone inside a rising channel. From there, BTC staged a sharp rally, surging to fresh highs around $48,500, where it aligned with the 200-day Moving Average (MA200), marked in orange. 

However, the recovery proved short-lived. Bitcoin soon reversed course and failed to reclaim the MA200 as support. Once the cryptocurrency’s price structure was lost, downside momentum accelerated, pushing the price into a much deeper correction toward the $20,000 level. 

According to Crypto Bullet, Bitcoin is repeating this exact pattern in 2026. It has already retested the MA100, gotten rejected, and moved lower into a support zone within a similar ascending channel. The chart also showed that in both cycles, BTC reached a “market cycle top,” first around December 2023 and then again in November 2025, before breaking down and entering a consolidation phase

Given how closely Bitcoin is mirroring its 2022 setup, Crypto Bullet has forecast another dramatic price crash, predicting a more than 23.5% drop from its current price near $89,500 to $68,450. Before this decline happens, the analyst expects BTC to experience a short-term recovery, potentially climbing back above the $100,000 psychological level to reach $102,000. 

Bitcoin Could Still Rally To $92,000

Crypto analyst Tyrex has stated that Bitcoin has been consolidating for the past 48 hours, with price holding above $89,000 for most of that period. Despite the muted price action, he believes that BTC could soon rally to $92,000. The analyst also noted that the broader market is in a state of fear, with many traders anticipating further declines in Bitcoin.

However, the analyst cautions that this expected drop may be a trap. He points out that an ascending channel is forming on Bitcoin’s chart, prompting him to adopt a more bullish outlook despite the prevailing bearish sentiment and sideways price movement.  

Featured image from Unsplash, chart from TradingView

Bitcoin Metric Suggests Miners Are In Recovery Mode — Price To Follow?

Over the past week, the price of Bitcoin faced a significant setback in its goal of reclaiming the six-figure threshold. The flagship cryptocurrency has been hovering around the $90,000 mark, as the market can’t seem to make a decision concerning the next price direction.

As Bitcoin faced a mild sell-off, which, in turn, drove its price to fall from its recent highs, specific market participants were under severe pressure, including the miners. Interestingly, a recent on-chain evaluation has raised the possibility that miners’ stress might be ending soon.

Miner Financial Health Flashes Classic Reversal Sign

In a January 23 post on the social media platform X, market expert Axel Adler Jr highlighted that the Bitcoin miners might have started their post-capitulation recovery journey. The relevant indicator here is the Miner Financial Health Index (7D-SMA). 

For context, this metric tracks the balance between miner revenue and miner selling pressure. Hence, it reflects whether miners are net BTC distributors or accumulators. Simply put, the metric shows if Bitcoin miners are under pressure, stable, or even profitable. 

Capitulation events often reflect on the Miner Health Index as a negative value, as the amount of BTC spent surpasses the amount of BTC earned. On the other hand, miners are typically said to be in the recovery phase when the balance between revenue and spending starts to lean away from the negative.

Image

From the chart shared by the analyst, it is apparent that the index has taken on an uptrend, targeting neutral levels on the metric’s charts. History shows that the index does not merely target the neutral mark when it trends upward.

Hence, if history were to repeat itself, the Bitcoin miners could be in for a rewarding ride, having survived the most recent capitulation event. Interestingly, the price of Bitcoin appears to have a directly proportional relationship with the Miner Health Index.

Bitcoin Price Gathers Momentum As Market Condition Shifts

In a separate post on X, Bitcoin Vector highlighted that Bitcoin might be garnering strength for a significant move in the near term. According to the analytics platform, this development coincides with the market exiting what was previously a “high-risk environment.”

Bitcoin Vector explained that this exit from a risky market environment was last seen in April 2025, just before the bull run resumed. The on-chain analytics firm explained that we could be witnessing the late stages of a classic momentum bottoming pattern, which historically leads to large rallies. 

Essentially, there has to be one last push lower in price and, at the same time, a momentum boost to the upside, for the bullish signal to be completely formed. As of this writing, Bitcoin is valued at around $89,830 with no significant movement in the past 24 hours.

Bitcoin

Bitcoin Price Still Has Room To Fall Below $60K — Crypto CEO

The Bitcoin price had a relatively rough trading period over the past week, as it hovered around the psychological $90,000 mark. The flagship cryptocurrency, which looked set for a return to six-figure valuation barely over a week ago, now seems to have lost all its bullish momentum.

Broadly speaking, these recent struggles put to rest questions around the “relief rallies” to the upside, and correlate more with the current bear market structure. However, the latest on-chain evaluation shows that the Bitcoin price woes could worsen from here on out.

Expert Explains Why $60,000 Is Possible For BTC Price

In a recent post on the X platform, Alphractal CEO and founder Joao Wedson said that the Bitcoin price could still have room to fall below the $60,000 level. This not-so-optimistic prediction is based on the number of days Bitcoin has traded at prices higher than today.

According to Wedson, there have been 355 days when the Bitcoin price has traded at levels higher than today. This figure was derived from the “Days Spent at a Profit” metric, which tracks the number of days in Bitcoin’s history where the market price was higher than the current price.

This indicator measures how much price action — in the past — has occurred above the current price level. From a historical standpoint, an increase in the number of “Days Spent at a Profit” tends to occur during bear cycles or extended periods of sideways movement, implying that different investor groups are holding BTC at a price higher than their cost bases.

Bitcoin price

As Wedson highlighted, the “Days Spent at a Profit” metric reached around 775 days as the Bitcoin price approached a bottom. Going by this historical context, the current level of this indicator (355 days) suggests that the flagship cryptocurrency is still a distance away from extreme levels often associated with bearish market bottoms.

Ultimately, this deduction means that the price of Bitcoin could still be at risk of an extended decline over the next 300 days. According to the Alphractal, this extended period of price decline could see BTC revisit $60,000, potentially triggering significant liquidations among retail investors and institutional players who entered the market post-ETF.

Bitcoin Price At A Glance

As of this writing, the price of BTC stands at around $89,900, reflecting no significant change in the past 24 hours. However, the market leader is currently down by over 5% on the weekly timeframe, while nearly 30% adrift its all-time high of $126,080.

Bitcoin price

Binance Founder Has ‘Strong Feelings’ For A Bitcoin Supercycle In 2026

The price of Bitcoin registered a hot start to the new year, making a run to reclaim the highly coveted $100,000 level in the early days of January. While the premier cryptocurrency has cooled off over the past few days, optimism has never been this high in the market over the last couple of months. Adding to this optimism is Binance’s co-founder and former CEO, Changpeng ‘CZ’ Zhao, who predicted an extremely positive outlook for Bitcoin in 2026.

BTC Could Abandon 4-Year Cycle Theory In 2026: CZ

In a CNBC interview at the World Economic Forum, CZ said that he has “strong feelings” that the Bitcoin price will enter a supercycle in 2026. This prediction came as a response to the interviewer’s question about Zhao’s Bitcoin price outlook.

In an economic context, a supercycle refers to an extended period characterized by the explosive growth of an asset or sector. Unlike a typical short-term rally triggered by hype and speculation, supercycles signal a significant shift underpinned by strong fundamentals over an extended period.

Zhao explained to the interviewer that the price of Bitcoin moves in a four-year cyclical pattern, spanning periods of all-time highs and cycle lows. However, the former Binance CEO agreed with the ongoing narrative that believes that the premier cryptocurrency will break the four-year cycle theory this year.

When asked about his strategy and current portfolio, CZ mentioned that he doesn’t trade the crypto market but rather accumulates coins with long-term promise. Specifically, the prominent crypto leader said that he keeps accumulating Bitcoin and BNB, the Binance ecosystem’s native token.

In his interview, CZ also talked about life after his four-month stint in jail, mentioning his work with YZi Labs, Giggle Academy, and as a crypto advisor to various governments. Zhao, who received a pardon from United States President Donald Trump in October 2025, clarified the rumors around receiving clemency for violating the US Bank Secrecy Act.

It is worth noting that CZ is not the first personality in the crypto space to speak about the Bitcoin price abandoning the halving-associated four-year cycle for a supercycle. Fidelity Labs managing partner, Parth Gargava, had echoed a similar sentiment about the BTC market earlier in the new year.

Gargava highlighted three drivers as the factors behind the transition from the typical four-year cycle to a supercycle. “Steady buy-in by institutions focused on ETFs, policy, and market maturation and changing correlations,” the Fidelity executive listed as the catalysts behind the shifting market landscape.

Bitcoin Price At A Glance

As of this writing, the price of BTC stands at around $89,460, reflecting no significant movement in the past day.

Bitcoin

Binance Founder CZ Addresses Trump‑Related Controversy In Latest Statement

Binance founder and former CEO Changpeng Zhao (CZ) has pushed back against growing scrutiny surrounding his relationship with President Donald Trump, saying his ties to the president and his family have been widely misunderstood following Trump’s decision to grant him a pardon last year.

CZ Rejects Allegations Of Binance’s Political Links

Attention on Zhao intensified after President Trump issued a pardon in October 2025, a move that prompted renewed criticism from Democratic lawmakers and fueled questions about Binance’s alleged political and business connections. 

Addressing the controversy in a recent interview with CNBC, Zhao said claims of a business relationship with the Trump family are inaccurate. “There’s no business relationship whatsoever,” Zhao stated. The former executive added that the narrative surrounding the pardon and Binance’s alleged ties to Trump had been “misconstrued.”

Much of the scrutiny centers on Binance’s connection to the Trump-linked decentralized finance (DeFi) venture World Liberty Financial (WLFI). 

That connection traces back to a $2 billion investment made in March 2025 by MGX, a state‑owned firm based in Abu Dhabi, United Arab Emirates. MGX invested in Binance using USD1, a stablecoin created by World Liberty Financial.

Zhao emphasized that the payment method was chosen by the investor, not Binance. “MGX is the investor. They choose USD1,” he said. “My request to them was they pay us in crypto. I don’t want to deal with banks, really.” 

According to Zhao, the use of the venture’s USD1 stablecoin has been wrongly interpreted as evidence of a deeper relationship. “Many people misconstrued that,” he added.

WLFI Push Back On Political Influence Claims

In a statement, WLFI spokesperson David Wachsman said the company played no role in the pardon process. “As we have stated many times, WLFI is not a political organization and had zero role in the pardon process,” Wachsman said. “To imply otherwise is dangerous and false.”

Trump himself downplayed any personal connection in a November interview with CBS’s 60 Minutes. “I have no idea who he is,” the president said of Zhao. Trump added that he had been told Zhao was “a victim, just like I was and just like many other people, of a vicious, horrible group of people in the Biden administration.”

Additional attention has focused on Binance’s lobbying efforts in Washington. NBC News reported during the week of the pardon that Binance had hired Checkmate Government Relations, a lobbying firm led by Charles McDowell, who is a friend of Donald Trump Jr. 

According to disclosures, the firm was paid $450,000 to lobby the White House and the Treasury Department on matters including “executive relief” and digital asset‑related financial services policy.

Zhao denied that any lobbying effort was connected to his pardon. “There is a lot of media saying that there is some deal in place to get me the pardon,” he told CNBC in Davos. “As far as I know, that does not exist at all.”

Binance’s former CEO also said he has never spoken directly with President Trump. “The closest that I got to him was today when he was doing the Board of Peace session,” Zhao said. “I was in the audience, about 30 to 40 feet away from him.”

Binance

At the time of writing, Binance Coin (BNB) was trading at $893, having recorded a 4% drop over the previous week. However, it is one of the few cryptocurrencies to have retained gains year-to-date, with an increase of 30% in that time. 

Featured image from OpenArt, chart from TradingView.com 

Monero, Zcash, And Dash Prohibited In India Amid Money-Laundering Crackdown

India’s Financial Intelligence Unit (FIU‑IND) has launched a fresh anti‑money‑laundering crackdown aimed at privacy‑focused cryptocurrencies. The move targets Monero (XMR), Zcash (ZEC), and Dash (DASH), which together represent the largest and most widely used privacy coins globally.

India Tightens Crypto Oversight

Details of the action were shared on Friday by market analyst MartyParty on social media platform X (previously Twitter), who notes that FIU‑IND has issued a directive to crypto exchanges registered in India, instructing them to immediately suspend deposits, withdrawals, and trading activity for Monero, Zcash, and Dash. 

At the heart of the regulator’s concerns is the technology underpinning these assets. Privacy coins rely on advanced cryptographic techniques designed to obscure transaction details, wallet balances, and user identities. 

Monero uses ring signatures to hide the sender and receiver, Zcash allows shielded transactions that conceal transaction data, and Dash offers optional privacy features. 

While these tools are valued by users seeking confidentiality, regulators argue they make it difficult for exchanges to meet know‑your‑customer (KYC) and transaction‑monitoring obligations. The regulator views these features as posing elevated risks related to money laundering, terrorist financing, and sanctions evasion. 

The latest directive applies to all cryptocurrency exchanges registed in the country, which currently includes crypto platforms operating in compliance with Indian regulations. They have been instructed to stop supporting the assets, including delisting, blocking all deposits and withdrawals, and disabling any associated trading pairs.

Monero, Zcash, And Dash Show Mixed Market Reaction

The latest action builds on a broader regulatory push by Indian authorities. In October 2025, FIU‑IND ordered internet service providers to block access to 25 offshore crypto exchanges that failed to register. 

By contrast, only a handful of exchanges currently remain fully registered and compliant in the country. Binance, Mudrex, Coinbase, CoinSwitch (CoinSwitch Kuber), and ZebPay continue to operate legally in India.

Despite the regulatory pressure, market prices for the targeted privacy coins showed short‑term resilience. Over the past 24 hours, all three assets posted gains after recovering from sharp losses earlier in the week. 

Monero was trading at $524 at the time of writing, up 3.5% on the day. Zcash also rebounded modestly, rising 2.2% to trade at $372. Dash recorded the strongest daily performance, jumping 11.6% during the same period.

However, the broader trend remains negative. According to CoinGecko data, Monero, Zcash, and Dash are still down sharply on a weekly basis, with losses of approximately 21%, 8%, and 20% respectively over the past seven days. 

Monero

Featured image from DALL-E, chart from TradingView.com

XRP Trend Still Coherent On Binance As CVD Correlation Remains Supportive

XRP is attempting to stabilize above the $1.90 level after slipping below the $2.00 mark, a breakdown that has fueled fresh uncertainty across the market. With momentum weakening and volatility picking up, traders are now watching whether this pullback becomes a temporary reset or the start of a deeper downside move.

Analysts remain divided on the outlook, as some argue XRP is entering a bearish continuation phase, while others believe the market is simply clearing leverage before a rebound. Either way, the coming sessions are shaping up to be decisive for short-term direction.

A report from Arab Chain adds an important layer of context by focusing on Binance flow dynamics. According to the report, data from Binance’s XRP platform shows the 30-day correlation between price and CVD (Cumulative Volume Delta) sitting near 0.61, which signals a moderate to strong positive relationship between price action and net volume flows. In simple terms, XRP’s recent moves have not been disconnected from trading activity.

Instead, price changes appear to be relatively supported by actual volume behavior rather than isolated technical noise.

This matters because when price and CVD remain positively linked, the market is often viewed as structurally aligned, suggesting trend confirmation rather than a random bounce. For XRP, this correlation could become a key signal as bulls fight to defend $1.90.

XRP’s CVD Confirmation Score Shows Base-Building, Not Capitulation

Arab Chain explains that while the 30-day price–CVD correlation remains positive, the latest CVD reading is still relatively negative, signaling that accumulated selling pressure has not yet flipped into net buying dominance. This is a critical nuance.

Rather than acting like a simple “buy” or “sell” trigger, the metric functions as a confirmation score, meaning it evaluates whether price action is internally supported by volume flows instead of offering a clean entry signal. In other words, it helps traders judge the quality of the trend and whether market behavior is coherent beneath the surface.

Binance XRP CVD Confirmation Score | Source: CryptoQuant

The real value of this framework is its ability to detect divergence early. If XRP’s price attempts to recover while correlation deteriorates, or if CVD stays negative during upside moves, it would suggest hidden weakness and a higher probability that rallies are being sold into. That kind of imbalance often appears before sharp reversals, especially in uncertain conditions where liquidity is thin and momentum-driven positioning dominates.

In the current context, however, the market is sending a more balanced message. The persistence of a positive correlation despite ongoing price weakness implies that XRP may be entering a base-building phase, where selling pressure is being absorbed gradually rather than accelerating into aggressive distribution.

Trend Weakness Keeps Bulls On Defense

XRP is trading near $1.91 on the 3-day chart after failing to reclaim the $2.00 level, keeping the market in a fragile short-term position. The structure shows that XRP topped above $3.50 during the mid-2025 rally, but the move has since unraveled into a steady downtrend defined by lower highs and repeated breakdowns. After the sharp leg lower in October, the price attempted to stabilize, but the recovery lacked follow-through and has gradually faded into a tighter compression zone.

XRP testing critical demand level | Source: XRPUSDT chart on TradingView

From a trend perspective, XRP remains capped below its major moving averages. The blue average is sloping downward and sits above price near the mid-$2 range, reinforcing a bearish bias and limiting upside attempts. The green average is also flattening and rolling over, confirming that momentum has weakened across multiple timeframes. Meanwhile, XRP is now leaning directly on the red long-term average, which is rising toward the current price and acting as a key support reference around the $1.85–$1.90 region.

Price action over the last several candles suggests a base-building process, but it is still premature to call a reversal. Bulls need to defend this support zone and reclaim $2.00–$2.10 to shift momentum back in their favor. If XRP loses the rising long-term average, downside risk increases toward $1.70 and potentially the mid-$1.50 area, where demand previously stepped in.

Featured image from ChatGPT, chart from TradingView.com 

Expert Forecasts $5 XRP Price As Exchange Balances Plummet By 57%

XRP has given back all of its early‑year gains, sliding toward the $1.90. Despite the pullback, several on‑chain and market indicators are pointing to a possible breakout from current levels, driven largely by a sharp decline in XRP held on exchanges. 

XRP Exchange Balances Slide To 1.5B

Market analyst Sam Daodu notes that over the past months, a substantial portion of XRP has steadily moved off centralized trading platforms and into long‑term storage and institutional custody. 

On‑chain figures indicate that XRP exchange balances dropped from roughly 4 billion tokens in early 2025 to about 1.5 billion by late December. This 57% decline represents the steepest annual reduction in XRP exchange supply on record.

Data from CryptoQuant reinforces this trend, showing shrinking XRP reserves on major trading platforms such as Binance, where balances continued to fall into early 2026. At the same time, wallet accumulation has increased, particularly among institutional custody accounts. 

Daodu argues that with fewer tokens available on exchanges, buying pressure that previously moved XRP only marginally can now drive gains of 10% to 15% within days. 

When combined with approximately $1.37 billion in XRP exchange-traded fund (ETF) inflows recorded since November 2025, Daodu believes the conditions favor a potential breakout toward the $4 to $5 range, rather than another rally that stalls below $3.

Bullish, Base, And Bearish Scenarios

Looking ahead, Daodu outlines three broad price paths for XRP, each tied to how exchange balances and ETF inflows evolve. In a bullish scenario, the altcoin could move into the $4 to $5 range if monthly ETF inflows average $300-$500 million and exchange balances fall below 1.5 billion tokens. 

A more neutral outcome would see XRP trading between $2.50 and $3.50. This scenario assumes ETF inflows slow to roughly $50 million to $70 million per week and exchange balances continue to decline at a steadier pace. 

The bearish case hinges on the possibility that the supply contraction thesis proves overstated. If rapid transfers refill exchange order books, escrow releases increase selling pressure, or ETF demand slows due to tighter macroeconomic conditions, XRP could lose support. 

In that scenario, prices may fall below $2.00 and revisit the $1.60 level during periods of risk aversion. Prolonged uncertainty could see XRP trading between $1.50 and $2.00 for much of 2026, according to the analyst. 

XRP

At the time of writing, the altcoin was trading at $1.94. This represented losses of 4% and 8% over seven and fourteen-day periods, respectively. This positions the fifth-largest cryptocurrency in terms of market cap 46% below the current all-time high of $3.64 reached back in July of last year.

Featured image from DALL-E, chart from TradingView.com 

Can Bitcoin Revisit $97,600? Glassnode Says Watch This

Bitcoin’s push to $97,600 last week drew a burst of bullish options activity, but Glassnode argues the derivatives tape looked more like short-dated positioning than broad-based conviction. In a Jan. 23 thread, the on-chain analytics firm pointed to a split between front-end call demand and longer-dated risk pricing that stayed anchored in downside protection.

“Let’s deep dive into options market behavior during last week’s move to 97.6K, and how options metrics help gauge conviction behind the move,” Glassnode wrote. The core takeaway: upside flow showed up, but it didn’t meaningfully change how the market priced risk further out the curve.

What Bitcoin Traders Can Learn From Last Week’s Rally

Glassnode first focused on near-term skew. Around mid-January, BTC rose roughly 8% over a few days, and the 1-week 25-delta skew moved sharply toward neutral from “deep put territory.” That kind of front-end shift can look like a market flipping bullish—until you check whether the same repricing is happening in longer expiries.

“Careful though,” Glassnode warned. “Near-dated call demand is often misread as directional conviction.” The thread paired that point with flow data: the options volume put/call ratio dropped from 1 to 0.4, signaling a surge in call activity. But, as Glassnode framed it, the question is not whether calls were bought, but how short-dated that demand actually was.

The longer-dated picture was notably less enthusiastic. Glassnode said the 1-month 25-delta skew “only moved from 7% to 4% at the low,” staying in put asymmetry even as the 1-week skew fell from 8% to 1%. On the 3-month 25-delta skew, the shift was even smaller (less than 1.5%) and it “stayed firmly in put territory,” continuing to price asymmetric downside.

For Glassnode, that divergence matters because it separates “flow” from “risk pricing.” Upside participation can be real, but if the market does not reprice skew across maturities, it suggests traders are not extending that optimism into a higher-conviction, longer-horizon view.

The volatility tape reinforced the same message. “Layering in ATM implied volatility, we see vol being sold as price moved higher,” Glassnode wrote. “Gamma sellers monetized the rally. This is not the volatility behavior typically associated with sustained breakouts.”

That combination: front-end call demand alongside vol supply can align with tactical positioning rather than a regime change. It can also leave spot moves more vulnerable if follow-through buying does not materialize once short-dated structures roll off.

Glassnode closed with a checklist for what a cleaner breakout would look like: “An ideal breakout setup combines spot pressing key levels, skew pointing higher with conviction across maturities, and volatility being bid. Last week’s move didn’t meet those conditions.”

For traders watching whether BTC can revisit $97,600, the thread’s implication is straightforward: monitor whether longer-dated skew begins to lift out of put territory and whether implied volatility starts to get bid, not sold, as spot tests key levels again.

At press time, BTC traded at $89,297.

Bitcoin price chart

Litecoin Structure Intact, But $63 Remains The Line Bulls Must Defend

Litecoin is once again at a critical crossroads, with its long-term structure remaining intact after years of successful defenses. However, the margin for error is thin. As price hovers near key levels, $63 has emerged as the line bulls must protect. A break below it could shift momentum sharply, while holding above keeps the broader bullish structure alive and sets the stage for the next decisive move.

Structure Gives Way, Expansion Phase Begins

Columbus’s latest LTC update highlights that the multi-year compression that previously capped price action has finally resolved, resulting in a clean break of the long-term chart setup. This structural change confirms a shift from a neutral state to a clearly bullish one.

The current price action is described as a pause before expansion rather than the conclusion of the rally. In this phase, Litecoin is holding steady above old resistance levels, allowing the market to load for the next leg of the move, turning previous barriers into new support. Litecoin’s projected path forward is based on the typical behavior of expansion cycles following structural breaks. 

Litecoin

The strategy follows a clear three-step progression: the initial breakout, followed by the current phase of acceptance. Once the market fully accepts these new price levels, the “real move” begins, representing a phase where the most significant gains are expected to materialize.

The 9-Year Trendline That Still Controls Litecoin

Matthew Dixon highlighted the immense historical significance of the Litecoin long-term trend line. This line has acted as an unbreakable floor for nine years, with the price never closing below it. While the market has dipped under this line multiple times in the past, every attempt to break down has ultimately failed, maintaining a remarkably consistent structural defense.

Currently, the market environment is putting this nearly decade-long support to the test once again. Dixon emphasizes that we cannot rely on intra-month volatility to determine the outcome. Instead, the definitive signal rests solely on the monthly candle close. This closing price will serve as a macro-economic pivot point that dictates the primary direction for the coming months.

A successful hold above the trend line would be a powerful bullish confirmation, suggesting the long-term uptrend remains intact despite external pressures. Conversely, a confirmed close below this line would shift the narrative to bearish, marking a historic breakdown of a nine-year support system.

Specific technical triggers are also in play, particularly the $63 level. Dixon warns that falling below $63 would be devastating, as it would effectively nullify the hidden bullish divergence currently supporting the price. Given these risks, Dixon recommends exercising patience until the monthly close or ensuring strict stop losses are in place for any active trades.

Litecoin

Another Dogecoin ETF Has Gone Live For Trading, How Did It Perform?

The US crypto market has welcomed a new entrant as 21Shares rolls out its Spot Dogecoin ETF, giving investors another avenue to engage with the infamous dog-themed meme coin. Trading kicked off amid a mix of curiosity and caution, with on-chain data already showing how much the DOGE ETF has performed so far. 

21Shares Launches Dogecoin ETF

In a press release on Thursday, January 22, 21Shares announced the official launch of its Spot Dogecoin ETF, TDOG, which began trading on NASDAQ the same day. The new ETF provides investors with direct exposure to Dogecoin through a fully backed, regulated, and transparent vehicle. Each ETF share is also backed 1:1 by DOGE held in institutional-grade custody. 

Notably, the launch of the new TDOG ETF brings the total number of US Dogecoin ETFs to three, joining Grayscale’s GDOG and Bitwise’s BWOW. 21Shares is also the only ETF provider endorsed by House of Doge, the official corporate arm of the Dogecoin foundation, highlighting the global asset manager’s close ties to the meme coin. 

As one of the largest crypto ETF issuers, 21Shares continues to expand its crypto product lineup with the introduction of TDOG. This follows the investment company’s previous ETF offerings, including TSOL, a Solana ETF released in November 2025; ARKB, a Spot Bitcoin ETF launched in January 2024; and TETH, an Ethereum ETF introduced in July of the same year. Together, these products demonstrate 21Shares’ commitment to providing institutional-grade access to high-demand digital assets. 

Federick Brokate, Global Head of Business Development at 21Shares, highlighted DOGE’s large and active global community, calling it a unique digital asset with constantly growing use cases. He added that the new TDOG ETF will give investors regulated, physically backed exposure through a familiar ETF structure they know and trust. 

Marco Margiotta, the CEO of House of Doge, also shared comments on the recently launched 21Shares ETF. He said that TDOG is a step toward making Dogecoin easier to access through traditional financial systems. He also disclosed that House of Doge’s partnership with 21Shares will help more people get involved as the Dogecoin ecosystem grows. 

How 21Shares Dogecoin ETF Has Performed So Far

Contrary to expectations, 21Shares’ recently launched Dogecoin ETF saw weak performance on the first day of trading, signaling investors’ lack of interest in the investment product. Data from SoSoValue shows that TDOG experienced no inflows on January 22 and instead declined by about 0.07%. Despite it being the second day of trading, the DOGE ETF has still not registered any flows. 

Dogecoin

This lackluster performance has been observed across all Dogecoin ETFs this week. Grayscales’ GDOG and Bitwise BWOW have reported zero inflows over the last week. The last time GDOG saw positive activity was on January 8, when it received around $333,083 in investments. Before that, the ETF recorded its highest inflows on January 2, totaling roughly $2.3 million. Since its launch in November 2025, GDOG ETF inflows have been unstable, with more days of inactivity than significant investment. 

Dogecoin

XRP Price Recovery Is Possible If It Reclaims This Ichimoku Base

The XRP price may be preparing for a long-overdue recovery, as a crypto analyst has just highlighted a critical area that could flip the cryptocurrency’s downward momentum into a bullish one. According to the market expert, XRP must reclaim the Ichimoku Base before it can resume its upside to new levels. 

XRP Price Recovery To Resume Above Ichimoku Base

Market analyst Xaif Crypto took to X this Thursday to deliver a fresh weekly update on XRP as the cryptocurrency enters a pivotal technical area after months of downside pressure. The accompanying chart shows price retreating from a prior peak in late 2024 and sliding back into a clearly marked demand zone in the blue box. 

According to the analyst, the recent retreat follows a clear downtrend, with lower highs pushing price back toward a previous consolidation zone. This blue-box area represents the main battleground, as prior trading activity built a base that could act as support if XRP revisits that level. 

So far, XRP appears to be stabilizing within this demand zone. Candles on the chart show hesitation and reduced selling pressure. The chart also draws attention to an Ichimoku structure, with XRP attempting to reclaim its Ichimoku Base. According to Xaif Crypto, this base will determine XRP’s next big move.

XRP

The analyst has suggested that reclaiming this level could signal a potential shift in market sentiment. He disclosed that a strong close above it could favor upside continuation, weakening the ongoing downtrend and giving buyers more room to target upper resistance levels. Conversely, Xaif Crypto predicts that a break below the Ichimoku Base would likely lead to a deeper correction for XRP, as support would be lost and selling could accelerate. 

For now, XRP sits at a make-or-break level that could decide whether it recovers from its current slump. Xaif Crypto’s chart has outlined potential targets if the cryptocurrency manages to reclaim and hold above the Ichimoku Base. Currently hovering around $1.95, XRP faces potential bullish targets at $2.09, $2.20, $2.31, and $2.45. The analyst has also highlighted that traders and investors should closely watch the weekly close for confirmation of a sustained recovery.  

Analyst Says XRP Is Planning A Major Reversal

Despite dropping below $2 earlier this week, analysts remain optimistic about XRP’s price outlook. According to market expert Crypto GVR, XRP could be attempting a major price reversal from the $1-$1.5 range. Based on his chart analysis, the analyst predicts that XRP could decline first from its current price around $1.95 to roughly $1.13 before rebounding sharply to new highs.

He has set a bullish target at $3.25. marking the next upside for XRP. If XRP were to crash to $1.13 and then surge to $3.25, this would represent a staggering 187% increase in value. 

XRP

Strategy Is Becoming Bitcoin’s Central Bank Proxy, Says Michael Saylor

Michael Saylor says Strategy’s evolving capital-markets machine is starting to resemble a “central bank of Bitcoin,” positioning the company as a conduit between traditional money markets and the Bitcoin network. In an interview with Gatecast, the Strategy executive chairman argued the firm’s shift toward perpetual preferred equity and “digital credit” instruments is designed to fund continuous bitcoin accumulation while stripping out refinancing risk.

Saylor traced the company’s pivot to the COVID-era shock of 2020, when “the physical economy of the world came to a grinding halt and the financial system was turned upside down.” Facing what he framed as an existential decision, he said Strategy discovered Bitcoin during “the war on COVID and the war on currency,” and used it to “escape a pretty miserable existence and turned into something digital and modern and much better.”

Strategy Is Building A ‘Central Bank of Bitcoin’

That transformation now sits on a scale Saylor claims is often misunderstood. Addressing criticism that Strategy is simply levering up to buy more Bitcoin, he said the firm has raised roughly $44 billion over the past year and a half and characterized “most of that” as equity rather than debt. “There isn’t really leverage,” Saylor said. “Equity is capital that you have forever. We’re funneling that capital into the crypto economy. We’re buying Bitcoin.” He added that Strategy has acquired “about $48 billion worth of Bitcoin” across “like 88 different transactions,” purchasing “as soon as we raise the capital.”

When asked whether Strategy is still just a buyer or something closer to a “shadow central bank of Bitcoin” given its holdings, Saylor leaned into the analogy. “Bitcoin is digital capital. It is the world reserve capital network. It’s replaced gold as the global non-sovereign store of value for the human race,” he said. Then came the framing: “Banks normally buy credit. We actually sell credit. So what we’re doing is the reverse of commercial banking, retail banking. It is sort of like central banking. We are sort of like the central bank of Bitcoin.”

Saylor’s “central bank” claim hinges on a product stack meant to translate Bitcoin’s balance-sheet asset into yield-bearing instruments for investors who won’t hold BTC directly. He described STRC as “a currency that’s pegged to the dollar” and “backed […] with Bitcoin,” with proceeds recycled into BTC purchases. In his telling, that mechanism links “the Bitcoin economy” to “the traditional finance economy and to the money markets of the world.”

Michael Saylor: “We are sort of like the central bank of Bitcoin.” pic.twitter.com/IyZ9EHLAQn

— TFTC (@TFTC21) January 22, 2026

The more material shift, he argued, is Strategy’s progression away from maturity-driven debt toward perpetual structures. Saylor laid out a four-stage evolution: initial use of credit and leverage, a senior note secured by BTC collateral that the company later refinanced and vowed not to repeat, then non-recourse convertible bonds, an approach he said became constrained by market size and retail inaccessibility and finally “digital credit,” which he described as “an equity […]a perpetual preferred equity.”

In one of his clearest statements of intent, Saylor said Strategy’s priority is to prevent principal from ever coming due. “We don’t want to have leverage. We want to have amplification via equity. We never want the principal to come due. We’d rather pay a higher dividend forever,” he said. “I’d rather pay 10% forever than pay 5% for 5 years.” Strategy, he added, has “announced a $1.44 billion cash reserve for the dividends,” giving it “the option to not raise any capital in the capital markets for up to two years,” and in his view “effectively stripped the credit risk off of the business.”

Saylor also pitched liquidity as a differentiator. He said Strategy has raised $7 billion over the last nine months via these instruments and described an emerging market of about $8 billion outstanding. Where preferred stocks typically trade thinly, he argued Strategy’s “digital credit instruments were trading 30 million a day,” with “Stretch […] more than a hundred million a day,” which he framed as a step-change in market access.

The firm’s investor pitch, as Saylor described it, splits the world into capital and credit buyers. “Bitcoin is digital capital. The world will be built on digital capital. But the world will run on digital credit,” he said, arguing that products like Stretch can offer a money-market-like alternative “powered by digital capital” while sidestepping Bitcoin’s volatility.

At press time, BTC traded at $89,250.

Bitcoin price chart

❌