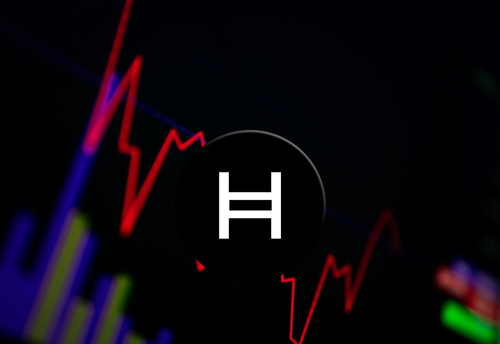
Hedera (HBAR) price drops toward $0.10 despite McLaren F1 partnership
- Hedera (HBAR) has intensified its downward trajectory.
- The token slipped towards the $0.10 mark amid persistent selling pressure and broader cryptocurrency market weakness.
- This decline comes despite the partnership with the McLaren F1 Team.
Hedera’s price fell alongside other cryptocurrencies on Friday, reaching intraday lows near $0.10.
After seeing a sharp decline on January 19, HBAR rebounded slightly to around $0.115.
However, sell-off pressure across the risk assets market has pushed bulls into the woods to leave the brief upside as a mask of a likely deeper rot.
It’s an outlook mirrored across the altcoin ecosystem as Bitcoin struggles below $90,000.
Due to profit-taking amid macroeconomic and geopolitical headwinds, BTC has touched lows of $87,700 and currently hovers around $89,230.
HBAR dips despite McLaren partnership
Struggling altcoins, including HBAR, risk dragging lower. Hedera seems to have failed to capture upside momentum despite the news of a major partnership with McLaren.
The Hedera team announced a multi-year partnership with McLaren Racing on Thursday, revealing that the crypto company is now an Official Partner of the McLaren F1 Team.
Several crypto companies, including Coinbase, Crypto.com and Bybit have previously inked major sports sponsorship deals. Hedera is eyeing expansion via this latest move.
“Working with one of the world’s most recognized sports brands is a big step for the Hedera ecosystem. It gives us a chance to show what Web3 can look like when it’s built on a network people can trust, and when it’s tied to experiences fans actually want,” said Charles Adkins, CEO of HBAR, Inc.
HBAR technical outlook
HBAR’s chart reveals a pronounced bearish structure, with the price well below key moving averages.
The altcoin has been in a prolonged downtrend since it touched highs of $0.35 in January last year.
Technical indicators point to further downside risk, as HBAR breached the $0.12 support earlier this month and now hovers near $0.10, with oscillators like RSI trending lower. Hedera’s token is below all major averages.

If buyers fail to reclaim $0.11, losses could accelerate toward October’s lows around $0.0976.
Hedera’s market capitalization stands at approximately $4.65 billion, reflecting a 65% drop from July 2025 peaks, exacerbated by declining total value locked at $61.5 million and a 16% stablecoin supply reduction over the past week.
HBAR futures traders have ramped up short positions, anticipating continued pressure amid absent ETF inflows.
Analysts note that while a bounce could bring the $0.16 mark into view, current metrics favor consolidation or deeper correction unless Bitcoin stabilizes.
Currently, BTC is facing pressure as investors pile into gold.
The post Hedera (HBAR) price drops toward $0.10 despite McLaren F1 partnership appeared first on CoinJournal.