NASA’s SPHEREx Observatory Completes First Cosmic Map Like No Other
6 min read
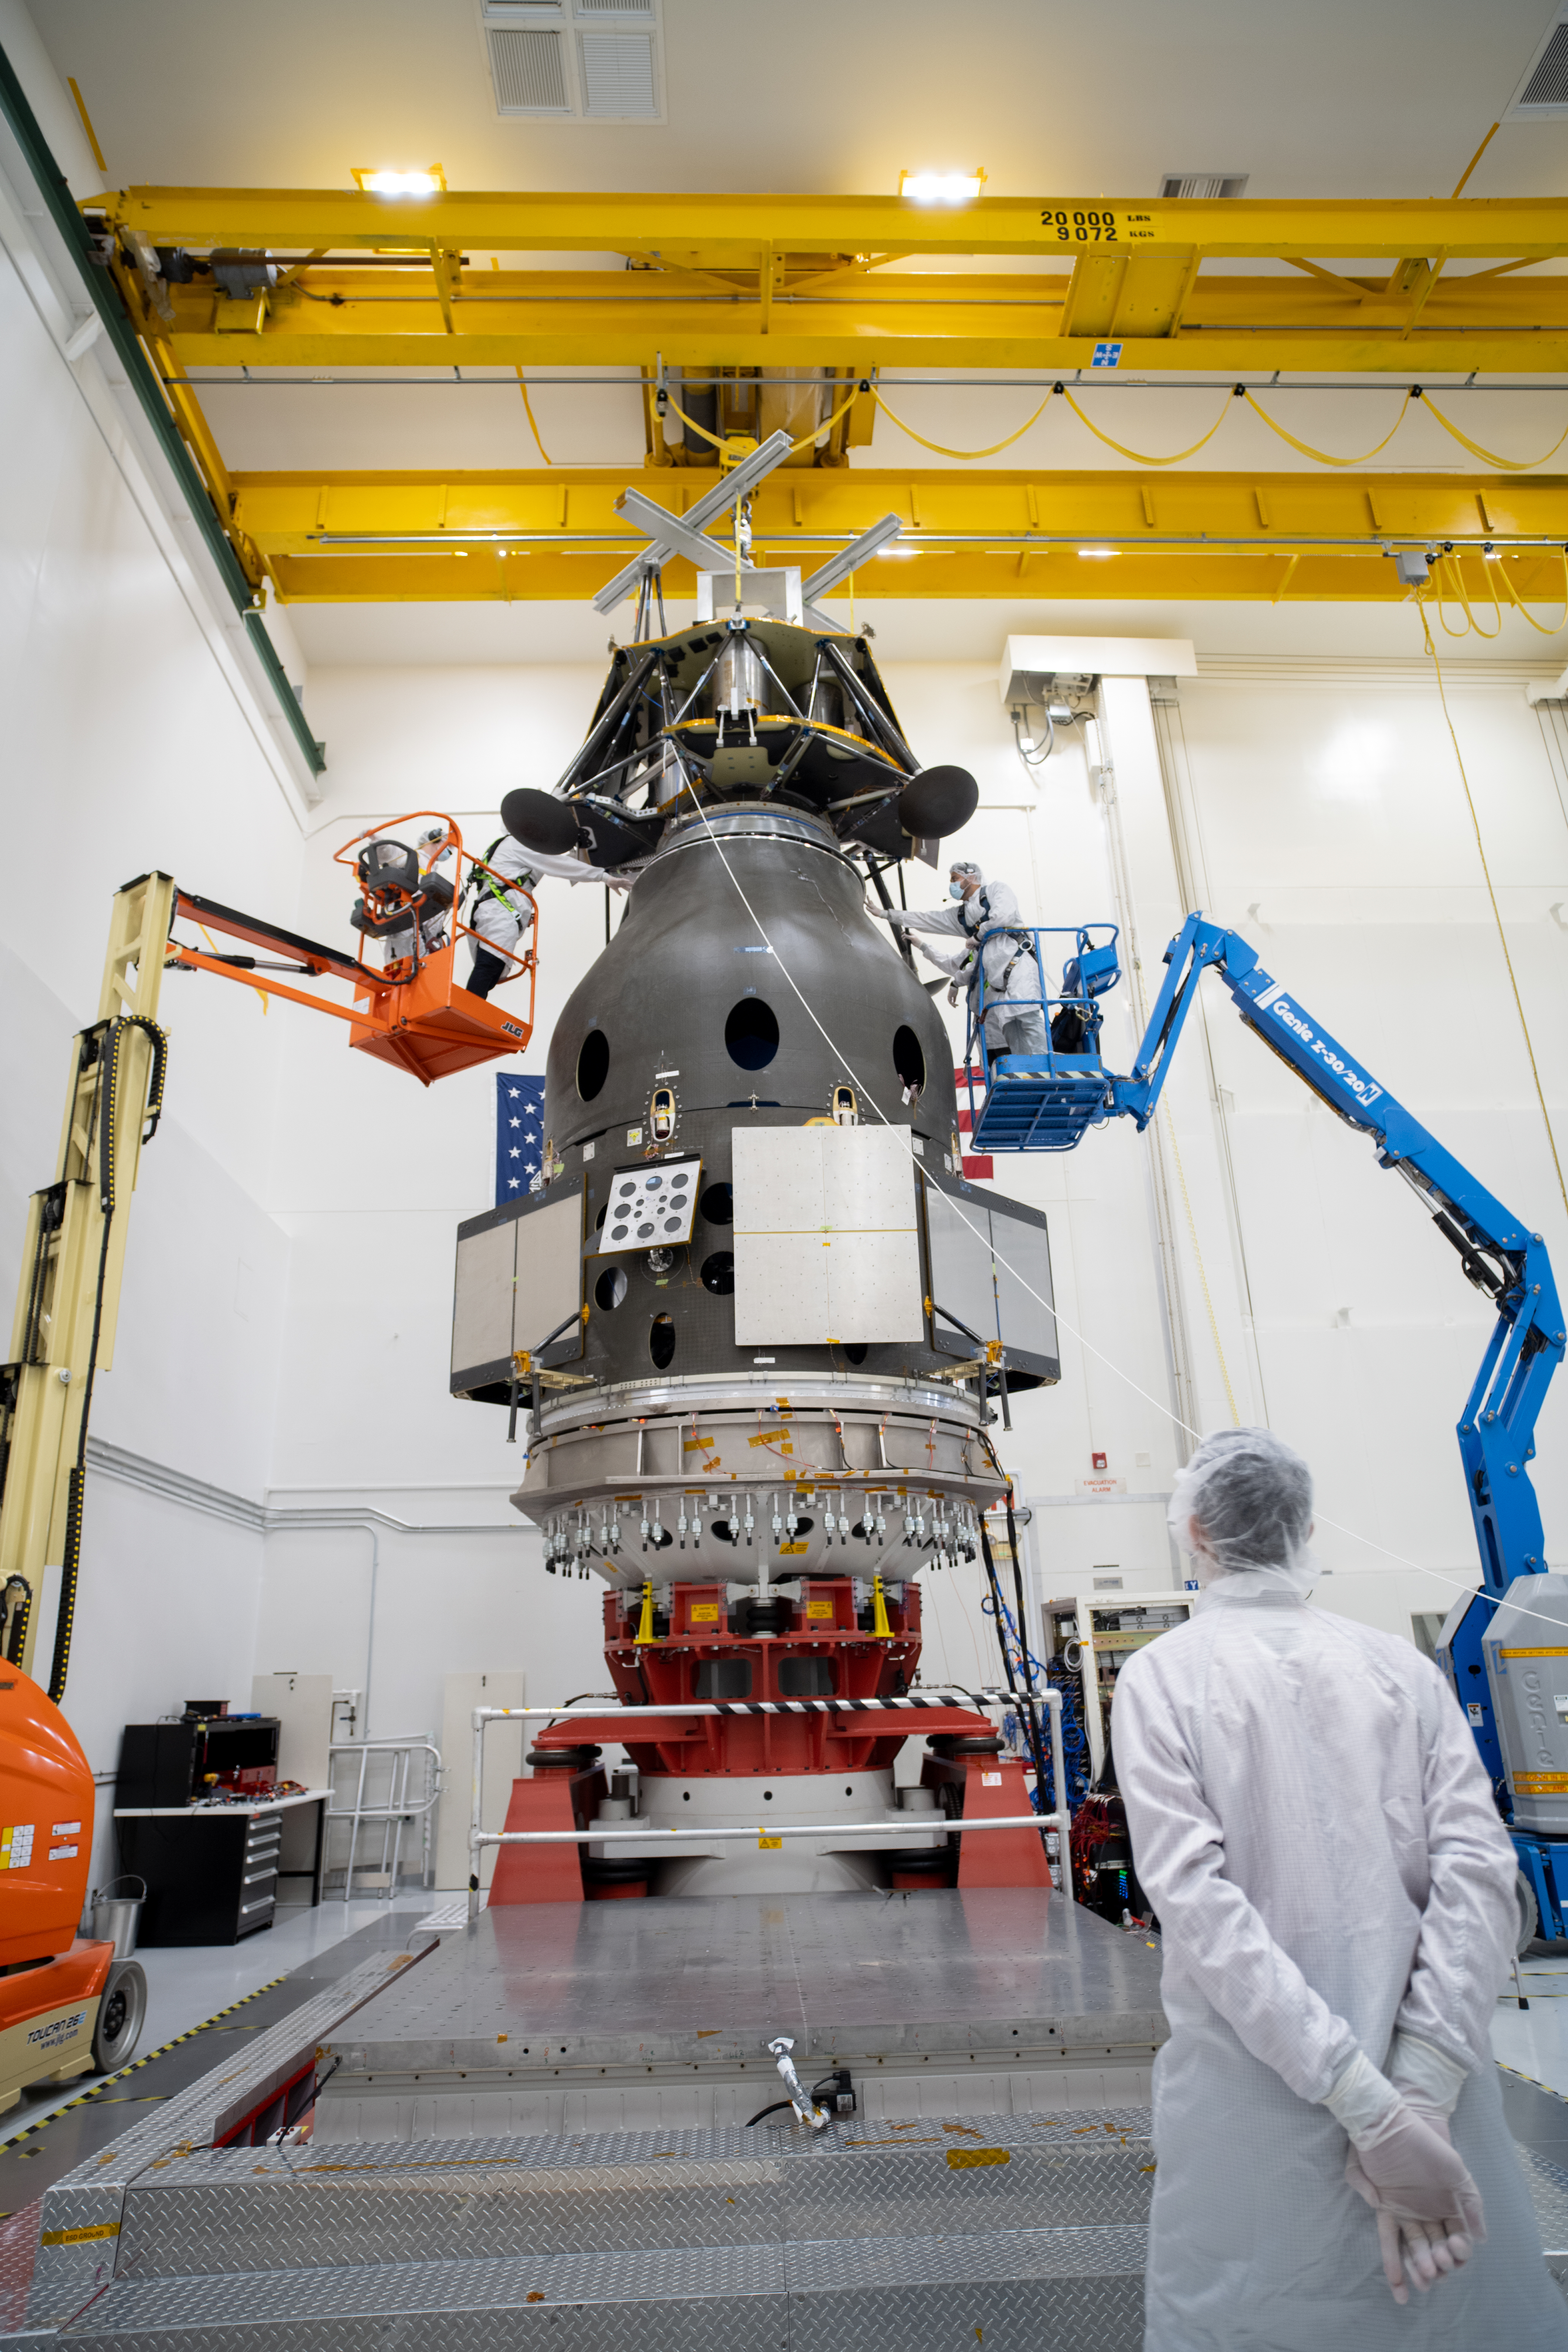
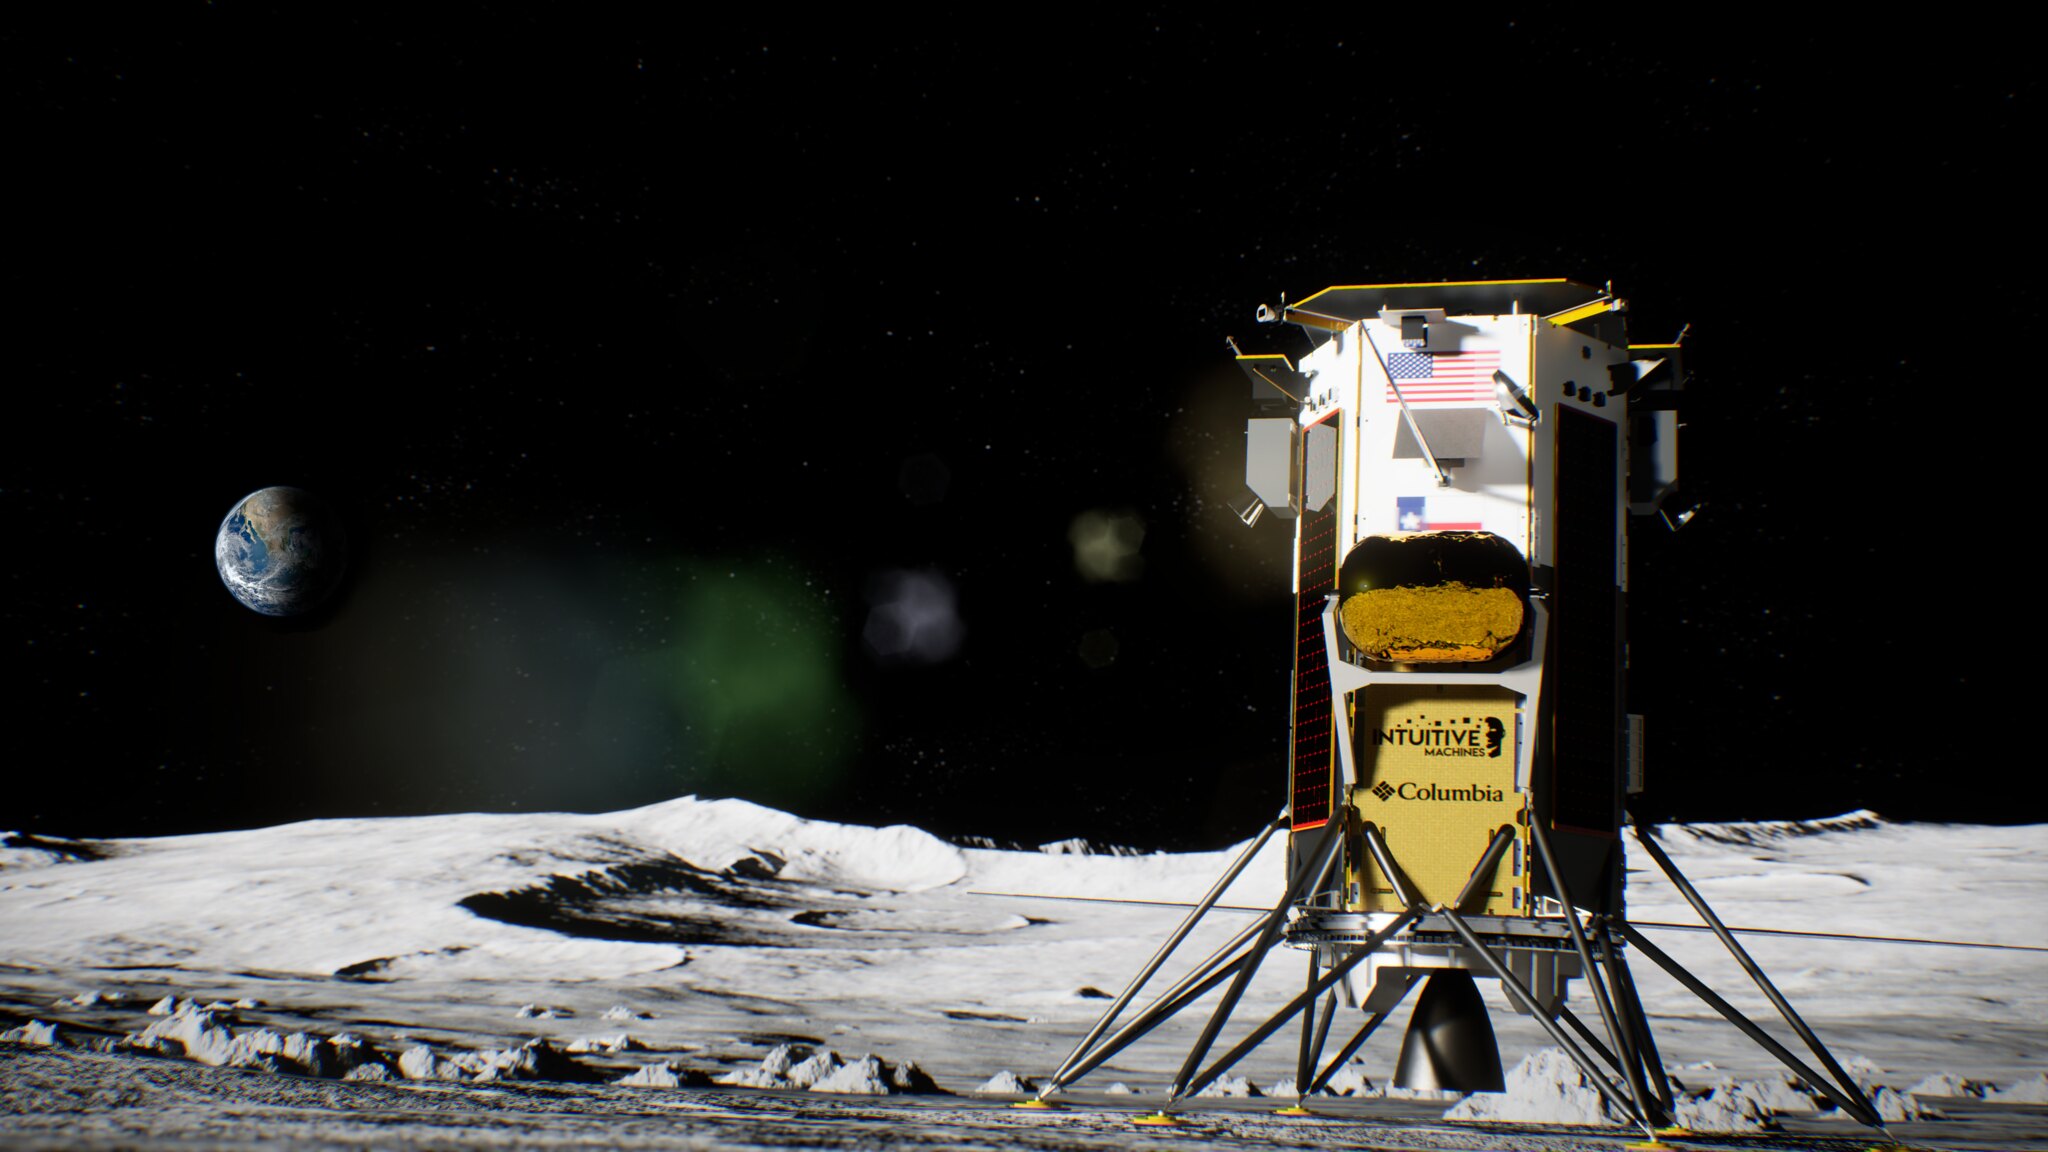
Preparations for Next Moonwalk Simulations Underway (and Underwater)
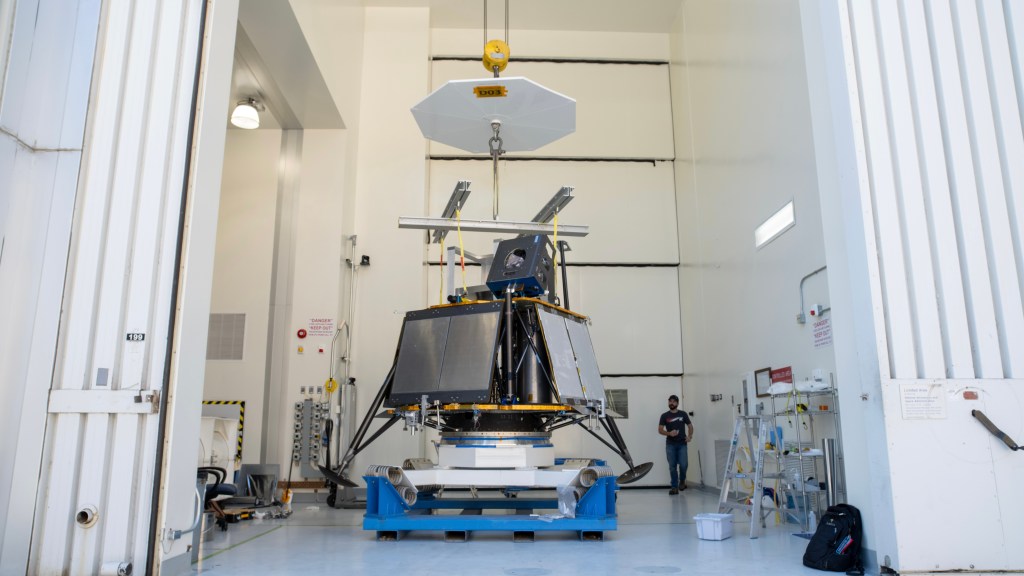
Credit: NASA/JPL-Caltech
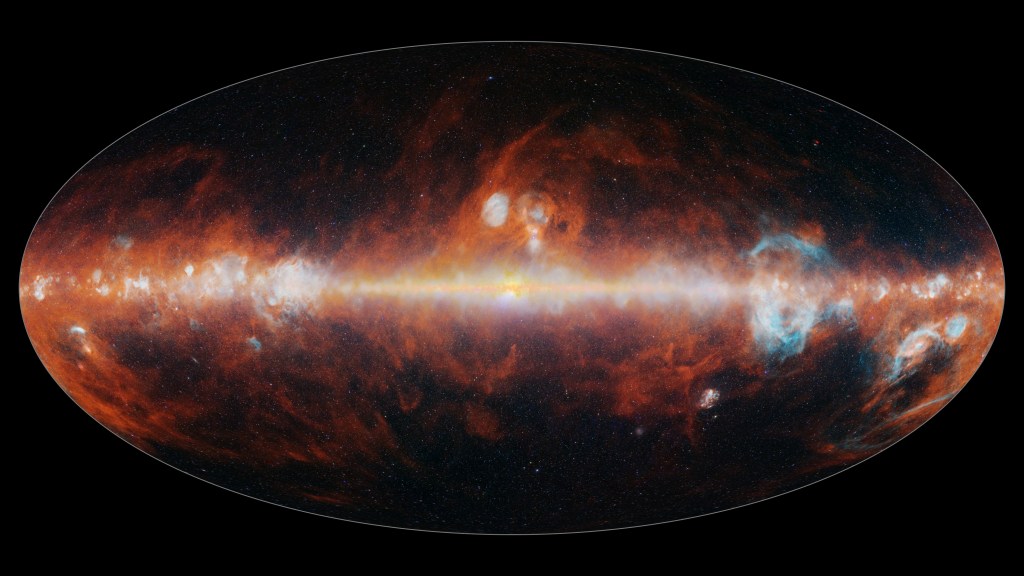
Launched in March, NASA’s SPHEREx space telescope has completed its first infrared map of the entire sky in 102 colors. While not visible to the human eye, these 102 infrared wavelengths of light are prevalent in the cosmos, and observing the entire sky this way enables scientists to answer big questions, including how a dramatic event that occurred in the first billionth of a trillionth of a trillionth of a second after the big bang influenced the 3D distribution of hundreds of millions of galaxies in our universe. In addition, scientists will use the data to study how galaxies have changed over the universe’s nearly 14 billion-year history and learn about the distribution of key ingredients for life in our own galaxy.
“It’s incredible how much information SPHEREx has collected in just six months — information that will be especially valuable when used alongside our other missions’ data to better understand our universe,” said Shawn Domagal-Goldman, director of the Astrophysics Division at NASA Headquarters in Washington. “We essentially have 102 new maps of the entire sky, each one in a different wavelength and containing unique information about the objects it sees. I think every astronomer is going to find something of value here, as NASA’s missions enable the world to answer fundamental questions about how the universe got its start, and how it changed to eventually create a home for us in it.”
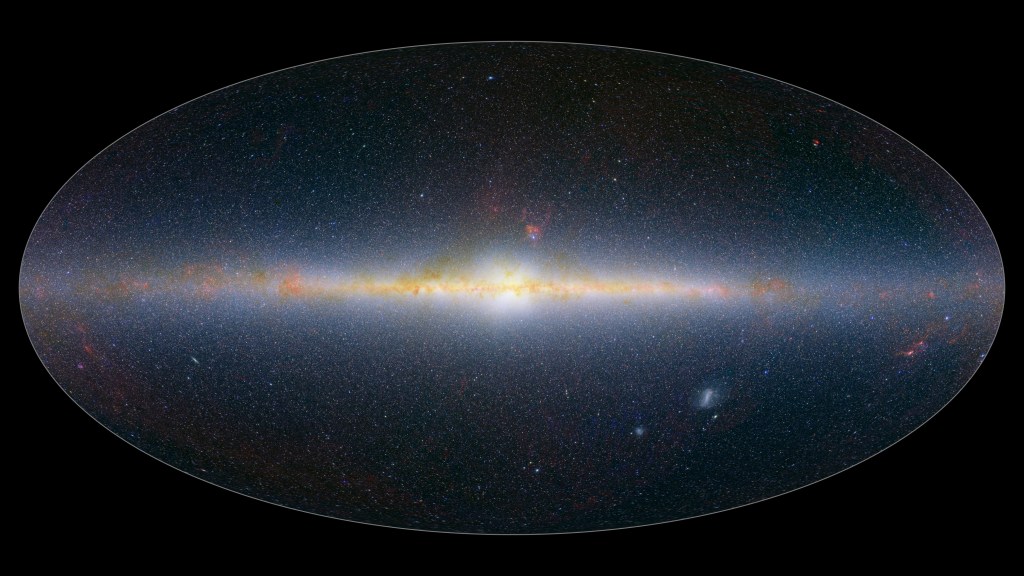
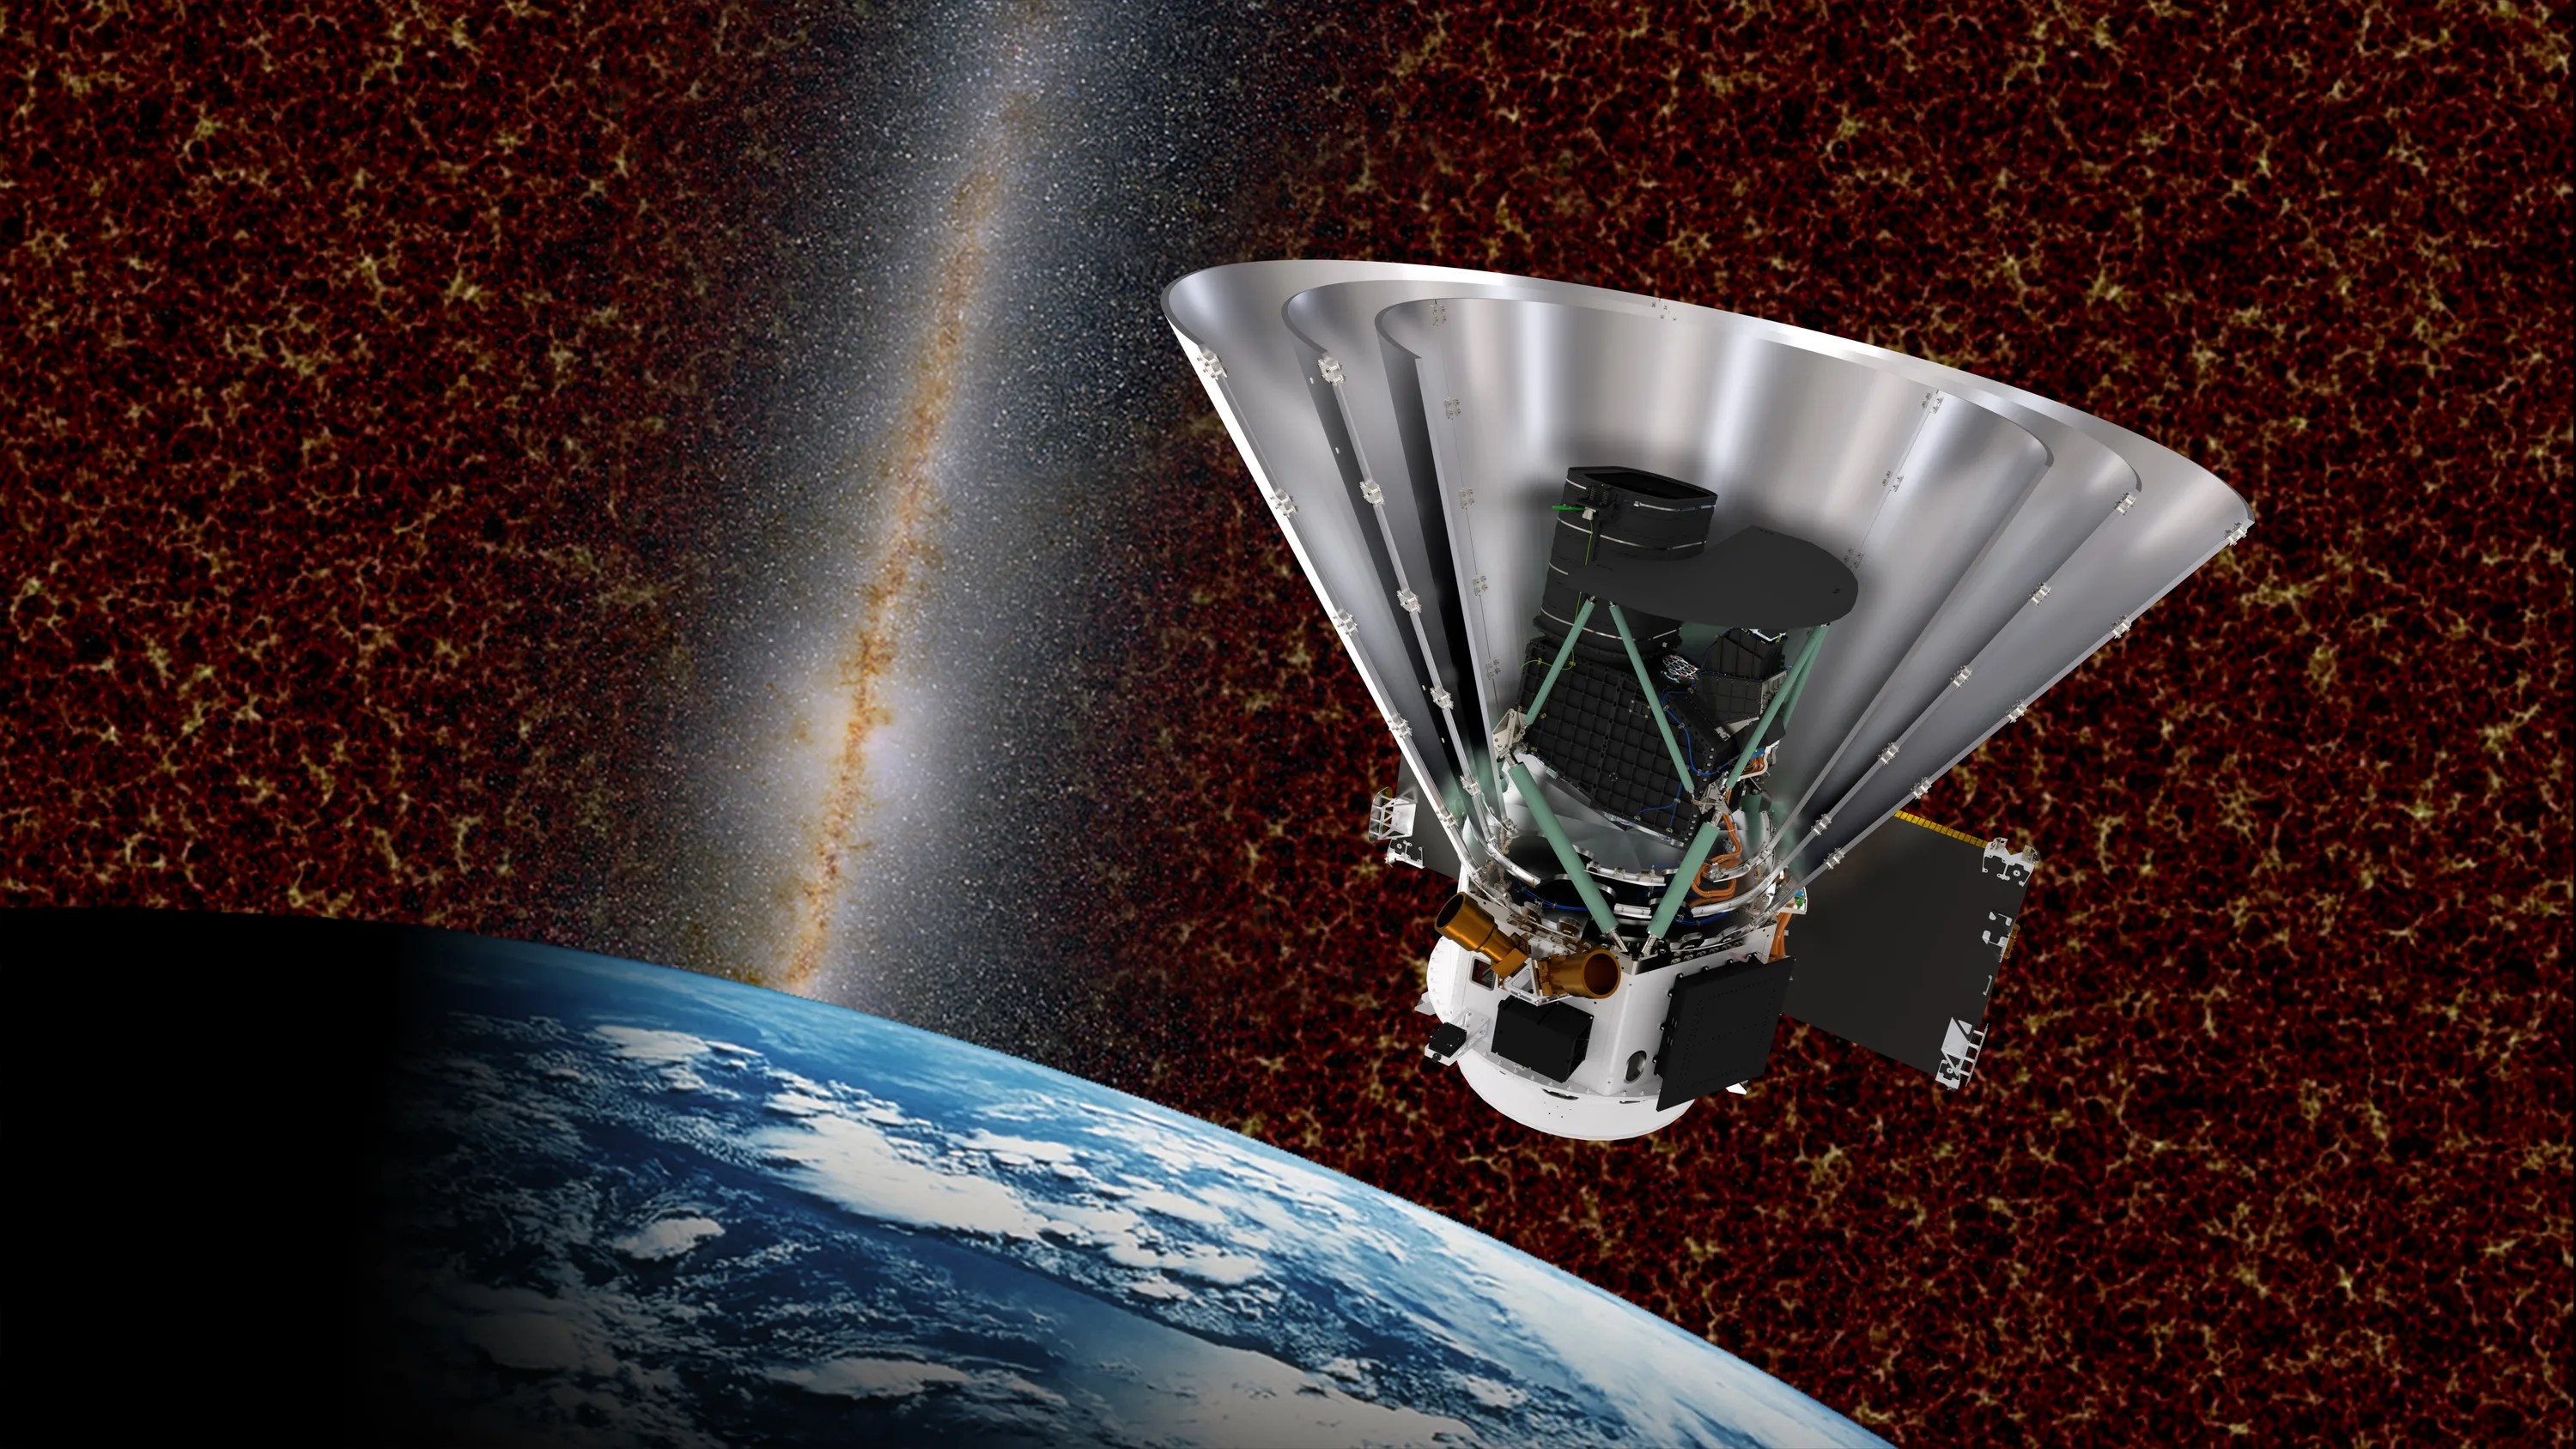
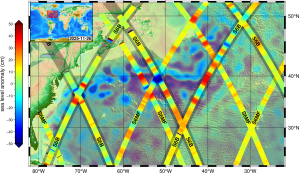
Circling Earth about 14½ times a day, SPHEREx (which stands for Spectro-Photometer for the History of the Universe, Epoch of Reionization, and Ices Explorer) travels from north to south, passing over the poles. Each day it takes about 3,600 images along one circular strip of the sky, and as the days pass and the planet moves around the Sun, SPHEREx’s field of view shifts as well. After six months, the observatory has looked out into space in every direction, capturing the entire sky in 360 degrees.
Managed by NASA’s Jet Propulsion Laboratory in Southern California, the mission began mapping the sky in May and completed its first all-sky mosaic in December. It will complete three additional all-sky scans during its two-year primary mission, and merging those maps together will increase the sensitivity of the measurements. The entire dataset is freely available to scientists and the public.
“SPHEREx is a mid-sized astrophysics mission delivering big science,” said JPL Director Dave Gallagher. “It’s a phenomenal example of how we turn bold ideas into reality, and in doing so, unlock enormous potential for discovery.”
Superpowered telescope
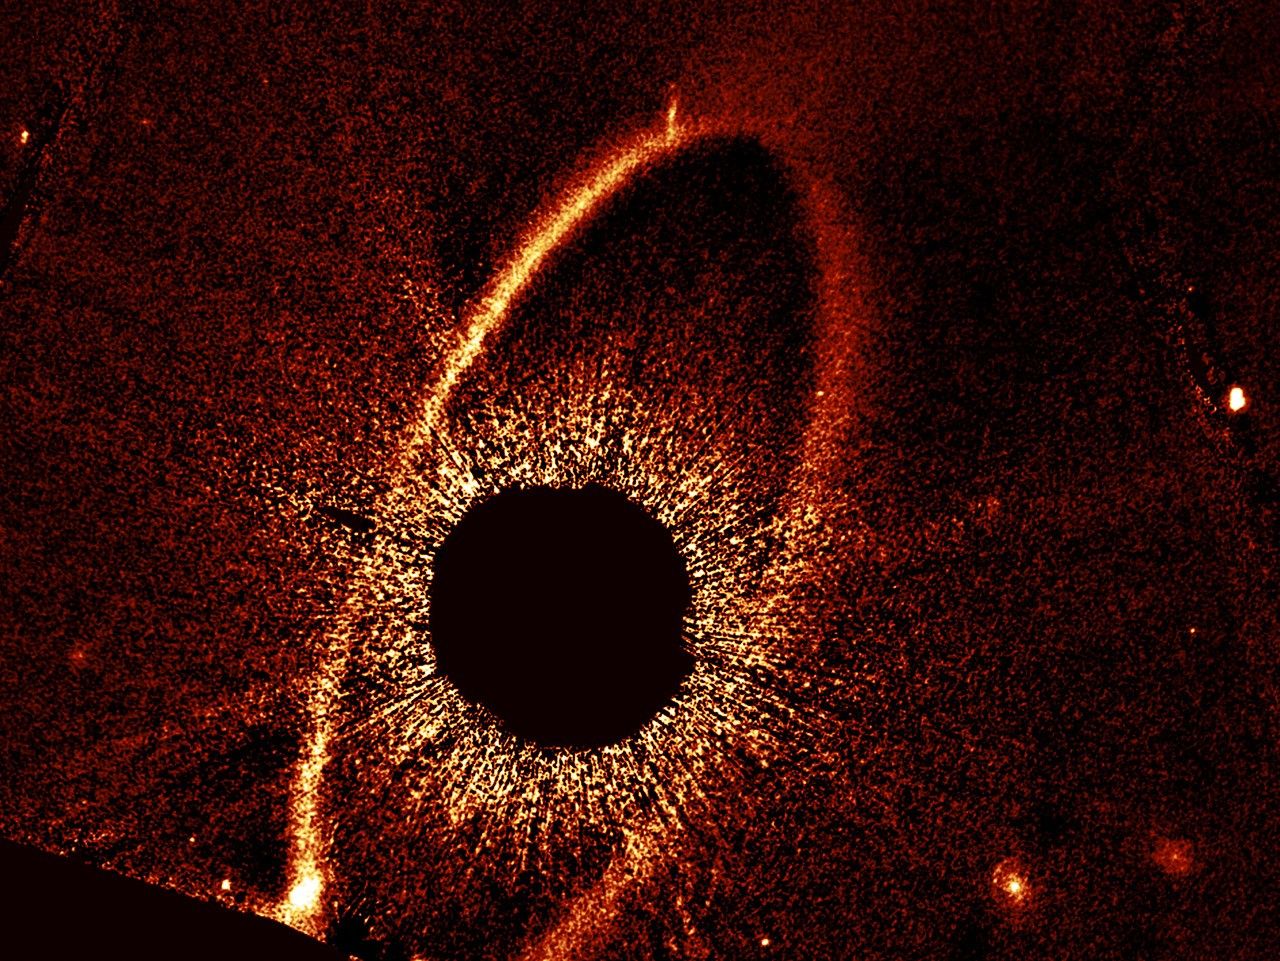
Each of the 102 colors detected by SPHEREx represents a wavelength of infrared light, and each wavelength provides unique information about the galaxies, stars, planet-forming regions, and other cosmic features therein. For example, dense clouds of dust in our galaxy where stars and planets form radiate brightly in certain wavelengths but emit no light (and are therefore totally invisible) in others. The process of separating the light from a source into its component wavelengths is called spectroscopy.
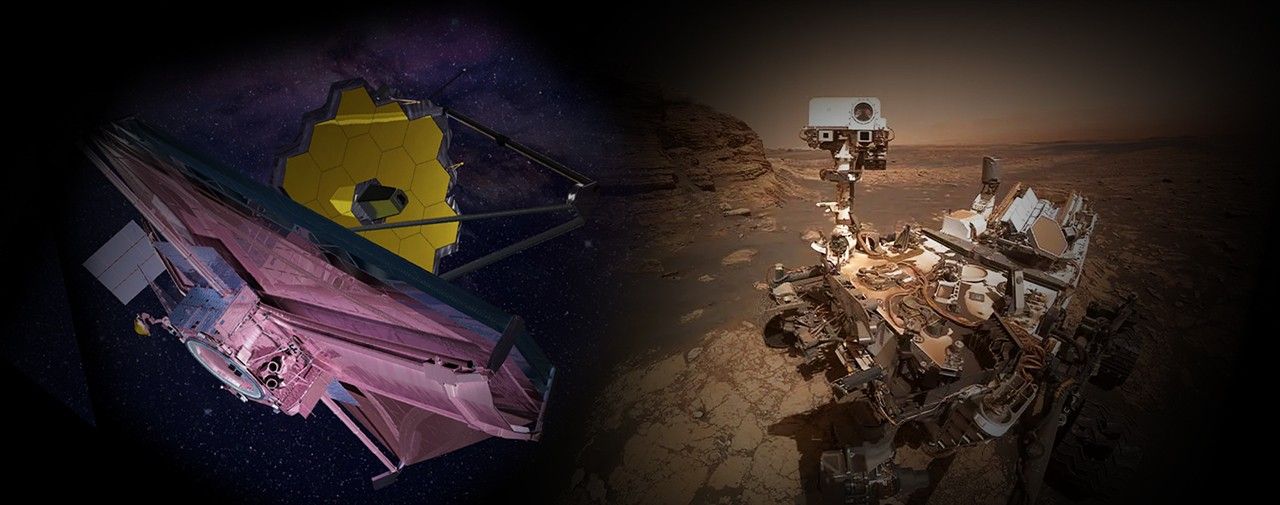
And while a handful of previous missions has also mapped the entire sky, such as NASA’s Wide-field Infrared Survey Explorer, none have done so in nearly as many colors as SPHEREx. By contrast, NASA’s James Webb Space Telescope can do spectroscopy with significantly more wavelengths of light than SPHEREx, but with a field of view thousands of times smaller. The combination of colors and such a wide field of view is why SPHEREx is so powerful.
“The superpower of SPHEREx is that it captures the whole sky in 102 colors about every six months. That’s an amazing amount of information to gather in a short amount of time,” said Beth Fabinsky, the SPHEREx project manager at JPL. “I think this makes us the mantis shrimp of telescopes, because we have an amazing multicolor visual detection system and we can also see a very wide swath of our surroundings.”
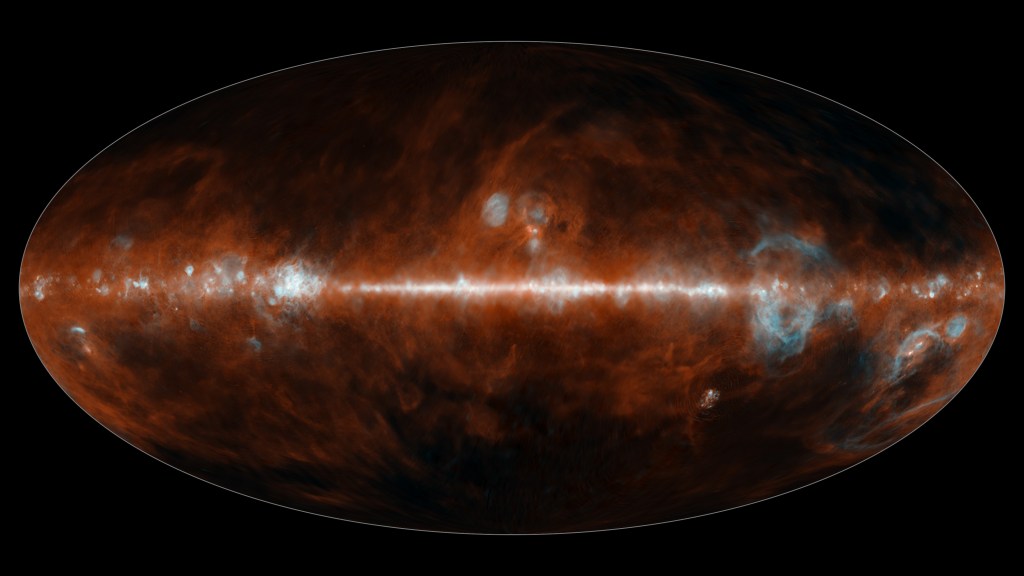
To accomplish this feat, SPHEREx uses six detectors, each paired with a specially designed filter that contains a gradient of 17 colors. That means every image taken with those six detectors contains 102 colors (six times 17). It also means that every all-sky map that SPHEREx produces is really 102 maps, each in a different color.
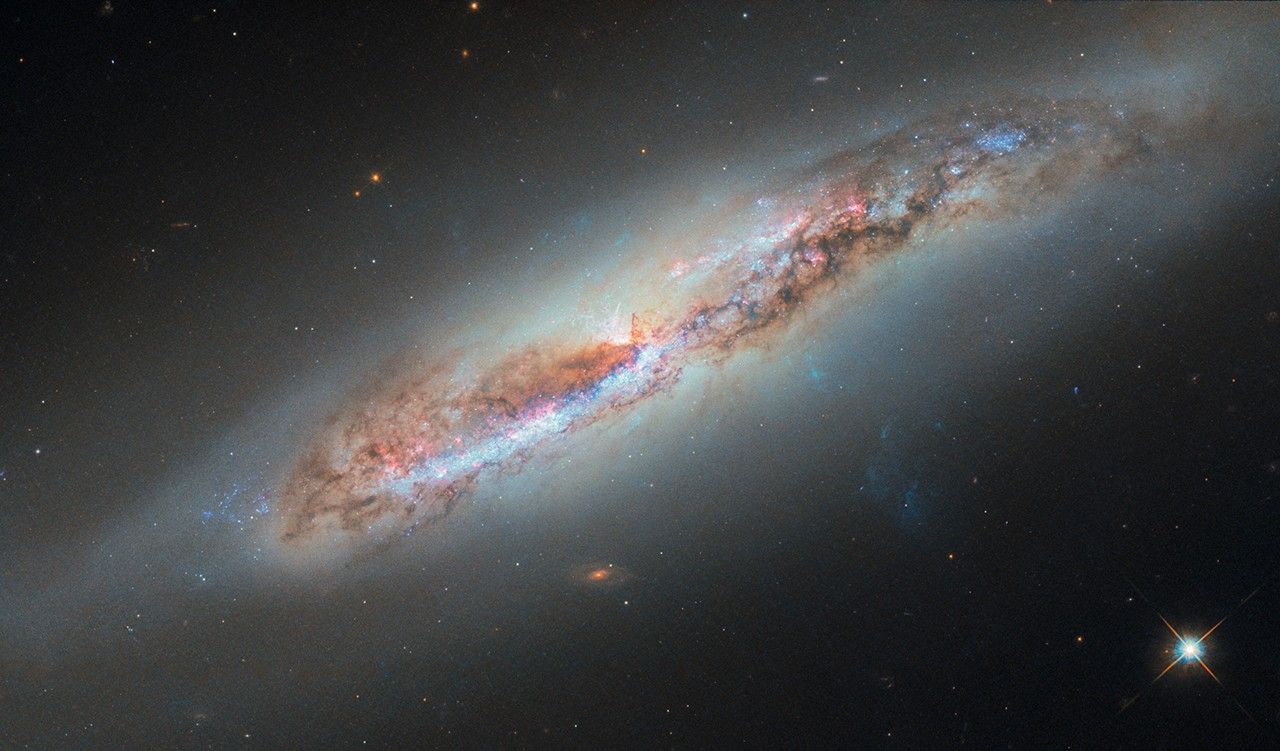
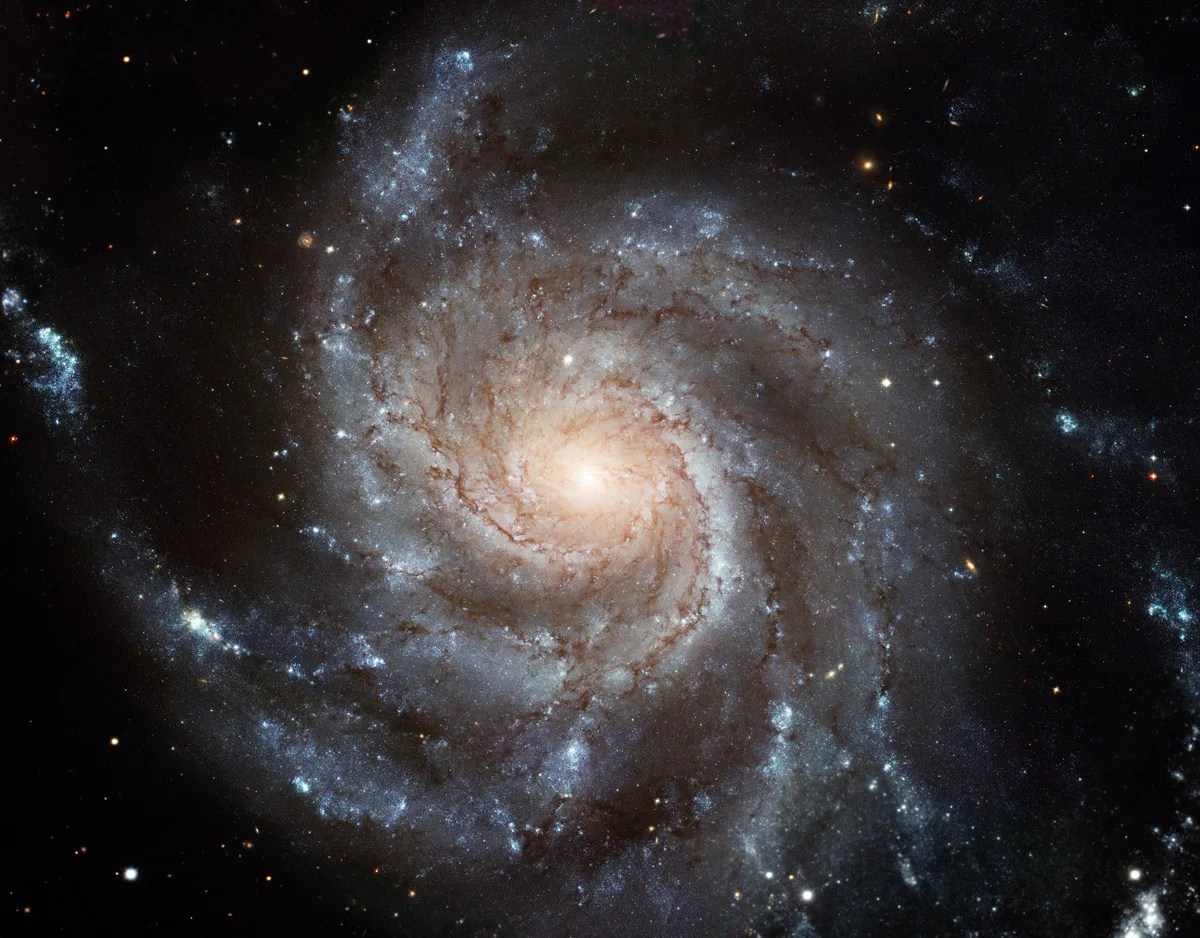
The observatory will use those colors to measure the distance to hundreds of millions of galaxies. Though the positions of most of those galaxies have already been mapped in two dimensions by other observatories, SPHEREx’s map will be in 3D, enabling scientists to measure subtle variations in the way galaxies are clustered and distributed across the universe.
Credit: NASA/JPL-Caltech
Those measurements will offer insights into an event that took place in the first billionth of a trillionth of a trillionth of a second after the big bang. In this moment, called inflation, the universe expanded by a trillion-trillionfold. Nothing like it has occurred in the universe since, and scientists want to understand it better. The SPHEREx mission’s approach is one way to help in that effort.
More about SPHEREx
The SPHEREx mission is managed by JPL for NASA’s Astrophysics Division within the Science Mission Directorate in Washington. The telescope and the spacecraft bus were built by BAE Systems. The science analysis of the SPHEREx data is being conducted by a team of scientists at 10 institutions across the U.S., and in South Korea and Taiwan. Data is processed and archived at IPAC at Caltech in Pasadena, which manages JPL for NASA. The mission’s principal investigator is based at Caltech with a joint JPL appointment. The SPHEREx dataset is publicly available.
For more information about the SPHEREx mission visit:
https://science.nasa.gov/mission/spherex/
News Media Contacts
Calla Cofield
Jet Propulsion Laboratory, Pasadena, Calif.
626-808-2469
calla.e.cofield@jpl.nasa.gov
2025-144
Details
Explore More
Discover Related Topics
SPHEREx
Big Bang and the Evolution of the Universe
Precisely measure the cosmological parameters governing the evolution of the universe and test the inflation hypothesis of the Big Bang…
Galaxies
Galaxies consist of stars, planets, and vast clouds of gas and dust, all bound together by gravity. The largest contain…
Astrobiology


/Ocean%20Surface%20Topography%20Mission%20(OSTM%20Jason-2).png)
