Reading view

There are new articles available, click to refresh the page.

Ethereum Traders Chase Upside With Historic Leverage – Breakout Fuel Or Fragile Setup?

Ethereum has been struggling to regain traction below the $3,000 level since Monday, with repeated rejection attempts reinforcing a fragile market structure. Bulls continue to lose ground as upside momentum fades, while sentiment across the market remains dominated by apathy and underlying fear.

Trading activity has thinned, relief rallies have been short-lived, and many participants appear hesitant to commit capital in a market that lacks clear directional conviction. As price drifts sideways under key resistance, the broader narrative has shifted from optimism to caution.

Despite this weak price action, on-chain derivatives data tells a more complex story. According to a CryptoQuant report, Ethereum’s derivatives market on Binance is reaching record levels, highlighting a sharp rise in risk appetite and speculative positioning among traders.

Leverage across ETH contracts has expanded significantly, suggesting that market participants are increasingly willing to take on risk in anticipation of a directional move. This behavior points to growing optimism beneath the surface, even as spot price struggles to reflect it.

The divergence between subdued price action and rising derivatives exposure creates a tense market environment.

Ethereum Leverage Reaches Extreme Levels

The CryptoQuant analysis by CryptoOnchain highlights a critical shift in Ethereum’s derivatives landscape, underscoring how speculative positioning has reached extreme levels. According to the data, Ethereum’s Estimated Leverage Ratio (ELR) on Binance has surged to 0.611, marking a new all-time high for this metric.

Ethereum Estimated Leverage Ratio | Source: CryptoQuant

A rising ELR indicates that traders are taking on increasingly large leveraged positions relative to the exchange’s reserves.

At the same time, the report explains that buying aggression has intensified. On December 19, the Taker Buy Sell Ratio spiked to 1.13, a level not observed since September 2023. A ratio above one indicates that aggressive buyers are dominating order flow, with traders actively lifting offers rather than passively waiting.

This combination of elevated leverage and strong taker buying reflects a market leaning heavily toward bullish expectations.

The convergence of these two indicators sends a clear message: traders are not only optimistic about Ethereum’s price trajectory, but they are also willing to assume substantial risk to express that view.

However, this structure comes with meaningful downside risks. While high leverage can amplify upside momentum and fuel a breakout through resistance, it also creates fragility. With leverage at historic highs, even a modest price pullback could trigger cascading liquidations, increasing the probability of a sharp “long squeeze” and sudden volatility.

ETH Price Struggles Below as Bearish Structure Persists

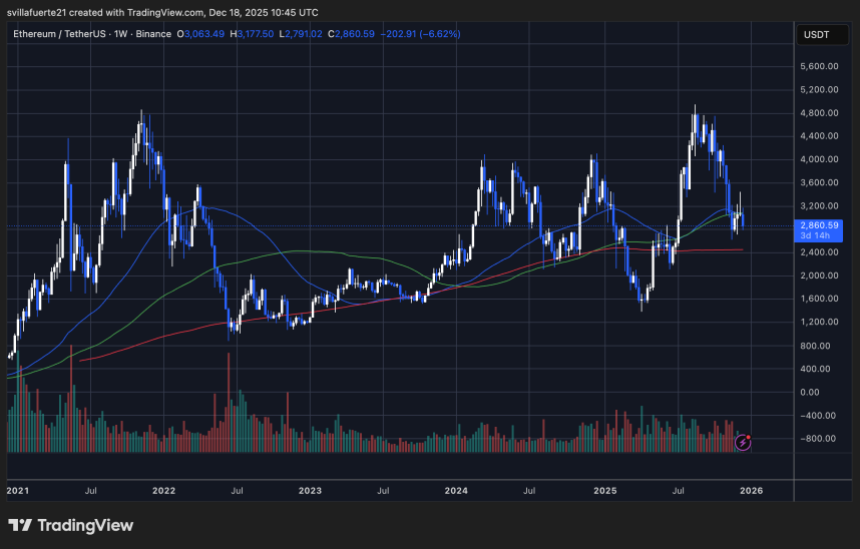
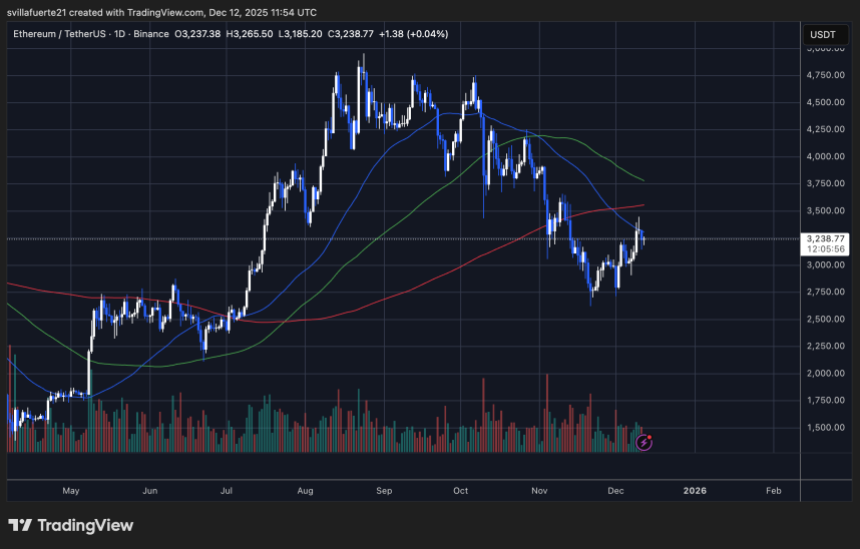
Ethereum’s price action on the daily chart reflects a market attempting to stabilize after a prolonged corrective phase, but still trapped below critical resistance levels. ETH is currently trading around the $2,950 area after a short-term rebound, yet the broader structure remains fragile.

The recent bounce has pushed price back toward the descending short-term moving average, but ETH continues to trade below both the 100-day and 200-day moving averages, which are now acting as dynamic resistance rather than support.

ETH testing critical demand level | Source: ETHUSDT chart on TradingView

Structurally, Ethereum has formed a series of lower highs since the October peak near $4,800, confirming a clear downtrend on the medium-term timeframe. The failure to reclaim the $3,200–$3,300 zone is particularly notable, as this area previously acted as strong support during the uptrend and has now flipped into resistance. As long as ETH remains below this range, bullish attempts are likely to be sold into.

While the latest rebound came with a modest increase in volume, it remains well below the levels observed during impulsive upside moves earlier in the year. This suggests short-covering or tactical buying rather than strong spot demand.

On the downside, the $2,800–$2,750 region stands out as immediate support. A decisive break below this zone would expose ETH to a deeper retracement toward the $2,500 area. For the bearish structure to weaken meaningfully, Ethereum must reclaim the $3,200 level and hold above its key moving averages with expanding volume.

Featured image from ChatGPT, chart from TradingView.com

Ethereum Exchange Supply Falls To 2016 Lows – Long-Term Holding Dominates

Ethereum is increasingly struggling to maintain a convincing bullish narrative as market sentiment continues to deteriorate. Price action remains fragile, and a growing number of analysts are openly discussing the possibility that Ethereum is transitioning into a broader bear market phase.

Repeated failures to sustain upside momentum have weakened confidence, while risk appetite across the crypto market continues to fade. As volatility persists and capital rotates defensively, ETH finds itself at the center of a debate between structural weakness in price and resilience beneath the surface.

According to a recent CryptoQuant report, Ethereum’s current state reflects a notable shift in supply behavior across exchanges. The Exchange Supply Ratio (ESR), which tracks the proportion of ETH held on centralized trading platforms, has been steadily declining across all major exchanges.

This trend signals that a smaller share of the circulating supply is readily available for immediate sale, a critical factor when evaluating supply-and-demand dynamics.

Historically, declining exchange balances suggest reduced selling pressure, as investors move assets into self-custody or long-term storage rather than preparing to liquidate. In the current environment, this structural change adds nuance to the bearish narrative.

Exchange Supply Declines Signal Structural Shift

The report highlights a pronounced decline in Ethereum’s Exchange Supply Ratio (ESR), reinforcing the view that supply dynamics are quietly shifting beneath the surface. Across all platforms, the ESR has fallen to approximately 0.137, one of its lowest readings since 2016.

Ethereum Exchange Supply Ratio | Source: CryptoQuant

This sustained drop reflects a steady outflow of ETH from exchanges into external wallets, signaling a reduced inclination toward immediate selling and a growing preference for long-term holding. Historically, similar patterns have emerged during re-accumulation phases or in transitional periods that follow extended volatility, often preceding more stable price behavior.

The trend is even more evident on Binance, where the ESR has declined to roughly 0.0325. As the exchange with the deepest liquidity, Binance’s balances serve as a key barometer for short-term supply conditions. The ongoing withdrawal of ETH from its wallets suggests a meaningful reduction in spot-side sellable supply, pointing to increased trader caution rather than aggressive distribution.

At the same time, Ethereum is trading near $2,960, a mid-range level that reflects a temporary equilibrium between buyers and sellers. The combination of falling exchange supply and relatively stable pricing indicates that the market is not under heavy selling pressure.

Instead, it appears to be entering a phase of liquidity absorption and strategic repositioning, where participants reduce exposure to short-term trades while preparing for a potential shift in market structure.

Ethereum Price Struggles Below Key Trend Levels

The daily ETH chart highlights a market that remains structurally fragile despite short-term stabilization. After failing to hold above the $3,200–$3,300 region, Ethereum has continued to print lower highs, confirming a loss of bullish momentum since late October. Price is currently trading around the $2,850–$2,900 area, a zone that has acted as a short-term demand pocket but lacks strong follow-through from buyers.

ETH consolidates around a key level | Source: ETHUSDT chart on TradingView

From a trend perspective, ETH remains below its short- and medium-term moving averages. The 50-day moving average has rolled over and is now acting as dynamic resistance, while the 100-day moving average is also trending lower.

The 200-day moving average sits higher, reinforcing the idea that Ethereum has shifted from a trending market into a corrective or distribution phase. As long as price remains capped below these levels, rallies are likely to be sold into rather than extended.

Volume dynamics reinforce this view. Recent rebounds have occurred on relatively muted volume compared to the heavy selling seen during prior breakdowns, suggesting reactive short covering rather than fresh demand.

Structurally, ETH needs to reclaim and hold above the $3,100–$3,200 range to rebuild a bullish case. Failure to do so keeps the risk tilted toward continued consolidation or a deeper corrective leg toward lower support levels.

Featured image from ChatGPT, chart from TradingView.com

Bitcoin Faces Elevated Downside Risk: Loss Selling Takes Hold As STH SOPR Falls Below 1

Bitcoin has been under intense selling pressure in recent sessions, leaving market participants increasingly cautious about near-term direction. On Wednesday, BTC briefly surged from the $86,000 area toward $90,000, offering short-term investors a moment of relief after weeks of downside volatility.

That rebound, however, proved short-lived. Price quickly retraced back to the $86,000 level, once again stalling bullish momentum and reinforcing the perception that sellers remain firmly in control.

This failed recovery attempt has weighed heavily on sentiment, particularly among short-term holders who entered positions at higher levels during the previous consolidation range. According to a report by Axel Adler, on-chain data reveals that this cohort has entered a clear stress regime. Bitcoin’s price has fallen below the average purchase price of short-term holders, a condition that historically increases the probability of reactive selling behavior.

The stress is further reflected in the Short-Term Holder Spent Output Profit Ratio (STH-SOPR, 30-day), which has declined to 0.98. This reading indicates that short-term holders are, on average, realizing losses when they sell. Such environments often coincide with deteriorating confidence and heightened sensitivity to further downside moves.

Bitcoin Short-Term Holder SOPR | Source: CryptoQuant

With BTC unable to hold recent relief rallies and short-term participants increasingly underwater, the market enters a fragile phase. The coming days will be critical in determining whether this pressure evolves into deeper capitulation or stabilizes into a base-building process.

Short-Term Holders Under Stress as Loss-Taking Accelerates

Adler explains that the Short-Term Holder Spent Output Profit Ratio (STH-SOPR 30D) is a critical gauge of short-term market stress, as it measures whether recent coin sales are occurring at a profit or a loss. Values above one indicate that short-term holders are selling profitably, while readings below one signal loss realization.

Historically, sustained periods below one reflect deteriorating confidence and raise the risk of further downside, as loss-taking behavior can cascade into additional sell pressure. A continued decline in SOPR would likely intensify this dynamic and open the door to new local lows.

By contrast, a meaningful recovery would require the metric to reclaim and hold above the one level, signaling that selling pressure is being absorbed and losses are no longer dominant.

This stress is reinforced by the Short-Term Holders Positive vs Negative Sentiment chart. The indicator classifies holders based on whether they are in profit or at a loss. Over the past five weeks, sentiment has shifted decisively toward the orange and purple zones, representing negative positioning.

Bitcoin Short-Term Holders Positive vs Negative Sentiment | Source: CryptoQuant

The growing dominance of underwater holders increases the probability of panic-driven selling. Together, both charts deliver a consistent message: short-term participants are under pressure, and the current environment remains fragile until clear signs of relief emerge.

Bitcoin Tests Critical Support as Bears Persist

Bitcoin continues to trade under pressure, with the chart showing price consolidating around the $87,000 area after a sharp corrective move from the October highs near $125,000. The rejection from the upper range marked a clear shift in market structure, as BTC lost the 50-day and 100-day moving averages and failed to reclaim them on subsequent rebounds. The blue moving average has now turned downward, reinforcing the short- to medium-term bearish bias.

BTC facing critical support | Source: BTCUSDT chart on TradingView

Price is currently hovering just above the 200-day moving average, plotted in red, which sits near the $86,000–$88,000 zone. This level represents a critical area of long-term demand and structural support. Historically, sustained closes below the 200-day average tend to coincide with deeper corrective phases or prolonged consolidation.

Volume dynamics add to the cautious outlook. Selling pressure expanded significantly during the breakdown in October and November, while recent rebound attempts have occurred on relatively muted volume. This suggests that short-covering and tactical buying, rather than strong spot demand, are driving price stabilization.

Structurally, Bitcoin is forming lower highs since the peak, keeping the broader trend vulnerable. A recovery scenario would require BTC to reclaim the $95,000–$100,000 region and hold above the declining moving averages. Until then, the chart favors continued consolidation or further downside risk around the long-term support zone.

Featured image from ChatGPT, chart from TradingView.com

Ethereum Retail Participation Vanishes: Hits One-Year Low In Network Activity

Ethereum is struggling to maintain a convincing bullish narrative as market conditions continue to deteriorate and a growing number of analysts begin to call for a broader bear market. After months of heightened volatility and repeated corrective phases, price action alone has failed to restore confidence, leaving participants increasingly cautious.

This hesitation is now being reflected clearly in on-chain data, reinforcing the idea that the current weakness is not purely technical, but structural.

According to a recent CryptoQuant report, Ethereum’s network activity has dropped to levels that strongly suggest a withdrawal of retail participation. Active sending addresses have fallen toward the 170,000 mark, a threshold historically associated with reduced engagement from smaller investors. In past cycles, retail activity typically expands during bullish phases as new participants enter the market, then contracts sharply once confidence fades and price momentum weakens.

Prolonged volatility and corrective price action have likely eroded Ethereum’s short-term conviction, pushing retail participants either to the sidelines or out of the market entirely. This absence matters. Retail flow often plays a critical role in sustaining momentum during recoveries, and without it, upside moves tend to stall quickly.

On-Chain Signals Point to Exhaustion, Not Capitulation

According to CryptoOnchain’s analysis, Ethereum’s sharply depressed on-chain activity aligns with a classic phase of seller exhaustion rather than active capitulation. In this regime, selling pressure gradually diminishes as participants willing to exit have largely done so, yet fresh demand has not meaningfully returned. The result is a fragile equilibrium where price may stabilize, but upside remains limited in the absence of new buyers.

Ethereum Active Sending Addresses | Source: CryptoQuant

The lack of retail participation plays a central role in this dynamic. Retail flow typically provides the initial momentum during early rebounds, amplifying price moves once confidence begins to recover. With active sending addresses at one-year lows, that catalyst is currently missing, which helps explain why upside attempts have been shallow and short-lived.

However, this same environment has historically attracted larger, long-term participants. Institutional and high-conviction holders often accumulate during periods of low activity, when liquidity is thin, and sentiment is decisively negative.

Importantly, a credible recovery signal would not emerge from price action alone. CryptoOnchain emphasizes that a sustainable shift would require a gradual rebound in active sending addresses alongside price stabilization.

That combination would point to returning demand and improving network utilization. Conversely, continued stagnation or further declines in address activity would increase the risk of Ethereum entering a deeper consolidation or even a demand-destruction phase.

While current conditions highlight clear short-term weakness and retail disengagement, similar on-chain setups have historically formed near structural bottoms, creating the potential for medium-term trend shifts if activity begins to recover.

Ethereum Price Struggles at Key Structural Support

Ethereum’s price action on the 3-day chart reflects a market caught between structural support and persistent bearish pressure. After failing to hold above the $3,200–$3,300 region, ETH has rolled over and is now consolidating near the $2,850 area, a zone that aligns closely with the 200-day moving average. This level has historically acted as a medium-term inflection point, making it critical for bulls to defend in order to avoid a deeper trend shift.

ETH testing support level | Source: ETHUSDT chart on TradingView

The recent rejection from the $4,000–$4,800 highs marks a clear lower high within the broader structure, reinforcing the idea that momentum has weakened since late 2025. While price briefly reclaimed the 100-day moving average during the mid-year rebound, it failed to sustain acceptance above it, and ETH has since slipped back below the shorter-term averages. This suggests that rallies are still being sold into rather than accumulated aggressively.

Price action aligns with a market transitioning into consolidation rather than immediate capitulation. If ETH loses the $2,800–$2,750 support zone decisively, downside risk opens toward the $2,400 region, where the long-term trend support converges.

Conversely, any bullish recovery would require ETH to stabilize above the 200-day moving average and reclaim the $3,200 level with expanding volume. Until then, the chart favors a cautious, range-bound outlook with downside risks still present.

Featured image from ChatGPT, chart from TradingView.com

Legendary Bitcoin OG Deepens Ethereum Bet Despite Losses Exceeding $70 Million

Ethereum is facing renewed selling pressure as the broader market struggles with fear, uncertainty, and growing bearish expectations. After weeks of weakness, many analysts are now openly calling for a prolonged bear market stretching into 2026, arguing that Ethereum remains below key structural levels and lacks strong momentum.

Bulls are attempting to defend the $2,800 mark, a level that has become critical for maintaining short-term confidence, but price action continues to reflect hesitation rather than conviction. Volatility remains elevated, and market sentiment is dominated by caution rather than optimism.

Against this fragile backdrop, on-chain data reveals a notable divergence between price action and behavior from experienced market participants. According to data from Hyperdash, the Bitcoin OG, known for shorting the market during the October 10 crash, has once again increased his exposure to Ethereum.

This trader, widely followed for his high-conviction and well-timed positioning, just added another 12,406 ETH to his long positions, signaling confidence at current price levels despite the prevailing bearish narrative.

While retail sentiment weakens and analysts debate deeper downside scenarios, strategic accumulation by seasoned players suggests that Ethereum may be approaching a decisive phase. Whether this marks early positioning ahead of a recovery or a high-risk bet in a deteriorating market remains the key question ahead.

A High-Conviction Bet Under Pressure

Lookonchain reports that the Bitcoin OG continues to hold substantial, high-conviction positions across multiple assets, despite the ongoing market weakness. According to the latest data, his current exposure includes 203,341 ETH valued at approximately $577.5 million, 1,000 BTC worth around $87 million, and 250,000 SOL valued near $30.7 million. This level of concentration highlights a willingness to endure significant volatility rather than reduce risk in an increasingly uncertain environment.

Bitcoin OG Crypto Positions | Source: Hyperdash

That conviction, however, has come with meaningful drawdowns. The wallet is now down more than $70 million from its peak. At one point, unrealized profits exceeded $120 million, but recent price declines have reduced that figure to less than $30 million. The swing illustrates how quickly market conditions can shift, even for traders with a strong track record and well-timed entries in the past.

From a broader market perspective, this positioning reflects a sharp contrast between sentiment and behavior. While many participants have turned defensive and analysts debate the likelihood of a prolonged bear market, this wallet remains heavily exposed, suggesting a belief that current levels may still offer asymmetric upside. At the same time, the drawdown serves as a clear reminder that size and conviction do not remove risk in a structurally fragile market.

Ethereum Tests Structural Support Amid Growing Pressure

Ethereum’s weekly chart highlights a clear loss of momentum after the rejection near the $4,800–$5,000 region, followed by a sharp retracement toward the $2,800–$2,900 zone. Price is currently trading below the 50-week moving average and hovering near the 100-week MA, a level that historically acts as an important inflection point for medium-term trend direction. The failure to hold above the short-term averages confirms that sellers have regained control of the structure.

ETH consolidates around critical demand | Source: ETHUSDT chart on TradingView

From a trend perspective, ETH remains above the rising 200-week moving average, which continues to define the long-term bullish framework. However, the widening gap between the faster and slower averages has started to compress, signaling a transition phase rather than trend continuation. Volume has expanded on down weeks, reinforcing the idea that recent downside moves are driven by active distribution rather than passive consolidation.

The $2,800 area now represents a critical demand zone. A sustained hold above this level would suggest that the correction is a controlled pullback within a broader range. Conversely, a weekly close below it would expose ETH to a deeper retracement toward the $2,400–$2,500 region, where the 200-week MA and prior consolidation converge.

Overall, the chart reflects a market caught between long-term structural support and short-term bearish momentum. Ethereum needs a decisive reclaim of the 50-week moving average to neutralize downside risk and restore confidence in trend continuation.

Featured image from ChatGPT, chart from TradingView.com

A Structural Shift in Bitcoin: BTC’s Network Activity Tells a New Story

Bitcoin is struggling to break away from the bearish market structure that has been in place since late October. Despite several short-lived relief rallies, price action continues to reflect weakness, with bulls failing to reclaim key resistance levels or generate sustained momentum.

As uncertainty and fatigue spread across the market, many participants are questioning whether Bitcoin’s current behavior fits the traditional cycle framework that has defined previous bull and bear phases.

A recent analysis by Darkfost highlights a structural shift that adds important context to this debate. According to the data, the number of active Bitcoin addresses has been in a persistent decline since April 2021. Historically, bullish phases were characterized by a clear expansion in active addresses, as new investors entered the market and on-chain activity surged. This growth typically peaked near cycle tops, followed by a contraction during bear markets as participation dried up.

This cycle, however, looks markedly different. Even during periods of strong price performance since 2022, active addresses have failed to recover meaningfully and continue trending lower. This divergence suggests that Bitcoin’s market structure may be evolving away from a retail-driven, on-chain participation model toward something more concentrated and institutionally influenced.

As Bitcoin attempts to stabilize after weeks of downside pressure, understanding these structural changes is becoming critical. The decline in active addresses may not simply signal weakness, but rather a transformation in how Bitcoin is held, traded, and valued in this cycle.

Active Addresses Signal A Structural Shift In The Market

The analysis suggests that despite Bitcoin’s strong price performance since 2022, on-chain participation continues to deteriorate. Active addresses are once again approaching the lowest levels observed during this cycle, highlighting a growing disconnect between price action and network activity. At the peak in April 2021, Bitcoin recorded roughly 1.15 million active addresses. Today, that figure has nearly halved, sitting near 680,000, a contraction that cannot be ignored.

Bitcoin Active Address Momentum | Source: Darkfost

This decline is difficult to attribute to a single cause. Instead, it likely reflects a combination of structural changes in how Bitcoin is held and accessed. One contributing factor appears to be the rise in inactive addresses. While precise classification criteria vary, the broader trend points toward a stronger long-term holding mentality, where coins remain dormant rather than actively transacted on-chain. This behavior reduces visible network activity without necessarily implying bearish conviction.

At the same time, a portion of market participants may have shifted away from direct on-chain usage altogether. Centralized exchanges, custodial platforms, and financial products such as ETFs offer exposure to Bitcoin without requiring on-chain interaction. As a result, demand for block space declines even as capital allocation to Bitcoin remains significant.

Taken together, the sustained drop in active addresses suggests Bitcoin’s market structure is evolving. The network is becoming less retail-driven and more concentrated, reinforcing the idea that traditional cycle metrics may be losing some of their explanatory power in this environment.

Bitcoin Price Tests Long-Term Support as Structure Weakens

Bitcoin continues to trade under pressure, with the chart highlighting a clear deterioration in market structure. After failing to sustain prices above the $100K–$110K zone earlier in the year, BTC has entered a corrective phase marked by lower highs and heavy selling momentum. The recent move toward the $87K area places price directly on a critical demand zone, closely aligned with the rising long-term moving averages.

BTC testing critical demand | Source: BTCUSDT chart on TradingView

From a trend perspective, the loss of the short- and medium-term moving averages is significant. The blue and green averages have rolled over, acting as dynamic resistance rather than support, reinforcing the bearish bias.

Price is now hovering just above the red long-term moving average, a level that has historically defined the boundary between bull market corrections and deeper bearish transitions. A clean breakdown below this zone would materially increase downside risk toward the low-$80K region.

Volume behavior adds further context. Selling pressure expanded notably during the sharp drawdown from the highs, while recent bounce attempts have occurred on comparatively weaker volume. This suggests that dip-buying interest remains cautious rather than aggressive. Structurally, the market appears to be consolidating after distribution, not building a strong base yet.

In the near term, holding the $85K–$88K range is crucial. A failure to defend this area would confirm a broader trend shift, while reclaiming the $95K–$100K region is required to neutralize the current bearish structure.

Featured image from ChatGPT, chart from TradingView.com

Binance Receives $347 Million In Bitcoin as Matrixport-Associated Wallets Offload Assets

Bitcoin is once again testing investor conviction as it struggles to reclaim the $90,000 level, a price zone that has now become a clear psychological and structural barrier. After weeks of choppy price action and repeated failures to sustain upside momentum, sentiment across the market has shifted sharply.

Fear and apathy are increasingly dominant, with a growing number of analysts and participants beginning to call for a broader bear market. For many investors, the narrative has changed from buying dips to questioning whether the cycle has already peaked.

This deterioration in confidence is occurring alongside renewed selling pressure from large, well-capitalized players. According to data from Arkham, two wallets linked to Matrixport deposited a combined 4,000 BTC, worth approximately $347.56 million, into Binance today.

Matrixport-Linked Wallet sends Bitcoin to Binance | Source: Arkham

Matrixport is a large digital-asset financial services platform founded by former Bitmain executives, offering products including crypto lending, structured products, asset management, and custody solutions.

Such large inflows to exchanges are closely watched by the market, as they often precede distribution or hedging activity, particularly during periods of heightened uncertainty. While not every deposit translates directly into spot selling, the timing of these transfers adds to the growing sense of caution.

Whether current demand can absorb this supply and stabilize price will likely determine if this phase becomes a deeper correction—or the start of a more prolonged bearish regime.

Exchange Inflows And What They Mean For Bitcoin

Large Bitcoin deposits to exchanges are almost always interpreted by the market as a bearish signal, since they increase the immediate supply available for sale. In most historical cases, sharp spikes in exchange inflows have preceded periods of downside volatility, reinforcing the perception that whales are preparing to distribute into liquidity. However, some investors urge caution when reading this data in isolation, as not every exchange transfer results in spot selling.

In certain scenarios, large inflows can be linked to internal treasury management, collateral rotation, or the opening of hedged derivatives positions rather than outright liquidation. Institutions may move Bitcoin to centralized venues to post margin for futures or options, allowing them to hedge downside risk without selling their underlying holdings.

In other cases, funds prepare liquidity for over-the-counter settlements or cross-exchange arbitrage, activities that do not necessarily translate into sustained selling pressure on the spot market.

Looking ahead, Bitcoin’s price action over the coming months will likely depend on whether these inflows are followed by a clear increase in realized selling volume. If demand continues to absorb supply near the $85K–$86K zone, the market could transition into a prolonged consolidation phase, allowing sentiment to reset.

However, if exchange balances continue to rise alongside weakening spot demand, downside risks remain elevated. In that scenario, Bitcoin may revisit lower support levels before any durable recovery can begin.

Price Tests Critical Long-Term Support

Bitcoin’s higher-timeframe structure shows a clear loss of momentum after failing to hold above prior highs. On the weekly chart, BTC is now consolidating around the $86,000–$87,000 zone after a sharp rejection from the $110,000–$120,000 region. This area has become a critical demand zone, as price is currently hovering near the rising 200-day moving average, which historically acts as a key trend filter during cycle transitions.

BTC consolidates above key MA | Soucre: BTCUSDT chart on TradingView

The short-term structure remains fragile. Bitcoin is trading below the 50-week moving average, which has started to roll over, signaling weakening upside momentum. Meanwhile, the 100-week moving average is still trending higher and sits below the current price, suggesting that the broader macro trend has not fully broken but is clearly under stress.

From a price-action perspective, BTC is forming a lower high relative to the previous cycle peak, while volatility remains compressed. This often precedes a larger directional move. If bulls fail to defend the $85,000 support decisively, the next downside targets sit near the $78,000–$80,000 region, where previous consolidation occurred.

Conversely, any structural recovery would require a reclaim and weekly close above $90,000, followed by sustained acceptance above the 50-week average.

Featured image from ChatGPT, chart from TradingView.com

From Cycles To Continuity: Why Bitcoin’s 4-Year Pattern May Be Breaking

Bitcoin has lost more than 30% of its value since early October, triggering a sharp shift in market psychology. What was once viewed as a routine correction is increasingly being interpreted by analysts as a potential cycle top. Sentiment has deteriorated quickly, with fear and apathy replacing the optimism that dominated earlier in the year.

Many investors are now positioning defensively, preparing for what they believe could be a prolonged bear market phase similar to past post-peak cycles.

However, a recent CryptoQuant report challenges this increasingly popular narrative. According to the analysis, Bitcoin may no longer be following the traditional four-year boom-and-bust cycle that has defined its historical price behavior.

Instead, the report introduces the Bitcoin Supercycle thesis, which argues that the classic halving-driven cycle structure could be breaking down in favor of a more extended, structurally supported bull market.

The core idea behind the supercycle framework is that Bitcoin’s market dynamics have fundamentally changed. Unlike previous cycles driven largely by speculative retail flows, the current environment is shaped by new forces that did not exist in earlier eras.

These structural shifts may be altering how drawdowns, tops, and recoveries unfold, potentially smoothing volatility over longer time horizons.

The New Fundamentals Behind Bitcoin’s Supercycle Thesis

According to the CryptoQuant report, the case for a potential Bitcoin supercycle is built on structural forces that were absent in previous market cycles. The most significant shift comes from institutional adoption. Spot Bitcoin ETFs, led by issuers such as BlackRock, have introduced a persistent and regulated source of demand from traditional finance.

Unlike speculative retail flows, these vehicles treat Bitcoin as a strategic asset allocation, creating steady absorption rather than short-lived hype.

On-chain data further reinforces this narrative. Exchange reserves continue to trend lower, signaling long-term accumulation and reduced sell-side pressure. At the same time, the Spent Output Profit Ratio (SOPR) remains relatively rational. Profit-taking is occurring, but without the euphoric spikes historically associated with cycle tops, suggesting a more mature and disciplined market structure.

Bitcoin Short-Term Holder SOPR | Source: CryptoQuant

Infrastructure readiness is another critical pillar. While Bitcoin remains the core asset, scalability improvements across the broader crypto ecosystem—such as Ethereum’s Fusaka upgrade and the rapid expansion of Layer-2 networks—are enabling faster, cheaper transactions and real-world use cases. This enhances Bitcoin’s role as a settlement and reserve asset within a growing digital economy.

Finally, the macro backdrop remains supportive. Geopolitical instability and the prospect of future monetary easing strengthen Bitcoin’s appeal as a neutral, decentralized hard asset. Together, these forces form a credible foundation for an extended supercycle, though the report cautions that external shocks could still disrupt this trajectory.

Price Action Shows Weak Structure Near Key Support

Bitcoin’s short-term structure remains fragile, as shown on the 4-hour chart. Price continues to trade below the $90,000 psychological level, with repeated failures to reclaim key moving averages reinforcing the bearish bias. The 200-period moving average (red) is clearly sloping downward and acting as dynamic resistance near the $92,000–$93,000 zone, while the 100- and 50-period averages (green and blue) have compressed and rolled over, signaling fading upside momentum.

BTC short-term price range | Source: BTCUSDT chart on TradingView

After the sharp sell-off earlier in the month, Bitcoin attempted a recovery but stalled below descending resistance. Since then, the price has formed a series of lower highs and lower lows, confirming a short-term downtrend. The current consolidation around $86,000–$87,000 suggests indecision, but notably, bounces are becoming weaker, indicating limited demand on relief rallies.

From a technical perspective, the $85,000–$86,000 area represents a critical support zone. A sustained break below this range would likely open the door to a deeper correction. Conversely, bulls would need a decisive reclaim of $90,000, followed by acceptance above the descending moving averages, to meaningfully shift momentum. Until then, the chart favors consolidation with downside risk.

Featured image from ChatGPT, chart from TradingView.com

Bitcoin Structure Turns Bearish As Structural Indicators Flip Negative

Bitcoin is struggling to reclaim the $90,000 level as it continues to test critical demand around the $86,000 zone. After weeks of corrective price action, bulls are finding it increasingly difficult to build a convincing case for trend continuation.

Momentum has faded, upside attempts have been rejected, and market confidence is weakening. As a result, a growing number of analysts are beginning to openly discuss the possibility that Bitcoin is transitioning into a broader bear market phase rather than a temporary pullback within a larger uptrend.

This shift in narrative is supported by structural data. In a recent analysis, Axel Adler highlights that Bitcoin’s price action is now aligned with a clear deterioration in market structure. His chart, which combines a composite Structure Shift signal with a Donchian Channel, shows that the indicator has decisively moved into negative territory.

The Structure Shift composite ranges from -1 to +1, with values below zero signaling bearish regime dominance. Currently, the signal sits near -0.5, a level historically associated with sustained downside pressure rather than short-lived corrections.

At the same time, Bitcoin price has dropped to the lower boundary of the 21-day Donchian Channel and is hovering just above the $85,000 support area. Together, these signals suggest that the market is operating in a risk-off environment, where downside risks remain elevated unless structure improves meaningfully.

Bitcoin Structure Confirms Bearish Regime

Adler notes that the current position of the Structure Shift composite signal confirms Bitcoin has firmly established itself within a bearish structural zone. With the indicator sitting below zero, the market is no longer in a neutral or transitional phase but operating under sustained downside conditions.

According to this framework, the primary trigger for improvement would be a decisive recovery of the composite signal back above the zero threshold, ideally while price continues to hold support within the Donchian Channel. Without that shift, any short-term bounce risks remaining corrective rather than trend-changing.

This bearish structure is reinforced by Bitcoin’s Bull-Bear market structure index, which focuses on derivatives dynamics through fast and slow regime components. The latest data shows the bullish component collapsing to just 5%, an extremely low reading that reflects the near absence of constructive long-side momentum. At the same time, the fast bearish component has moved deeper into negative territory, signaling rising seller pressure driven primarily by the futures market.

Bitcoin Bull-Bear Structure Index | Source: Axel Adler

This configuration highlights a critical imbalance. Short-term momentum is firmly controlled by bears, while spot demand has so far proven insufficient to absorb derivatives-led selling pressure. For conditions to improve, the bullish component of the index would need to recover meaningfully, signaling renewed participation from buyers.

Taken together, both indicators point to the same conclusion: Bitcoin has undergone a local structural shift into bearish territory. The dominant risk remains continued downside pressure driven by derivatives, especially in the absence of strong spot accumulation.

Bitcoin Price Tests Critical Support as Downtrend Persists

Bitcoin continues to trade under clear downside pressure. The price now hovers around the $86,500 level after failing to reclaim higher resistance zones. The chart highlights a decisive breakdown below the short- and medium-term moving averages. With BTC trading well beneath the 50-day and 100-day averages. These levels, which previously acted as dynamic support during the uptrend, have now flipped into resistance. Reinforcing the bearish market structure.

The most notable technical development is Bitcoin’s interaction with the 200-day moving average, shown in red. Price has briefly tested this long-term support but remains fragile, with follow-through buying notably absent. Historically, sustained trading below faster-moving averages while compressing near the 200-day often signals either a prolonged consolidation phase or the risk of an additional leg lower if demand fails to appear.

Structurally, Bitcoin remains in a lower-high, lower-low sequence since the October peak near $125K. As long as price remains capped below the $90K–$95K resistance zone, downside risks persist. For bulls to regain control, BTC must first stabilize above current demand and reclaim key moving averages. Signaling that sellers are losing dominance.

Featured image from ChatGPT, chart from TradingView.com

Why Bitcoin’s Current Weakness Is Structural, Not Emotional

Bitcoin has lost the critical $90,000 level and is now hovering near the $86,000 area, a zone that is quickly becoming the last meaningful support in the current structure. The recent decline has unfolded with little resistance from buyers, as bullish participation has largely disappeared from the market. Momentum-driven demand has faded, spot buying remains weak, and rallies are consistently being sold. As a result, a growing number of analysts are openly shifting their outlook toward a bear market scenario.

According to a recent report by on-chain analyst Axel Adler, conditions beneath the surface reinforce this pessimistic view. Derivatives positioning remains firmly negative, indicating that short sellers continue to dominate short-term market dynamics.

At the same time, market sentiment metrics have fallen to levels historically associated with major capitulation phases. Fear is widespread, confidence is fragile, and risk appetite across crypto markets is clearly deteriorating.

The combination of negative futures positioning and extreme investor fear creates a challenging environment for Bitcoin. Rather than signaling an immediate bottom, these conditions suggest that selling pressure remains structurally embedded in the market.

Futures Positioning And Sentiment Signal Deep Stress

Adler explains that the Bitcoin Positioning Index provides a clear view of who controls the derivatives market. The indicator aggregates changes in open interest and funding rates to identify the dominant direction of futures positioning.

At present, the index sits at -4, firmly in negative territory. This reading corresponds to a bearish regime and aligns with an active downtrend signal. Visually, the chart is dominated by purple bars over the past four weeks, highlighting sustained pressure from short positions and a lack of bullish conviction in derivatives markets.

Bitcoin Positioning Index | Source: Axel Adler

Negative positioning combined with falling prices confirms that bears remain in control of short-term market dynamics. According to Adler, a meaningful regime shift will only occur if the index returns above zero and the price consolidates above local resistance levels. Without that confirmation, downside risk remains elevated.

The Bitcoin Fear and Greed Index reinforces this bearish backdrop. The index, which tracks market sentiment from extreme fear to extreme greed, has fallen deep into the extreme fear zone and well below the 25th percentile.

The 30-day SMA has dropped to 20, while the 90-day SMA sits near 32, signaling persistent sentiment deterioration since September. While extreme fear alone does not guarantee a reversal, its alignment with negative futures positioning suggests that selling pressure is structural rather than purely emotional.

Bitcoin Tests Critical Support As Downtrend Persists

The chart shows Bitcoin trading under sustained technical pressure after failing to reclaim higher levels. Price has decisively broken below the medium-term moving averages and is now consolidating around the $87,000–$88,000 zone, a level that previously acted as support during the mid-cycle advance. The rejection from the blue moving average signals that bullish momentum has weakened significantly, while the downward slope confirms a loss of trend strength.

BTC testing critical demand | Source: BTCUSDT chart on TradingView

More importantly, Bitcoin is now hovering just above the red long-term moving average, a level that historically acts as a key structural support during broader corrections. The recent bounce from the $85,000–$86,000 area suggests that buyers are still present, but the response lacks conviction. Volume remains muted compared to earlier distribution phases, indicating hesitation rather than aggressive accumulation.

Structurally, the sequence of lower highs since the $120,000 peak remains intact. Until Bitcoin can reclaim the $92,000–$95,000 range and hold above the declining mid-term average, downside risks persist. A clean loss of the long-term support could expose deeper retracement levels toward the low $80,000s.

In the short term, this price behavior reflects a market in repair mode. Bitcoin is no longer trending, but it has not yet shown the strength required to invalidate the corrective structure.

Featured image from ChatGPT, chart from TradingView.com

Smart Money Outflow: 14,000 Ethereum Hit the Market As Two Major Holders Exit Positions

Ethereum is trading below the $3,000 level as selling pressure continues to weigh on the broader crypto market. After weeks of unstable price action, ETH has failed to reclaim key psychological and technical levels, reinforcing a fragile market structure.

Sentiment remains decisively bearish, with fear and even apathy starting to dominate trader behavior. Volatility has compressed, participation has thinned, and many analysts are increasingly pointing toward a prolonged bear market scenario extending into 2026.

This lack of conviction is not limited to retail participants. According to data shared by Lookonchain, two large whales dumped a combined 14,000 ETH, worth approximately $40.82 million, in just the past two hours. Such aggressive selling during already weak conditions adds pressure to an asset that is struggling to attract sustained demand.

While isolated whale activity does not define the broader trend on its own, timing matters. Large distributions during periods of low liquidity often amplify downside moves and reinforce negative sentiment across the market.

Ethereum Whale Selling Meets Long-Term Conviction

Arkham data shared by Lookonchain reveals fresh evidence of large-scale selling as Ethereum trades under sustained pressure. Address 0x2802 sold 10,000 ETH, worth approximately $29.16 million, at an average price of $2,915.5 through decentralized exchanges.

Shortly after, another whale, 0x4c0A, offloaded 4,000 ETH, valued at around $11.66 million, distributing the sale across multiple centralized venues, including OKX, Binance, KuCoin, and Gate. The timing and coordination of these moves reinforce the current bearish tone, particularly as liquidity remains thin and broader market sentiment leans defensive.

Ethereum Whale Transactions | Source: Arkham

In the short term, such activity adds to downside pressure and fuels uncertainty among smaller investors, who often interpret whale selling as a signal of deeper weakness ahead. However, price action and sentiment do not tell the full story. Despite the drawdown, Ethereum’s fundamentals continue to strengthen at a pace rarely seen before. Institutional adoption is accelerating, not slowing.

Most notably, JP Morgan recently announced the use of Ethereum to launch its first tokenized money-market fund, a milestone that underscores growing confidence in Ethereum as a settlement and financial infrastructure layer. While markets may remain bearish in the near term, the divergence between price sentiment and fundamental progress is becoming increasingly difficult to ignore.

Ethereum Price Struggles to Hold Key Weekly Support

Ethereum continues to trade under pressure on the weekly chart, with price now sitting around $2,950 after a sharp rejection from the $3,200–$3,300 region. This area previously acted as a key pivot zone and has now clearly flipped into resistance. The inability to reclaim it confirms that sellers remain in control of the medium-term structure.

ETH consolidates around critical support level | Source: ETHUSDT chart on TradingView

From a trend perspective, ETH is consolidating around its 200-week moving average (red line), a historically important level that often determines whether corrections remain cyclical or evolve into deeper bearish phases. So far, this moving average is acting as dynamic support, preventing a more aggressive breakdown. However, momentum remains weak, and upside follow-through is limited.

The 50-week and 100-week moving averages (blue and green lines) are beginning to flatten and converge, reflecting indecision and reduced trend strength. Volume also remains muted compared to prior expansion phases, suggesting that neither strong accumulation nor capitulation is taking place at current levels.

Structurally, ETH remains in a wide consolidation range between $2,500 and $3,300. A weekly close below the $2,800–$2,900 area would expose downside toward the lower end of that range. Conversely, reclaiming $3,300 is required to reestablish bullish momentum. Until then, Ethereum remains technically fragile despite its long-term fundamentals.

Featured image from ChatGPT, chart from TradingView.com

XRP Liquidity Dries Up: Futures Buy Volume On Binance Falls from $5.8B to $250M

XRP has slipped below the $2 level, a psychologically important threshold, as broader market conditions continue to deteriorate and selling pressure weighs on risk assets. While Bitcoin dominates liquidity and investor attention, altcoins are struggling to attract sustained demand, and XRP is increasingly reflecting this imbalance.

According to a CryptoQuant report by Darkfost, the weakness in XRP is not an isolated event but part of a broader contraction across the altcoin market. Whether on spot markets or in derivatives, trading activity has been shrinking significantly over recent months. Liquidity is gradually drying up, signaling a clear retreat from speculative positioning as investors reduce exposure to higher-risk assets.

This trend is especially visible in XRP’s derivatives data. The Taker Buy Volume on Binance, which tracks aggressive buy orders in futures markets, has collapsed to its lowest levels of the year. After peaking above $5.8 billion in July, this metric has fallen to roughly $250 million, representing a sharp 95.7% decline.

XRP Ledger Taker Buy Volume on Binance | Source: CryptoQuant

Such a dramatic contraction highlights the near-total evaporation of buying pressure and underscores the lack of conviction among traders.

XRP Liquidity Compression Signals Downside Risk

According to Darkfost, the broader market context is a major factor amplifying XRP’s current weakness. Liquidations have been accumulating across crypto markets, confidence remains fragile, and many participants are still psychologically impacted by the October 10 event. This lingering stress has reduced risk tolerance, particularly among short-term traders who typically provide liquidity during corrective phases.

Beyond sentiment, altcoins are facing a clear structural headwind. Bitcoin continues to absorb the majority of available capital, both in spot and derivatives markets. As BTC dominance remains elevated, liquidity that would normally rotate into altcoins during recoveries is instead staying concentrated in Bitcoin. This leaves very limited room for a sustained rebound across the broader altcoin market, including XRP.

Within this environment, the sharp collapse in XRP’s Taker Buy Volume is not surprising. The signal becomes even more relevant given that it is unfolding on Binance, which still accounts for the largest share of global XRP trading activity. A sustained drop in aggressive buying on the dominant exchange highlights the depth of demand erosion.

At the same time, the Taker Buy Sell Ratio has remained negative for most of the period, confirming that sellers continue to dominate XRP’s derivatives market. Historically, such severe volume compression can precede volatility expansions.

XRP Ledger Taker Buy Sell Ratio on Binance | Source: CryptoQuant

However, in the current setup, the lack of meaningful buying pressure and persistent bearish positioning suggests downside risks remain elevated. Even ETF-related optimism has failed to offset these structural weaknesses.

XRP Price Struggles Below Key Moving Averages

XRP price action on the 3-day chart reflects a clear loss of bullish structure and growing downside pressure. After peaking above the $3.40–$3.60 zone earlier in the year, XRP has formed a sequence of lower highs and lower lows, confirming a medium-term downtrend. The recent breakdown below the psychological $2.00 level is particularly significant, as this zone previously acted as both support and consolidation.

XRP testing key demand level | Source: XRPUSDT chart on TradingView

From a technical perspective, XRP is now trading below its 50-day and 100-day moving averages, both of which have started to slope downward. This alignment reinforces bearish momentum and suggests that rallies are being sold rather than accumulated. The 200-day moving average, currently near the $1.70–$1.80 area, represents the next major structural support. A sustained move toward this level would not be surprising if selling pressure persists.

Volume dynamics further confirm weakness. Since the August high, volume has steadily declined, indicating fading participation and weak dip-buying interest. The sharp volatility spike in October was followed by distribution rather than continuation, often a sign of a local market top.

As long as XRP remains below $2.00 and fails to reclaim the declining moving averages, the path of least resistance remains to the downside. For any meaningful trend reversal, XRP would need to regain $2.30–$2.50 with expanding volume, signaling renewed demand rather than short-term relief rallies.

Featured image from ChatGPT, chart from TradingView.com

Who Really Sold The Dip? On-Chain Data Exposes Bitcoin’s True Sellers

Bitcoin has retraced to the $85,000 level, a critical support zone that bulls must defend to prevent a deeper breakdown. After failing to reclaim higher levels, price action has slowed and volatility has compressed, reinforcing a market environment dominated by apathy and fear.

Sentiment across the crypto space has deteriorated sharply, with a growing number of analysts openly discussing the possibility of a prolonged bear market extending into next year. In this context, understanding who is actually selling becomes far more important than the price move itself.

According to a recent CryptoQuant report, Bitcoin’s pullback from the ~$88.2K region toward ~$85K provides a clean on-chain read of market behavior beneath the surface. Exchange inflow data segmented by Short-Term Holders (STH) and Long-Term Holders (LTH) shows that the decline was not driven by structural distribution from long-term investors.

Historically, bear markets accelerate when long-term holders begin distributing supply. The absence of that behavior suggests the current drawdown reflects positioning adjustments and risk reduction rather than a collapse in long-term conviction. As Bitcoin tests $85K, the market is not only evaluating price support levels.

Short-Term Profit-Taking, Not Structural Distribution

The CryptoQuant report by Crazzyblockk provides a precise breakdown of who actually drove Bitcoin’s recent pullback. On December 15, when BTC traded near the $88.2K level, Short-Term Holders sent approximately 24.7K BTC to exchanges.

Crucially, 86.8% of this supply was realized in profit, while only 13.2% was sold at a loss. In dollar terms, profitable STH inflows exceeded $1.89 billion, vastly outweighing loss-driven selling. This profile clearly indicates that sellers were primarily near-term buyers exiting from strength, rather than panicked participants capitulating under stress.

Bitcoin Long-Term holder P/L Inflow Volume | Source: CryptoQuant

As the price moved lower on December 16 toward the $86K area, total STH inflows dropped sharply to just 3.9K BTC. Although this smaller flow was realized at a loss, its limited size signals exhaustion rather than an acceleration of selling pressure. While the percentage of loss realization increased, the absolute volume did not—an important nuance often overlooked in surface-level market analysis.

Long-Term Holder behavior reinforces this constructive interpretation. Across both days, LTH inflows remained muted, falling from roughly 326 BTC to just 50 BTC. There is no sign of capitulation or meaningful distribution from this cohort. Overall, the data shows a market cooling through short-term profit-taking, not breaking through structural sell pressure.

Bitcoin Weekly Price Structure and Key Support Dynamics

Bitcoin has retraced sharply from its cycle highs and is now consolidating around the $85K–$88K zone. This area is technically significant. Price is currently interacting with the rising 100-week moving average, which has acted as dynamic support throughout the broader uptrend since 2023. So far, buyers are attempting to defend this level, preventing a deeper weekly close below it.

BTC consolidates around key support level | Source: BTCUSDT chart on TradingView

Structurally, the market has shifted from strong impulsive expansion into a corrective phase. The loss of the 50-week moving average earlier in the pullback signaled a transition from momentum-driven price discovery to consolidation and mean reversion. However, the longer-term trend remains intact as long as Bitcoin holds above the 200-week moving average, currently well below the price.

Volume has declined during the retracement, suggesting that selling pressure is not accelerating aggressively. This supports the view that the move is corrective rather than distributive. From a risk perspective, failure to hold the $85K region would open the door to a deeper retrace toward the low-$70K range.

Conversely, reclaiming the $90K–$92K zone would be required to restore bullish structure and momentum on the weekly timeframe.

Featured image from ChatGPT, chart from TradingView.com

Ethereum Activity Hits 7-Month Low: Active Addresses Drop 32% From August Peak

Ethereum is struggling to regain traction as it continues to trade below the critical $3,200 level, weighed down by persistent selling pressure and growing macro uncertainty. Market sentiment has deteriorated notably in recent weeks, with many analysts increasingly calling for a broader bear market phase.

From a structural perspective, ETH remains below several key technical levels that previously acted as support, reinforcing the perception that downside risks are still present and that bullish momentum remains fragile.

Beyond price action, on-chain data is beginning to confirm this cautious outlook. According to a CryptoQuant report by CryptoOnchain, Ethereum’s network activity has contracted sharply, signaling a meaningful decline in underlying demand. The 7-day Simple Moving Average (SMA) of Active Addresses has fallen to 327,000, marking the lowest reading since May 2025.

This represents a significant pullback from earlier cycle highs and suggests that fewer users are actively interacting with the Ethereum network.

Historically, sustained bullish trends in ETH have been supported by expanding network usage and rising participation. The current decline in active addresses indicates a reduction in network utility, often associated with cooling investor interest and the exit of short-term participants.

Ethereum Network Activity Signals Cooling Demand

According to the CryptoQuant report, the current decline in Ethereum’s Active Addresses represents a sharp pullback from the peak of roughly 483,000 addresses recorded in August. Since that high, network participation has steadily weakened, highlighting a clear loss of momentum in on-chain activity.

This contraction has closely mirrored Ethereum’s market performance over the same period. As active addresses declined, ETH’s price corrected significantly, falling from a cycle high near $4,800 to the current $3,100 area.

Ethereum Active Addresses | Source: CryptoQuant

The simultaneous drop in both price and network activity is a critical signal. It suggests a reduction in demand for block space and points to a potential exit of retail traders or short-term participants who typically drive spikes in transaction activity during strong bullish phases. When fewer users interact with the network, it often reflects lower speculative interest and diminished transactional demand.

In a healthy and sustainable bull market, rising prices are usually accompanied by expanding network usage, with active addresses trending higher as adoption and participation grow. The current divergence from that pattern indicates a cooling ecosystem rather than an acceleration phase.

For Ethereum to establish a durable price reversal, this metric will be essential to watch. A sustained recovery in Active Addresses would be one of the clearest early signals that demand is returning and that the network is regaining fundamental strength.

Ethereum Weekly Price Structure Shows Critical Inflection Zone

Ethereum’s weekly chart highlights a market caught between long-term structural support and unresolved downside pressure. After peaking near the $4,800–$5,000 region earlier in the cycle, ETH entered a prolonged corrective phase that drove price sharply lower. The subsequent rebound from the $1,500–$1,600 lows marked a clear recovery, but the rally has so far failed to transition into a sustained bullish trend.

ETH testing critical level | Source: ETHUSDT chart on TradingView

Currently, ETH is trading near the $3,150 level, hovering around a key confluence zone. Price is interacting with the 100-week and 200-week moving averages, which historically act as pivotal trend-defining levels. While ETH has managed to reclaim the longer-term moving averages, it continues to struggle with follow-through above them, signaling hesitation from buyers at higher prices.

The structure since mid-2024 resembles a broad consolidation rather than a decisive breakout. Each rally attempt toward the $4,000–$4,500 range has been met with strong selling pressure, producing lower highs on the weekly timeframe. Volume has also declined compared to previous impulsive advances, suggesting weaker conviction behind recent rebounds.

From a structural perspective, holding above the $2,800–$3,000 region remains critical. As long as this zone holds, ETH maintains a constructive higher-low relative to the 2022 bottom. However, failure to build acceptance above the moving averages keeps Ethereum vulnerable to extended consolidation or another corrective leg before a clearer trend emerges.

Featured image from ChatGPT, chart from TradingView.com

Why Bitcoin’s Quiet Price Action May Be ‘Dangerous’ – IFP Signals Rising Structural Risk

Bitcoin continues to struggle below the $90,000 level, failing to reclaim higher ground as bulls focus on defending current demand zones. After a sharp correction from recent highs, price action has entered a consolidation phase that, on the surface, appears relatively calm. Volatility has compressed, and short-term price movements suggest a market pausing rather than decisively breaking down. However, this apparent stability may be misleading.

According to a CryptoQuant report from XWIN Research Japan, on-chain data is signaling growing structural risk beneath the surface. The Inter-Exchange Flow Pulse (IFP), a metric that tracks the movement of Bitcoin between exchanges and serves as a proxy for internal market liquidity, has turned red.

In such environments, price moves tend to be sharper and less orderly once direction is established. While reduced exchange balances can limit immediate selling pressure, they also amplify the impact of sudden demand or forced liquidations.

This shift indicates a clear slowdown in capital circulation across trading venues, suggesting that liquidity conditions are deteriorating.

Inter-Exchange Flow Pulse Signals Structural Fragility

The report explains that the Inter-Exchange Flow Pulse (IFP) measures how actively Bitcoin moves from one exchange to another, serving as a proxy for internal market liquidity and capital circulation. When IFP is elevated, capital rotates efficiently across venues, arbitrage opportunities are quickly absorbed, and liquidity providers keep order books deep.

Bitcoin Inter-exchange Flow Pulse | Source: CryptoQuant

In those conditions, price discovery is smoother, and volatility tends to remain contained. By contrast, when IFP declines, the market’s internal “blood flow” weakens. Capital becomes static, liquidity fragments, and prices grow increasingly sensitive to relatively small trades.

This deterioration in liquidity is unfolding alongside historically low exchange balances. While reduced sellable supply can initially act as price support, it also creates thinner order books. Once price begins to move decisively in either direction, slippage increases and volatility accelerates.

With leverage still elevated across derivatives markets, instability becomes driven less by directional conviction and more by the magnitude of forced reactions.

Historically, periods when IFP turned red produced abrupt corrections and sharp price swings, not clean trends. The central risk today is therefore not aggressive distribution, but structural fragility. Until inter-exchange liquidity improves, Bitcoin remains vulnerable to sudden, outsized moves, making leveraged positioning particularly risky in the current market structure.

Bitcoin Price Consolidates Below Key Moving Averages

The 4-hour Bitcoin chart highlights a market locked in consolidation after a sharp corrective move. Following the aggressive sell-off in late November, BTC found a local bottom near the $82,000–$83,000 zone, where strong demand stepped in and triggered a rebound. However, that recovery quickly lost momentum, and price is now ranging below the descending cluster of moving averages.

BTC consolidates in a short-term range | Source: BTCUSDT chart on TradingView

Bitcoin is currently trading around the $89,000–$90,000 level, repeatedly failing to reclaim the 200-period moving average on the 4-hour timeframe. The 50 and 100 moving averages are also sloping downward, acting as dynamic resistance and reinforcing the short-term bearish structure. Each attempt to push higher has been met with selling pressure, suggesting that bulls lack conviction at current levels.

Volume has noticeably contracted during this consolidation phase, indicating reduced participation and indecision among traders. This typically precedes a volatility expansion, especially when price compresses beneath major resistance. Structurally, BTC remains vulnerable as long as it trades below the $92,000–$94,000 zone, which previously acted as support and now caps upside attempts.

On the downside, the $87,000–$88,000 range is emerging as immediate support. A decisive breakdown below this area could reopen the path toward the $84,000 region. Until a clear breakout occurs, Bitcoin remains in a fragile balance between distribution and base-building.

Featured image from ChatGPT, chart from TradingView.com

Major Ethereum Whale Returns: Buys $119M In ETH Amid Market Drop

Ethereum is struggling to regain momentum after failing to reclaim the $3,200 level, keeping the market in a fragile equilibrium. Despite several recovery attempts, price action suggests that bulls are now focused less on pushing higher and more on defending current demand zones. This hesitation reflects broader uncertainty across the crypto market, where traders remain cautious amid tightening liquidity and elevated macro risk.

However, beneath the surface, on-chain activity is beginning to tell a more nuanced story. According to Lookonchain, data sourced from Arkham reveals that a major market participant has re-entered aggressively. The so-called 66kETHBorrow Whale, who previously accumulated 489,696 ETH worth roughly $1.5 billion, has started buying Ethereum again as prices declined.

This behavior stands out because it occurred during weakness rather than strength, a pattern typically associated with strategic accumulation rather than short-term speculation.

Whale activity during drawdowns often signals confidence in higher prices over a longer time horizon, even when sentiment remains fragile. While Ethereum still faces technical resistance overhead, the return of large buyers suggests that demand is weak but has not disappeared.

Whale Accumulation Raises Questions Amid Ethereum Weakness

Lookonchain data provides further insight into the recent actions of the 66kETHBorrow whale, highlighting a sequence that has drawn significant attention from the market. Over the past eight hours, the whale borrowed approximately $85 million in USDT from Aave and transferred the funds to Binance.

Shortly after, he withdrew 38,576 ETH, valued at roughly $119.3 million, from the exchange. This rapid movement of capital during a market pullback has raised questions among smaller investors, many of whom are wondering whether this whale is acting on information or conviction that is not yet reflected in price.

Ethereum Whale Transactions | Source: Arkham

Such behavior is often interpreted as deliberate accumulation, particularly when ETH is withdrawn from exchanges rather than left on trading platforms. Exchange outflows generally reduce immediate sell-side liquidity, reinforcing the perception of long-term positioning. However, it is critical to acknowledge the limits of on-chain visibility. These transactions represent only the wallets that have been publicly identified and tracked.

There is no certainty that this whale’s exposure is fully transparent. He could be holding hedges, short positions, or additional long exposure through other wallets, centralized exchanges, or derivatives markets that are not visible on-chain. As a result, while the activity suggests confidence, it should not be interpreted as definitive directional confirmation.

ETH Price Struggles Below Key Moving Averages

Ethereum is currently trading near the $3,150–$3,200 zone after a modest rebound, but the broader technical structure remains fragile. On the daily chart, ETH continues to trade below its 50-day and 100-day moving averages, both of which are now acting as dynamic resistance. The recent bounce stalled near the declining 50-day MA, highlighting the lack of strong follow-through from buyers.

ETH consolidates below supply zone | Source: ETHUSDT chart on TradingView

The 200-day moving average, positioned closer to the $3,500 area, remains well above current price levels. This reinforces that Ethereum is still in a corrective phase within a larger macro uptrend. As long as price remains below this long-term trend indicator, upside attempts are likely to face selling pressure from both swing traders and systematic strategies.

Price action over the past weeks shows a series of lower highs following the rejection near $4,000 in October, confirming a short-term bearish market structure. However, ETH has so far defended the $2,800–$2,900 support region, suggesting that buyers are still active at lower levels.

For Ethereum to shift momentum decisively, bulls must reclaim and hold above the $3,300–$3,400 range. Failure to do so keeps downside risks open, with a potential retest of prior demand zones if broader market sentiment deteriorates.

Featured image from ChatGPT, chart from TradingView.com

Market Stress Continues As Bitcoin STH SOPR Dips Below 1– When Will The Pain End?

Bitcoin continues to struggle below the $90,000 level, failing to reclaim key resistance as bulls attempt to defend current demand zones. Price action reflects a market under pressure, with momentum fading after a prolonged correction. From its all-time high, Bitcoin has now retraced roughly 30%, placing the asset firmly in a corrective phase where uncertainty and caution dominate trading behavior.

According to a report from Axel Adler, on-chain data confirms that market stress is no longer limited to price alone. Two key indicators—the Short-Term Holder Spent Output Profit Ratio (STH SOPR) and the P/L Block—are signaling broad loss realization among participants and a deterioration in overall market sentiment.

These metrics provide insight into the behavior of short-term holders, who are often the most sensitive to price swings and macro uncertainty. Together, these signals suggest that Bitcoin remains in a fragile state, where confidence has weakened, and recovery attempts face increasing resistance.

STH SOPR and P/L Block Confirm Capitulation Pressure

Adler explains that the Short-Term Holder Spent Output Profit Ratio (STH SOPR) measures whether coins held for less than 155 days are being sold at a profit or a loss. When the indicator falls below one, it signals that recent buyers are realizing losses.

Currently, the 7-day moving average of STH SOPR has slipped into the red zone, with a reading near 0.99. This confirms that short-term holders are, on average, selling Bitcoin below their acquisition price—a behavior typically associated with heightened stress and emotional selling.

Bitcoin Short-Term Holder SOPR Dashboard | Source: Axel Adler

Historically, similar SOPR conditions have marked local capitulation phases, when selling pressure peaks and weaker hands exit the market. As long as the SOPR 7-day average remains below one, short-term participants stay in “stress mode.”

Adler notes that a meaningful improvement would require a sustained move back above one on a daily close, signaling that sellers have exhausted supply and buyers are once again absorbing sell-side pressure.

Complementing this signal, the P/L Block indicator tracks the aggregated profit and loss state of market participants. The current red block reflects loss dominance, with a P/L Score of minus three—classified as pronounced stress.

With Bitcoin down 30% from its all-time high and 30-day returns negative, both indicators align, reinforcing a clear picture of capitulation among short-term holders.

Bitcoin Price Analysis: Weekly Structure Remains Critical

The weekly chart shows Bitcoin trading around the $89,900 level after a sharp rejection from the $120,000–$125,000 region. Price has retraced aggressively but is now attempting to stabilize above the rising 200-week moving average (green), a level that has historically defined long-term trend validity. So far, this area is acting as dynamic support, suggesting that buyers are defending higher-cycle structure despite broader market weakness.

BTC consolidates above key SMA | Source: BTCUSDT chart on TradingView

However, Bitcoin remains below the 50-week moving average (blue), which is now sloping downward. This configuration reflects a loss of medium-term momentum and confirms that the market is still in a corrective phase rather than a resumed uptrend.

The 100-week moving average (red) continues to rise well below price, reinforcing that the broader macro trend remains intact, but also highlighting how much excess was built during the prior rally.

Volume has declined during the recent consolidation, signaling indecision rather than aggressive accumulation. This typically precedes a volatility expansion. From a structural perspective, holding above the $85,000–$88,000 zone is critical. A sustained breakdown below the 200-week MA would increase the probability of a deeper retracement toward the $75,000–$80,000 region.

Conversely, reclaiming the 50-week MA near $95,000 would be an early signal that downside pressure is fading. Until then, Bitcoin remains range-bound, with long-term support holding but momentum still fragile.

Featured image from ChatGPT, chart from TradingView.com

Ethereum Trades Near Whales’ Cost Basis For The Fourth Time Since 2021 – Historic Test

Ethereum is trading above the $3,200 level as bulls attempt to push the price back toward higher resistance zones, but market sentiment remains fragile. Fear and uncertainty continue to dominate as several analysts warn that the broader trend may still point toward a potential bear market. Yet, beneath the volatile price action, key on-chain data is revealing a development that could shape Ethereum’s next major phase.

According to a new report from CryptoQuant, a historic signal tied to the realized price of whales holding more than 100,000 ETH has emerged once again. This metric, which tracks the average cost basis of the largest holders, has only been tested a handful of times over the past five years.

Each instance occurred during decisive turning points in Ethereum’s macro trend. Whenever ETH approached or traded near this realized price, it signaled either the exhaustion of a deep downtrend or the beginning of a strong recovery phase.

Today, Ethereum is once again hovering near this critical threshold. With analysts divided and sentiment weakening, the whale realized price has become one of the most important indicators to monitor. Whether ETH bounces or breaks here may determine the direction of the next major trend cycle.

Whale Realized Price as a Cycle-Defining Threshold

The CryptoQuant report highlights the significance of Ethereum’s proximity to the realized price of whales holding at least 100,000 ETH. According to the analysis, ETH has traded very close to this level only four times in the last five years.

Ethereum Realized Price (Balance > 100K ETH) | Source: CryptoQuant

Two of those instances occurred during the capitulation phase of the 2022 bear market, when selling pressure peaked, and long-term confidence was severely tested. The other two have happened this year, underscoring how unusual and cycle-defining the current environment has become.

What makes this metric particularly important is its historical reliability. In the past five years, Ethereum has never traded below the realized price of these mega-whales. This level has consistently acted as a structural floor, signaling areas where the largest and most sophisticated holders refuse to sell at a loss. Their behavior often marks moments of deep undervaluation or macro exhaustion within the market.

Today, that realized price sits near the $2,500 range, placing Ethereum within striking distance of a level that has repeatedly separated long-term accumulation zones from full-scale trend reversals. If ETH holds above this threshold, it would reinforce the idea that large holders still see long-term value—despite fear dominating broader market sentiment.

Ethereum Attempts Recovery but Faces Major Overhead Barriers

Ethereum’s daily chart shows a market attempting recovery, yet still constrained by significant structural resistance. After rebounding from the sub-$2,900 zone, ETH has reclaimed the $3,200 level and is currently trading near $3,238. While this bounce reflects short-term strength, the broader trend remains fragile.

ETH testing critical resistance level | Source: ETHUSDT chart on TradingView

The price is encountering the 50-day moving average, which has acted as dynamic resistance throughout the decline from September’s peak. ETH briefly pierced above it but failed to secure a strong close, signaling hesitation from buyers.

The 100-day and 200-day moving averages remain well above the current price, reinforcing that Ethereum is still operating beneath major trend markers. These moving averages are likely to form an overhead cluster of resistance between $3,400 and $3,600—an area where sellers previously overwhelmed bullish attempts.

Structurally, ETH is forming a potential higher low, but it has not yet produced a higher high—an essential condition for confirming a trend reversal. A clean breakout above $3,350 would strengthen bullish momentum. Conversely, losing $3,150 risks reopening a path toward $3,000 and potentially retesting deeper support levels.

Featured image from ChatGPT, chart from TradingView.com

Bitcoin On-Chain Signals Delay Bull Thesis: MVRV Model Projects Recovery Next Cycle

Bitcoin has failed to reclaim higher prices, reinforcing the growing belief that the market may be entering a deeper bearish phase. After multiple attempts to push above key resistance levels, BTC continues to trade sideways with declining momentum, reflecting a clear shift in investor sentiment. Fear is rising across the market, and price action has yet to show any convincing signs of recovery.

According to new data shared by Axel Adler, several structural on-chain and market indicators now support a continuation of bearish conditions in the months ahead. Adler’s analysis points to weakening demand, persistent sell pressure, and deteriorating liquidity—factors that historically precede prolonged corrective periods.

While Bitcoin has held above critical support zones, its inability to establish higher highs or sustain rebounds suggests that buyers remain cautious and largely defensive.

Moreover, broader market conditions show similar fragility, with derivatives positioning, stablecoin flows, and long-term holder behavior all signaling reduced conviction. This confluence of factors strengthens the bearish thesis and implies that volatility could intensify before the market finds a meaningful bottom.

Bitcoin MVRV Spread Signals a Deep Bear Phase

Adler’s analysis highlights one of the clearest structural indicators pointing toward sustained bearish conditions: the Bitcoin MVRV Z-Score Bull vs. Bear Market model. Specifically, he notes that the 30-day to 365-day MVRV spread is deeply negative and continues to deteriorate.

This spread measures the difference in profitability between short-term and long-term holders, and when the short-term cohort is underperforming significantly, it traditionally signals risk aversion, exhaustion, and weakening demand.

Bitcoin MVRV Z-Score Bull vs Bear Market | Source: Axel Adler

A crossover—when the 30-day MVRV rises above the 365-day metric—has historically marked the transition from bear markets into new bullish phases. However, Adler stresses that such a crossover does not appear imminent under current conditions. The spread remains far below the threshold required for a structural reversal, reinforcing the view that Bitcoin is still entrenched in a deep bear phase within this model’s framework.

Cycle analogs further support this interpretation. Reviewing past market cycles, Adler estimates that the next likely window for a meaningful crossover sits in the second half of 2026. This implies that even if short-term rallies occur, they are more likely to be counter-trend bounces rather than the early stages of a sustainable bull market. Until the MVRV structure improves, broader sentiment may remain decisively bearish.

Price Struggles to Recover Momentum

Bitcoin continues to move sideways, reflecting a market that remains indecisive and structurally weak. The chart shows BTC trading near $92,000 after its sharp decline from the $120,000 region, with recent candles forming a tight consolidation range. This behavior typically signals a temporary stabilization phase rather than a confirmed reversal, especially given the broader bearish context highlighted by on-chain and macro indicators.

BTC consolidates below $95K | Source: BTCUSDT chart on TradingView

The 50-day moving average sits well above the current price, acting as dynamic resistance and indicating that short-term momentum remains firmly bearish. Likewise, the 100-day and 200-day moving averages trend downward, creating a compression zone that BTC has yet to challenge. Until Bitcoin can reclaim these levels with conviction, rallies may continue to be faded by sellers.

Despite the small rebound from sub-$90,000 levels, buying activity remains muted compared to the heavy sell volume that drove the initial breakdown. This suggests that demand is insufficient to absorb higher-timeframe selling pressure.

Structurally, Bitcoin is forming lower highs and lower lows across the daily timeframe, reinforcing a downtrend. A decisive break below $90,000 would expose deeper liquidity zones near $86,000–$84,000. Conversely, reclaiming $96,000 would be the first sign of strength—but current price action shows no such momentum yet.

Featured image from ChatGPT, chart from TradingView.com

XRP Whale Activity Spikes At The Bottom – A Classic Pre-Rally Signal

XRP has been under clear pressure in recent sessions, sliding toward its lowest price of the year as the broader crypto market continues to absorb heavy selling. Sentiment remains fragile, and many traders have shifted into defensive positioning while awaiting clearer macro signals.

According to a new report from CryptoQuant, however, the underlying picture is more complex than the price chart suggests. Despite the short-term decline, XRP whales are becoming increasingly active, showing no hesitation in trading and accumulating even as retail participation weakens.

This divergence between whale behavior and market sentiment is noteworthy. Historically, XRP’s most significant recoveries have begun during phases of deep pessimism, when large holders quietly build exposure rather than chase rallies.

The latest data confirms this pattern: while price approaches yearly lows, whale-driven transaction volume has risen, signaling that high-value wallets are repositioning rather than exiting.

Whale Accumulation and CVD Shift Signal a Potential XRP Bottom

The CryptoQuant report highlights that the recent surge in whale activity follows a pattern often observed during market bottoming phases. Large holders rarely accumulate aggressively during strong uptrends; instead, they tend to build positions quietly during periods of weakness, when sentiment is poor, and prices are depressed.

Their willingness to buy in the current environment—while XRP trades near yearly lows—suggests strategic positioning rather than speculative momentum chasing.

This behavior is typically interpreted as a pre-rally signal. When whales accumulate into weakness, it indicates confidence that current prices offer value and that the downside may be limited. Historically, such phases have preceded meaningful upside moves in XRP, as whale accumulation often absorbs available sell pressure and stabilizes market structure.

Supporting this view, the report also points to a notable shift in the XRP Spot Taker CVD, which has turned taker-buy dominant. This means that aggressive buyers are now driving more of the executed volume, reflecting strengthening demand in real time. A taker-buy dominant CVD often emerges before sustained rallies, as it highlights increasing willingness among market participants to buy at the ask rather than wait for dips.

XRP Ledger Spot Taker CVD | Source: CryptoQuant

Together, rising whale accumulation and a bullish CVD trend paint an increasingly constructive backdrop for XRP’s medium-term outlook.

Price Analysis: Testing Yearly Lows as Structure Weakens

XRP continues to trade near its yearly lows, with the chart showing a clear deterioration in trend structure. Price remains pinned below all major moving averages—the 50-day, 100-day, and 200-day—indicating that bullish momentum has not yet returned. The persistent rejection at the 50-day moving average throughout November and December highlights the strength of overhead resistance and the absence of sustained buying pressure from the broader market.

XRP consolidates around key level | Source: XRPUSDT chart on TradingView

The $2.00 region, now acting as a key horizontal support, has been tested multiple times over the past month. Each retest shows reduced volatility, suggesting that sellers are no longer driving aggressive breakdown attempts. But demand remains too weak to generate a meaningful rebound. A decisive loss of this level could open the door toward the $1.80–$1.90 support zone. XRP previously consolidated during the early stages of the 2025 rally.

Volume also confirms the broader downtrend. Selling spikes stand out noticeably, whereas buy-side volume remains muted. This imbalance reinforces the prevailing bearish structure, even as whale accumulation begins to appear on-chain.

For XRP to shift out of this downtrend, bulls must reclaim the 50-day moving average and produce higher lows. Until then, the chart signals continued caution. Whale activity must begin translating into visible spot demand, or the risk skews to the downside.

Featured image from ChatGPT, chart from TradingView.com

❌