Reading view

There are new articles available, click to refresh the page.

Are Bears Still in Control? Bitcoin’s (BTC) Shows Downside Signals Despite Fresh Inflows

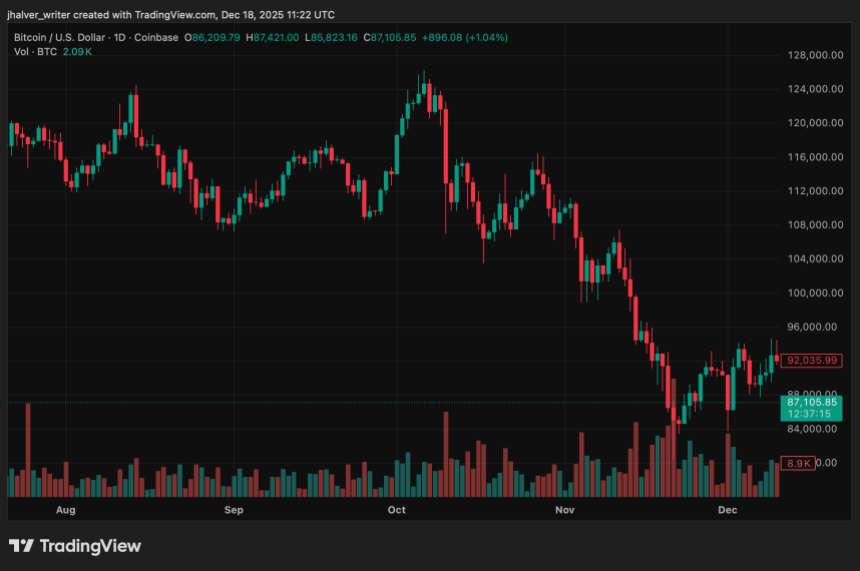
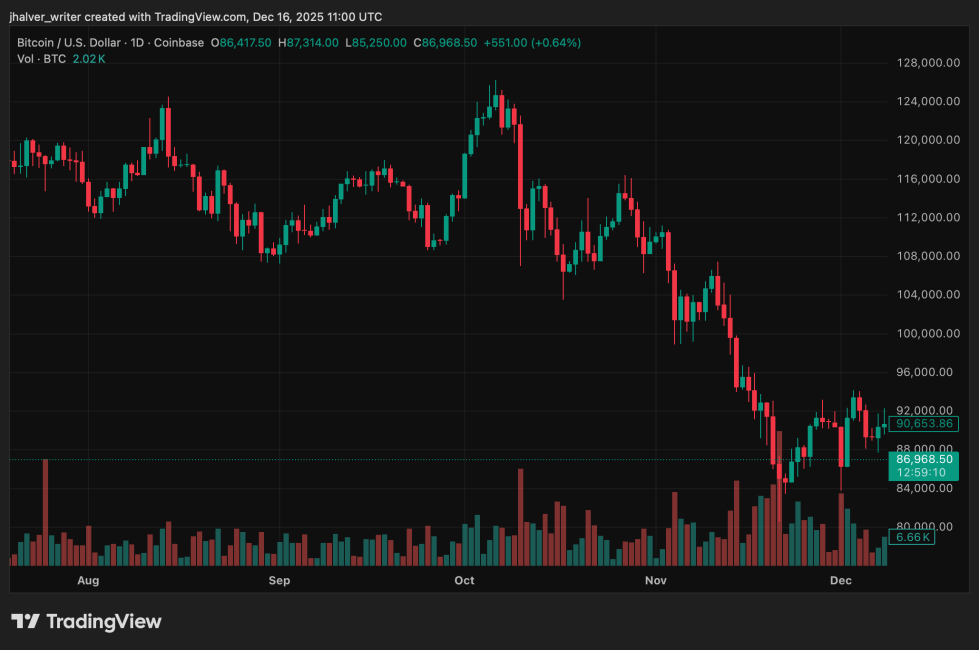
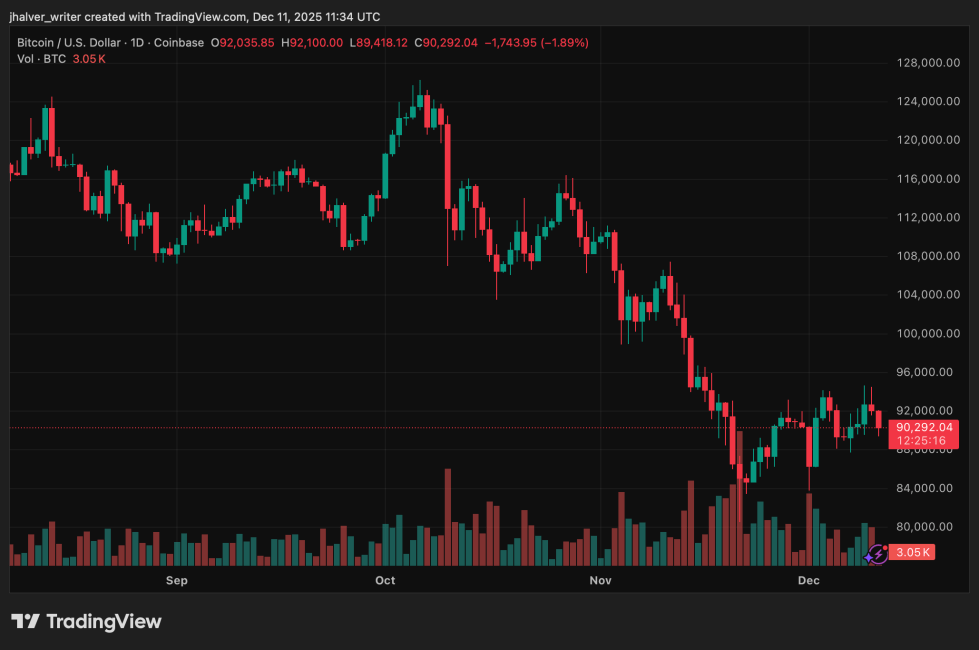
Bitcoin’s (BTC) price action has entered a conflicted phase, with renewed institutional inflows clashing against clear signs of market stress. After peaking above $126,000 earlier this year, the world’s largest crypto has retreated sharply and is now trading more than 30% below its all-time high.

Related Reading: Bipartisan SAFE Crypto Act Unveiled: New Task Force To Combat Digital Asset Scams

While some capital has returned through exchange-traded funds (ETFs), broader market signals suggest that selling pressure and weak participation continue to weigh on sentiment. Consequently, recent weeks have shown that Bitcoin’s recovery attempts remain fragile.

Bitcoin BTC BTCUSD BTCUSD_2025-12-18_12-22-45

Long-Term Holders Drive Persistent Supply Pressure

A major source of downside pressure has been sustained selling by long-term holders. Data from K33 Research shows that roughly 1.6 million BTC that had been dormant for at least two years has been sold since early 2023. In 2025 alone, more than $300 billion worth of long-held Bitcoin has re-entered circulation.

Analysts note that this type of distribution creates gradual, grinding declines rather than sharp capitulation events. With fewer active buyers in the market, the reactivated supply has proven difficult to absorb.

Blockchain data indicates that the past month marked one of the heaviest long-term holder sell-offs in over five years, reinforcing the idea that structural selling remains unresolved.

ETF Inflows Return, But Demand Remains Uneven

Institutional demand has shown brief signs of recovery. U.S. spot Bitcoin ETFs recorded roughly $457 million in net inflows on December 17, snapping a multi-day outflow streak. Fidelity’s Bitcoin fund accounted for the majority of the inflows, with BlackRock also posting gains.

Despite this rebound, ETF activity has been inconsistent. December inflows remain modest compared with earlier in the year, following nearly $3.5 billion in ETF outflows in November.

Market observers say these inflows, while supportive, have not yet been large or sustained enough to offset ongoing sell-side pressure from long-term holders and cautious retail participation.

Technical Signals and Market Structure Favor Bears

From a technical perspective, Bitcoin continues to flash bearish signals. The price has traded within a broad $82,000–$95,000 range for over a month, forming patterns such as an inverse cup and handle on the daily chart. Bitcoin has also slipped below key moving averages, while momentum indicators suggest sellers remain in control.

Recent liquidation events have reinforced this weakness. Around $152 million in Bitcoin positions were liquidated in a single day, and derivatives open interest has declined since the October market crash tied to macroeconomic shocks and tariff-related concerns.

Related Reading: XRP Ledger Adds Military-Grade Security Via Payments Engine Standard

Bitcoin remains caught between sporadic institutional inflows and persistent structural pressure. Until selling from long-term holders eases and liquidity improves, downside risks are likely to remain part of the market’s near-term outlook.

Cover image from ChatGPT, BTCUSD chart from Tradingview

Mixed Signals for XRP as Price Weakness Collides With Bold Analyst Targets

XRP is closing out 2025 caught between two opposing forces. On one side, price action has weakened, technical indicators are flashing caution, and liquidity has thinned as the holidays approach.

On the other hand, analysts continue to publish ambitious upside targets, while fresh narratives around utility, adoption, and yield generation keep the token in focus. The result is a market struggling to reconcile near-term pressure with longer-term expectations.

After spending much of the year underperforming other large-cap cryptocurrencies, XRP has slipped below the closely watched $2 level. That breakdown has sharpened debate over whether the market is entering a deeper correction or simply extending a prolonged consolidation phase.

Ripple XRP XRPUSD XRPUSD_2025-12-18_12-34-04

XRP Price Structure Shows Growing Strain

Technical analysts point to mounting downside risks. XRP has formed what some describe as a higher-timeframe double-top near the $3.30–$3.40 region, with momentum indicators rolling over.

The $1.85–$1.90 zone is now acting as a critical support area. A confirmed break below that range could expose XRP to a deeper pullback toward the $1.60–$1.65 region, aligning with key Fibonacci retracement levels.

Additional on-chain metrics add to the cautious tone. XRP continues to trade well above its realized price, a condition that in previous cycles has preceded mean-reversion pullbacks.

Meanwhile, moving averages and momentum indicators, such as the MACD, remain tilted to the downside, reinforcing the view that sellers retain control in the short term.

Analysts Split Between Caution and Optimism

Despite the weak chart structure, some analysts argue that the broader narrative has not changed materially. Vincent Van Code has noted that while XRP’s price performance disappointed in 2025, there has been no clear fundamental shock to explain the decline.

Legal clarity around Ripple, ongoing institutional interest, and XRPL development remain intact, suggesting the disconnect may be driven more by market structure and liquidity than by fundamentals.

Others are more explicit with upside targets. Analyst Dark Defender, who previously identified the $1.88 support zone, argues that XRP has completed a corrective phase under Elliott Wave analysis.

From that perspective, targets around $5.85 remain possible in the next major advance, though timing depends heavily on broader market conditions.

Utility Narratives and Speculation Add Noise

Beyond price charts, new narratives are complicating sentiment. Reports highlighting XRP-based yield strategies, including mining-related platforms, have circulated widely; however, these claims vary in transparency and risk, and are not directly tied to XRP’s core protocol.

Separately, unconfirmed rumors suggesting that EA Sports may explore XRP for in-game payments have briefly reignited discussion around mass adoption, even as no official confirmation has emerged.

XRP currently sits at an uncomfortable crossroads. Technical pressure is real, downside risks remain, and patience is being tested. At the same time, bold analyst targets and recurring adoption stories ensure the token remains one of the most closely watched assets heading into early 2026.

Cover image from ChatGPT, XRPUSD chart from Tradingview

Federal Reserve Revamps Bank Crypto Rules, Opening New Channels for Digital Asset Trading

The U.S. Federal Reserve has taken a notable step in reshaping how banks under its supervision can engage with crypto, reversing guidance introduced in 2023 that had sharply limited such activities.

The decision reflects a broader reassessment inside the central bank about how regulation should adapt to financial innovation, especially as digital assets continue to intersect with traditional banking infrastructure.

Under the earlier framework, uninsured state-chartered banks were required to follow the same constraints as federally insured institutions in order to remain under Federal Reserve supervision. That approach effectively barred some crypto banks from accessing core payment systems or Federal Reserve membership.

Crypto BTCUSD_2025-12-18_12-22-45

What the Policy Shift Changes for Banks

The new guidance establishes a formal pathway for both insured and uninsured banks supervised by the Federal Reserve to pursue certain innovative activities, including those related to cryptocurrencies.

Institutions will still be required to meet supervisory and risk-management standards, but they will no longer be automatically excluded based on their business models.

For uninsured banks, the implications are significant. Access to Federal Reserve membership would allow direct settlement through central bank payment systems rather than reliance on intermediary banks.

This idea could lower operational frictions for crypto custody, settlement, and related services, potentially expanding the role of banks in digital asset markets without changing existing safety and soundness expectations.

Custodia Case Highlights Regulatory Tensions

The policy reversal has renewed attention on Custodia Bank, a crypto-focused institution whose application for a Federal Reserve master account was denied in part due to the now-rescinded guidance.

Custodia CEO Caitlin Long has argued that the 2023 policy effectively blocked lawful access to the Fed’s infrastructure and welcomed its withdrawal as a correction of past regulatory overreach.

Not all policymakers agree. Federal Reserve Governor Michael Barr dissented from the decision, warning that loosening the framework could undermine a level competitive playing field and encourage regulatory arbitrage.

Michael Barr’s position highlights the ongoing debate within regulatory circles over how to strike a balance between innovation and financial stability.r

Broader Implications for Crypto Markets

While the Fed’s move does not directly change how cryptocurrencies such as Bitcoin or Ethereum trade, it may influence market structure over time. Easier access for banks could support deeper institutional participation, greater liquidity, and expanded custody and settlement options.

For now, the shift signals a more flexible regulatory posture, one that acknowledges the rapid evolution of digital asset markets and the banks that seek to serve them.

Cover image from ChatGPT, BTCUSD chart from Tradingview

Fading ETF Interest Puts Pressure on Dogecoin as Price Approaches Critical Cost-Basis Zone

Dogecoin (DOGE) is approaching a sensitive phase as weakening investor demand, stalled ETF inflows, and growing sell-side pressure converge near a key price area.

Related Reading: XRP Risks Double-Top Crash Toward $0.40, Peter Brandt Warns

Once driven largely by retail enthusiasm, the meme coin is now trading closer to levels where a significant share of holders last acquired their tokens, raising questions about downside risk if confidence continues to erode.

At the same time, isolated whale accumulation and long-term cost-basis data suggest the market is approaching a zone that could define the next major move.

Dogecoin DOGE DOGEUSD DOGEUSD_2025-12-18_12-27-20

Dogecoin ETF Inflows Stall as Sentiment Softens

One of the clearest shifts in Dogecoin’s recent market structure has been the loss of momentum in its exchange-traded funds. Data shows that the Grayscale and Bitwise DOGE ETFs have not recorded any inflows since December 11, with total inflows since launch standing at roughly $2 million.

Combined assets under management are around $5.2 million, representing a negligible fraction of Dogecoin’s overall market capitalization. The muted response contrasts sharply with other altcoin ETFs, particularly XRP and Solana products, which have attracted hundreds of millions of dollars in inflows.

The lack of sustained interest has raised questions about the long-term viability of DOGE-focused funds, especially given their low revenue potential at current asset levels. More broadly, the ETF slowdown reflects a risk-averse environment, with the crypto Fear and Greed Index remaining in fear territory.

On-Chain and Derivatives Data Point to Bearish Bias

Beyond ETFs, on-chain metrics show declining participation from large holders. Wallets holding between 100 million and 1 billion DOGE have reduced their balances by over 1 billion tokens since early December.

Similarly, the proportion of DOGE supply in profit has slipped to near 50%, suggesting fewer holders are sitting on unrealized gains.

Derivatives markets reinforce this cautious outlook. Short positions now account for more than half of open DOGE derivatives, while over $5 million in long positions were liquidated in a 24-hour period. Open interest has also declined, pointing to reduced speculative appetite rather than aggressive dip-buying.

Price Near Key Support as $0.10 Comes Into Focus

Technically, Dogecoin is trading near the $0.123–$0.126 range, an area that has repeatedly acted as support since April.

The price remains below key moving averages, with momentum indicators such as MACD and RSI signaling continued downside pressure. A decisive break lower could expose the psychological $0.10 level.

Related Reading: Ethereum Risks Slide To $2,000 If December Closes Below This Level: Analyst

Analysts have also projected deeper historical support near $0.074, where roughly 28 billion DOGE last changed hands. While a move to that level would require further deterioration in sentiment, current conditions suggest Dogecoin is approaching a cost-basis zone that could determine whether sellers remain in control or longer-term holders begin to step in.

Cover image from ChatGPT, DOGEUSD chart from Tradingview

Analysts Reassess Hyperliquid’s Long-Term Potential as Large-Scale HYPE Burn Comes Into Focus

Hyperliquid (HYPE) is slowly approaching a decisive governance moment as analysts and market participants reassess the protocol’s long-term outlook against the backdrop of a proposed large-scale HYPE token burn.

After months of declining prices and heightened volatility across crypto markets, attention has shifted from short-term price action to structural changes that could improve HYPE’s supply dynamics and investor expectations.

At the center of the debate is a governance proposal by the Hyper Foundation to formally treat all HYPE held in the Hyperliquid Assistance Fund as permanently burned. While these tokens are already locked in an address without a private key, the vote seeks to codify their removal from performance.

If approved, the decision would mark one of the most significant supply reductions in the protocol’s history, removing more than 37 million HYPE, over 10% of circulating supply, through a validator-backed consensus.

Hyperliquid HYPE HYPEUSD HYPEUSD_2025-12-17_12-29-12

Governance Vote Puts Hyperliquid Supply Structure in Focus

The Assistance Fund accumulates HYPE through an automated mechanism that converts trading fees generated on Hyperliquid’s perpetuals exchange into the native token. These tokens sit in a system address that has never been controlled by a private key, making them inaccessible unless a protocol-level upgrade is authorized.

Under the current proposal, validators are being asked to establish a binding social consensus that no such upgrade will ever occur. Voting is stake-weighted, with validators signaling their positions by December 21, and final results are expected on December 24.

Approval would effectively lock in a more restrictive supply model, preventing the Assistance Fund from being used for grants, liquidity support, or emergency measures in the future.

The proposal follows earlier, unadopted discussions around broader supply cuts in 2025, suggesting a renewed effort to clarify HYPE’s long-term monetary framework rather than pursue incremental adjustments.

Market Reaction and Longer-Term Outlook

Hyperliquid (HYPE) has stabilized near the $26 level after several days of losses, with market data suggesting the proposed burn is not yet fully priced in. Futures open interest has climbed above $1.5 billion, and funding rates have turned positive, pointing to growing bullish positioning ahead of the validator vote.

In contrast, spot market activity remains muted, as trading volumes have edged lower and technical indicators continue to reflect lingering bearish momentum.

Beyond short-term price action, analysts are increasingly focused on Hyperliquid’s longer-term valuation framework. Cantor Fitzgerald has cited the protocol’s fee-driven and deflationary design as a potential driver of sustained growth, projecting billions in annual fees if adoption expands.

From this perspective, the Assistance Fund burn is seen as a test of whether stricter supply discipline can help rebuild confidence, with the vote outcome likely shaping how Hyperliquid’s economic model is evaluated into 2026.

Cover image from ChatGPT, HYPEUSD chart from Tradingview

Solana Faces Critical Test Near $100 as Macro Pressure and Network Upgrades Collide

Solana (SOL) is approaching a decisive moment as its price drifts closer to the psychologically important $100 level, caught between weakening market momentum and a series of structural changes unfolding across the network.

Related Reading: Here Are The Meme Coins With Over 100% Rallies While Dogecoin And Shiba Inu Struggle

After more than a year trading within a broad range, recent price action suggests that the long-standing balance between buyers and sellers is under strain. At the same time, macroeconomic uncertainty and technical upgrades are reshaping how investors assess risk around the asset.

SOL has spent much of 2024 and 2025 oscillating between major support and resistance zones, but recent attempts to rebound have been increasingly shallow. Price is now hovering just above key demand areas, with traders closely watching whether these levels can continue to absorb selling pressure.

Solana SOL SOLUSD SOLUSD_2025-12-17_12-33-32

Solana Price Near Key Support as Bearish Signals Build

From a technical perspective, Solana has slipped toward the lower end of its multi-month range, from $145 to $120. Momentum indicators remain weak, with relative strength measures remaining below neutral levels and trend indicators indicating continued downside pressure.

Repeated failures to reclaim former support zones have shifted attention to the $120–$125 area, which has acted as a floor several times in recent months.

A decisive break below this band could expose SOL to a move toward the $100 region, where historical demand clusters sit. Some analysts warn that if selling accelerates and liquidity thins, the price could overshoot that level before stabilizing.

Others note that volume has declined alongside price, suggesting hesitation rather than panic, which leaves room for a short-term bounce if buyers step in.

Macro Signals Add to Uncertainty

Broader economic conditions are adding another layer of complexity. Rising U.S. unemployment and expectations of further Federal Reserve rate cuts have kept markets divided. Lower rates have historically supported crypto assets by improving liquidity, but mixed signals from policymakers have limited risk appetite so far.

For Solana, this means macro optimism has yet to translate into sustained inflows. Traders appear reluctant to commit heavily until there is clearer guidance from the Fed. A dovish shift could support a relief rally, while a pause in easing may reinforce downside risks and keep SOL pinned near current levels.

Network Resilience Meets Long-Term Transition

While price struggles, Solana’s network continues to evolve. The blockchain recently withstood one of the largest DDoS attacks recorded, maintaining transaction speeds with minimal disruption.

Separately, the Solana Foundation has begun testing post-quantum cryptographic signatures, signaling preparation for long-term security challenges.

Related Reading: Bitcoin Speculative Activity Cooling Fast: IFP Shows Steep Slide

These developments underline improving infrastructure resilience, but they have not yet offset near-term market pressure. For now, SOL’s outlook hinges on whether buyers can defend key support as macro conditions and technical signals converge. A clear break or rebound near $100 is likely to define sentiment into early 2026.

Cover image from ChatGPT, SOLUSD chart from Tradingview

Mounting Sell Pressure Hits Ethereum as On-Chain Activity Falls to Seven-Month Lows

Ethereum’s (ETH) recent pullback is starting to reflect more than short-term price volatility. As ETH trades below the $3,000 mark, a combination of heavy liquidations, declining network activity, and sustained institutional outflows is reinforcing concerns about weakening demand.

While prices have so far held above key support levels, multiple indicators suggest that selling pressure remains firmly in place, leaving the market in a cautious holding pattern.

Over the past week, Ethereum has fallen roughly 12%, underperforming several major assets during a broader market correction. The drop pushed ETH briefly toward the $2,850–$2,900 zone, triggering over $200 million in liquidation, one of the largest liquidation events in recent months.

Ethereum ETH ETHUSD ETHUSD_2025-12-17_12-18-42

Network Activity and Ethereum ETF Flows Signal Waning Participation

Beyond price action, Ethereum’s on-chain metrics are showing signs of cooling participation.

Weekly active addresses fell from around 440,000 earlier in the quarter to roughly 324,000 in December, marking the lowest level since May. Transaction counts have also dropped to mid-year lows, pointing to reduced engagement from both retail and institutional users.

At the same time, U.S. spot Ethereum ETFs continue to see persistent outflows. Data from SoSoValue shows more than $224 million exiting ETH ETFs over several consecutive sessions, led primarily by BlackRock’s ETHA fund.

Since mid-December, the total net assets across U.S. spot ETH ETFs have declined by more than $3 billion, suggesting that institutions are trimming their exposure rather than adding to positions. The Coinbase Premium Index turning negative further supports the view that U.S.-based selling pressure has returned.

Whale Selling and Technical Structure Keep Risks Skewed Lower

Large holders have added to near-term pressure. On-chain data shows more than 28,500 ETH sold by a handful of whale wallets within a short period, including transactions exceeding $80 million in total value.

Despite this distribution, ETH has so far avoided a sharp breakdown, with buyers repeatedly defending levels near $2,880.

From a technical standpoint, Ethereum remains in a medium-term downtrend. Price continues to trade below key moving averages, while momentum indicators such as RSI remain below neutral levels.

Related Reading: Bitcoin ‘Death Cross’ Panic Returns: History Says It’s A Late Signal

Resistance is clustered between $3,050 and $3,120, and failure to reclaim that zone leaves ETH vulnerable to another test of $2,800. If that support gives way, analysts point to the $2,400–$2,600 range as the next area of interest.

Cover image from ChatGPT, ETHUSD chart from Tradingview

Russia Draws Firm Line on Digital Assets, Keeping Crypto Out of Domestic Payments

Russia has reiterated its firm stance on crypto, drawing a clear distinction between digital assets and traditional currency. While global debate continues over whether crypto can coexist with national currencies, Russian lawmakers are reinforcing a long-held view.

Inside the country, payments remain the sole domain of the ruble. The position comes as crypto usage grows worldwide and as Russia experiments with alternative settlement tools for cross-border trade under pressure from sanctions.

At the center of the latest comments is Anatoly Aksakov, chair of the State Duma Committee on Financial Markets and a key figure behind Russia’s crypto legislation. Speaking to state media, Aksakov said there is no ambiguity in the law.

Bitcoin BTC BTCUSD Crypto BTCUSD_2025-12-17_12-14-05

Lawmakers Reinforce Ruble-only Payment Rule

In Russia, cryptocurrencies such as Bitcoin and Ethereum can be held or traded as investments, but they are not permitted to function as a means of payment in domestic commerce, according to lawmaker Anatoly Aksakov. All payments for goods and services must continue to be settled in rubles.

Aksakov’s remarks restate provisions introduced in Russia’s 2020 digital assets law, which removed cryptocurrencies from any form of legal tender. Lawmakers argue that money must be issued and controlled by the state, and private digital currencies do not meet that standard.

Officials say there are no plans to soften this stance. The rule applies across retail, online services, and business contracts, closing the door on crypto payments regardless of adoption trends or market conditions.

Central Bank Skepticism Shapes Policy

The Bank of Russia continues to play a decisive role in this approach. Governor Elvira Nabiullina has long warned that cryptocurrencies pose risks to financial stability and consumer protection.

The central bank has consistently opposed using crypto as a medium of exchange and has previously pushed for broad restrictions on exchanges and transactions.

This position has led to years of friction with the Ministry of Finance, which favored regulation and taxation over outright limits. While several legislative proposals emerged from that debate, none altered the core prohibition on crypto payments. Today, policymakers appear to be aligned in preserving the ruble’s monopoly.

Cross-Border Use Grows Despite Domestic Ban

Although crypto is barred from internal payments, Russian authorities acknowledge its growing role in international trade. Businesses are permitted to use digital assets for cross-border settlements under an experimental legal regime, a workaround that has gained traction amid global financial restrictions.

Officials estimate that billions of dollars’ worth of trade has already moved through such channels. Similarly, Russia has legalized cryptocurrency mining and is tightening oversight of the sector, underscoring a split strategy, limited use abroad, and strict control at home.

That divide alone defines Russia’s crypto policy. Digital assets may serve as investment tools or external settlement instruments, but inside the country, the ruble remains the only means of payment.

Cover image from ChatGPT, BTCUSD chart from Tradingview

Market Pullback Accelerates After Senate Postpones Long-Awaited Crypto Framework Bill

The market entered a sharper pullback this week after the Senate confirmed that a long-anticipated crypto structure legislation will not advance before the end of the year.

Related Reading: Crypto Market Structure Bill Stalled: Senate Banking Committee Pushes Markup To Early 2026

What many investors had hoped would be a closing act for regulatory clarity in 2025 instead became another extension of uncertainty, triggering risk-off behavior across digital assets and related investment products. The delay arrived at a fragile moment for markets grappling with growing sensitivity to policy signals from Washington.

Bitcoin slid below the $86,000 level, while the broader digital asset market shed roughly $140 billion in capitalization within hours. The total market value has fallen to around $2.93 trillion, its lowest level in several weeks, as traders reassessed regulatory timelines that now extend into early 2026.

Crypto Bitcoin BTC BTCUSD BTCUSD_2025-12-16_12-00-50

Senate Pushes Crypto Market Structure Talks Into 2026

The Senate Banking Committee confirmed it will not hold a markup hearing on the crypto market structure billbefore Congress adjourns for the holidays.

While committee leadership says bipartisan negotiations are progressing, lawmakers acknowledged that time has run out to move the bill forward in 2025. Chairman Tim Scott’s office reiterated that discussions with Democratic counterparts are ongoing, with a markup now expected in early 2026.

The proposed legislation is designed to clarify how digital assets are regulated in the U.S., including defining the respective roles of the Securities and Exchange Commission and the Commodity Futures Trading Commission.

Under current drafts, the CFTC would oversee spot crypto markets, while securities laws would be more clearly applied to token issuers and intermediaries. Parallel efforts in the Senate Agriculture Committee, which also oversees the CFTC, have yet to reach a markup stage, further slowing the process.

Market Reaction Highlights Fragile Sentiment

The legislative setback quickly translated into market pressure. Bitcoin fell from near $90,000 to the mid-$85,000 range, while Ethereum dropped below $3,000. Additionally, the average crypto RSI fell to around 32, indicating that the market is within oversold territory.

Analysts pointed to elevated derivatives positioning and heavy open interest around key price levels as factors amplifying downside moves. Exchange-traded products reflected the shift, with Bitcoin and Ethereum spot ETFs recording significant outflows as institutional investors reduced exposure.

Some market observers noted that unrealized losses have risen sharply, while funding conditions and leverage remain stretched, making prices more vulnerable to negative catalysts such as policy delays.

Regulatory Uncertainty Persists Despite Agency Actions

Despite the legislative pause, regulators have continued to act within existing frameworks. The SEC has issued staff guidance and hosted public discussions on how current securities laws apply to crypto activities, while the CFTC has taken steps to expand supervised spot market participation.

However, industry participants say these measures fall short of the comprehensive clarity the market structure bill is meant to deliver.

Related Reading: Terra Founder Do Kwon Could Face 30-Year Sentence In Potential South Korean Trial

The Senate’s decision reinforces a familiar pattern for crypto markets: policy delays translating into heightened volatility. With negotiations set to resume in early 2026, investors will be left to navigate another extended period where regulatory questions remain unresolved.

Cover image from ChatGPT, BTCUSD chart on Tradingview

HBAR Consolidates Near Lows While Analysts Map Potential Short-Term Bounce Scenarios

Hedera’s HBAR token is trading near its lowest levels in more than a year, reflecting both broader crypto market weakness and project-specific headwinds.

After a steady decline through November and December, HBAR has slipped into a tight consolidation range, with traders debating whether the current pause marks a base for a short-term rebound or a continuation of the downtrend.

Recent price action indicates growing activity around key technical levels, despite mixed fundamental indicators.

HBAR Hedera HBARUSD HBARUSD_2025-12-16_11-53-59

HBAR Slides to Multi-Month Lows as Selling Pressure Builds

HBAR fell to around $0.11–$0.12 this week after failing to hold above the $0.125 support zone, a level that had acted as a floor several times earlier in the year. The drop coincided with a wider market pullback, as Bitcoin and major altcoins weakened ahead of global macro events, including Senate decisions in the U.S.

Trading data shows that volume surged sharply during attempts to reclaim resistance near $0.119–$0.120, suggesting active distribution rather than sustained accumulation.

Market structure has turned decisively bearish over recent sessions. HBAR is now trading below key moving averages, and momentum indicators such as RSI and MACD continue to point lower.

On-chain and ecosystem data have also weighed on sentiment, with Hedera’s total value locked declining significantly from earlier highs and stablecoin supply on the network shrinking over recent months.

Volume Spikes Show Key Support and Resistance Zones

Despite the broader downtrend, recent volume patterns have drawn attention from short-term traders. During one session, HBAR volume jumped more than 80% above its daily average as the price tested resistance near $0.119.

The rejection triggered another wave of selling, but late-session activity showed renewed buying interest as the price approached the $0.112–$0.113 area. This zone is now viewed as immediate support, with a deeper psychological level around $0.10 acting as the next downside reference if selling resumes.

On the upside, analysts are watching $0.119–$0.122 as a critical resistance band. A clean break above this range would be needed to shift short-term structure and open the door for a move toward prior highs near $0.13.

Analysts Split Between Oversold Bounce and Further Downside Risk

Some technical analysts argue that HBAR is approaching oversold conditions, noting weakening bearish momentum and signs of trendline breaks on lower timeframes. These signals have fueled short-term bounce scenarios targeting the mid-$0.12 to $0.14 range, provided support continues to hold.

Others remain cautious, pointing to stalled demand for recent Hedera-linked investment products and slowing ecosystem growth. From this view, failure to defend current levels could expose HBAR to a retest of $0.10, a level last seen during earlier liquidation events.

Cover image from ChatGPT, HBARUSD chart from Tradingview

ADA Enters Critical Phase as Cardano Price Slips Back to Multi-Year Support Levels

Cardano’s ADA token has returned to a familiar but uncomfortable zone. After months of lower highs and failed recovery attempts, the price has slid back toward long-term support levels that have defined its structure for more than two years.

The move comes amid a broader market pullback, as risk appetite weakens across equities and crypto, but ADA’s decline is also being shaped by internal technical signals that traders are finding hard to ignore.

ADA currently trades near $0.38–$0.39, down approximately 5.57% over the past 24 hours. That drop places the token close to a multi-year ascending support trend line that has held for nearly 900 days.

Cardano ADA ADAUSD ADAUSD_2025-12-16_11-14-12

Derivatives and Positioning Point to Caution

Market data indicate that traders are stepping back rather than leaning into the decline. Futures open interest in ADA has decreased by approximately 11% to around $670 million, indicating that positions are being closed rather than expanded.

Funding rates have also softened, with more than 55% of tracked positions now skewed to the short side. Together, these metrics point to reduced confidence in a near-term rebound and a market that is positioning defensively.

This caution is not isolated to Cardano. Altcoins across the board have come under pressure as investors adopt a risk-off stance ahead of key U.S. macroeconomic data, including inflation and labor reports, and as concerns surrounding the AI sector spill over into correlated assets like cryptocurrency.

Technical Structure Near a Breaking Point

On the charts, ADA’s structure remains fragile. The token recently lost the $0.53 horizontal support, confirming a bearish shift on higher timeframes.

Momentum indicators reflect that change. The RSI is below 50, and the MACD remains in a negative position. Recent price action looks corrective rather than impulsive, suggesting the latest bounce may already have run its course.

ADA is still hovering near its long-term diagonal support, but a clean breakdown would likely alter the outlook materially. Some analysts warn that, if this trend line fails, the price could retrace much deeper, potentially toward levels last seen during the previous bear market.

Long-Term Targets Contrast With Short-Term Risk

Despite the weak near-term picture, longer-term projections remain divided. One technical analyst has argued that ADA’s current consolidation resembles a prolonged corrective phase similar to the setup seen before its 2020 breakout, outlining upside targets ranging from the $5 area to above $10 in a full bull scenario.

However, those views hinge on the market first stabilizing and reclaiming key resistance zones. For now, ADA’s focus is simpler. The token is at a critical phase, with long-term support under pressure and sentiment cautious. Whether this level marks a base or a breakdown will likely shape Cardano’s trajectory into 2026.

Cover image from ChatGPT, ADAUSD chart from Tradingview

Dogecoin’s Selloff Tests Long-Held Beliefs as Traders Debate Capitulation or Reset

Dogecoin’s (DOGE) latest selloff has forced traders to confront a question that has followed the meme coin since its peak years. Is this another temporary washout, or a deeper reset in how the market values DOGE?

Related Reading: XRP Hasn’t Entered A Bear Market Yet; Analyst Shares Why

Over the past 24 hours, Dogecoin slipped sharply below levels that had held through weeks of consolidation, erasing a sense of stability that many participants had grown accustomed to. The move unfolded without a single defining catalyst, instead reflecting broader weakness across higher-beta crypto assets.

At the same time, DOGE’s highly visible online presence has remained active, creating a contrast between weakening price action and persistent cultural relevance.

Dogecoin DOGE DOGEUSD DOGEUSD_2025-12-16_11-36-12

Breakdown Below Key Support Shifts Short-Term Structure

In the past 24 hours, Dogecoin (DOGE) fell about 5.5%, sliding from roughly $0.1367 to near $0.129, and briefly trading as low as $0.1266.

The drop pushed the price below the $0.1370 and $0.1300 support zones, levels that had defined the lower boundary of its recent range. Trading volume surged to around 1.36 billion tokens, more than 180% above average, suggesting the move was driven by active selling rather than gradual drift.

Technically, DOGE is now trading below its 100-hour simple moving average, with a bearish trend line forming near $0.1340. Attempts to reclaim $0.1300 have so far failed, reinforcing that level as immediate resistance.

Market participants note that once intermediate supports gave way, bid depth appeared thin, allowing the DOGE price to move lower with limited pauses.

Sentiment Signals Clash With Weak Dogecoin Price Action

Despite the selloff, Dogecoin remains a popular online presence. The official Dogecoin ecosystem account recently acknowledged renewed public endorsements, including comments from a high-profile entrepreneur, and resurfaced cultural callbacks tied to DOGE’s 2021 run.

From a positioning standpoint, Dogecoin remains significantly below its all-time high and has declined sharply on a year-to-date basis. Open interest has also declined significantly from earlier 2025 peaks, pointing to reduced speculative participation.

For some traders, this is evidence of capitulation; for others, it signals a quieter phase where excess leverage and hype are being flushed out.

Levels That Now Matter for Traders

In the near term, market focus is centered on the $0.1290–$0.1280 zone. Holding above this area could allow DOGE to consolidate, while a sustained break lower may expose support near $0.1250 and potentially the $0.1200 region.

On the upside, a reclaim of $0.1300 would be the first indication that downside momentum is easing, though former supports above $0.1340 remain key hurdles.

Related Reading: US Bitcoin Session Leads December Returns After Weak November

Whether this move marks the end of an era or a broader reset remains to be seen. For now, Dogecoin remains in a fragile stabilization phase, where confirmation, rather than conviction, is driving trading decisions.

Cover image from ChatGPT, DOGEUSD chart from Tradingview

Japan’s Crypto Policy Shift Raises Questions for the Market Ahead of Key Macro Decisions

Japan is quietly reimagining how digital assets fit into its financial system, and the timing is drawing attention. While global markets are already sensitive to upcoming macro decisions from the Bank of Japan (BoJ), Tokyo is advancing parallel reforms that touch crypto regulation, taxation, and broader liquidity conditions.

Related Reading: Ex-Terra Insider Calls Do Kwon Case ‘Backwards’ In Explosive X Thread

Together, these moves are forcing investors to reassess how Japan may influence crypto markets in the months ahead, not just through headlines, but also through structural changes.

The Financial Services Agency (FSA) has outlined plans to shift crypto oversight away from the Payment Services Act toward the Financial Instruments and Exchange Act.

Bitcoin BTC BTCUSD BTCUSD_2025-12-15_12-00-09

Crypto Moves From Payments to Investment Rules

Under the proposed framework, cryptocurrencies would be treated more explicitly as financial products rather than payment tools. Oversight would move under securities-style rules, aligning crypto trading closer to traditional investment markets.

The FSA has emphasized stronger investor protection, particularly around token offerings. Exchanges handling initial exchange offerings would be required to provide detailed disclosures, including the identities of issuers, token distribution methods, and independent code audits.

The framework mirrors elements seen in the EU’s MiCA regime and South Korea’s crypto laws, including explicit bans on insider trading and tighter controls on unregistered or overseas platforms serving Japanese users. Rather than signaling deregulation, the shift suggests Japan is standardizing its crypto space.

Tax Reform Sends a Different Signal

Alongside tighter oversight, Japan is preparing a significant tax reform. Crypto gains, currently taxed as miscellaneous income at rates that can reach 55%, are set to move to a flat 20% rate. This would place digital assets on similar footing with stocks and other capital assets.

The proposal reflects years of pressure from investors and startups, who have argued that punitive taxation has pushed activity offshore.

While the regulatory net tightens, the tax cut points toward an effort to keep capital and innovation within Japan, potentially improving long-term participation rather than encouraging short-term speculation.

Macro Pressure Still Shapes Market Behavior

Despite policy shifts that appear supportive on paper, market reaction has been muted. Assets such as XRP have remained range-bound even amid Japan-related developments, reflecting low volumes and liquidity fragmentation rather than enthusiasm or fear.

Similarly, macro forces loom larger. The BoJ is expected to hike rates later this month, a move that has historically coincided with risk-off behavior in crypto as yen liquidity tightens. Japan is also preparing to offload over $500 billion in ETFs at a slow pace, underscoring policymakers’ caution about destabilizing markets.

Related Reading: Bitcoin Makes The Cut As Brazil’s Largest Private Bank Issues 2026 Guidance

Japan’s crypto policy reset looks less like a catalyst and more like a backdrop. Whether it ultimately supports prices may depend less on regulation itself and more on how liquidity, rates, and risk appetite settle once key macro decisions are out of the way.

Cover image from ChatGPT, XRPUSD chart from Tradingview

Bitcoin Starts the Week Under $90K While Investors Await Key U.S. Data and Global Policy Clarity

Bitcoin (BTC) began the new trading week on the back foot, slipping below the $90,000 mark as investors adopted a cautious stance ahead of a dense slate of U.S. economic data and key global central bank decisions.

After reaching an all-time high of $126,000 in October, the world’s top cryptocurrency has struggled to regain momentum, instead entering a period marked by tight ranges, low volatility, and subdued trading volumes.

Market movers appear reluctant to commit to new positions as uncertainty builds around the direction of macroeconomic trends. Bitcoin was trading near $89,600 during early Monday sessions, extending weekend losses and reflecting a broader risk-off mood across global markets.

Bitcoin BTC BTCUSD BTCUSD_2025-12-15_12-00-09

Bitcoin Volatility Compresses as Technical Levels Tighten

Bitcoin’s recent price behavior has been defined by historically low volatility, with the asset hovering in a narrow band just below $90,000.

Analysts note that such compression often precedes a sharper move. Technical analyst Aksel Kibar has identified a critical setup on the daily chart, suggesting that a decisive breakout or breakdown could be imminent.

On the downside, failure to hold current levels could open the door to a decline toward the $86,000 area, with deeper support seen between $73,700 and $76,500. On the upside, a sustained break above resistance near $94,600 could shift momentum and put the $100,000 level back into focus.

Other traders have echoed calls for patience, advising investors to wait for a confirmed move outside the current range before taking positions.

On-Chain Signals and Liquidity Raise Caution

Beyond chart patterns, on-chain data has reinforced a more cautious outlook. Analysts at CryptoQuant have highlighted weakening demand and selling pressure near key moving averages, suggesting that recent rebounds have lacked conviction.

Declining liquidity following the Federal Reserve’s recent rate cut has also weighed on Bitcoin and the broader crypto market, according to market makers.

Still, not all signals are uniformly bearish. Data from Glassnode shows that some digital asset treasury firms have quietly resumed Bitcoin accumulation, despite prices struggling to stabilize. This mixed backdrop underscores the market’s current indecision.

Macro Data and Central Banks in Focus

Attention now turns to a busy macroeconomic calendar. Investors are watching delayed U.S. jobs data, inflation reports, retail sales figures, and flash PMI readings for clues on growth and interest rate expectations. Speeches from Federal Reserve officials later in the week could further influence sentiment.

Globally, central bank meetings add another layer of uncertainty. Decisions from the European Central Bank, Bank of England, and especially the Bank of Japan, where a rate hike is widely expected, are being closely monitored for their impact on global liquidity.

With volatility compressed and key catalysts approaching, Bitcoin appears poised at a crossroads as markets await clearer signals on economic and policy direction.

Cover image from ChatGPT, BTCUSD chart from Tradingview

Why XRP Isn’t Reacting to Major Institutional and Regional Developments

XRP has spent the past several weeks moving sideways around the $2.00 level, even as headlines around Ripple and the broader XRP ecosystem continue to stack up.

Related Reading: Dogecoin Holds Demand Zone Above $0.13, What A Bounce Would Do

From a $300 million venture fund expansion into South Korea to nearly $1 billion in spot ETF inflows and fresh regulatory approvals, the backdrop appears supportive on paper.

However, price action tells a different story. Instead of responding to institutional traction and regional growth, XRP remains locked in a tight range, reflecting a disconnect between developments and market behavior.

Ripple XRP XRPUSD XRPUSD_2025-12-15_12-37-32

Institutional Growth Isn’t Translating Into Token Demand

Ripple’s expansion into South Korea through a $300 million venture fund has drawn attention due to the involvement of well-established, Seoul-based asset managers.

However, market participants are increasingly viewing this move as tied to Ripple’s corporate strategy and potential IPO positioning, rather than direct demand for XRP. Institutional investors tend to prioritize predictable cash-flow or equity-style exposure, limiting the immediate impact such initiatives have on the token’s market dynamics.

A similar pattern is visible in the ETF market. Spot XRP ETFs have recorded roughly $990 million in inflows over 30 consecutive days, making them one of the fastest-growing crypto fund segments.

Despite this, XRP has fallen more than 12% over the past month. Analysts note that ETF inflows do not always translate into spot market pressure, especially when liquidity is fragmented or offset by broader risk-off sentiment across crypto assets.

Technical Pressure and Broader Market Headwinds

From a technical standpoint, XRP remains under pressure. The price has retraced to key Fibonacci levels after falling from its yearly high near $3.65.

Chart patterns such as a developing death cross and a double-top formation point to downside risk, with support levels around $1.63 and $1.50 in focus if selling continues. Traders describe the current phase as bearish consolidation, with strong resistance clustered between $2.00 and $2.20.

These conditions mirror weakness across the wider crypto market. Bitcoin’s decline from earlier highs and drawdowns in major altcoins have reduced risk appetite, often pulling XRP lower regardless of asset-specific news.

Liquidity, Bots, and Muted Price Response

Market structure may also be playing a role. Analysts point to low trading volumes and heavy arbitrage activity as factors keeping XRP pinned near psychological levels.

In thin markets, automated strategies tend to fade moves quickly, preventing follow-through. While some data suggests tokens are gradually moving off exchanges, signaling longer-term holding, short-term price discovery remains dominated by macro flows and Bitcoin-led volatility.

Related Reading: Dogecoin (DOGE) Slides Deeper Into Red—Is a Bottom in Sight?

Currently, XRP’s lack of movement reflects market mechanics more than a judgment on progress within its ecosystem. Until volume and liquidity shift decisively, headlines alone may not be enough to move the price.

Cover image from ChatGPT, XRPUSD chart from Tradingview

Ethereum Price Compression Deepens as Analysts Debate if the Next Move Is a Rally or Breakdown

Ethereum (ETH) has entered another period of tight price compression, a phase that has left traders split between expectations of a renewed rally and concerns about a deeper correction.

As of December 15, the Ethereum price trades near the $3,100 level, drifting sideways after several failed attempts to reclaim higher resistance zones. The narrowing range reflects hesitation across the market, with declining volumes, mixed technical signals, and contrasting institutional activity.

Despite modest intraday fluctuations, Ethereum’s broader structure shows a market waiting for direction. Trading activity has slowed compared to earlier in the year, suggesting reduced speculative participation rather than heavy distribution.

Ethereum ETH ETHUSD ETHUSD_2025-12-15_12-26-42

The Ethereum Price Key Levels Define the Short-Term Outlook

Support near the $3,020–$3,000 zone remains critical. This area has been tested multiple times and continues to act as a floor for price action.

A sustained break below it would likely expose the Ethereum price to a deeper pullback, with some analysts pointing to demand zones closer to $2,900 or even the $2,600–$2,500 range if downside momentum accelerates.

On the upside, resistance between $3,150 and $3,400 continues to cap recovery attempts. Ethereum remains below major moving averages and a descending trendline that has guided price action since November.

Analysts note that a daily close above this resistance band, supported by rising volume, would be required to shift the current corrective bias and signal a trend change.

Diverging Technical Signals Add to Uncertainty

Technical interpretations remain mixed. Elliott Wave analysts argue Ethereum may be approaching a potential Wave 3 phase, which historically has coincided with strong upward moves.

However, others highlight the lack of demand strength and repeated rejections near resistance as signs that upside moves remain corrective rather than impulsive.

On-chain data adds another layer of complexity. Liquidation heatmaps reveal dense clusters above current prices, particularly in the $3,400–$3,700 range, suggesting a potential magnet for price if momentum builds.

At the same time, thinner liquidity below current levels implies that a downside sweep could occur before any sustained rally develops.

Institutional Flows Contrast With Price Stagnation

While the Ethereum price action remains compressed, institutional involvement continues to grow. U.S. spot Ethereum ETFs recorded roughly $209 million in net inflows during the past week, led by BlackRock’s ETHA.

Separately, BitMine Immersion Technologies has continued accumulating Ether, now holding a sizable share of the circulating supply as part of a long-term treasury strategy.

This contrast between steady institutional accumulation and cautious market pricing underscores the current stalemate. For now, Ethereum remains caught between strong long-term narratives and unresolved short-term technical pressure, with a clear breakout or breakdown likely to determine sentiment in the weeks ahead.

Cover image from ChatGPT, ETHUSD chart from Tradingview

Solana Gains Institutional Momentum as New On-Chain Bond Deal and XRP Integration Build Hype

Solana (SOL) is gradually entering a new phase of institutional visibility as recent developments in tokenized finance and cross-chain asset integration draw increasing attention to the network.

Related Reading: What’s Happening With The Bitcoin, Ethereum, And Dogecoin Prices Recently?

From a high-profile commercial paper issuance to plans for bringing XRP onto Solana, the blockchain is positioning itself at the center of experiments that could reshape how digital assets interact with traditional markets.

Solana SOL SOLUSD SOLUSD_2025-12-12_12-11-59

Institutional Activity Accelerates With New Tokenized Bond Deal

J.P. Morgan’s arrangement of a $50 million tokenized commercial paper issuance for Galaxy Digital marks one of the clearest signals yet that major financial institutions are warming to public blockchain infrastructure.

The short-term debt instrument was issued on Solana, with Coinbase and Franklin Templeton purchasing the tokenized asset, and settlement conducted in USDC.

The bank created the on-chain token representing the bond and handled primary settlement, positioning the project as a practical test of how public networks could support regulated financial transactions.

The move shows Solana’s growing role in real-world asset tokenization, a sector projected by industry analysts to reach trillions of dollars over the next decade.

For Solana, the deal is also a strategic validation. While the chain is widely known for retail and developer activity, institutional adoption has historically been slower to materialize. Seeing a large financial institution test a foundational market instrument on Solana offers a clearer path to deeper enterprise use cases.

Solana – XRP Integration Signals Cross-Chain Expansion

Alongside the bond issuance, Solana is preparing for the arrival of XRP through a partnership with Hex Trust and LayerZero, which will issue wrapped XRP (wXRP) on the network.

The integration aims to extend XRP’s liquidity and utility into Solana’s fast-moving DeFi environment, enabling lending, liquidity provision, and other decentralized applications.

Hex Trust confirmed that wXRP will be fully backed 1:1 with native XRP held in segregated custody accounts, supported by more than $100 million in initial liquidity. The addition may also influence XRP’s market structure, as wrapped supply requires native XRP to be locked, potentially tightening liquidity during high-demand periods.

For Solana, the asset brings an established user base and deeper liquidity pools. For XRP, the move broadens its utility across high-performance decentralized markets that prioritize low-cost transactions and throughput.

A Broader Shift in Market Perception

These developments come as industry figures, such as Anthony Scaramucci, publicly reiterate their bullish outlook on Solana, arguing that the network’s growth trajectory could surpass Ethereum’s in market capitalization.

While the claim remains speculative, the combination of institutional pilots, cross-chain integrations, and expanding developer activity suggests Solana is strengthening its position as a platform for both consumer and enterprise-grade applications.

Related Reading: Do Kwon Falls Hard — Terraform Labs Chief Gets 15 Years For Wire Fraud

As more financial instruments move on-chain and cross-chain interoperability gains traction, Solana’s latest milestones point to a network increasingly aligned with where digital markets may be heading next.

Cover image from ChatGPT, SOLUSD chart from Tradingview

Cardano Sentiment Turns Cautious as NIGHT Token Fallout and $0.45 Resistance Cap Price Action

Cardano is about to end the week with a complex mix of technical pressure, token fallout, and shifting sentiment, as ADA struggles to break beyond its familiar resistance zone.

The market is attempting to digest a sharp correction triggered by wider macro moves, while internal ecosystem developments offer little support. For now, ADA’s direction continues to depend on how well it can hold established support, particularly as market mood turns more cautious.

Cardano ADA ADAUSD_2025-12-12_11-53-12

NIGHT Token Crash Adds Pressure to ADA’s Decline

ADA’s 2% drop to around $0.42 arrived just as the broader market reacted to the recent Federal Reserve rate cut. The decline pushed Cardano below the $0.45 level, a zone it has struggled to reclaim, placing renewed focus on its next support levels.

A major driver of the negative sentiment was the steep decline of Midnight Network’s NIGHT token, which fell roughly 90% from an early surge to $1.50 before settling near $0.05. The sell-off was largely driven by airdrop recipients offloading their allocations immediately after launch.

Despite earlier expectations around Midnight’s debut, the rapid reversal highlighted the speculative nature of the event. Market data also shows that 54% of active positions are leaning short, signaling that traders expect further downside.

Key Support Levels Hold, but Momentum Remains Weak

Cardano’s ADA is now trading near the lower edge of its established range, testing support between $0.42 and $0.43.

Analysts note that this area aligns with a broader weekly support cluster that stretches toward the $0.38–$0.39 region. Technical readings reinforce a cautious outlook, the MACD continues to trend bearish, while the RSI sits near 40, approaching oversold territory.

Traders are watching to see if ADA can stabilize above $0.42. A breakdown could expose the next lower supports, while a reclaim of the $0.45 zone would be required to shift momentum toward $0.48–$0.50.

Despite a recent $750 million inflow to Binance, the market absorbed the volume with limited price reaction, suggesting demand remains modest.

Sentiment Softens as Cardano Repeatedly Fails at $0.45

Social sentiment across major crypto forums has turned noticeably cautious. Conversations remain active, but the tone reflects trader fatigue as ADA continues to struggle against the same resistance.

With no new updates from core Cardano development efforts, including Hydra scaling, Mithril upgrades, or governance milestones, market participants have shifted their focus to external forces, such as BTC’s price direction and overall risk appetite.

ADA trades around $0.41–$0.42 at the time of writing, holding its range but without clear signs of a breakout. Until a fresh catalyst emerges, Cardano is likely to remain in a consolidation phase, with sentiment triggered more by broader market trends than internal progress.

Cover image from ChatGPT, ADAUSD chart from Tradingview

Zcash (ZEC) Approaches Critical Breakout Zone With Bulls Targeting Higher Levels After Recent Surge

Zcash’s latest price movement has pushed the privacy-focused cryptocurrency back into the spotlight, as momentum builds around a potential breakout from a long-standing resistance zone.

After a sharp climb this week, traders are watching whether ZEC can extend its gains or whether technical pressures will stall the advance.

The token surged more than 9% to reach around $455, standing out in a broader market that has mostly moved sideways despite renewed optimism following the U.S. Federal Reserve’s latest policy signals.

Rising demand, shifting fee structures, and notable whale activity have all contributed to ZEC’s strong performance, but the technical picture remains mixed as the asset approaches a critical threshold.

Zcash ZEC ZECUSD ZECUSD_2025-12-12_12-00-31

Dynamic Fee Proposal and Whale Demand Lift ZEC

Zcash’s rally coincides with a key development effort from its contributors. Developers and Shielded Labs proposed transitioning from fixed transaction fees to a dynamic fee market, a change aimed at improving cost efficiency during periods of high activity.

Market activity also intensified. Trading volumes rose sharply, and Cypherpunk Technologies expanded its ZEC holdings while adding Zcash founder Zooko Wilcox as an advisor.

On-chain data indicated accumulation from large holders, including a wallet that increased its position and sent tokens to Hyperliquid to establish a long exposure. Such behavior has tightened the circulating supply at a moment when ZEC is testing historical resistance.

Zcash’s broader performance this year further adds to the current market narrative. The token has posted returns exceeding 600% over the past 12 months, helped by rising investor interest in privacy assets and a constrained supply profile.

ZEC Tests Multi-Touch Resistance as Bulls Aim for Continuation

Despite the strong surge, Zcash now sits near a resistance zone, roughly between $460 and $485, that has repeatedly halted rallies in previous cycles.

Technical readings show improving momentum on lower timeframes, supported by stable RSI levels and a constructive parabolic SAR structure. Spot inflow data has also flipped positive, suggesting buyers are re-entering rather than exiting on strength.

If ZEC breaks above the $472–$485 range, analysts note potential upside targets at $506, $556, and possibly even $600–$620. Clearing this region would mark a shift from the most recent lower-high pattern and could accelerate trend continuation.

Mixed Long-Term Outlook as New Cycle Signals Emerge

However, some longer-term indicators raise caution. Wave analysis from multiple chart views suggests ZEC may have completed a major corrective structure earlier in the cycle, followed by a 60% decline and a weaker recovery.

Bearish divergences in momentum tools and a rising parallel channel on shorter timeframes hint that the current bounce could still be corrective.

A rejection at the resistance level may lead to a retracement toward $430, followed by the $370–$398 zone. A deeper breakdown could push prices below $300 if bearish structures reassert themselves.

For now, Zcash’s price action sits at a pivotal moment. A decisive move above resistance could extend the recent surge, but failure to break through may shift momentum back toward consolidation, or even a broader downtrend.

Cover image from ChatGPT, ZECUSD chart from Tradingview

Bitcoin Trades in Tight Range as Analysts Debate Whether the Four-Year Cycle Is Officially Over

Bitcoin (BTC) is once again moving within a narrow band, with price swings contained despite shifting macro signals and fresh debate over whether the cryptocurrency’s long-observed four-year cycle still applies.

Related Reading: Upcoming Crypto Market Structure Bill Markup Likely Pushed To Post-Holiday

As traders react to mixed Federal Reserve messaging, institutional flows, and rising caution across risk markets, analysts remain split on whether Bitcoin’s latest consolidation represents stability, or a deeper shift in how the asset behaves.

Crypto Bitcoin BTC BTCUSD BTCUSD_2025-12-11_12-34-44

Analysts Question Whether the Cycle Has Ended

A growing number of major firms now argue that Bitcoin may be moving beyond its historic halving-driven rhythm. Investment firm Bernstein said in a recent note that the asset is in an “elongated bull cycle,” pointing to minimal ETF outflows despite a nearly 30% correction.

The firm has raised its 2026 price target to $150,000, projecting a potential cycle peak of $200,000 in 2027 and maintaining a $1 million long-term estimate for 2033.

ARK Invest CEO Cathie Wood echoed this view, saying that institutional adoption is reducing the likelihood of the steep 75–90% drawdowns seen in previous cycles. Grayscale has also suggested Bitcoin could break the four-year pattern, forecasting renewed strength in 2026.

Bitcoin is currently trading near $90,000–$93,000 depending on the venue, with recent intraday swings highlighting a lack of strong directional conviction.

Fed Signals Keep Markets Cautious

The Federal Reserve’s 25 bps rate cut initially lifted risk sentiment, but a shift toward cautious, data-dependent language quickly reversed momentum.

Bitcoin and Ethereum slipped after the announcement, with BTC falling below $90,000 at one point as traders reassessed the macro backdrop. Liquidity remains thin, contributing to choppy movements across major crypto assets.

Analysts note that Bitcoin’s inability to sustain gains, despite the weaker dollar and softer Fed stance, reflects persistent uncertainty. Several commentators say BTC must hold above $90,000 to avoid strengthening bearish pressure, while a break above $94,500 could reopen a path toward $100,000 if inflows improve.

Derivatives and On-Chain Data Flag Rising Bearish Sentiment

Options and on-chain indicators are also signaling caution. Traders have increased bearish option positions, with the put/call ratio turning positive ahead of a significant expiry window. More than $500 million in crypto liquidations occurred within 24 hours, reflecting heightened volatility.

On-chain data shows declining bullish momentum. The Bitcoin Bull Score Index has fallen back to zero, and realized losses suggest further downside could be possible. Analysts warn that despite past buy-the-dip patterns, current readings do not yet reflect the levels typically associated with market bottoms.

Related Reading: Cardano Founder Reacts As NIGHT Token Crashes From $150 To $0.02

As Bitcoin continues to trade in a tight range, the broader debate remains unresolved. Whether the four-year cycle is fading, or simply paused, may depend on how markets digest macro uncertainty, institutional flows, and the next wave of economic data.

Cover image from ChatGPT, BTUSD chart from Tradingview

❌