Reading view

There are new articles available, click to refresh the page.

Here’s The Demographic That Continues To Dominate XRP

As volatility weighs heavily on the market, fresh insights are shedding light on who is really driving activity in the XRP ecosystem. A crypto analyst has shared new observations, revealing that a specific demographic continues to dominate XRP trading activity. The analyst explained that this trend has held steady despite the cryptocurrency experiencing notable downside momentum, with prices sliding to new lows amid broader market uncertainty.

Analyst Says Whales Are Dominating XRP 

A recent analysis report by market expert Xaif Crypto suggests that whales remain the dominant demographic influencing price action. He shared a chart on X highlighting Spot Average Order Size on the XRP Ledger, showing normal, retail, and big and small whale orders. 

The analyst noted that the recent spike in XRP trading has been driven primarily by whales. According to his report, this trend has persisted despite the altcoin entering a period of short-term price weakness. The cryptocurrency has recently declined toward its lowest price levels this year, raising concerns among smaller investors. 

XRP Price 1

Xaif Crypto explained that this type of behavior from whales is often seen during market bottoming phases. He emphasized that large holders typically increase accumulation when prices are depressed and avoid aggressive buying once a strong uptrend is already underway. The analyst also noted that this strategy suggests whales may be positioning themselves ahead of a potential recovery in XRP’s price.

The continued presence of whales has also helped stabilize liquidity to some degree during the ongoing decline. While retail traders may hesitate amid falling prices, whale activity tends to prevent sharp breakdowns by absorbing significant selling pressure

Buying Sentiment Surges Amid Price Weakness

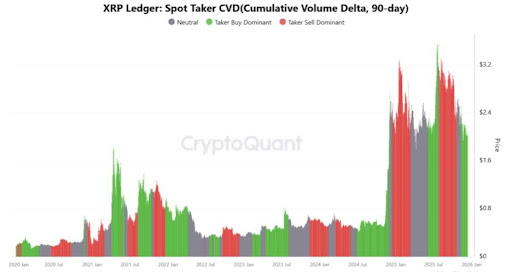
A CryptoQuant analyst who also highlighted that XRP’s trading activity continues to be dominated by whales has observed a notable change in the cryptocurrency’s Spot Taker CVD. According to the analyst’s report, XRP’s Spot Taker CVD has entered a taker-buy dominant trend. This shift suggests that aggressive buyers are now outweighing sellers, often interpreted as a sign of strengthening market sentiment and potential upside for price action.

XRP Price 2

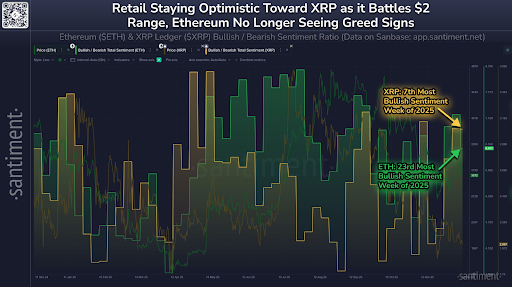
These market changes follow XRP’s sharp drop, which has pushed its price below $2 for the first time in months. The cryptocurrency has struggled to break through resistance zones needed to establish new highs, keeping overall sentiment cautious among traders

At present, XRP is trading around $1.82, down more than 6% over the past 24 hours, according to CoinMarketCap. Over the past week, the cryptocurrency’s price has fallen by nearly 9%, adding to the broader bearish outlook. XRP’s year-to-date performance is also negative, with the cryptocurrency losing about 22% of its value so far. 

Despite these severe declines, buying activity has increased significantly. Additionally, daily trading volume has surged by more than 97%, suggesting renewed interest as whales continue to shape the market’s direction. 

XRP price chart from Tradingview.com

Private Investment Firm Shares Why XRP Is Their Leading Investment

A private investment firm has outlined why XRP constitutes the largest share of its portfolio. The firm explains that its investment rationale is anchored in XRP’s Proven operational performance and functional utility rather than aspirational projections, community momentum, or speculative price expectations. As a result, the position reflects a deliberate focus on infrastructure value, reinforcing XRP’s status as a core long-term holding rather than a tactical crypto trade.

Why XRP Aligns With A Function-First Investment Approach

The investment firm’s reasoning positions XRP as a natural fit for a portfolio strategy that prioritizes function over narrative. According to the firm, its heavy allocation is the byproduct of a disciplined evaluation of how well an asset performs its intended role. In this framework, concentration is justified only when an asset demonstrates clear operational strengths, and XRP is presented as having earned that status through its design and execution.

Building on that premise, the firm points to XRP’s specialization as a settlement-oriented digital asset as the primary driver of its allocation decision. The network is structured to deliver rapid and definitive transaction completion, eliminating the uncertainty that can complicate value transfer on many blockchain systems. This reliability is reinforced by consistently low transaction costs that remain stable regardless of usage levels, enabling predictable large-scale transfers without exposure to fee volatility. As transaction volume increases, XRP’s ability to maintain high throughput without congestion further supports its suitability for continuous, real-world payment activity.

These technical attributes also connect directly to the firm’s broader investment thesis around institutional usability. By operating without a proof-of-work mechanism, the ledger avoids the inefficiencies and regulatory friction often associated with energy-intensive networks. 

In the firm’s assessment, this design choice enhances operational clarity and aligns more closely with the compliance and efficiency standards expected by financial institutions. Taken together, these factors explain why the firm views XRP less as a speculative vehicle and more as functional infrastructure, reinforcing its alignment with a function-first investment approach and justifying its central role within the portfolio.

Positioning For Institutional Adoption And Market Repricing

The firm frames its investment thesis around how markets evolve under regulatory pressure. As digital asset regulation advances, financial institutions are expected to prioritize reliability, compliance, and operational efficiency over popularity or community momentum. Adoption is therefore driven less by attention and more by seamless integration into existing financial frameworks.

This perspective also informs how digital assets may be valued. The firm expects a gradual shift from narrative-based pricing toward metrics such as transaction throughput, liquidity efficiency, and real-world demand. Assets able to move value at scale will likely be repriced as usage rises and speculative excess fades. In the firm’s assessment, XRP is one of the few assets already meeting these standards, and by concentrating its portfolio in XRP, it positions itself ahead of this transition.

XRP price chart from Tradingview.com

Dogecoin RSI Hits Levels That Have Triggered ATH Rallies Before

Dogecoin’s weekly price chart is revealing an interesting event of an important momentum indicator hitting a level that has always been a major turning point for the cryptocurrency.  After spending the past several weeks falling lower into the $0.13 price region, Dogecoin’s Relative Strength Index on the weekly timeframe has reached levels that have only appeared a handful of times over the asset’s entire trading history. The observation, first highlighted by crypto analyst Cryptollica, revisits how Dogecoin has behaved the last few times this technical condition happened.

A Rare Weekly RSI Signal In Dogecoin’s History

Technical analysis indicates that Dogecoin’s weekly Relative Strength Index has dropped into a narrow zone around the 33 level, a condition that has appeared only four times over roughly eleven years of trading history. Each of those occasions aligned with periods where selling pressure had largely run its course, even though price action itself did not immediately reverse. Instead, these phases were marked by quiet accumulation.

The Dogecoin chart highlights these moments clearly, with pronounced RSI dips into the lower band during 2015, 2020, and 2022. In each case, price followed a similar script: extended basing ranges formed after the RSI reached this level, laying the groundwork for the next sustained advance. Now in late 2025, Dogecoin’s RSI is again exhibiting this same structural behavior, and this places the current price action in a way that might play out bullish.

Short-term oversold readings are relatively common as reversal indicators, but they often produce false starts. However, since this is on the weekly timeframe, this specific setup tends to emerge only during broader market resets and is much more reliable. During those resets, the RSI stabilized and rebounded from the 30 to 33 zone as price gradually transitioned from consolidation into a new uptrend.

Dogecoin price

Dogecoin Price Chart. Source: @Cryptollica On X

What The Current RSI Setup Could Mean Going Forward

As of mid-December 2025, Dogecoin is trading in the low-$0.13 to mid-$0.14 range, having slipped back below $0.14 that had been acting as short-term support in recent weeks. This price area has been volatile, with moves between roughly $0.13 and about $0.15, reflecting an ongoing struggle between buyers and sellers and a lack of decisive bullish momentum. The sellers are winning right now, with Dogecoin trading at $0.13, down by 5% in the past 24 hours and about to lose this price level. 

Nonetheless, the weekly RSI that’s currently at the usually significant zone adds additional context. It proposes a scenario where Dogecoin is about to reach a price bottom and buyers regain control in the coming weeks. However, considering that this is a weekly indicator, Dogecoin’s price action might continue to consolidate around this level for the next few weeks before any meaningful bounce takes place.

Dogecoin price chart from Tradingview.com

A New XRP Era: Ripple Exec Shares What The Ripple-Solana Integration Means

Ripple, Solana, and XRP are converging at a pivotal moment as Ripple formally repositions XRP for a multichain future that extends well beyond a single partnership. At the Solana Breakpoint event, Ripple leadership outlined how integrating XRP into Solana’s ecosystem represents a strategic inflection point for the asset’s utility, liquidity profile, and long-term relevance within decentralized finance. The move signals a clear transition from chain-specific execution toward cross-ecosystem scalability, with XRP positioned as a portable liquidity layer rather than a siloed network token.

Ripple’s Strategic Play At Solana Breakpoint

The vision of a Ripple-Solana integration was shared on December 13, 2025, by Luke Judges, Ripple’s Global Partner Success Lead, during a presentation at Solana Breakpoint, one of the industry’s most influential conferences focused on blockchain performance and ecosystem collaboration. Judges made it explicit that Ripple’s roadmap no longer treats the XRP Ledger (XRPL) as the sole environment for XRP’s growth. Instead, the company is executing a deliberate multichain strategy designed to embed XRP directly into high-activity DeFi ecosystems.

Central to this announcement was the introduction of wXRP, a wrapped version of XRP that will operate on the Solana network. The initiative is supported by Hex Trust, which handles custody and issuance, and LayerZero, which provides the cross-chain messaging infrastructure. Importantly, wXRP maintains a 1:1 backing with native XRP, ensuring holders retain full price exposure while gaining access to Solana-based applications. This structure allows Ripple to expand XRP’s reach without diluting its underlying value proposition.

Judges emphasized that the integration is aimed at practical market outcomes rather than experimentation. By placing XRP inside Solana’s high-throughput environment, Ripple is targeting deeper liquidity, higher transaction velocity, and sustained demand from users already active in decentralized trading and lending.

XRP Enters A Multichain Era

Ripple’s expansion of XRP into multiple networks marks a shift toward broader blockchain interoperability. Against this backdrop, the operational impact of wXRP becomes clearer. By bringing XRP onto Solana, Ripple is enabling direct participation across decentralized exchanges, lending and borrowing markets, and liquidity protocols. This expansion unlocks yield strategies and advanced trading instruments that were previously out of reach for XRP holders operating solely within the XRP Ledger. At the same time, wallet integrations such as Phantom, which serves roughly 20 million users, significantly extend XRP’s accessibility and day-to-day usability within Solana’s ecosystem.

Beyond Solana, Ripple has made clear that this is a template, not an endpoint. Judges confirmed that similar cross-chain deployments are planned for Ethereum, Optimism, HyperEVM, and other networks aligned with Ripple’s broader DeFi and RLUSD strategy. 

That long-term architecture is anchored by the XRP Ledger itself, a point reinforced by J. Ayo Akinyele, Head of Engineering at RippleX. As activity and liquidity extend across multiple chains, XRPL remains the stable foundation supporting these integrations. Through this strategy, Ripple positions XRP as a cross-ecosystem settlement and liquidity asset, capable of supporting multiple networks while anchored by the stability of XRPL.

XRP price chart from Tradingview.com

Top Events That Can Decide The Fate Of Bitcoin And The Crypto Market This Week

Bitcoin (BTC) and the crypto market enter the week facing a series of events that could shape short-term price action. Key macroeconomic data, policy signals, and sector-specific developments are set to test market sentiment and influence volatility across major digital assets. Traders and investors are closely watching how these events unfold, as shifting expectations around inflation and liquidity could determine whether the market recovers or extends its downside pressure

Events Set To Move Bitcoin And Crypto Market This Week

Bitcoin and the broader crypto market face a pivotal week, with several high-impact economic events lining up just days before Christmas. With year-end liquidity thinning and the recent market downturn, price reactions to macro developments could be more volatile than usual.

The period from December 16 to 19 features key US economic data releases alongside global policy decisions that directly influence risk sentiment. Cryptocurrencies remain highly sensitive to shifts in interest rate expectations and dollar liquidity, making this week decisive for Bitcoin’s near-term direction.

On December 16, October retail sales data and the November US Jobs Report are scheduled for release. These data provide insight into consumer strength and labor market conditions, both of which influence the extent to which monetary policy may remain restrictive. Usually, stronger retail spending or job growth could reinforce expectations that interest rates stay higher for longer. This risk scenario often pressures Bitcoin and other crypto assets as tighter financial conditions tend to reduce speculative capital flows. 

Next are the November Consumer Price Index (CPI) inflation data and the December Philly Fed Manufacturing Index, due on December 18. Notably, inflation remains one of the most influential drivers for crypto markets. If inflation comes in stronger than expected, the US dollar could strengthen, weighing on Bitcoin prices. Conversely, softer inflation data may support risk assets by improving the outlook for Quantitative Easing (QE). 

December 19 will see the release of several key economic reports, including the National Core CPI year over year, November existing home sales, the revised UoM consumer sentiment, and inflation expectations. National Core CPI is especially important as it is the primary measure of underlying inflation and often triggers market volatility. 

US FED And Japan Monetary Policy Events 

At the December 18-19 monetary policy meeting, the Bank of Japan (BOJ) is expected to announce its interest rate decision, which could affect global liquidity conditions. In a recent speech, Governor Kazuo Ueda stated that the BOJ was weighing the advantages and drawbacks of raising interest rates from 0.5% to 0.75%. If a spike occurs, it could affect risk markets, including cryptocurrency.

In addition, five US Federal Reserve speaker events are scheduled this week. Their comments and insights could quickly reshape crypto market expectations. Last week, the FED cut rates by 25 basis points at its final 2025 FOMC meeting, bringing the new US interest rate to 3.50-3.75%. This rate cut triggered a surprising sell off, underscoring significant impact on Bitcoin and the broader crypto market. 

Bitcoin price chart from Tradingview.com (Crypto)

XRP Dominates Institutional Inflows, But Why Is Price Still Low?

XRP is at the center of the institutional flows, leading the crypto market in streaks of capital inflows even as its price is locked around $2. Recent data shows that money is still entering into Spot XRP ETF products, but despite this steady demand and a clear shift toward bullish sentiment across social platforms, XRP’s spot price has struggled to break higher, and this raises questions as to why inflows and price action appear out of sync.

Spot XRP ETFs Are Seeing Relentless Institutional Demand

Institutional appetite for XRP has been especially visible through Spot XRP exchange-traded funds. These products have now logged 19 days of uninterrupted inflows, with a fresh capital of $20.17 million added again on Friday. 

The latest figures from SoSoValue show that these inflows pushed cumulative inflows to $990.91 million, close to the $1 billion mark. Assets under management have also continued to rise, now sitting well above the $1 billion threshold at $1.18 billion. To put this into perspective, Spot Ethereum ETFs ended last week with $19.41 million of outflows

This pattern points to deliberate and sustained accumulation of XRP. Institutions appear comfortable building exposure to XRP gradually, taking advantage of its deep liquidity and regulated access through ETF structures.

Bullish Social Sentiment Has Not Yet Translated To Price

Another notable trend with XRP is that sentiment among retail participants has turned increasingly optimistic in the past few days. Data from market intelligence firm Santiment, which monitors discussions across platforms including X, Telegram, Reddit, and Discord, points to a noticeable increase in positive commentary surrounding the altcoin over the past week.

Santiment data shows that XRP has ranked among the most positively discussed assets of the year, much higher than Ethereum. This increase in positive sentiment has been characterized by traders expressing confidence as the price continues to hold above $2. Particularly, Santiment data shows that last week was the seventh most bullish sentiment week of 2025 for XRP.

XRP

Retail Staying Optimistic Toward XRP. Source: Santiment

Under normal conditions, this combination of strong inflows and improving sentiment would typically suggest a bullish setup. However, sentiment alone does not move markets, and XRP has been range-bound around $2. 

The most important thing is the difference between buying and selling pressure. The lack of bullish price action means that persistent sell-side activity from existing holders has been sufficient to absorb incoming demand, and this has kept XRP’s price constrained even as accumulation quietly builds. 

The same dynamic applies to ETF flows. Although Spot XRP ETFs have posted inflows for 19 consecutive days, the daily figures are relatively modest. Inflows would need to expand into the hundreds of millions of dollars on a consistent basis for these products to reflect in the XRP price. The strongest signal of improving sentiment right now is XRP’s ability to hold above $2 in the next few trading sessions, rather than any decisive breakout to the upside.

XRP price chart from Tradingview.com

Shiba Inu’s Shibarium Is In Trouble As Leading DeFi Platform Threatens Exit

Shiba Inu’s Layer-2 network, Shibarium, is facing a serious challenge after a prominent decentralized finance platform within its ecosystem publicly warned that it may abandon the chain entirely. K9 Finance DAO, a liquid staking protocol built on Shibarium, announced it has set a firm deadline to resolve outstanding issues linked to September’s bridge exploit.

The announcement, which was shared on the social media platform X, points to a breakdown in communication between ecosystem builders and the Shibarium development team. According to K9 Finance, private discussions that had been ongoing for months following the hack have now stalled, and this is why the DAO is addressing the matter publicly.

K9 Finance Brings Dispute Into the Open

In its statement, K9 Finance DAO said it had complied with every request made by the Shibarium team in the aftermath of the bridge exploit and had acted in good faith throughout the process. The DAO noted that it maintained several private communication channels with the Shib team in an effort to reach closure and ensure affected users were compensated.

That process has now reached a standstill. K9 Finance disclosed that it has received no further communication or guidance from the Shibarium team, leading it to move the discussion into the public timeline. However, this step was taken by the K9 Finance DAO to provide clarity to its holders and uphold responsible governance, not to provoke drama or controversy.

As part of its announcement, K9 Finance set January 6, 2026 as the final deadline for users impacted by the Shibarium bridge incident to be fully and verifiably made whole. If restitution is not completed by that date, the DAO says it will convene and vote on its future relationship with Shibarium, including whether continuing to operate on the chain makes sense for the long-term health of the K9 ecosystem.

K9 Finance is a decentralized finance protocol built on Shibarium that focuses on liquid staking within the Shiba Inu ecosystem. The platform operates as a decentralized autonomous organization, with governance decisions made by token holders through the K9 Finance DAO. 

K9 Finance is one of the most visible DeFi platforms on the Shibarium chain, and its stance could influence sentiment among other builders.

The Main Issue: September’s Bridge Hack

The dispute traces back to the Shibarium bridge exploit in September 2025, when attackers used a flash-loan-based strategy to drain assets from the bridge. The incident forced emergency pauses across parts of the network and security updates by the Shiba Inu team.

During that incident, roughly $4.1 million in assets, including ETH, SHIB, and other tokens, were taken, and around $717,000 worth of KNINE tokens were affected. However, the stolen KNINE tokens could not be sold from the attacker’s wallet because they were frozen by K9 Finance. 

Although the Shibarium team later restored network functionality and introduced additional security measures, the recent announcement shows that compensation discussions have continued behind the scenes without a final resolution.

Shiba Inu price chart from Tradingview.com

Silk Road Bitcoins Are On The Move Again, Is The BTC Price Ready For Another Dump?

After nearly five years of dormancy, a cluster of Silk Road–linked wallets just moved 33.7 Bitcoin—roughly $3 million—in a sudden on-chain resurgence that immediately brought the BTC price back into focus. While the volume is modest, the combination of its origin, timing, and institutional destination gives it an outsized narrative impact. With Bitcoin already navigating a fragile price range, this development raises concerns about renewed downward pressure.

The 33.7 BTC Silk Road BTC Transfer And Its Potential Impact On Bitcoin’s Price

The movement began with a series of small outputs originating from early-era Silk Road addresses, all using the old “1…” legacy format. These wallets had last shown activity on February 2, 2021, before abruptly pushing out 176 tiny transactions that were subsequently consolidated into the bech32 address bc1qnysx9sr0s7uw39awr3hh099d5m0lvrnxz7ga54. Roughly a day later, that entire 33.7 BTC was moved again through an intermediary hop and then flagged by chain-analysis dashboards as a Coinbase Prime deposit.

The first alert about the movement came from the X account DarkWebInformer, which spotted the burst of micro-transactions. Even after this transfer, about 416 BTC—roughly $37.5 million—remains untouched in the wider group of connected addresses. This supports the idea that the 33.7 BTC shift was simply a dust-sweep or cleanup action, not a full-scale release of seized holdings.

With the operational picture clear, the focus shifts to the price impact. In terms of liquidity, 33.7 BTC is far too small to trigger a market-wide dump. What matters more is the psychological effect. Bitcoin is already trading in a corrective range, and activity linked to Silk Road history can make traders cautious. Although the Coinbase Prime routing points to OTC or custodial handling rather than a spot-market sale, the optics alone can tighten risk models and stoke volatility in the BTC price

Dormant Wallets And Market Sensitivity

Dormant Silk Road wallets have a history of resurfacing. In May 2025, two such wallets moved over 3,400 BTC—worth roughly $322 million—after nearly a decade of inactivity. The funds were transferred into new addresses rather than exchanges, showing that these movements do not automatically trigger selling and are more notable for their on-chain and narrative significance than for their impact on liquidity.

While these transfers have little direct effect on liquidity, Bitcoin’s current price action makes the market more sensitive to any headline. After approaching $94,000 earlier this month, BTC slipped back to $90,000–$92,000. On X, bearish analysts have highlighted a continuation pattern, with some projecting potential downside toward $88,000 – $89,000. This environment primes traders to react strongly to even minor negative catalysts, including long-dormant wallet activity.

Overall, the recent Silk Road transfer is unlikely to trigger a standalone dump. The main pressure stems from Bitcoin’s fragile technical posture, making even small but symbolically significant moves capable of increasing short-term volatility.

Bitcoin price chart from Tradingview.com

Why This Market Analyst Is Warning Crypto Investors To Stop Buying XRP

The XRP price could be on the verge of a massive crash, as a crypto analyst has identified a key technical pattern in the cryptocurrency’s structure that signals a potentially severe downturn. According to the analyst, this formation has appeared only twice in XRP’s history, and each time has preceded a devastating loss. If the pattern were to repeat, the cryptocurrency could be headed for more pain. The analyst warns traders and investors to stop buying XRP at this time, citing heightened risk. 

Analyst Advices Against Buying XRP As Price Crash Looms

An urgent warning from market analyst Steph is Crypto has spread across the community, as he advises traders and investors to “not touch XRP anymore.” The analyst shared a video of his XRP price forecast on a recent X post, revealing that the altcoin’s long-term indicators point to a troubling setup that could mirror downturns observed during past market cycles. 

Steph Is Crypto shared that his study of the monthly Moving Average Convergence Divergence (MACD) for XRP has revealed a new bearish crossover taking shape, signaling declining momentum. The analyst stated that XRP had formed a bearish crossover on the chart only twice since its inception in 2012. Both times this pattern appeared, the cryptocurrency underwent one of the most dramatic price crashes ever, losing over half its value right after. 

He explained that during the first bearish crossover in 2019, XRP crashed by more than 84%. Similarly, a second crossover reemerged in 2022, triggering a deep price decline of about 67%. It’s worth highlighting that each time XRP formed this bearish signal, it was after a major bull market. 

In 2018, the cryptocurrency staged a historic rally that sent its price to its current all-time high above $3.84. Likewise, the steep correction in 2022 came on the heels of an explosive 2021 bull market, one of the most powerful in crypto’s history.  

Just as in the past, Steph Is Crypto sees a bearish crossover forming once again in the current cycle, suggesting that the conditions are aligning for another devastating price crash. He admitted that he wishes he had not spotted this formation on XRP’s chart, underscoring his usually bullish stance on the cryptocurrency. The analyst has cautioned traders to take this historical setup seriously and to consider the possibility that XRP could revisit significantly lower price ranges if the pattern plays out. 

XRP Price Momentum Remains Weak

XRP remains in a downward trend, with its price barely holding above $2.00. The cryptocurrency has dropped by over 15% so far this month, declined about 2.2% over the past week, and has crashed approximately 16% year to date, according to CoinMarketCap. 

XRP’s price momentum is weak, with little indication of a near-term recovery. The cryptocurrency’s Fear and Greed Index has slipped to 42, edging closer to the “fear” zone. This market uncertainty is being driven by the cryptocurrency’s sluggish price action, despite having passed $3.00 earlier this year and nearly challenging its all-time high

XRP price chart from Tradingview.com

XRP Wallet Founder Warns Investors Of Dangerous Scam Targeting The Community

Leading XRP wallet founder, Wietse Wind, has issued a direct warning about a fast-moving impersonation scam targeting XRP users. The alert highlights an escalating threat vector already linked to material losses, with attackers posing as official support and attempting to harvest seed phrases by framing it as wallet assistance. Their operations are expanding in scope and speed, and the XRP community is now a primary target.

Coordinated Impersonation Playbooks Are Now Targeting XRP Users

The founder’s advisory highlights an operationally disciplined scam pattern designed to exploit trust at scale. Threat actors position themselves as recovery specialists, wallet engineers or ecosystem support staff. They approach users through direct messages, E-mails, cloned profiles and polished customer-service language to create a façade of legitimacy. Once initial rapport is established, they deploy scripted escalations — often framed as urgent account recovery needs — to extract seed phrases under the guise of technical troubleshooting.

The risk exposure is significant because XRP transactions are irreversible, and wallets secured with 12- or 24-word keys become instantly compromised once those keys are shared. The scam is engineered to bypass technical safeguards by attacking the human layer, and the founder’s message underscores the scale of user losses already reported across the community. 

XRP holders can mitigate this risk by operationalizing strict key-management discipline. Seed phrases must never be disclosed under any circumstance, regardless of how convincing a support agent appears. Platform teams never request private keys, and no legitimate recovery workflow requires the user to surrender control of their wallet. Users should validate identities through official channels, avoid engaging with unsolicited inbound messages and escalate any suspicious outreach to community security hubs. Maintaining a hardened posture is now mandatory as attackers increasingly weaponize user vulnerability and real-time monitoring of social platforms.

Community Reports Confirm The Escalating Threat Environment

Broader sentiment from ecosystem leaders indicates that this is not an isolated event but part of a growing pattern. A prominent developer highlighted a wave of phishing attempts circulating on X that leveraged deceptive links and direct messages to lure users into engagement, undermining trust and exploiting those seeking help.

Moreover, community members have documented multiple incidents in which attackers consistently target users seeking support. Another well-known community member reported a doubling-down scam, where victims were approached with offers to “assist” with account issues but were instead redirected to fraudulent sites and Telegram channels requesting sensitive information. In a separate case on Reddit, a fake “recovery agent” tricked an XRP holder into granting access, resulting in the theft of tokens, while a recent incident saw an XRP user lose $3,000,000 from a compromised cold wallet.

These examples reinforce the community’s assessment that attackers are systematically monitoring public discussions about wallet concerns, impersonating official support channels, and manipulating interactions to extract credentials. Together, they illustrate the scale and sophistication of the threat environment facing XRP users.

XRP price chart from Tradingview.com (Ripple)

Ripple’s Bank Is About To Be A Reality – Here’s The Next Important Date For XRP

Ripple, a crypto payments company, is edging closer to a milestone that could redefine its role and XRP’s position in the global finance industry and the US banking sector. New reports reveal that the national banking charter, which the crypto firm had applied for earlier this year, could be approved soon, potentially turning Ripple’s dream of establishing a US bank a reality.

Ripple Could Secure National Bank Charter Soon

Market expert ‘Steph is Crypto’ announced on X this Wednesday that Ripple’s long-awaited national bank license is “imminent,” implying an approval could be granted soon. The analyst described this possibility as bullish. His optimism about the banking charter raised the expectations of crypto community members under his post, most of whom also agreed that the potential approval could be bullish for XRP.

Ripple Labs first revealed plans to establish a National Trust Bank in July 2025 when CEO Brad Garlinghouse confirmed that an application had been submitted to the US Office of the Comptroller of the Currency (OCC). If approved, the proposed bank will reportedly be headquartered in New York and operate as a wholly owned subsidiary of Ripple. 

Typically, the OCC spends about 120 days reviewing a bank charter application. Based on Ripple’s submission timing, the US regulator’s decision on the crypto company’s banking license was expected around October 2025. However, the process was delayed, and an official approval or rejection has been postponed until further notice. 

At the time of writing, the OCC has not provided an official statement confirming the approval date of a Ripple banking license. Nevertheless, some members of the crypto community speculate that approval could be made by the end of this month, while others expect it within six months.  

If the OCC grants the license, Ripple would officially function as a national trust bank under direct federal oversight. This status would give the company the authority to offer custody and settlement services for both digital and traditional assets. Experts also believe it could allow the company to integrate the RLUSD stablecoin, potentially driving a significant rise in institutional use of XRP in US financial markets. 

New OCC Ruling Strengthens Ripple’s Bank Plans And XRP Utility

In a recent post on X, crypto analyst X Finance Bull highlighted a new ruling by the US OCC that clears the last major barrier keeping traditional banks hesitant to get involved in cryptocurrencies. According to the OCC’s official report, the new ruling allows US banks to use digital assets and currencies in their operations and to engage in riskless principal crypto transactions. 

This new guidance comes at a perfect time for Ripple’s regulatory plans. The company positioned itself firmly within the compliance perimeter by applying for an OCC-regulated national bank license. The ruling also makes it fully permissible for national banks to use XRP and RLUSD for settlement and payment activities. Although the OCC’s decision applies only to national banks, it represents a foundational step toward Ripple’s potential entry into the US banking system

XRP price chart from Tradingview.com (Ripple)

Why Now Is The Perfect Opportunity To Short Bitcoin Down To $40,000

A recent post by crypto analyst Stockmoney Lizards on X suggests that the current Bitcoin structure is giving bears “the perfect opportunity” to short the market down to $40,000. His message was paired with a chart showing Bitcoin falling below an important resistance ever since it broke below $100,000, creating what appears to be a clean continuation setup for traders expecting deeper losses. 

However, although the chart highlights a similar bearish structure in 2022, the analysis behind his post points to a more layered interpretation of what may come next for Bitcoin.

The Setup Bears Believe Is Finally Here

In the chart he shared, Stockmoney Lizards showed how Bitcoin’s latest breakdown resembles the 2022 pattern, when the price action rejected a major resistance level and fell sharply into what later became a large accumulation zone.  The current structure shows a similar rejection just above the $100,000 zone, followed by a drop below the weekly EMA50. This move has brought Bitcoin into a region that is similar to the range where accumulation formed in the earlier cycle. 

An overlay of the new price action on top of the previous one shows the path downward seems almost predetermined, creating the impression that the Bitcoin price is setting up a natural decline to as low as $40,000 in the coming weeks and months. Bitcoin is currently trading at $90,240. A crash to $40,000 would mean wiping out roughly 55% of its value from here, effectively erasing the entire progress it has built over the past two years.

Bitcoin price 1

Bitcoin Price Chart. Source: @StockmoneyL On X

Why The Perfect Short Is Not The Analyst’s Real Message

After the post gained traction, Stockmoney Lizards stepped in to clarify that his message had been taken too literally. His invitation for traders to short down to $40,000 was intentionally exaggerated, and the market does not behave this way. 

He clarified that he does not foresee a collapse into a deep bear market. Instead, he believes Bitcoin may consolidate, possibly sweep local lows, but not have a prolonged breakdown. Furthermore, he noted that the worst-case scenario would be a touch of the weekly EMA200, and this is not a place where bull markets end. The real midterm prediction is a higher move for the Bitcoin price.

Before posting the supposedly bearish prediction, Stockmoney Lizards had shared another analysis describing Bitcoin as being close to the endboss at the weekly EMA50 indicator. 

Bitcoin price 2

Bitcoin Price Chart. Source: @StockmoneyL On X

That earlier chart offered a clearer view of his actual stance. In it, he predicted that Bitcoin was approaching a major technical pivot and that he expected upward movement into the end of December and Q1 2025. Therefore, the weekly EMA50 is the barrier that Bitcoin needs to reclaim in order to launch its next phase of bullish momentum.

Bitcoin price chart from Tradingview.com

Here’s Why Strategy’s $1 Billion Bitcoin Purchase Did Not Trigger A Price Rally

When Strategy disclosed its acquisition of more than 10,000 Bitcoin worth $1 billion, market watchers anticipated an immediate rally. Instead, Bitcoin’s price barely moved. The muted response was not a reflection of weak demand but the result of how the purchase was executed. In response to the confusion surrounding the stagnant price action, Quinten Francois explained the mechanics behind the transaction, clarifying why such a large buy left no visible impact on the chart.

The Invisible Plumbing Behind Institutional Bitcoin Accumulation

On 9 December 2025, Andrew Tate questioned why a massive 10,000 BTC buy failed to nudge the market. The answer, as analyst Francois explained, lies in the operational backbone of over-the-counter (OTC) desks—an ecosystem designed to absorb billion-dollar flows while keeping price action stable. These desks operate entirely outside exchanges. When a firm wants thousands of BTC, nothing is executed against the real-time order book. Instead, OTC operators start sourcing supply quietly from large holders looking to offload position size.

This pipeline includes deep private liquidity that retail traders never see: miners selling block rewards, VCs rotating out of token allocations, market makers rebalancing inventory, and even corporate treasuries restructuring reserves. None of these trades appear on exchange feeds. According to Francois, they do not trigger volatility, sweep liquidity pools, or create the upward pressure that retail investors typically expect from large buys.

More critically, Francois notes that these transactions do not occur in a single block. A 5,000–10,000 BTC order is never filled all at once. Instead, OTC desks spread procurement over days or even weeks, accumulating inventory piece by piece. Only when enough matched supply is gathered do they finalize the transaction, resulting in a smooth settlement with no visible footprint on price charts.

Why No Price Rally Emerges From Shadow-Side Demand

Shadow-side demand refers to large-scale institutional buying that occurs entirely outside public exchanges. These hidden transactions do not trigger price rallies because OTC infrastructure is designed to prevent slippage, volatility, and market distortion. Institutions acquiring strategic size deliberately avoid pushing prices higher, while liquidity providers are incentivized to maintain stability. By keeping trades off public exchanges, both sides protect execution quality and preserve overall market integrity.

A rally only emerges when open-market demand exceeds visible liquidity. In this case, the demand never hit the open market. OTC desks tap private channels first and only touch exchanges if supply dries up—and that is considered a last resort. If enough sellers are found privately, no exchange-side buying occurs at all.

This is why public charts often show sell pressure but rarely show institutional demand. The buys happen in the shadows, the sells appear on-chain, and the price remains anchored. Strategy’s $1 billion allocation did not fail to move the market; it was intentionally engineered not to.

Bitcoin price chart from Tradingview.com (Strategy)

Shibarium Stages Comeback With Latest Development, Shiba Inu Whales Return – Details

Following its launch in 2023, Shibarium, a Layer-2 blockchain network for the Shiba Inu ecosystem, was widely seen as a major catalyst that could propel SHIB to new levels and potentially lift its price. However, over the past few months, activity and adoption on Shibarium have remained disappointingly quiet. Now, with the potential advancement and growing interest in the new ShibOS platform, momentum for a comeback could be building. Adding to this possible shift, SHIB whales have noticeably returned, with on-chain activity beginning to climb. 

Shibarium Revival Could Take Shape With The Adoption Of ShibOS

For most of the year, Shibarium has struggled to gain meaningful traction, unable to revive and return to the level of activity investors once expected. As the number of active users decreased, developers were slow to build on it, and the price of SHIB saw little to no reaction despite its strong community backing and Shibarium’s promise of greater utility and faster transactions. 

Although conditions look rather bleak, the narrative could shift as the new ShibOS platform grows and is increasingly adopted. ShibOS is a new Operating System designed to serve as the backbone of the Shiba Inu ecosystem. Rather than positioning SHIB as a simple meme-driven asset, ShibOS aims to create a functional environment where applications, utility, and identity features can thrive. 

The operating system provides a framework that connects traditional businesses and Web3 developers, enabling seamless integration of blockchain features. The concept behind ShibOS places the Shiba Inu community at the center of a broader technological transformation. It introduces a structure that supports Decentralized Applications (dApps) and self-governed digital identities while offering a gateway for Web2 brands interested in experimenting with blockchain technology. 

If developers and businesses begin adopting ShibOS and integrating it into their products, Shibarium could naturally benefit from the surge in activity. More applications would mean more transactions, increased users, and a healthier on-chain economy. This type of organic growth could, in turn, drive the demand for SHIB, potentially influencing its price. 

Shiba Inu Whale Activity Hits Six-Month High

Shiba Inu is also showing signs of renewed activity in terms of on-chain transactions. According to fresh data and a chart shared by SanSights on Santiment, SHIB whale activity has surged to its highest level since early June 2025. Over the last day or so, multiple accounts have reportedly made 406 transactions, each moving more than $100,000 in SHIB. 

Shibarium

At the same time, crypto exchanges have seen a net increase of 1.06 trillion SHIB, valued at roughly $15 million to $20 million—all deposited within 24 hours. This sudden increase in supply comes as prices surge unexpectedly this week, highlighting a rare convergence of bullish factors. 

Typically, when whale activity, large deposits, and price movements happen at the same time, it can signal upcoming big changes. It could either be that whales are accumulating for a stronger price rally or preparing to sell into the current momentum. 

Shiba Inu price chart from Tradingview.com

Dogecoin Price Set To Surge As Sellers Show Signs Of Exhaustion

A new technical analysis shared by crypto analyst BitGuru on the social media platform X shows that Dogecoin is trading at an important price level that could set the stage for an upward shift. His chart shows a familiar structure forming at a major support level, one that has acted as the starting point for a previous rally in the year. The price action now developing is similar to this earlier setup, showing that Dogecoin may be preparing for another recovery move above $0.2.

Dogecoin Returns To An Important Support Zone

Dogecoin has spent the past few weeks trading between $0.13 and $0.15 without a clear path to bullish price action. This recent price action is an extension of a downturn that has been taking effect since mid-September from the $0.3 price level.

Notably, technical analysis of Dogecoin’s daily candlestick timeframe chart shows that the cryptocurrency is currently positioned on a significant historical support level, the same area that sparked previous rallies. This support is shown on the chart as between $0.139 and $0.141, the lower boundary of a wide accumulation zone, where price repeatedly stabilized before surging. 

Despite the broader market’s recent weakness, this price support range has held up. Price action in December has led to the creation of a few transition candles on the daily timeframe chart. This, in turn, has led to the creation of a higher low relative to the November breakdown, which had caused Dogecoin to break below $0.135.

Dogecoin price

Dogecoin Daily Candlestick Chart. Source: @bitgu_ru On X

Another notable feature highlighted by the analyst is the tight compression forming around Dogecoin’s candles. The chart shows a sequence of narrow movements, indicating that selling momentum has thinned out. 

BitGuru interpreted this as exhaustion from sellers, meaning the Dogecoin price is no longer displaying the heavy downward pressure seen in November. This type of narrowing range is expected to be the final stage of the downtrend and buyers are beginning to regain control.

Buyers Begin To Step In, Mid-Range Target Next

Early signs of buyer strength are now visible within this compressed zone. This is reflected in the price action in the past 24 hours, which has seen Dogecoin bounce from its intraday low of $0.14 and increase by 4.1%. That rebound is the first meaningful pushback from buyers after days of bearish activity.

The projected arrow in BitGuru’s chart points to the mid-range area around $0.188 as the first destination now that Dogecoin is rebounding from its support base. However, another higher price target is highlighted around $0.223 if Dogecoin completes its projected bounce from the support.

Depending on how Dogecoin reacts here, a bullish move will target the order block around $0.25, before further price targets at $0.284 and $0.306.

Dogecoin price chart from Tradingview.com

Institutional Investors Are Leaving Ethereum And Buying XRP – Here Are The Figures

The newest Digital Asset Fund Flows Weekly Report from CoinShares paints a picture of shifting institutional preferences toward XRP, and Ethereum is no longer attracting the level of attention it once did. The report shows that Ethereum’s weekly inflows came in far behind other major assets, even as overall sentiment in the crypto market improved.  Meanwhile, XRP surged to the second-highest inflow position behind Bitcoin, and large investors are reallocating capital away from Ethereum and into funds linked to XRP.

Ethereum Inflows Lose Momentum

Ethereum’s position in institutional portfolios has weakened noticeably in recent weeks. This was evident in a four-week stretch of outflows throughout November. Notably, a recent broader market recovery pushed total digital asset inflows to $716 million last week, bringing the inflow stretch to two consecutive weeks.

However, Ethereum captured only a small share of that capital. The report shows Ethereum with just $39.1 million in weekly inflows, a subdued figure compared to the sizeable movements seen in other assets. This soft performance follows months of cooling demand, and it suggests that institutional conviction in Ethereum is fading.

Even the month-to-date figure trails behind expectations, coming in at $41.2 million, far below the institutional numbers of Bitcoin XRP, and even Chainlink.

XRP Pulls In Massive Institutional Demand

XRP ranked as the second-largest inflow recipient last week, drawing $245 million, more than six times what Ethereum received. This surge builds on strong year-to-date activity, lifting XRP’s total inflows for 2025 to over $3.1 billion, far above the $608 million recorded in 2024. 

CoinShares’ report shows that XRP’s inflows are a sustained trend rather than a one-off spike. Inflows into XRP-linked products have jumped massively since the introduction of Spot XRP ETFs in the US. Interestingly, these ETFs have witnessed consistent days of inflows since their launch.

These figures indicate that institutions view XRP as a more attractive allocation than Ethereum at this stage of the market cycle. XRP’s strong accumulation coincides with improving sentiment across the derivatives market, where products linked to Bitcoin have also recovered. 

Speaking of Bitcoin, the leading cryptocurrency remained the dominant inflow magnet, with $352 million entering its investment products last week. However, the more notable story lies in the sequence of inflows just behind Bitcoin. Bitcoin continues to anchor portfolios, but capital that would have traditionally flowed into Ethereum is now finding its way into XRP, alongside other new institutional favorites such as Chainlink, which posted a record weekly inflow of $52.8 million, representing more than half of its year-to-date inflows.

Across the geographic breakdown, inflows from the US, Germany, and Canada contributed heavily to this realignment. The US received the most inflows of $483 million last week. Germany, Canada, and Switzerland-based funds came in behind with $96.9 million, $80.7 million, and $34.4 million, respectively.

XRP price chart from Tradingview.com (Ethereum)

Popular Crypto Analyst Reveals New Bitcoin Price Target That Has Got The Community Moving

Renowned analyst Peter Brandt has unveiled a new set of Bitcoin price targets that have quickly sparked discussion across trading communities. His updated technical roadmap comes as BTC shows signs of cooling, prompting traders to reassess its recent price movement. With Bitcoin slipping beneath the structure that supported its multi-month climb, Brandt’s projected corrective zones have become a central focus in the market’s debate over where the asset may be headed next.

Bitcoin Price’s Structural Breakdown Raises The Stakes For Crypto Traders

In a recent post on X, Brandt outlined his latest outlook, highlighting a completed five-leg advance — a classic sequence often linked to trend exhaustion when price stretches too far without meaningful resets. In this case, the formation appears as a rising wedge, a pattern known for producing sharp shifts once its lower boundary is breached. That breach has now happened, marking what Brandt interprets as a structural turning point rather than a panic-driven drop.

Bitcoin price

From the breakdown, two corrective regions emerge: near $81,852 and $59,403. These targets are drawn directly from the proportions of Bitcoin’s recently completed structure, giving them a grounded, technical foundation. Brandt frames the pullback as a normalization event, one that fits neatly into Bitcoin’s historical rhythm of expansions followed by methodical cooldowns. Instead of portraying the situation as a threat to long-term strength, the analysis positions the zones as potential resting points where the market could stabilize before setting its next course.

There is also a familiar pattern echoing through the charts — a reminder of late 2021, when sentiment surged ahead of structural reality and the market eventually recalibrated. While conditions today are not identical, the resemblance underscores how expectations and chart formations often move in parallel. In both scenarios, a strong run gave way to a controlled corrective period.

Brandt’s roadmap follows a clear sequence: formation completion, slope-line violation, and defined landing zones. Each step reinforces the next, forming a cohesive narrative that explains why this chart has quickly gained traction among crypto traders monitoring short-term volatility.

Brandt’s Targets Offer Strategic Guidance For Crypto Traders

Bitcoin is currently trading at $90,175, reflecting a 1.9% dip over the past 24 hours alongside a 4.4% gain across the last seven days. The price sits close to the level where the structural break first appeared, amplifying interest in Brandt’s outlined targets. Traders are now assessing whether the asset is preparing for a deeper corrective sweep or simply entering a consolidation phase before another directional move.

Ultimately, Brandt’s targets are intended to guide traders rather than alarm them. They highlight likely equilibrium zones during routine market resets, offering reference points where Bitcoin could stabilize after extended rallies. By framing the analysis this way, traders are encouraged to approach the market with a measured strategy and sharper precision, rather than reacting impulsively to short-term fluctuations.

Bitcoin price chart from Tradingview.com

Pundit Highlights The Condition That Will Trigger A 2,300% XRP Rally To $50

The XRP price is currently more than 45% below its all-time high and continues to decline amid broader market uncertainty. Despite the slow price action and weak momentum, a crypto analyst has projected that XRP could explode to $50 soon, providing reasons for his ambitious forecast. He boldly stated that the cryptocurrency will not experience a gradual climb to $5 or $10 first, but will instead jump straight to $50.

XRP To Hit $50 With A Ripple Bank Charter 

Crypto analyst Pumpius has outlined a compelling scenario that could dramatically transform XRP’s market outlook. The market expert claims that a single regulatory event could catapult XRP’s price to $50, representing more than a 2,300% increase from current levels around $2. In his thread post on X, he explained the reasons for his bold prediction and the trigger behind this parabolic surge .

Pumpius believes that XRP could skyrocket to $50 once Ripple secures a national trust bank charter from the United States Office of the Comptroller of the Currency (OCC). According to him, approval of this banking license would give Ripple the same powers as major US banks, as well as direct access to the Federal Reserve (FED). 

The analyst noted that through the charter, Ripple could gain the authority to custody crypto and tokenized assets, issue stablecoins, and settle securities under complete regulatory oversight. He described the potential approval of the banking license as a foundational move that could establish  Ripple as a leading force in US tokenized finance. 

Pumpius highlighted that XRP remains at the centre of the changes, positioned as the native bridge asset in this potential structure. He suggested that with a charter in place, banks, brokers, and funds could bypass intermediaries and interact directly with Ripple to move value into tokenized markets

According to the analyst’s predictions, the result of this shift could be a massive, sustained surge in liquidity and institutional demand for XRP, creating the ideal conditions for an unprecedented price rally. He explains that with $6.6 trillion moving through banks each day in global settlements, even a small fraction routed through XRP’s limited supply could drive its price higher toward $50. 

While the market expert’s forecast is ambitious, it hinges entirely on the OCC’s decision, which is not guaranteed and could be influenced by compliance standards, risk assessments, and broader financial policy considerations. Even with approval, actual integration by major institutions would likely take considerable time and depend on competition with existing settlement networks. 

Ripple Legal Victory Paves Way For $50 XRP Price

In his post, Pumpius suggested that Ripple’s prolonged legal battle with the US Securities and Exchange Commission (SEC) was part of a broader strategy to secure regulatory clarity. He viewed the former lawsuit as a smokescreen intended to delay, filter, and prepare the path for a national trust bank charter under the OCC. With the case now resolved, the analyst indicates that the timing is perfect for Ripple to pursue full regulatory approval and integrate XRP into mainstream banking channels.

Pumpius boldly declared that the day the OCC approves Ripple’s banking license will mark a turning point for XRP, transforming it from a cryptocurrency to “the rails of US finance.” At that point, the analyst argues that a $50 price target would be significantly undervalued. 

XRP price chart from Tradingview.com

Here’s How High The Dogecoin Price Will Go Once The MACD Bullish Cross Happens

The Dogecoin price has been drifting through a subdued stretch over the past few days, holding around the mid-$0.13 to $0.14. The recent decline has slowed down in the past 48 hours, and the chart now shows the meme coin attempting to steady itself after weeks of persistent selling pressure.

Trader Tardigrade, a well-known crypto analyst on X, shared a new three-day chart suggesting that an important MACD signal is on the verge of forming, and historical performance shows that Dogecoin tends to move bullish once this signal appears.

Approaching The MACD Bullish Cross

Dogecoin’s quiet phase in the past 48 hours has become increasingly important because one of Dogecoin’s higher-timeframe indicators is beginning to show early signs of life.  According to Trader Tardigrade, Dogecoin’s MACD indicator on the 3-day candlestick price chart has not yet confirmed a bullish cross, but it is very close to doing so. 

The chart he shared shows the MACD lines converging at the lower boundary of the recent downtrend, and the blue line is approaching the red line. The blue line is about to cross over the red one, mirroring the exact setup that preceded previous breakouts earlier this year. 

Even with Dogecoin trading quietly in recent days, the compression of the MACD indicator hints that bearish momentum is fading. Once the cross officially forms, the trend will shift into a bullish one. This gradual tightening of price movement is also characteristic of an accumulation phase, and this is shown by an important Dogecoin metric.

Dogecoin price

Dogecoin Price Chart, MACD Cross. Source: @TATrader_Alan On X

How High The Dogecoin Price Could Go

The chart reveals a clear pattern: every time Dogecoin printed a three-day MACD bullish cross in 2025, the price responded with a significant upward move. The first cross was in April, and this preceded a rally that pushed Dogecoin’s price from below $0.14 into a breakout to $0.26. 

A second cross followed during mid-summer in July, and once again the price climbed aggressively shortly afterward. This saw the Dogecoin price rally from around $0.16 to $0.30 very briefly. 

Both events are circled on the chart above, showing how the momentum flipped swiftly once the MACD crossed above the signal line. These repeated reactions strengthen the case that Dogecoin could be preparing for another sizeable run if the indicator confirms a cross in the coming days.

The projection area drawn on the right side of the chart points to a climb that extends well above $0.20. This suggests that the next wave may revisit the upper levels where Dogecoin last traded during its late-summer rally.

The analyst’s chart outlines a wide upward arc, indicating that the expected move would not be a minor rebound but a structured uptrend similar to the earlier surges this year. In terms of a price target, the projection shows Dogecoin reaching a price target around $0.35 in the next few weeks. This would translate to a 140% increase from Dogecoin’s current price of $0.142.

Dogecoin price chart from Tradingview.com

Will Ripple Dump 25% Of Its 45 Billion XRP Holdings Soon? Here’s The 411

Ripple currently controls a staggering amount of XRP, and now questions from market experts are mounting over whether the crypto payments company may be forced to sell 25% of its 45 billion token holdings. Analysts suggest that a possible selloff could have major implications. At the same time, they question the pathways through which Ripple could sell its holdings and who the potential buyers might be. 

Ripple To Face Pressure To Sell 25% Of XRP Holdings 

Ripple may soon need to drastically reduce more than half of its substantial XRP reserves as regulatory discussions over the proposed CLARITY Act intensify. In a recent post on X, market expert Crypto Sensei shared a video, drawing attention to a provision in the CLARITY Act that would prevent any company from controlling more than 20% of a blockchain’s native asset’s total supply. 

Currently, Ripple owns 45 billion XRP, split between escrow and direct reserve, representing 45% of the cryptocurrency’s total supply of 100 billion tokens. This indicates that the company controls nearly half of the total XRP supply—a level of concentration that typically runs counter to the decentralization narrative of crypto and blockchain technology. 

Crypto Sensei suggests that US lawmakers are seemingly focused on preventing excessive accumulation of supply, and Ripple’s holdings stand out as one of the clearest examples of a single entity controlling a large portion of a network’s token. According to the analyst, if the CLARITY Act is implemented in 2026, Ripple may need to sell at least 25% of its holdings to comply with the legislation. 

A reduction of this magnitude would lower the crypto company’s XRP reserves to 20 billion tokens, or 20% of the cryptocurrency’s total supply. At the current price of $2.0 per token, this would amount to roughly $40 billion. Notably, such a sell-off would likely require coordination with liquidity providers and partnering institutions to avoid unnecessary market disruption. 

Potential Selling Paths And Institutional Speculation 

In his X video, Crypto Sensei outlined several potential paths Ripple could take to reduce its substantial XRP reserves. One option is to sell the rights to future escrow releases instead of the tokens themselves. Another involves selling the accounts into which the escrowed XRP completes while preventing the tokens from circulating.  

According to the market expert, these possibilities have sparked widespread speculation that major financial players, such as BlackRock, could already be involved or poised to purchase future XRP escrow rights. The idea continues to circulate because it would allow institutions to gain exposure to the cryptocurrency without immediately affecting the circulating supply. 

Crypto Sensei also notes that Ripple locks about 700 million XRP in escrow each month, raising questions about whether these transfers may represent sales. The analyst argues that if sales were occurring, the on-chain trail would clearly show tokens moving to buyers’ wallets, but the data does not reflect this. He highlighted that the current evidence points to a far more controlled internal process rather than large-scale institutional distributions

XRP price chart from Tradingview.com (Ripple)

❌