Reading view

There are new articles available, click to refresh the page.

Major Ethereum Whale Returns: Buys $119M In ETH Amid Market Drop

Ethereum is struggling to regain momentum after failing to reclaim the $3,200 level, keeping the market in a fragile equilibrium. Despite several recovery attempts, price action suggests that bulls are now focused less on pushing higher and more on defending current demand zones. This hesitation reflects broader uncertainty across the crypto market, where traders remain cautious amid tightening liquidity and elevated macro risk.

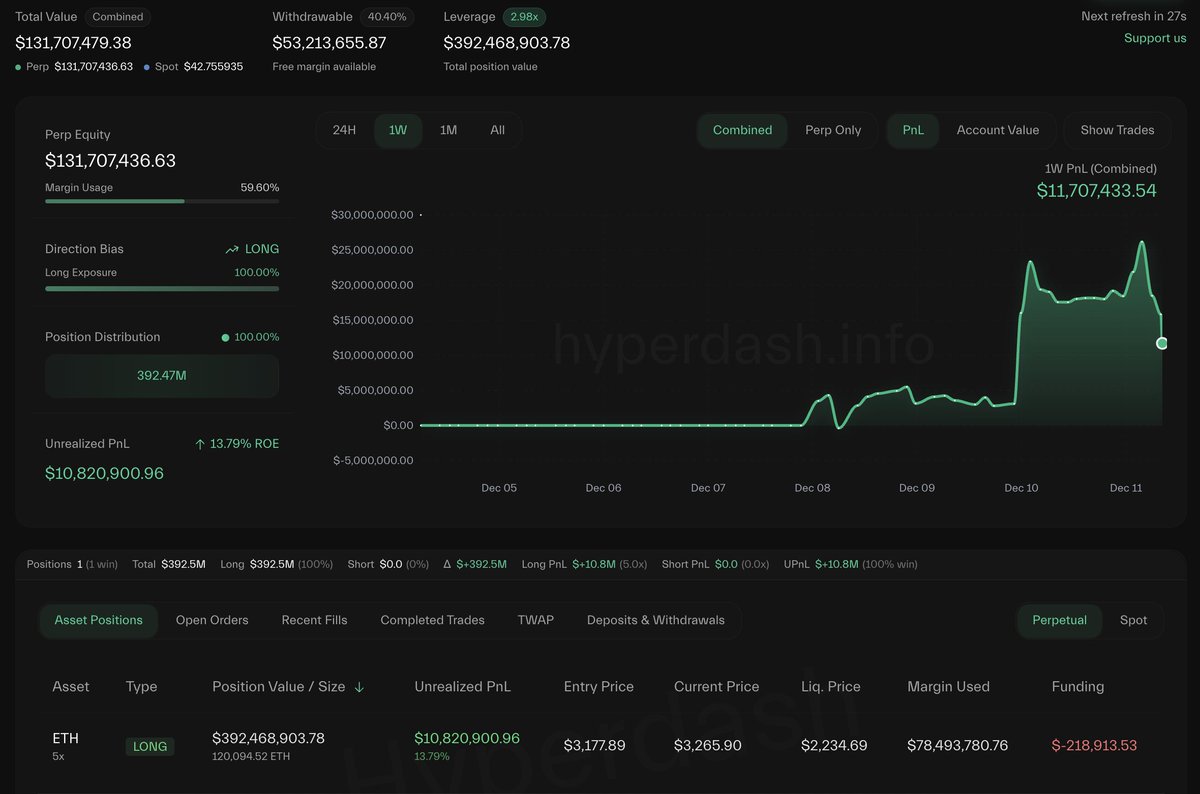
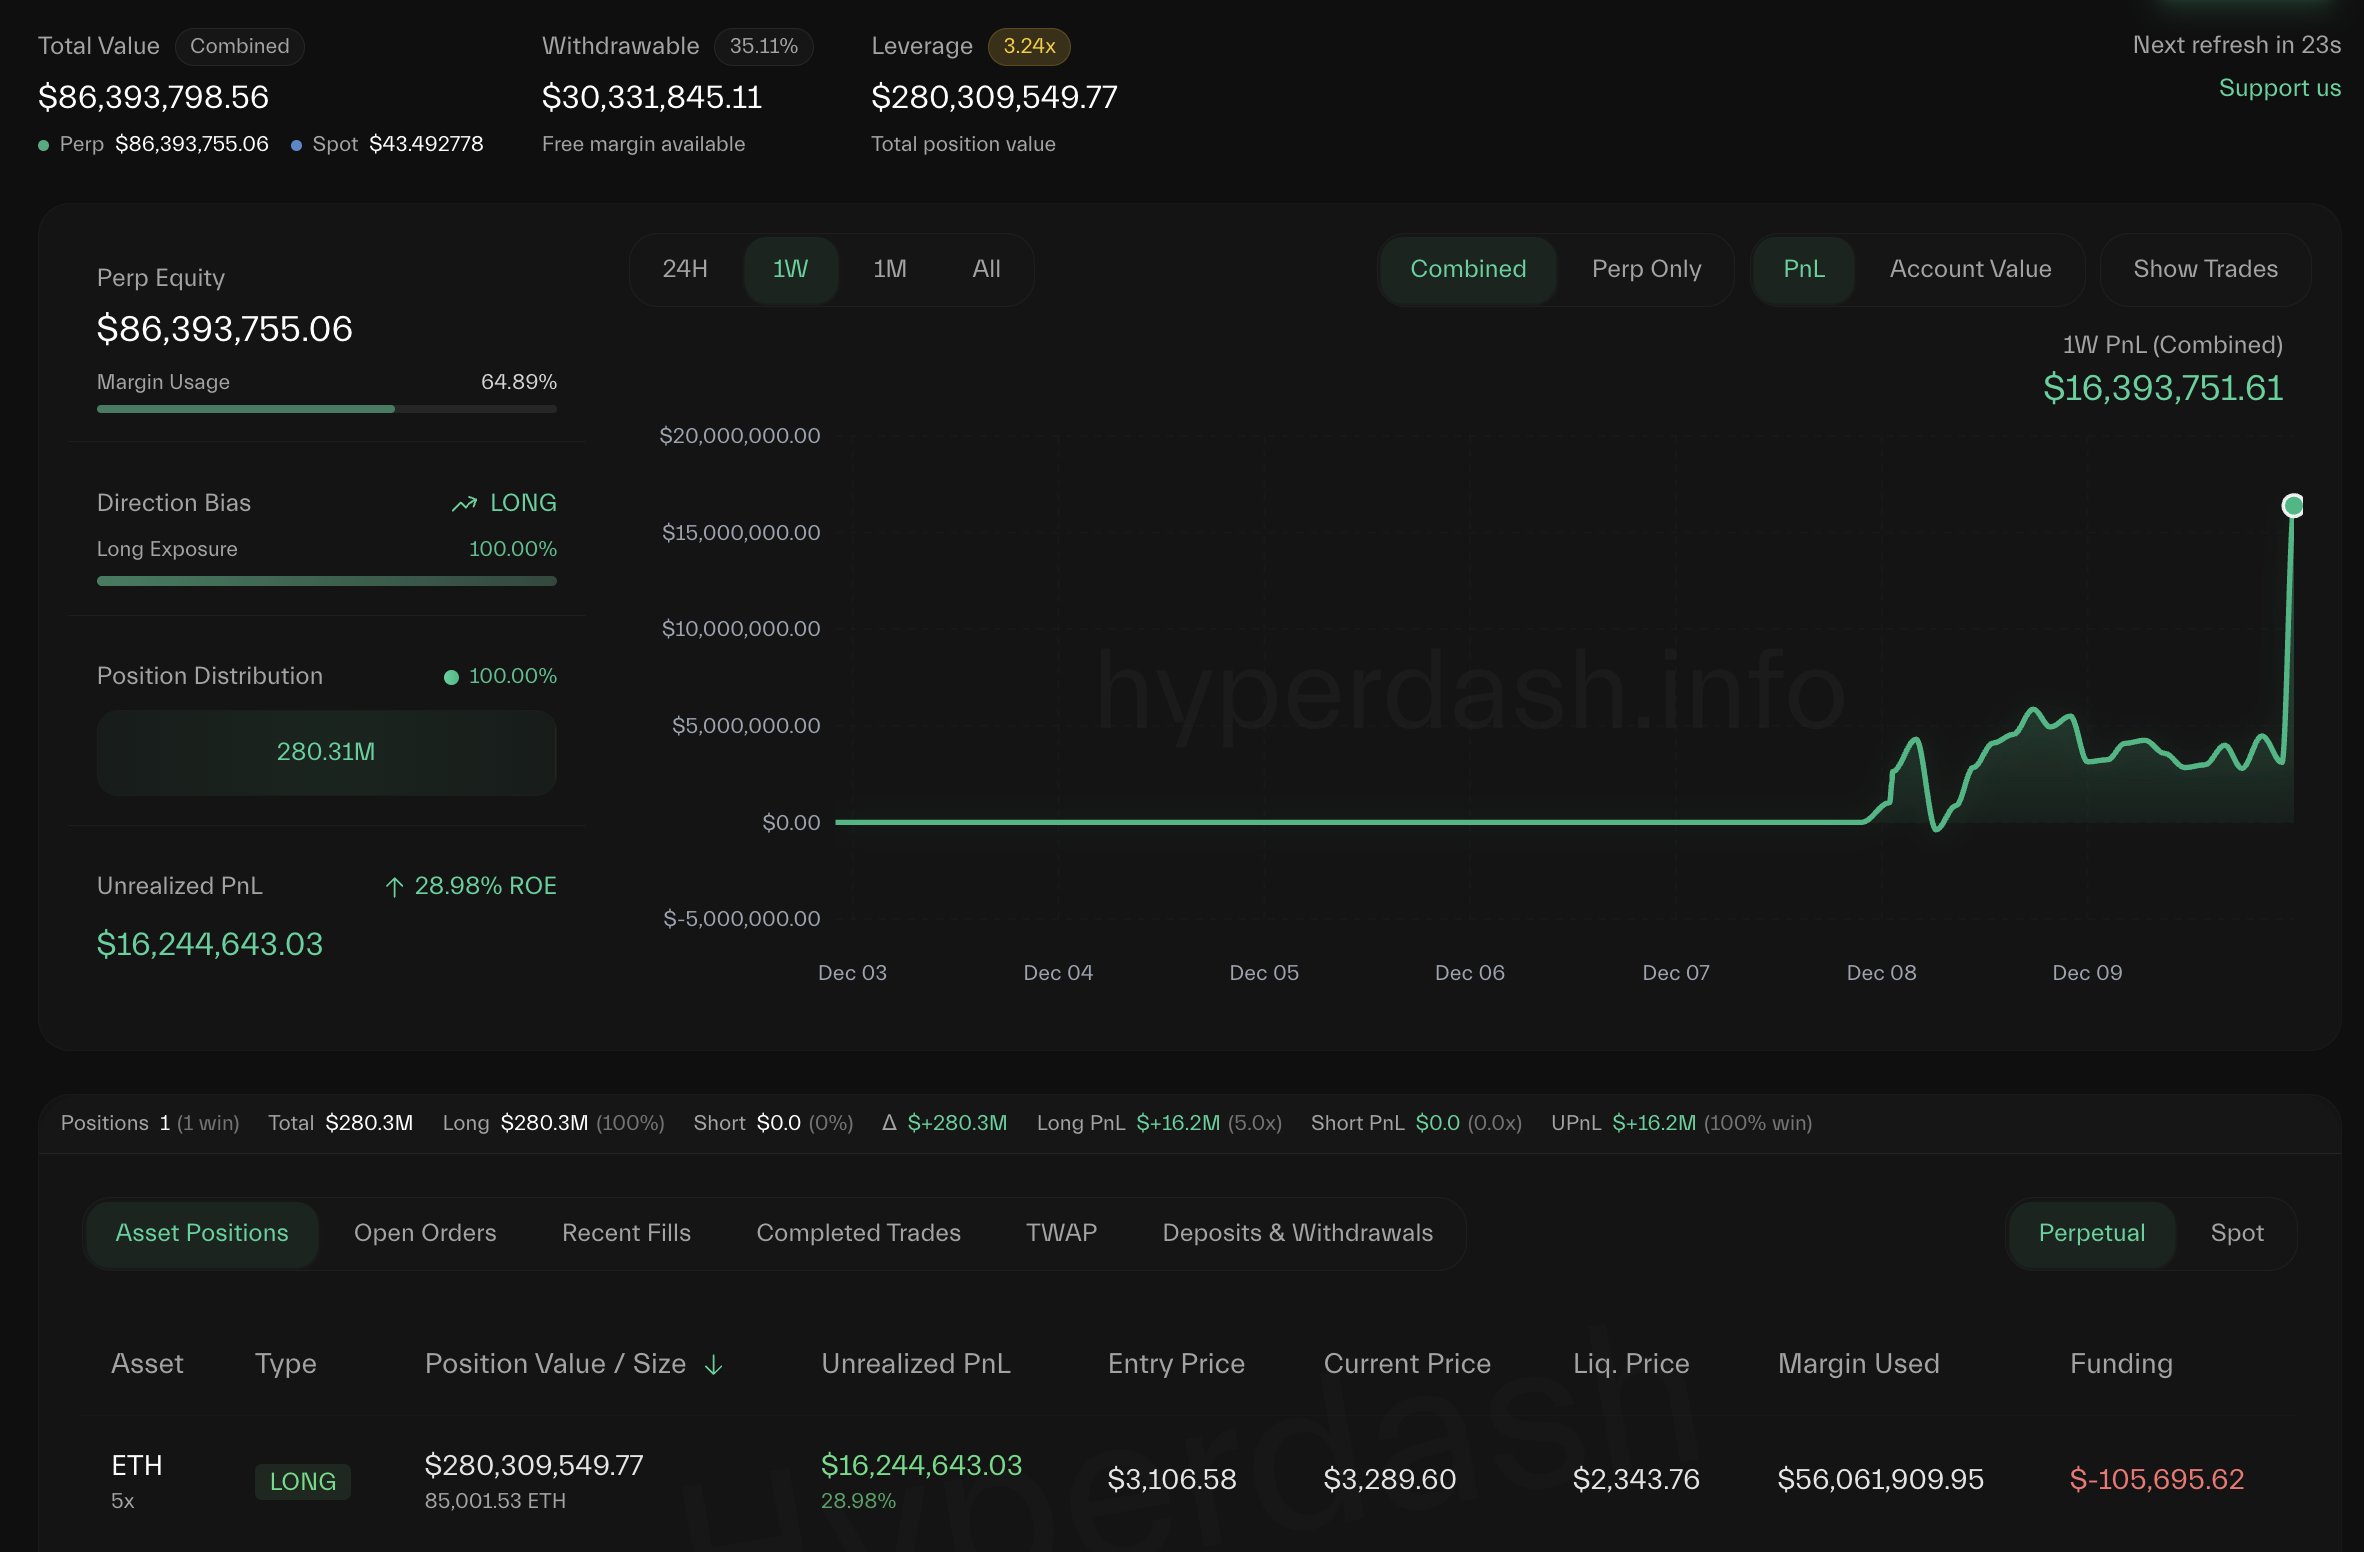
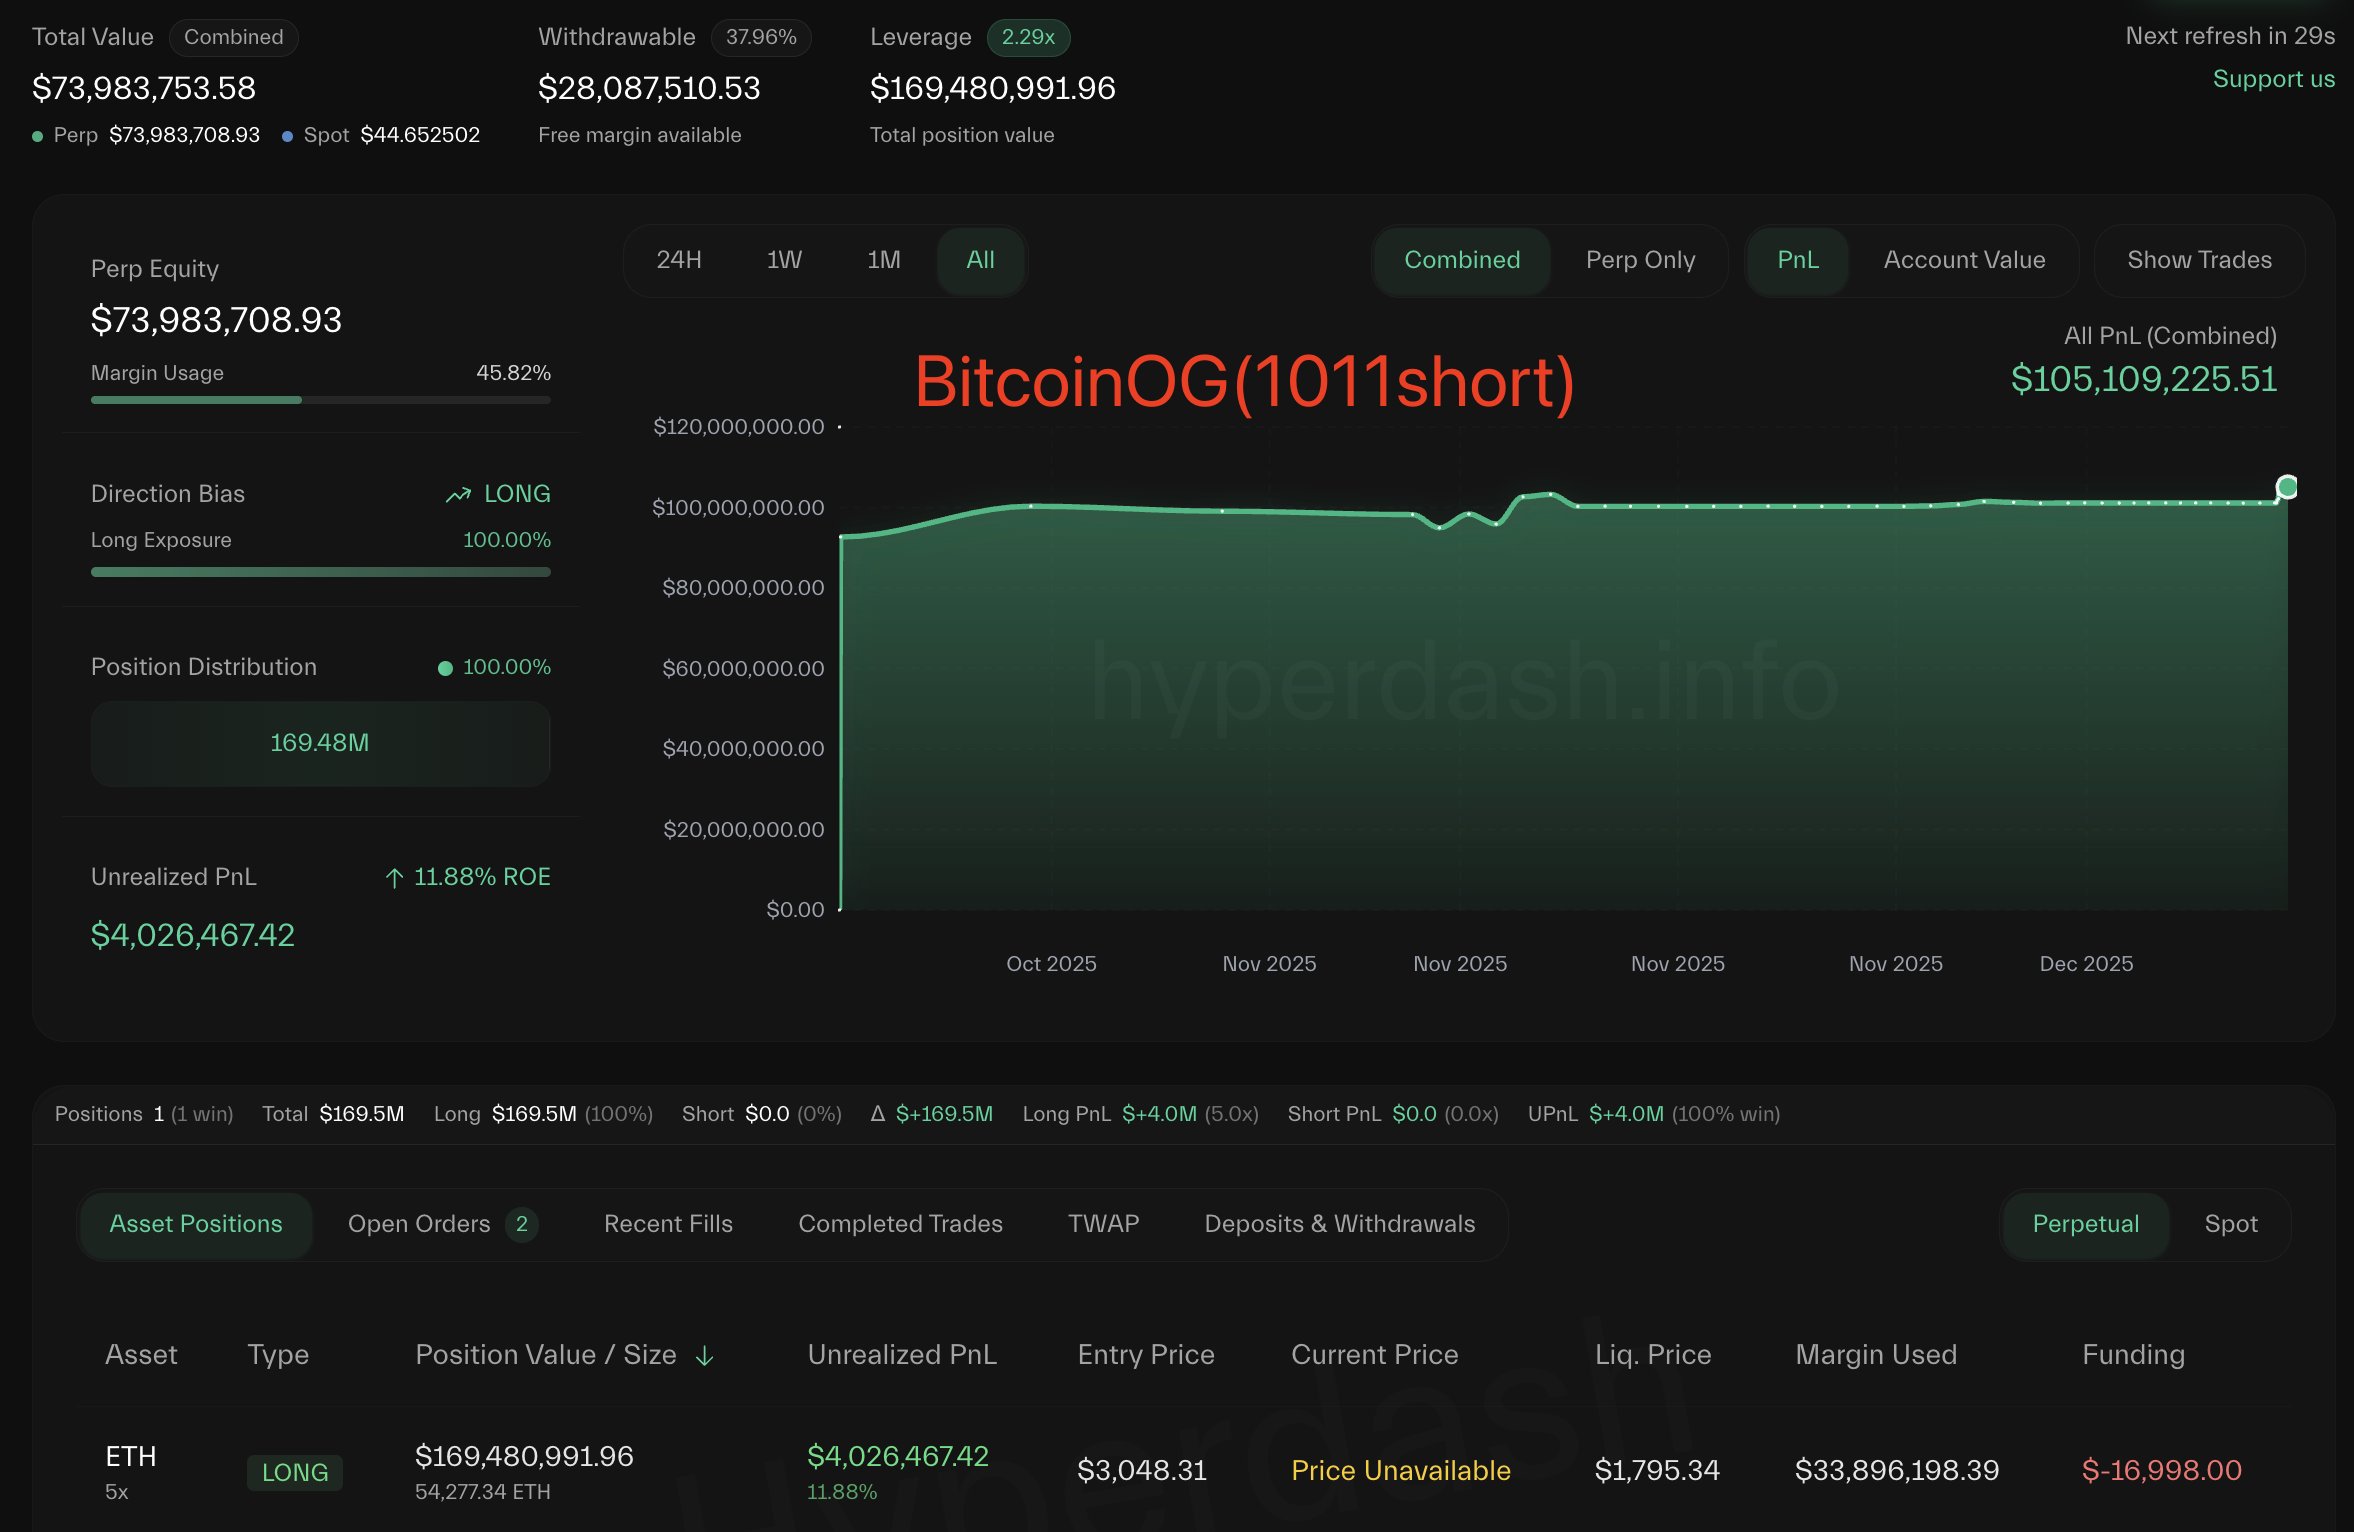
However, beneath the surface, on-chain activity is beginning to tell a more nuanced story. According to Lookonchain, data sourced from Arkham reveals that a major market participant has re-entered aggressively. The so-called 66kETHBorrow Whale, who previously accumulated 489,696 ETH worth roughly $1.5 billion, has started buying Ethereum again as prices declined.

This behavior stands out because it occurred during weakness rather than strength, a pattern typically associated with strategic accumulation rather than short-term speculation.

Whale activity during drawdowns often signals confidence in higher prices over a longer time horizon, even when sentiment remains fragile. While Ethereum still faces technical resistance overhead, the return of large buyers suggests that demand is weak but has not disappeared.

Whale Accumulation Raises Questions Amid Ethereum Weakness

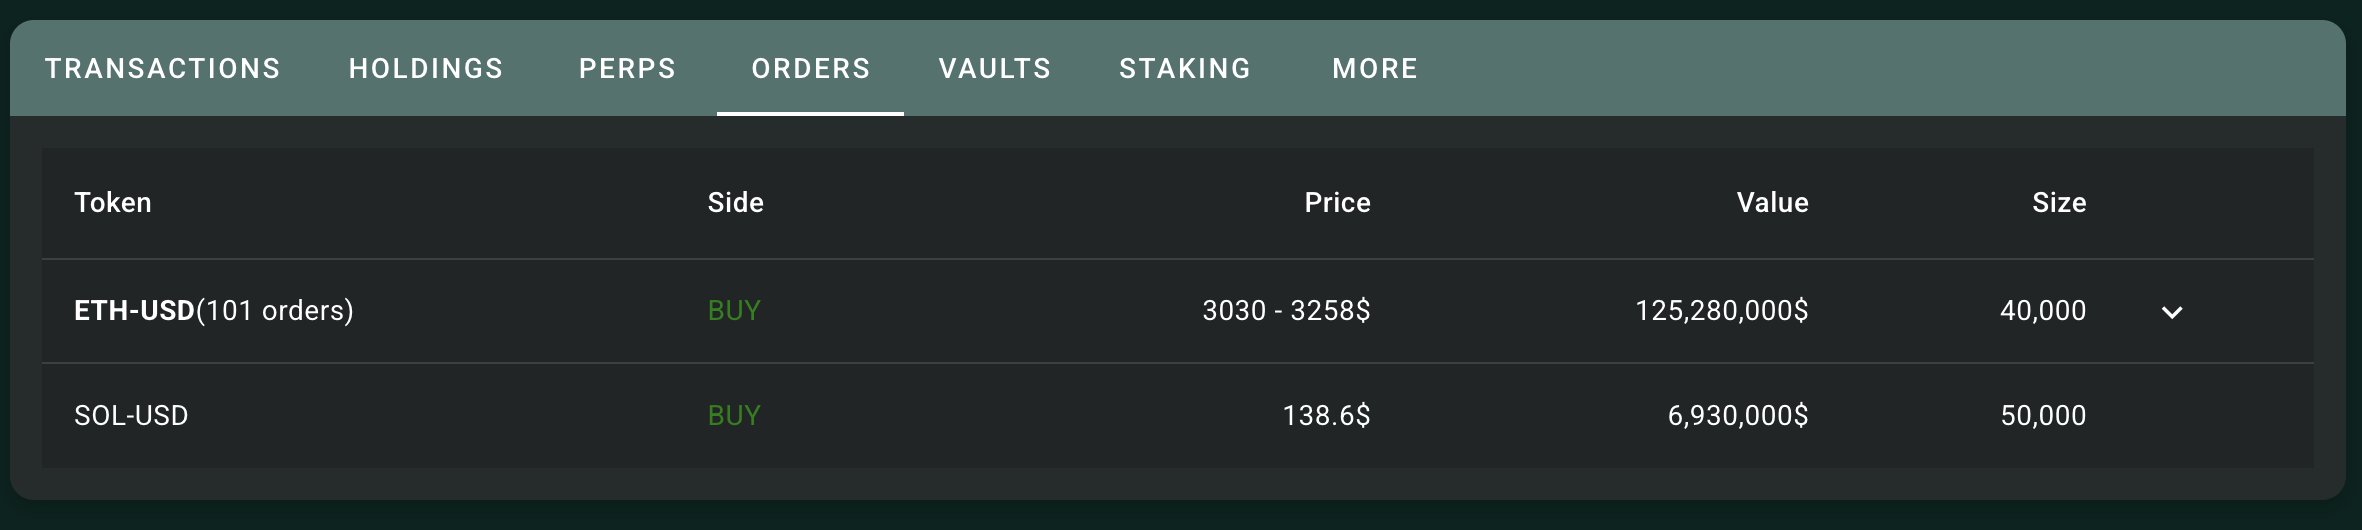
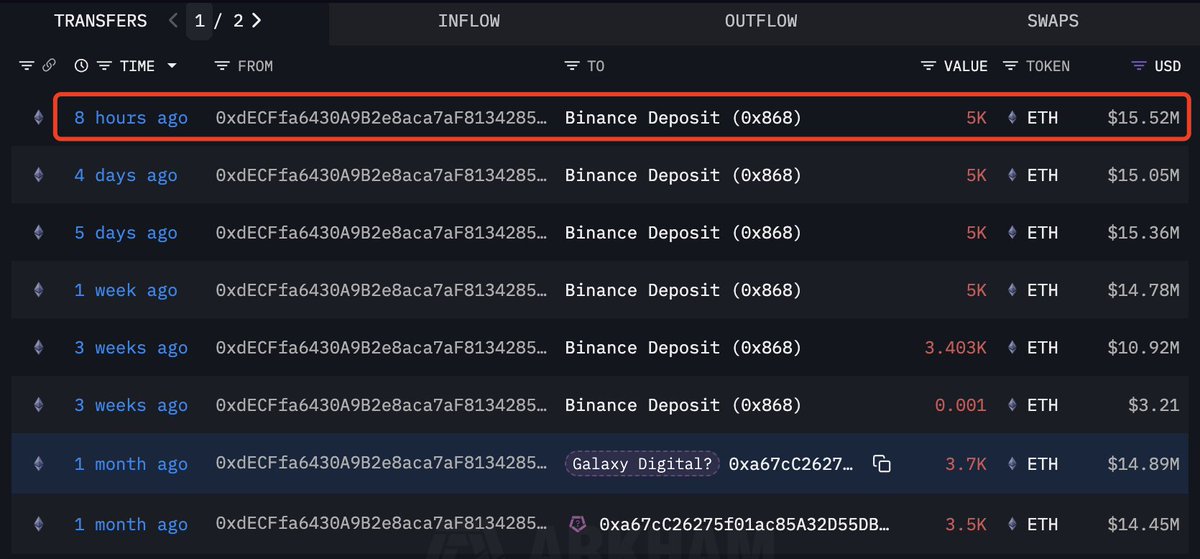
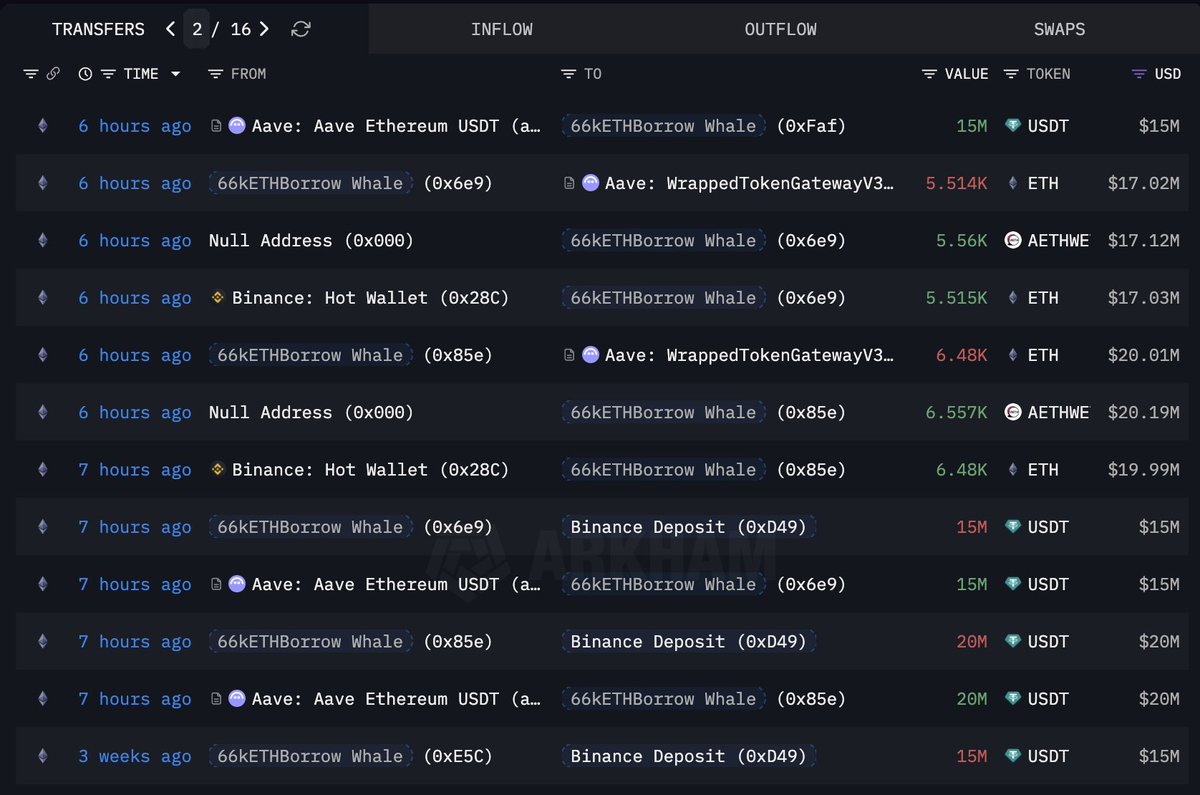
Lookonchain data provides further insight into the recent actions of the 66kETHBorrow whale, highlighting a sequence that has drawn significant attention from the market. Over the past eight hours, the whale borrowed approximately $85 million in USDT from Aave and transferred the funds to Binance.

Shortly after, he withdrew 38,576 ETH, valued at roughly $119.3 million, from the exchange. This rapid movement of capital during a market pullback has raised questions among smaller investors, many of whom are wondering whether this whale is acting on information or conviction that is not yet reflected in price.

Ethereum Whale Transactions | Source: Arkham

Such behavior is often interpreted as deliberate accumulation, particularly when ETH is withdrawn from exchanges rather than left on trading platforms. Exchange outflows generally reduce immediate sell-side liquidity, reinforcing the perception of long-term positioning. However, it is critical to acknowledge the limits of on-chain visibility. These transactions represent only the wallets that have been publicly identified and tracked.

There is no certainty that this whale’s exposure is fully transparent. He could be holding hedges, short positions, or additional long exposure through other wallets, centralized exchanges, or derivatives markets that are not visible on-chain. As a result, while the activity suggests confidence, it should not be interpreted as definitive directional confirmation.

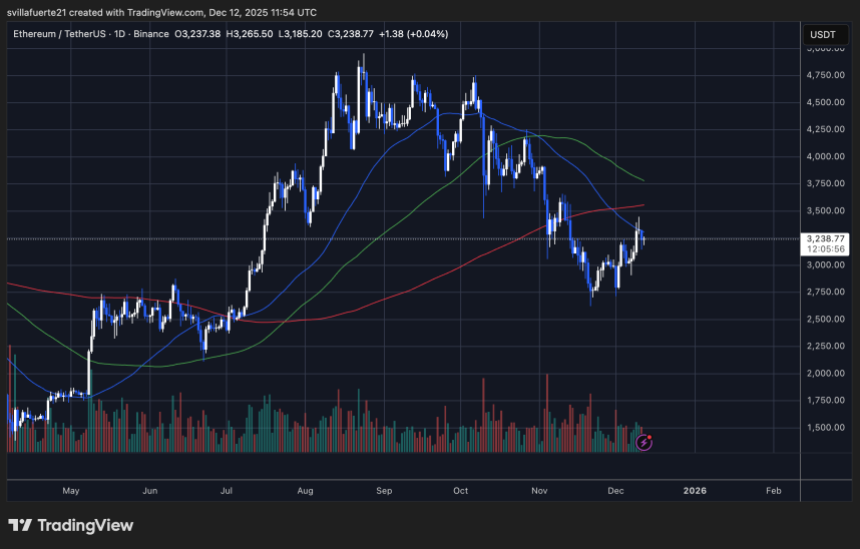
ETH Price Struggles Below Key Moving Averages

Ethereum is currently trading near the $3,150–$3,200 zone after a modest rebound, but the broader technical structure remains fragile. On the daily chart, ETH continues to trade below its 50-day and 100-day moving averages, both of which are now acting as dynamic resistance. The recent bounce stalled near the declining 50-day MA, highlighting the lack of strong follow-through from buyers.

ETH consolidates below supply zone | Source: ETHUSDT chart on TradingView

The 200-day moving average, positioned closer to the $3,500 area, remains well above current price levels. This reinforces that Ethereum is still in a corrective phase within a larger macro uptrend. As long as price remains below this long-term trend indicator, upside attempts are likely to face selling pressure from both swing traders and systematic strategies.

Price action over the past weeks shows a series of lower highs following the rejection near $4,000 in October, confirming a short-term bearish market structure. However, ETH has so far defended the $2,800–$2,900 support region, suggesting that buyers are still active at lower levels.

For Ethereum to shift momentum decisively, bulls must reclaim and hold above the $3,300–$3,400 range. Failure to do so keeps downside risks open, with a potential retest of prior demand zones if broader market sentiment deteriorates.

Featured image from ChatGPT, chart from TradingView.com

Covered Call Selling by Bitcoin Whales Is Weighing on Spot Prices, Analyst Says

By: Amin Ayan

Bitcoin’s struggle to regain upside momentum near the $90,000 level may be less about weak demand and more about how large, long-term holders are managing their exposure, according to market analyst Jeff Park.

Key Takeaways:

  • Bitcoin’s muted price action near $90,000 is being driven by covered call selling from long-term holders rather than weak spot demand.
  • Market makers hedging those options by selling BTC are adding steady sell-side pressure that caps rallies.
  • Options market activity is increasingly shaping short-term Bitcoin price moves, even as ETF inflows remain strong.

He argues that widespread covered call selling by Bitcoin “whales” is quietly suppressing spot prices, even as institutional interest through exchange-traded funds remains strong.

Bitcoin OGs Turn to Covered Calls to Generate Yield on Long-Held BTC

Covered calls involve selling call options against Bitcoin already held, allowing sellers to collect premiums while giving buyers the right to purchase BTC at a predetermined price.

Park said this strategy is increasingly favored by long-term holders, often referred to as “OGs,” who accumulated Bitcoin years ago and now use options markets to generate short-term income.

The impact, however, extends beyond the options market. Market makers who buy these call options must hedge their exposure, typically by selling spot Bitcoin.

That hedging activity introduces persistent sell-side pressure, pushing prices lower or capping rallies.

“When you sell calls against Bitcoin you’ve held for more than a decade, the only fresh market exposure comes from the call selling itself,” Park said.

“That exposure is negative, making the seller a net source of downward pressure.”

Tom Lee: Bitcoin very likely hits $100k, maybe new ATH

Same guy who said $250k by year end

Now backpedaling to barely above current price while calling it bullish

This is what talking your bags looks like when the trade goes against you https://t.co/eQf5mnnUUo pic.twitter.com/5U6KRVWlfX

— Leshka.eth ⛩ (@leshka_eth) December 14, 2025

Because the Bitcoin used to back these options already exists and does not represent new demand, the strategy fails to add fresh liquidity to the market.

Instead, it shifts price influence toward derivatives trading, where options flows increasingly dictate short-term price action.

Park said this dynamic helps explain why Bitcoin has remained choppy despite steady inflows into spot ETFs.

The trend has coincided with Bitcoin’s partial decoupling from US equities in the latter half of 2025. While major stock indices continued to hit record highs, Bitcoin retreated from earlier peaks and hovered near $90,000.

Some analysts had previously pointed to Bitcoin’s correlation with tech stocks, but recent price behavior suggests different forces are now at play.

Analysts Split on Bitcoin’s Next Move as Fed Rate Cuts Loom

Looking ahead, opinions remain divided. Several analysts expect Bitcoin to resume its rally once the US Federal Reserve continues its rate-cutting cycle, which would inject liquidity into financial markets and favor risk assets.

CME Group’s FedWatch tool shows that 24.4% of traders are pricing in another rate cut at the January FOMC meeting.

Others remain cautious. A growing camp warns that if covered call selling persists and macro conditions fail to improve, Bitcoin could revisit lower levels, with some projecting a drop toward $76,000.

Last week, Bitfinex said the market is showing “seller exhaustion” following a period of heavy deleveraging and panic-driven exits by short-term holders.

The post Covered Call Selling by Bitcoin Whales Is Weighing on Spot Prices, Analyst Says appeared first on Cryptonews.

Ethereum Trades Near Whales’ Cost Basis For The Fourth Time Since 2021 – Historic Test

Ethereum is trading above the $3,200 level as bulls attempt to push the price back toward higher resistance zones, but market sentiment remains fragile. Fear and uncertainty continue to dominate as several analysts warn that the broader trend may still point toward a potential bear market. Yet, beneath the volatile price action, key on-chain data is revealing a development that could shape Ethereum’s next major phase.

According to a new report from CryptoQuant, a historic signal tied to the realized price of whales holding more than 100,000 ETH has emerged once again. This metric, which tracks the average cost basis of the largest holders, has only been tested a handful of times over the past five years.

Each instance occurred during decisive turning points in Ethereum’s macro trend. Whenever ETH approached or traded near this realized price, it signaled either the exhaustion of a deep downtrend or the beginning of a strong recovery phase.

Today, Ethereum is once again hovering near this critical threshold. With analysts divided and sentiment weakening, the whale realized price has become one of the most important indicators to monitor. Whether ETH bounces or breaks here may determine the direction of the next major trend cycle.

Whale Realized Price as a Cycle-Defining Threshold

The CryptoQuant report highlights the significance of Ethereum’s proximity to the realized price of whales holding at least 100,000 ETH. According to the analysis, ETH has traded very close to this level only four times in the last five years.

Ethereum Realized Price (Balance > 100K ETH) | Source: CryptoQuant

Two of those instances occurred during the capitulation phase of the 2022 bear market, when selling pressure peaked, and long-term confidence was severely tested. The other two have happened this year, underscoring how unusual and cycle-defining the current environment has become.

What makes this metric particularly important is its historical reliability. In the past five years, Ethereum has never traded below the realized price of these mega-whales. This level has consistently acted as a structural floor, signaling areas where the largest and most sophisticated holders refuse to sell at a loss. Their behavior often marks moments of deep undervaluation or macro exhaustion within the market.

Today, that realized price sits near the $2,500 range, placing Ethereum within striking distance of a level that has repeatedly separated long-term accumulation zones from full-scale trend reversals. If ETH holds above this threshold, it would reinforce the idea that large holders still see long-term value—despite fear dominating broader market sentiment.

Ethereum Attempts Recovery but Faces Major Overhead Barriers

Ethereum’s daily chart shows a market attempting recovery, yet still constrained by significant structural resistance. After rebounding from the sub-$2,900 zone, ETH has reclaimed the $3,200 level and is currently trading near $3,238. While this bounce reflects short-term strength, the broader trend remains fragile.

ETH testing critical resistance level | Source: ETHUSDT chart on TradingView

The price is encountering the 50-day moving average, which has acted as dynamic resistance throughout the decline from September’s peak. ETH briefly pierced above it but failed to secure a strong close, signaling hesitation from buyers.

The 100-day and 200-day moving averages remain well above the current price, reinforcing that Ethereum is still operating beneath major trend markers. These moving averages are likely to form an overhead cluster of resistance between $3,400 and $3,600—an area where sellers previously overwhelmed bullish attempts.

Structurally, ETH is forming a potential higher low, but it has not yet produced a higher high—an essential condition for confirming a trend reversal. A clean breakout above $3,350 would strengthen bullish momentum. Conversely, losing $3,150 risks reopening a path toward $3,000 and potentially retesting deeper support levels.

Featured image from ChatGPT, chart from TradingView.com

XRP Whale Activity Spikes At The Bottom – A Classic Pre-Rally Signal

XRP has been under clear pressure in recent sessions, sliding toward its lowest price of the year as the broader crypto market continues to absorb heavy selling. Sentiment remains fragile, and many traders have shifted into defensive positioning while awaiting clearer macro signals.

According to a new report from CryptoQuant, however, the underlying picture is more complex than the price chart suggests. Despite the short-term decline, XRP whales are becoming increasingly active, showing no hesitation in trading and accumulating even as retail participation weakens.

This divergence between whale behavior and market sentiment is noteworthy. Historically, XRP’s most significant recoveries have begun during phases of deep pessimism, when large holders quietly build exposure rather than chase rallies.

The latest data confirms this pattern: while price approaches yearly lows, whale-driven transaction volume has risen, signaling that high-value wallets are repositioning rather than exiting.

Whale Accumulation and CVD Shift Signal a Potential XRP Bottom

The CryptoQuant report highlights that the recent surge in whale activity follows a pattern often observed during market bottoming phases. Large holders rarely accumulate aggressively during strong uptrends; instead, they tend to build positions quietly during periods of weakness, when sentiment is poor, and prices are depressed.

Their willingness to buy in the current environment—while XRP trades near yearly lows—suggests strategic positioning rather than speculative momentum chasing.

This behavior is typically interpreted as a pre-rally signal. When whales accumulate into weakness, it indicates confidence that current prices offer value and that the downside may be limited. Historically, such phases have preceded meaningful upside moves in XRP, as whale accumulation often absorbs available sell pressure and stabilizes market structure.

Supporting this view, the report also points to a notable shift in the XRP Spot Taker CVD, which has turned taker-buy dominant. This means that aggressive buyers are now driving more of the executed volume, reflecting strengthening demand in real time. A taker-buy dominant CVD often emerges before sustained rallies, as it highlights increasing willingness among market participants to buy at the ask rather than wait for dips.

XRP Ledger Spot Taker CVD | Source: CryptoQuant

Together, rising whale accumulation and a bullish CVD trend paint an increasingly constructive backdrop for XRP’s medium-term outlook.

Price Analysis: Testing Yearly Lows as Structure Weakens

XRP continues to trade near its yearly lows, with the chart showing a clear deterioration in trend structure. Price remains pinned below all major moving averages—the 50-day, 100-day, and 200-day—indicating that bullish momentum has not yet returned. The persistent rejection at the 50-day moving average throughout November and December highlights the strength of overhead resistance and the absence of sustained buying pressure from the broader market.

XRP consolidates around key level | Source: XRPUSDT chart on TradingView

The $2.00 region, now acting as a key horizontal support, has been tested multiple times over the past month. Each retest shows reduced volatility, suggesting that sellers are no longer driving aggressive breakdown attempts. But demand remains too weak to generate a meaningful rebound. A decisive loss of this level could open the door toward the $1.80–$1.90 support zone. XRP previously consolidated during the early stages of the 2025 rally.

Volume also confirms the broader downtrend. Selling spikes stand out noticeably, whereas buy-side volume remains muted. This imbalance reinforces the prevailing bearish structure, even as whale accumulation begins to appear on-chain.

For XRP to shift out of this downtrend, bulls must reclaim the 50-day moving average and produce higher lows. Until then, the chart signals continued caution. Whale activity must begin translating into visible spot demand, or the risk skews to the downside.

Featured image from ChatGPT, chart from TradingView.com

Half-Billion Dollar Bet: Bitcoin OG Scales Multi-Asset Long To $611 Million

Bitcoin enters the week trapped in a tight consolidation range, reflecting a market caught between caution and expectation. Price action has stalled as traders wait for clearer direction after the recent Federal Reserve decision and ongoing macro uncertainty.

Yet beneath the surface, whale activity tells a very different story. According to Lookonchain, one of the most notable market participants—the famous BitcoinOG, known for accurately shorting the market during the sharp October 10 crash—is now aggressively expanding his long exposure across multiple assets.

His current positioning is substantial: 150,466 ETH valued at approximately $491 million, 1,000 BTC worth $92.6 million, and 212,907 SOL totaling $27.8 million. Rather than scaling out or reducing risk during this period of market hesitation, he continues to build, signaling strong conviction in a broader recovery across major cryptocurrencies.

While retail traders and smaller speculators wait for confirmation, this whale is positioning early, anticipating a potential shift in momentum. His actions add a new layer of intrigue to Bitcoin’s consolidation, raising the question of whether smart money is preparing for a trend reversal while the rest of the market hesitates.

Whale Positioning and Strategic Bids Ahead

Lookonchain reports, citing Hypurrscan data, that this whale isn’t just holding an already massive multi-asset long position—he is strategically preparing to increase exposure even further. According to the data, he has placed limit orders to add an additional 40,000 ETH in the $3,030–$3,258 price range and 50,000 SOL at $138.6. These levels are positioned just below current market prices, suggesting he expects—or is at least prepared for—a deeper pullback before the next major move.

Bitcoin OG Whale Orders | Source: Hypurrscan

This behavior is notable because it reflects a deliberate accumulation strategy rather than impulsive buying. By setting large bids at key support zones, he aims to capture liquidity during periods of volatility, effectively using market weakness to scale into long-term positions. Such an approach is typical of sophisticated traders who rely on structured entries rather than reacting to short-term fluctuations.

The scale of these pending orders also indicates that his conviction extends beyond his already massive exposure. If filled, these additions would significantly increase his leverage in the broader crypto market, particularly in Ethereum and Solana. For observers, this raises an important question: is this smart money positioning ahead of a potential macro-driven rebound, or is it a high-risk bet into an uncertain environment?

Bitcoin Price Analysis: Testing Support, Lacking Momentum

Bitcoin’s latest price action on the 3-day timeframe shows a market stuck between recovery attempts and lingering downside pressure. After the sharp November sell-off, BTC stabilized above the $90,000 zone, which is now acting as a short-term support area. Price briefly dipped below this level but was quickly bought back, suggesting that buyers are still defending the region. However, the rebound remains shallow, and the structure lacks the strong momentum typically seen during bullish reversals.

BTC consolidates around key support | Source: BTCUSDT chart on TradingView

The chart shows BTC trading below the 50-day and 100-day moving averages, both of which have now turned downward. This alignment reflects a shift toward medium-term bearish conditions. The 200-day moving average currently sits below the price and has become the most important dynamic support; BTC is hovering directly above it. Historically, when Bitcoin holds the 200-day MA after a major correction, a consolidation phase often follows before a decisive move.

Volume also reinforces the uncertainty. Despite multiple attempts to push higher, buying volume remains muted compared to previous rallies, indicating limited conviction from bulls. Until BTC breaks convincingly above the 50-day MA region near $100K, the market will likely remain in a cautious, range-bound state.

Featured image from ChatGPT, chart from TradingView.com

Bitcoin Whales Refuse to Sell: Historic Signal Emerges As Binance CDD Drops To 2017 Levels

Bitcoin has retraced below the $91,000 level following the Federal Reserve’s decision to cut interest rates by 25 basis points, a move that initially generated volatility across risk assets. While the market’s reaction has leaned bearish in the short term, on-chain data tells a very different story beneath the surface.

According to new insights from CryptoQuant, one of the most striking signals comes from the Exchange Inflow Coin Days Destroyed (CDD) metric on Binance, which has fallen sharply to 380, its lowest reading since September 2017.

CDD is one of the most important indicators for understanding long-term holder behavior because it assigns greater weight to older coins that have accumulated more “coin days.” Low values mean that the BTC moving onto exchanges is predominantly from short-term traders, not long-term holders.

In other words, veteran holders — the investors who historically move markets — are refusing to sell, even as Bitcoin trades near cycle highs.

Long-Term Holders Signal Strong Conviction

CryptoOnchain highlights that the significance of this CDD collapse becomes far clearer when viewed against Bitcoin’s current price context. With BTC trading near $89,600, the market is witnessing an unusually large divergence between price action and long-term holder behavior.

Historically, when Bitcoin approaches or surpasses all-time highs, long-held coins tend to move — triggering spikes in CDD as early investors and whales take profits. This pattern has repeated across past cycles, making elevated CDD a classic top-signal.

Bitcoin Exchange Inflow CDD | Source: CryptoQuant

But this time, the exact opposite is happening. Instead of old coins entering exchanges, Exchange Inflow CDD is collapsing, indicating that almost none of the BTC being deposited onto Binance comes from long-term wallets. CryptoOnchain explains that this phenomenon strongly suggests that Smart Money and long-term whales have zero interest in selling at these levels, even after a multi-month correction.

This refusal to distribute supply removes a major source of overhead resistance and reflects a market dynamic driven increasingly by strong hands. The absence of long-term sell pressure reduces the available liquid supply, often preceding powerful bullish expansions. In simple terms, whales are signaling confidence — not caution — despite short-term volatility, reinforcing the narrative that Bitcoin may be preparing for its next major move.

Bitcoin Price Action: Testing Support Amid Weak Momentum

Bitcoin’s 3-day chart shows the market stabilizing just above the $90,000 level after last week’s sharp post-FED decline. Price remains compressed between the 200-day moving average (red line)—currently acting as primary support—and the 100-day moving average (green line) overhead, which continues to cap upward momentum. This creates a classic squeeze structure where BTC is holding its ground but struggling to reclaim lost trend levels.

BTC consolidates around key level | Source: BTCUSDT chart on TradingView

The recent candle structure highlights a series of higher lows forming near the $89K–$90K region, suggesting buyers are defending this zone as a short-term floor. However, the rejection from the 100-day MA reinforces the broader bearish shift, as BTC remains below both key trend indicators and is yet to reclaim the breakdown level around $100K.

Volume also tells an important story: despite the bounce, buy-side conviction appears weak. The rebound has not been accompanied by a spike in demand, indicating that market participants are cautious following the rate cut and macro uncertainty.

If Bitcoin loses the 200-day MA, the next major support lies closer to $84K, which would open the door to a deeper retracement. Conversely, a decisive close above the 100-day MA near $98K would signal momentum returning to the bulls. For now, BTC remains in a fragile consolidation with limited directional strength.

Featured image from ChatGPT, chart from TradingView.com

This Whale Isn’t Stopping: $392M Ethereum Long And A Tight Liquidation Price Revealed

Ethereum has retraced to the $3,160 level following the highly anticipated FOMC meeting, where the Federal Reserve cut interest rates by 25 basis points. While rate cuts typically support risk assets, Jerome Powell’s comments added a new layer of uncertainty to the market.

By openly acknowledging the risks of weaker growth paired with persistent inflation, Powell introduced the possibility of stagflation—a scenario that historically challenges both equities and crypto. As a result, sentiment across the market remains fragile, and investors are struggling to interpret what this macro shift could mean for Ethereum’s next move.

Despite the volatility surrounding the decision, one major whale continues to act with conviction. According to Lookonchain, the Bitcoin OG who famously shorted the market during the October 10 crash is once again doubling down on his bullish Ethereum position.

Instead of taking profits or reducing exposure after the recent rally, he has continued accumulating aggressively, signaling a strong belief in ETH’s medium-term trajectory even as broader sentiment turns cautious.

Whale Position Ramps Up, But Risk Is Rising

According to Lookonchain, the whale’s position has now surged to 120,094 ETH, valued at approximately $392.5 million. With a liquidation price at $2,234.69, this has become one of the largest and most aggressive long positions currently tracked on-chain.

Bitcoin OG Ethereum Position | Source: Hyperdash

Such a massive allocation signals extreme conviction, especially coming from the same Bitcoin OG who successfully shorted the market during the October 10 crash. However, the scale of this bet also highlights how much risk is now concentrated in a single directional position.

The liquidation price is a key concern. At $2,234, it sits nearly $1,000 below current levels, but in highly leveraged environments—especially during macro uncertainty—prices can retrace violently. Ethereum has already shown a tendency toward sharp intraday moves, and with funding rates rising and leverage across the market stretching to historical highs, even a moderate correction could trigger cascading liquidations.

If ETH experiences a sudden spike in volatility due to shifting macro conditions, a negative reaction to the latest FOMC decision, or a broader market unwind, the whale’s position could come under significant pressure. While large whales often influence market sentiment, this setup illustrates how thin the margin for error has become.

ETH Testing Resistance While Momentum Weakens

Ethereum has retraced to the $3,196 level after failing to hold above the $3,300 zone, signaling that bullish momentum is beginning to weaken. The daily chart shows ETH rejecting the red 200-day moving average, a key long-term trend indicator that has acted as resistance throughout the recent downtrend. Until ETH breaks and closes decisively above this level, the broader structure remains vulnerable.

ETH consolidates below key resistance | Source: ETHUSDT chart on TradingView

The 50-day moving average is still sloping downward, reflecting persistent selling pressure despite last week’s rebound. Meanwhile, the 100-day moving average sits well above the current price, reinforcing the heavy overhead resistance ETH must overcome to reestablish a bullish trend. Volume has also declined compared to the early December bounce, suggesting buyers are losing strength as price approaches major resistance levels.

Related Reading: Bitcoin Exchange Reserves Fall To Lowest Levels on Record: The Bullish Signal Most Traders Are Missing

Structurally, ETH remains in a mid-term downtrend, forming lower highs and lower lows since September. Although the recent push from the $2,800 region shows buyers defending key support, the rejection at $3,350 highlights that sellers are still in control at higher levels.

If ETH fails to regain the 200-day moving average soon, a retest of the $3,050–$3,100 support range becomes likely. Conversely, a strong reclaim above $3,350 could open the door for a move toward $3,500, but the market will need renewed momentum to get there.

Featured image from ChatGPT, chart from TradingView.com

The Whale Who Can’t Stop Buying: BitcoinOG Scales Ethereum Long To $280M After Price Surge

Ethereum is trading with renewed strength after breaking above the $3,300 level and briefly pushing toward $3,400, signaling a potential shift in short-term momentum. However, despite this recovery, bullish conviction remains fragile. Many analysts continue to warn that the broader trend still leans bearish, emphasizing that Ethereum has yet to reclaim the structural levels needed to confirm a macro reversal.

Yet one signal has captured significant attention: according to fresh data from Lookonchain, a major whale known as BitcoinOG has doubled down on his Ethereum long position. This trader is widely recognized for being the whale who successfully shorted Bitcoin during the October 10 market crash, a move that earned him substantial profits and elevated his reputation across the on-chain analysis community.

Rather than taking profits after ETH’s recent pump, he has expanded his long exposure—an unusually aggressive stance at a time when most traders remain cautious.

His renewed commitment raises questions about whether smart money is quietly positioning for a larger upside move, even as broader sentiment remains skeptical. If momentum holds, Ethereum may be preparing for a far more significant move than the market currently expects.

Whale Positioning and FOMC Impact

According to Lookonchain, the whale known as BitcoinOG has now expanded his position to 85,001 ETH, valued at roughly $280 million, and is currently sitting on more than $16 million in unrealized profit. Such an aggressive accumulation during a period of widespread caution signals a notable divergence between retail sentiment and whale behavior.

BitcoinOG Ethereum Position | Source: Lookonchain

When a trader with a proven track record positions this heavily on the long side, it often reflects a strategic conviction that market conditions could soon shift in favor of higher prices.

However, this positioning unfolds just as the market approaches a pivotal macro event: the FOMC meeting. The Federal Reserve’s decision on interest rates can dramatically influence liquidity, risk appetite, and short-term volatility across all risk assets, including Ethereum.

A rate cut could inject optimism into the market by weakening the US dollar and improving overall liquidity conditions. Conversely, a hawkish tone or a smaller-than-expected policy adjustment could trigger a sell-the-news reaction, especially with ETH nearing resistance.

For Ethereum, whale accumulation combined with macro uncertainty creates a high-stakes environment. If liquidity expands post-FOMC, ETH could gain momentum. If not, even strong whale positions may face short-term pressure.

ETH Testing Breakout Strength Ahead of Key Resistance

Ethereum’s 4-hour chart shows a decisive shift in momentum, with ETH pushing firmly above the $3,300 level after a clean breakout from its multi-week downtrend. This move marks one of the strongest bullish impulses since early November, supported by rising volume and a clear reclaim of the 50 EMA and 100 EMA.

The 200 EMA (red), which previously acted as dynamic resistance throughout the decline, has now been tested and is beginning to flatten—often an early indication that bearish momentum is losing dominance.

ETH setting a fresh high | Source: ETHUSDT chart on TradingView

However, ETH is now hovering directly below a critical resistance zone around $3,380–$3,420, a level where sellers previously stepped in aggressively. The current consolidation just beneath this zone reveals an undecided market: bulls attempt to establish acceptance above $3,300, while bears defend the next resistance layer.

If buyers manage to flip $3,320 into solid support, the path toward $3,500 becomes more achievable, especially if broader market sentiment improves. Conversely, a rejection from the $3,400 area could trigger a short-term pullback toward $3,200–$3,250, where moving averages are now stacked as layered support.

Featured image from ChatGPT, chart from TradingView.com

Bitcoin OG Doubles Down On Ethereum With A Massive $209.8M Long – Find Out His Liquidation Price

Ethereum is holding above the $3,000 level for the fourth consecutive day as the market enters a decisive week dominated by the upcoming FOMC meeting. Traders are cautiously positioning ahead of the Federal Reserve’s announcement, aware that liquidity signals and rate expectations could determine whether this recovery continues—or breaks down.

Despite the recent stabilization, fear remains firmly in control. Many analysts warn that if ETH loses the $3K floor, the market could face a deeper retracement, especially with volatility expected to spike around the macro event.

Amid this uncertainty, on-chain data from Lookonchain has revealed a striking development: BitcoinOG, the same whale who famously shorted the market during the violent October 10 crash, has now dramatically increased his bullish exposure to Ethereum. According to the data, he has ramped up his long position to 67,103.68 ETH, valued at approximately $209.8 million.

Whale Positioning Adds a New Layer of Volatility

According to Lookonchain, the BitcoinOG whale is now sitting on more than $4 million in unrealized profit from his massive Ethereum long. His position of 67,103.68 ETH, currently valued at over $209 million, comes with a liquidation price of $2,069.49, a level far below current market conditions but still within the realm of possibility if macro pressure intensifies.

BitcoinOG Whale Ethereum Long Position | Source: Lookonchain

This liquidation threshold is especially important because it reveals the whale’s risk appetite and how aggressively he’s leveraging this bet. A liquidation level near $2,070 implies confidence that Ethereum won’t revisit its deeper range lows, even as the market remains fragile ahead of the FOMC meeting. It also shows he has a significant margin buffer behind the trade, suggesting strategic positioning rather than impulsive speculation.

However, large leveraged positions can act as double-edged swords for the broader market. If price begins trending toward his liquidation zone, cascading liquidations across other longs could accelerate downside momentum. Conversely, whales with deep pockets often defend key levels to protect their positions.

ETH Higher-Timeframe Trend Remains Fragile

Ethereum’s weekly chart shows the market fighting to stabilize above the $3,000–$3,150 zone, a level that now acts as the primary support band after weeks of heavy selling. The recent bounce from the mid-$2,700s has created a short-term relief structure, but ETH still trades well below its 50-week moving average, which is beginning to curl downward—a signal that the broader trend is losing momentum.

ETH consolidate around key level | Source: ETHUSDT chart on TradingView

The chart highlights a clear pattern: each rebound over the past six months has produced lower highs, reflecting persistent seller dominance whenever ETH approaches the $3,500–$3,800 region. This repeated rejection zone marks a key resistance cluster that bulls must reclaim to shift the medium-term outlook back toward bullish continuation.

Volume also remains relatively muted compared to earlier stages of the cycle, suggesting that current buying interest is hesitant. Without a surge in spot demand, rallies may continue to fade quickly.

On the positive side, ETH has reclaimed the 200-week moving average, an important long-term support that historically acts as a pivot between macro bull and bear phases. As long as this level holds, Ethereum retains structural strength.

ETH is in a neutral-to-bearish consolidation, and a decisive weekly close above $3,300 is needed to confirm regained momentum.

Featured image from ChatGPT, chart from TradingView.com

Why The Litecoin Price Could Stage A 33% Rally To $110

A crypto analyst has forecasted that the Litecoin price is gearing up for an explosive rally to $110. Unlike Bitcoin and Ethereum, which have seen considerable declines over the past few months, Litecoin appears to be stabilizing, gaining about 7.8% this past week, according to CoinMarketCap. Although LTC has seen its fair share of declines this year, analysts still hold hope that the cryptocurrency could cross the $100 threshold and reclaim former highs. 

Litecoin Price Targets A $110 Breakout

Litecoin may be preparing for a strong upward move, according to a new analysis from TradingView market expert MadWhale. The analyst has indicated that the cryptocurrency has the technical structure needed to break out of its long-term descending channel and potentially climb toward $110. With its current price sitting around $83, a surge to this level would represent a significant 33% rally. 

MadWhale has based his bullish LTC forecast on weekly candlesticks and how the cryptocurrency has consistently responded to past support and resistance levels. He explained that the altcoin had been trapped in a descending channel that has controlled its price for several weeks now. According to the TradingView analyst, Litecoin is now approaching the upper resistance region of the descending channel–a point where traders usually watch for either a clean breakout or a sharp rejection.

Litecoin

From the analyst’s price chart, Litecoin’s support zones have repeatedly held firm, showing that buyers consistently defended the area. Due to this steady support, he expects Litecoin’s bounce near the descending channel’s upper resistance to build momentum. If the support holds, MadWhale suggests the cryptocurrency could skyrocket to $110, completing its breakout from the descending channel. 

A breakout could signal a significant shift, potentially transforming Litecoin’s recent downtrend into a new bullish phase. MadWhale’s chart also highlights the cryptocurrency’s volatility, showing that in early October, LTC had rallied around 33.84%, climbing above $120. However, just days later, it crashed more than 17%, coinciding with the October 10 liquidation event that shook the market. 

Update On LTC’s Price Action

Litecoin is approximately 79% below its all-time high of over $410, recorded during the 2021 bull run. The cryptocurrency has dropped 17.68% over the past week and is down 33% for the year, mirroring the broader decline seen across altcoins. Despite its performance, LTC’s Fear and Greed Index remains in the neutral zone, suggesting that crypto investors are cautiously optimistic.

According to market analyst CW on X, the next sell wall for Litecoin is at $98, about 15% above its current price. Once the cryptocurrency reaches this level, CW expects a significant number of sellers to offload their coins. His chart also highlights the next key resistance levels for LTC, suggesting a potential surge to $98 first and then to the $106-$110 range.

Litecoin

Smart Whales Align: Top Performers Go All-In On Ethereum Long Positions With Over $425M in Exposure

Ethereum has reclaimed the $3,150 level after a volatile stretch, offering a rare sign of strength in an otherwise uncertain market. The broader crypto landscape remains sharply divided: some analysts argue that ETH and the rest of the market still face downward continuation, potentially setting new local lows, while others believe this correction is simply a reset before a much larger bull cycle—possibly extending into 2026.

Yet one signal stands out clearly amid the noise: smart whales are unanimously going long on ETH. On-chain data shows that several of the most profitable and consistent whale traders—each with tens of millions in realized gains—have opened substantial long positions, collectively exceeding hundreds of millions of dollars. Their coordinated behavior indicates confidence that Ethereum’s recent lows represent opportunity rather than danger.

This alignment among top-performing whales introduces a compelling counterpoint to bearish narratives. While retail sentiment remains fragile, the most sophisticated market participants appear to be positioning for a larger move ahead. As Ethereum stabilizes above $3,150, the question now becomes whether whale conviction will prove to be early—or correct.

Top Performers Load Up on Ethereum

According to Hyperdash data shared by Lookonchain, some of the most successful and influential whales in the market are aggressively accumulating Ethereum—sending a strong signal that high-conviction players expect upside ahead.

One of the most notable is BitcoinOG, the trader widely recognized for shorting the market during the violent 10/10 crash, a move that earned him significant credibility. With a total realized PNL of $105 million, BitcoinOG is now positioned firmly on the bullish side, holding 54,277 ETH worth approximately $169.48 million.

BitcoinOG Ethereum Position | Source: Hyperdash

Another major player is the well-known Anti-CZ whale, named for his historical pattern of taking the opposite side of positions favored by Binance founder Changpeng Zhao. With an impressive $58.8 million in total PNL, this whale is currently long 62,156 ETH—a massive $194 million position. His trades have often been early indicators of broad market direction, adding weight to this shift toward bullish exposure.

Finally, pension-usdt.eth, a consistently profitable whale address with $16.3 million in realized gains, is long 20,000 ETH valued at $62.5 million.

Taken together, these positions reflect a unified stance among top-performing whales: despite market uncertainty, they are positioning for Ethereum strength.

Weekly Structure Shows Early Signs of Stabilization

Ethereum’s weekly chart reveals a market attempting to regain its footing after a sharp multi-week decline from the $4,500 region. The recent reclaim of $3,150 is a meaningful development, as this level aligns closely with prior weekly support from mid-2024 and sits just above the 50-week moving average—an area that often acts as a trend-defining zone. ETH briefly dipped below this region during the November selloff, but buyers stepped in aggressively, producing a strong weekly wick that signals demand at lower levels.

ETH consolidates around critical level Source: ETHUSDT chart on TradingView

Despite this recovery attempt, ETH remains below key resistance levels. The 20-week and 100-week moving averages are positioned above the current price and converging, creating a zone of potential rejection unless momentum strengthens. For now, ETH is trading in a transitional structure: no longer trending downward aggressively, but not yet showing a confirmed bullish reversal on high timeframes.

Volume patterns also support this interpretation. Selling volume has diminished compared to the capitulation phase, while recent green candles show moderate but steady buying interest—suggesting accumulation rather than full risk-on behavior.

If ETH can establish consecutive weekly closes above $3,200–$3,300, the chart opens the door for a retest of the $3,600–$3,800 range. Failure to hold $3,150, however, risks another move toward $2,800 support.

Featured image from ChatGPT, chart from TradingView.com

Ethereum Whale Redistribution Continues: Moves 5,000 ETH As Price Reclaims $3K Level

Ethereum is showing notable relative strength as it reclaims the $3,150 level and attempts to push higher, signaling early signs of recovery after weeks dominated by heavy selling pressure, fear, and uncertainty. The broader market rebound has helped restore confidence, but ETH’s ability to outperform key altcoins highlights growing demand and improved sentiment around the asset.

Adding to the renewed optimism, fresh on-chain data from Lookonchain reveals a significant move from one of the market’s most recognized whales. During the rebound, whale 0xdECF deposited another 5,000 ETH—worth approximately $15.52 million—into Binance.

This wallet has become well-known for sending large batches of ETH to exchanges throughout the recent downturn, often coinciding with moments of heightened volatility and capitulation.

Its latest deposit suggests that the whale remains highly active and responsive to market conditions. While such movements can sometimes introduce uncertainty, they also highlight increasing liquidity and engagement from major holders. With price reclaiming key levels and whales repositioning, Ethereum enters a critical phase where sustained strength could confirm a broader shift in market structure.

Ethereum Whale Distribution Highlights Market Caution

According to Lookonchain, whale 0xdECF has sold 25,603 ETH—valued at approximately $85.44 million—across Binance and Galaxy Digital since October 28. Despite this substantial distribution, the wallet still holds 5,000 ETH (around $15.52 million), suggesting that the whale has not fully exited its position but has significantly reduced exposure during the recent market decline.

Ethereum Whale Transfers | Source: Lookonchain

This pattern of behavior provides important insight into sentiment among large holders: while they are not abandoning Ethereum entirely, they are actively managing risk and responding to volatility more aggressively than usual.

Such persistent selling pressure from a large wallet often acts as a drag on price during periods of weakness, especially when market liquidity is thin. However, the fact that the whale continues to retain a meaningful position indicates an expectation of potential recovery—or at least a desire to remain strategically exposed to future upside.

Ethereum now finds itself in a critical phase. The asset has reclaimed key levels, but its mid-term structure remains highly sensitive to macro conditions and whale behavior. If selling from major holders slows and accumulation begins to outpace distribution, the recent rebound could solidify into a sustained trend. Otherwise, renewed sell flows could place Ethereum at risk of revisiting lower support zones.

ETH Reclaims Short-Term Momentum but Faces Heavy Resistance

Ethereum’s daily chart shows a clear improvement in momentum after reclaiming the $3,150–$3,200 region, but the broader structure remains fragile. The bounce from the $2,750–$2,850 support zone marked a decisive shift in buyer behavior, with strong lower wicks indicating aggressive demand. This rebound has pushed ETH back above key short-term levels, yet the asset still faces a challenging path forward.

ETH testing critical supply level | Source: ETHUSDT chart on TradingView

Price is now approaching the 50-day SMA, currently sloping downward just above $3,250, which now acts as immediate resistance. This moving average has capped every rally since late October and remains the first major barrier for bulls to reclaim. Beyond it, the 100-day SMA around $3,450 and the 200-day SMA near $3,600 form a tight cluster of overhead resistance that defines the medium-term downtrend.

Volume on the recent bounce is stronger than previous attempts, signaling that buyers are showing more conviction compared to the mid-November attempts to recover. However, the overall trend still leans bearish until ETH can break above the 50-day SMA and begin closing daily candles over $3,300.

Ethereum sits in a critical inflection zone: holding above $3,100 strengthens the case for continued recovery, while rejection from the $3,250–$3,300 band could trigger another retest of the $2,800 region. The next few sessions will determine whether this rebound evolves into a deeper trend reversal.

Featured image from ChatGPT, chart from TradingView.com

VanEck: Mid-Cycle Traders Driving Bitcoin Selloff While Long-Term Whales Keep Holding

Bitcoin Magazine

VanEck: Mid-Cycle Traders Driving Bitcoin Selloff While Long-Term Whales Keep Holding

Bitcoin’s recent decline is being driven by mid-cycle holders, not long-term whales, according to new on-chain research from VanEck analysts.

The firm noted in a recent report that long-term holders continue to accumulate while short-term futures markets show deeply oversold conditions following tariff-driven liquidations.

Despite widespread speculation that early Bitcoin whales triggered the selloff, on-chain data shows that coins held for five years or more continue to rise. 

These older cohorts increased their holdings by roughly 278,000 BTC over the past two years, signaling limited turnover among wallets with the longest histories.

In contrast, supply among wallets that last moved their coins three to five years ago has dropped for every measurement window. Over the past two years, this tranche fell by 32% as coins were transferred to new addresses. 

The VanEck analysts view these sellers as cycle-driven traders rather than long-term investors.

“Weak hands” set early pressure: VanEck

The past month delivered a −13% drawdown, driven in part by outflows from bitcoin ETPs. Since October 10, bitcoin ETP balances have fallen by 49,300 BTC — about 2% of total AUM — as recent buyers exited positions during rate-cut uncertainty and shifting AI-market sentiment.

Sentiment indicators also show rising fear among retail participants. Bitcoin’s fear-and-greed index fell to its lowest reading since March, aligning with the onset of tariff-related volatility.

Whale holdings are shifting in a more nuanced pattern than outright distribution, VanEck noted. Large holders with 10,000–100,000 BTC have reduced supply over the longer term — down 6% over six months and 11% over 12 months — while mid-sized holders in the 100–1,000 BTC range absorbed this supply and increased their balances by 9% and 23% over the same periods.

More recently, some large cohorts have turned into net buyers. The 10,000–100,000 BTC group increased holdings over the past 30, 60, and 90 days, coinciding with a sharp drop in futures market open interest during tariff-driven liquidations.

While the analysts stop short of making directional predictions, the data shows that the longest-term bitcoin holders remain largely in place, mid-cycle traders are driving selling, and futures markets have undergone a significant reset. 

After a month of pronounced liquidations, the analysts characterize current conditions as aligned with prior periods of tactical re-entry for some investors.

Mid-cycle Bitcoin holders show the most selling

When analyzing coins by age rather than wallet size, selling pressure is most concentrated among holders who last moved their bitcoin within the past six months to five years. These groups saw significant outflows over the past month.

Holders in the 6-month to 2-year band have rotated into the market as sellers, while the 3- to 5-year cohort continues to shrink across all periods reviewed. Analysts connect this behavior to traders who entered during prior down cycles and are now exiting on price weakness.

By comparison, coins that last moved more than five years ago show minimal churn, reinforcing the idea that long-term holders are not driving the selloff.

Bitcoin’s futures markets reset as funding and open interest collapse

The futures market saw a rapid unwinding of speculative positioning. Open interest in bitcoin perpetual futures dropped roughly 19% in 12 hours during the selloff and is down 20% in BTC terms since October. 

Funding rates — a key measure of futures optimism — also fell to their lowest levels since late 2023.

VanEck analysts noted that large basis-trading operations, including structured products and funds using long-spot/short-perp strategies, may be suppressing funding signals. 

At the time of writing, Bitcoin is near $88,500 — its lowest level in seven months — as crypto markets extend their retreat and major crypto stocks sell off sharply. Bitcoin is down 4% in 24 hours, trading near the bottom of its weekly range with a $71 billion daily volume and a $1.78 trillion market cap. 

Bitcoin

This post VanEck: Mid-Cycle Traders Driving Bitcoin Selloff While Long-Term Whales Keep Holding first appeared on Bitcoin Magazine and is written by Micah Zimmerman.

Bitcoin Price Dances with $100,000 as Crypto Industry Waits to See What’s Next

Bitcoin Magazine

Bitcoin Price Dances with $100,000 as Crypto Industry Waits to See What’s Next

Bitcoin price slipped below $100,000 this week for the first time since June, down more than 20% from its all-time highs above $120,000 last month. 

The decline comes after weeks of steady spot-market selling, profit-taking by long-term holders, and a cautious macro environment. ETF outflows, a stronger dollar, and broader risk-off sentiment have added to pressure. 

Bitcoin traded back above $102,000 today, showing some resilience, but volatility remains elevated, according to Bitcoin Magazine Pro.

Analysts point to ongoing accumulation by new buyers, though long-time holders are reactivating coins at a notable pace. 

Vetle Lunde of K33 Research noted that over 319,000 Bitcoin held for six to twelve months have moved in recent weeks, much of it real selling. 

Markus Thielen of 10x Research said mega whales — entities holding between 1,000 and 10,000 BTC — have been offloading significant amounts, while mid-size holders have largely stopped buying. 

He estimates that roughly 400,000 Bitcoin, about $45 billion, has exited the market in the last month.

Rebel money to institutional asset

Bitcoin’s rise over the past decade and a half has been punctuated and marked by identity shifts. In the early years, enthusiasts felt part of a secret movement to build better money for a better world. 

Critics were loud but often misinformed, and debates over privacy, environmental impact, and financial sovereignty energized the community. The vibes were high, and the project felt meaningful beyond mere price.

Now, according to Troy Cross, With the entry of Wall Street and ETFs, Bitcoin’s brand evolved. It became a hedge, a retirement asset, a component in treasury strategies. Its revolutionary appeal — as a tool to bank the unbanked and resist centralized control — is still technically intact, but the narrative has shifted. 

The focus moved from being a rebellion against fiat to being a corporate- and finance-friendly instrument. 

Michael Saylor and other institutional adopters have accelerated this trend. Bitcoin now shares the limelight with gold and equities, often framed in risk-adjusted portfolios rather than as a movement for financial empowerment.

Despite this, the core of Bitcoin remains unchanged. It is still global, permissionless, and censorship-resistant. Anyone can participate. Transactions remain verifiable and final. 

Bitcoin price action over the past month

Price action highlights this duality, as seen over the past month. On October 10, U.S. President Trump’s threat to impose a 100% tariff on Chinese imports triggered widespread panic, sparking the largest single-day liquidation in cryptocurrency history — over $19 billion in leveraged positions were wiped out within 24 hours.

Some traders anticipate a retest of $92,000, tied to CME futures gaps, while others see support around $98,000–$100,000. Other analysts expect a push to $170,000. 

History suggests that these pauses are not the end of Bitcoin’s story. Each cycle has included phases of distribution, consolidation, and renewed growth. What is changing is not the network itself but the surrounding culture — the shift from a secret movement to an accepted, institutional asset.

This post Bitcoin Price Dances with $100,000 as Crypto Industry Waits to See What’s Next first appeared on Bitcoin Magazine and is written by Micah Zimmerman.

❌