Reading view

There are new articles available, click to refresh the page.

US Bitcoin Session Leads December Returns After Weak November

Data shows Bitcoin has witnessed a notable amount of gains during the US trading session in December so far, a shift compared to the November trend.

Bitcoin Has Performed The Best During US Trading Session This Month

As explained by CryptoQuant community analyst Maartunn in a new post on X, the American trading session has flipped for Bitcoin in December. Below is the chart shared by Maartunn, which compares the returns that BTC has achieved across the different trading sessions over the past month.

Bitcoin Return By Session

The trading sessions here have been divided based on when investors of a major market are typically active. Bitcoin and other blockchain-based assets run 24/7, so there naturally isn’t ever a time in any timezone where trading is inactive. However, investors do still tend to trade more actively during their daytime, which is what these sessions are based on.

From the chart, it’s visible that cumulative Bitcoin returns were negative for the American trading session during the last couple of weeks of November. Europe and Asia-Pacific didn’t perform much better, but they at least saw close to neutral returns.

Toward the end of November, though, a shift began to take shape, with returns during US hours going up. And in this month of December so far, the trading session has pulled away from the rest, with cumulative returns sitting at a positive 8%.

In contrast, Europe and Asia-Pacific have the metric at a level of around -4% or lower. Thus, if the cumulative returns during these sessions are anything to go by, it would appear that American investors have been participating in Bitcoin accumulation this month, while the others have been distributing or simply, not buying.

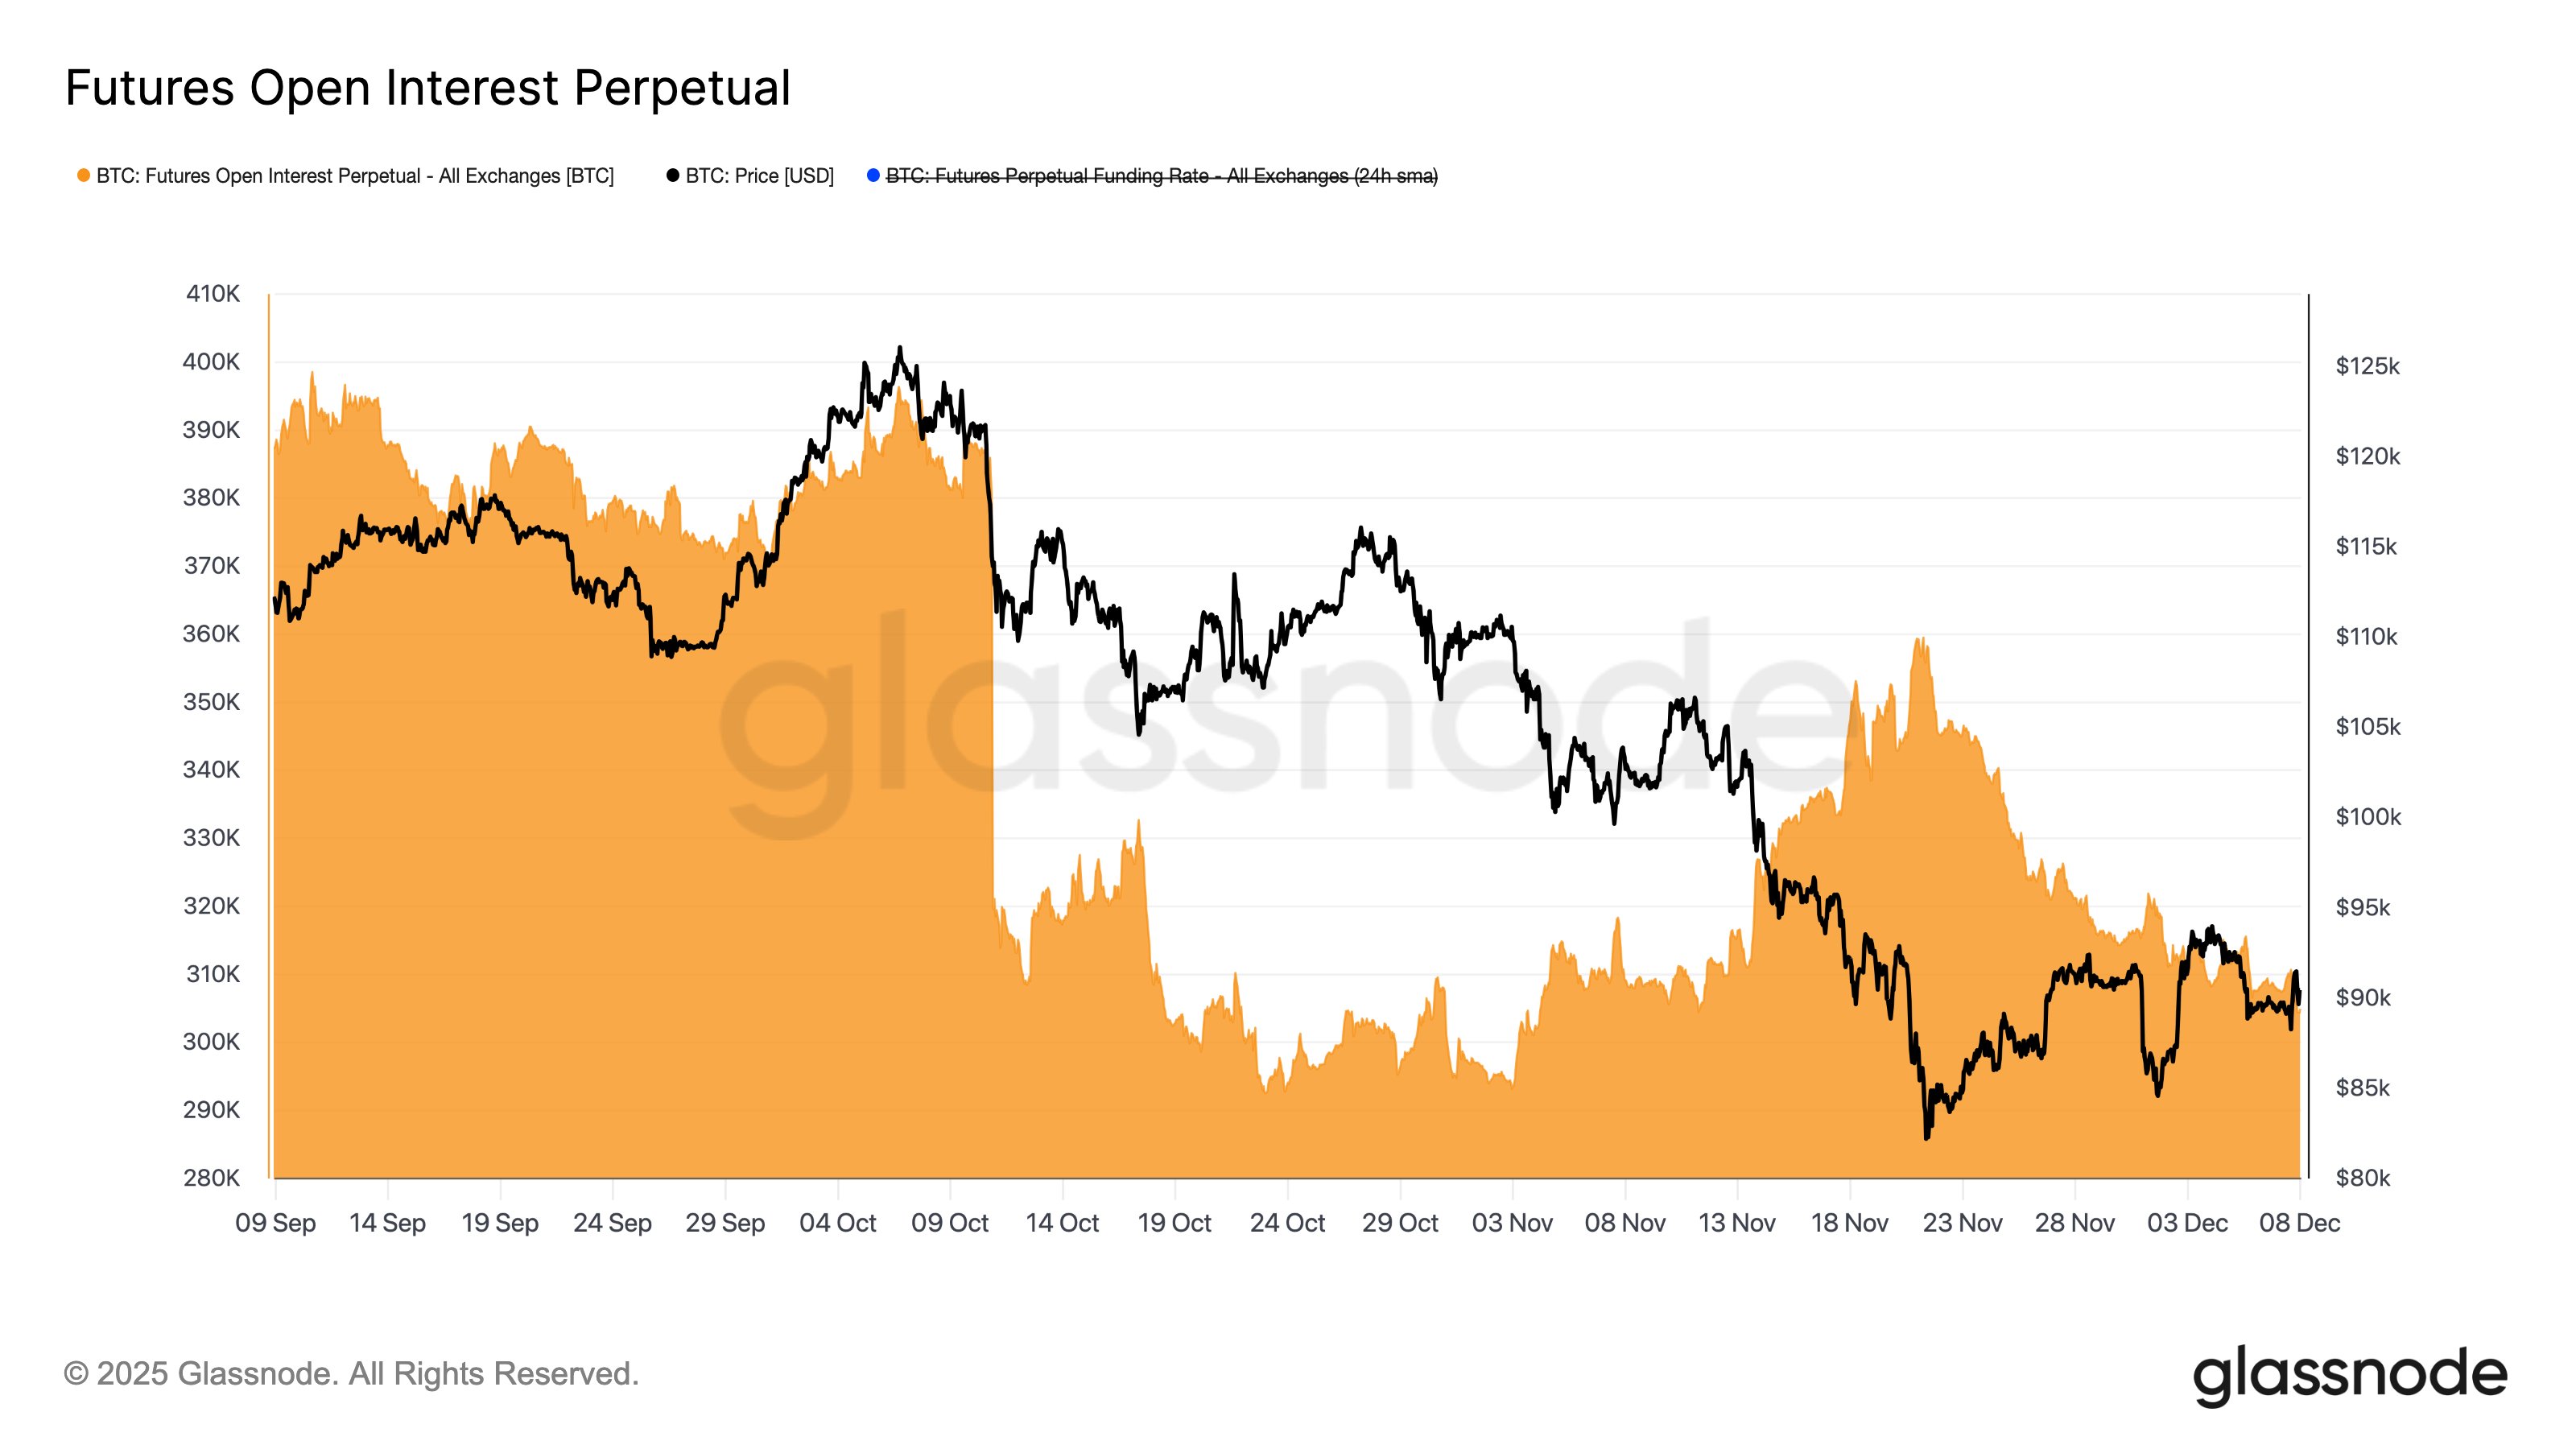
In some other news, the Bitcoin selloff last month caused a key on-chain indicator to go through its largest negative change in years, as quant Frank has pointed out in an X post.

Bitcoin Short-Term Holder Realized Price

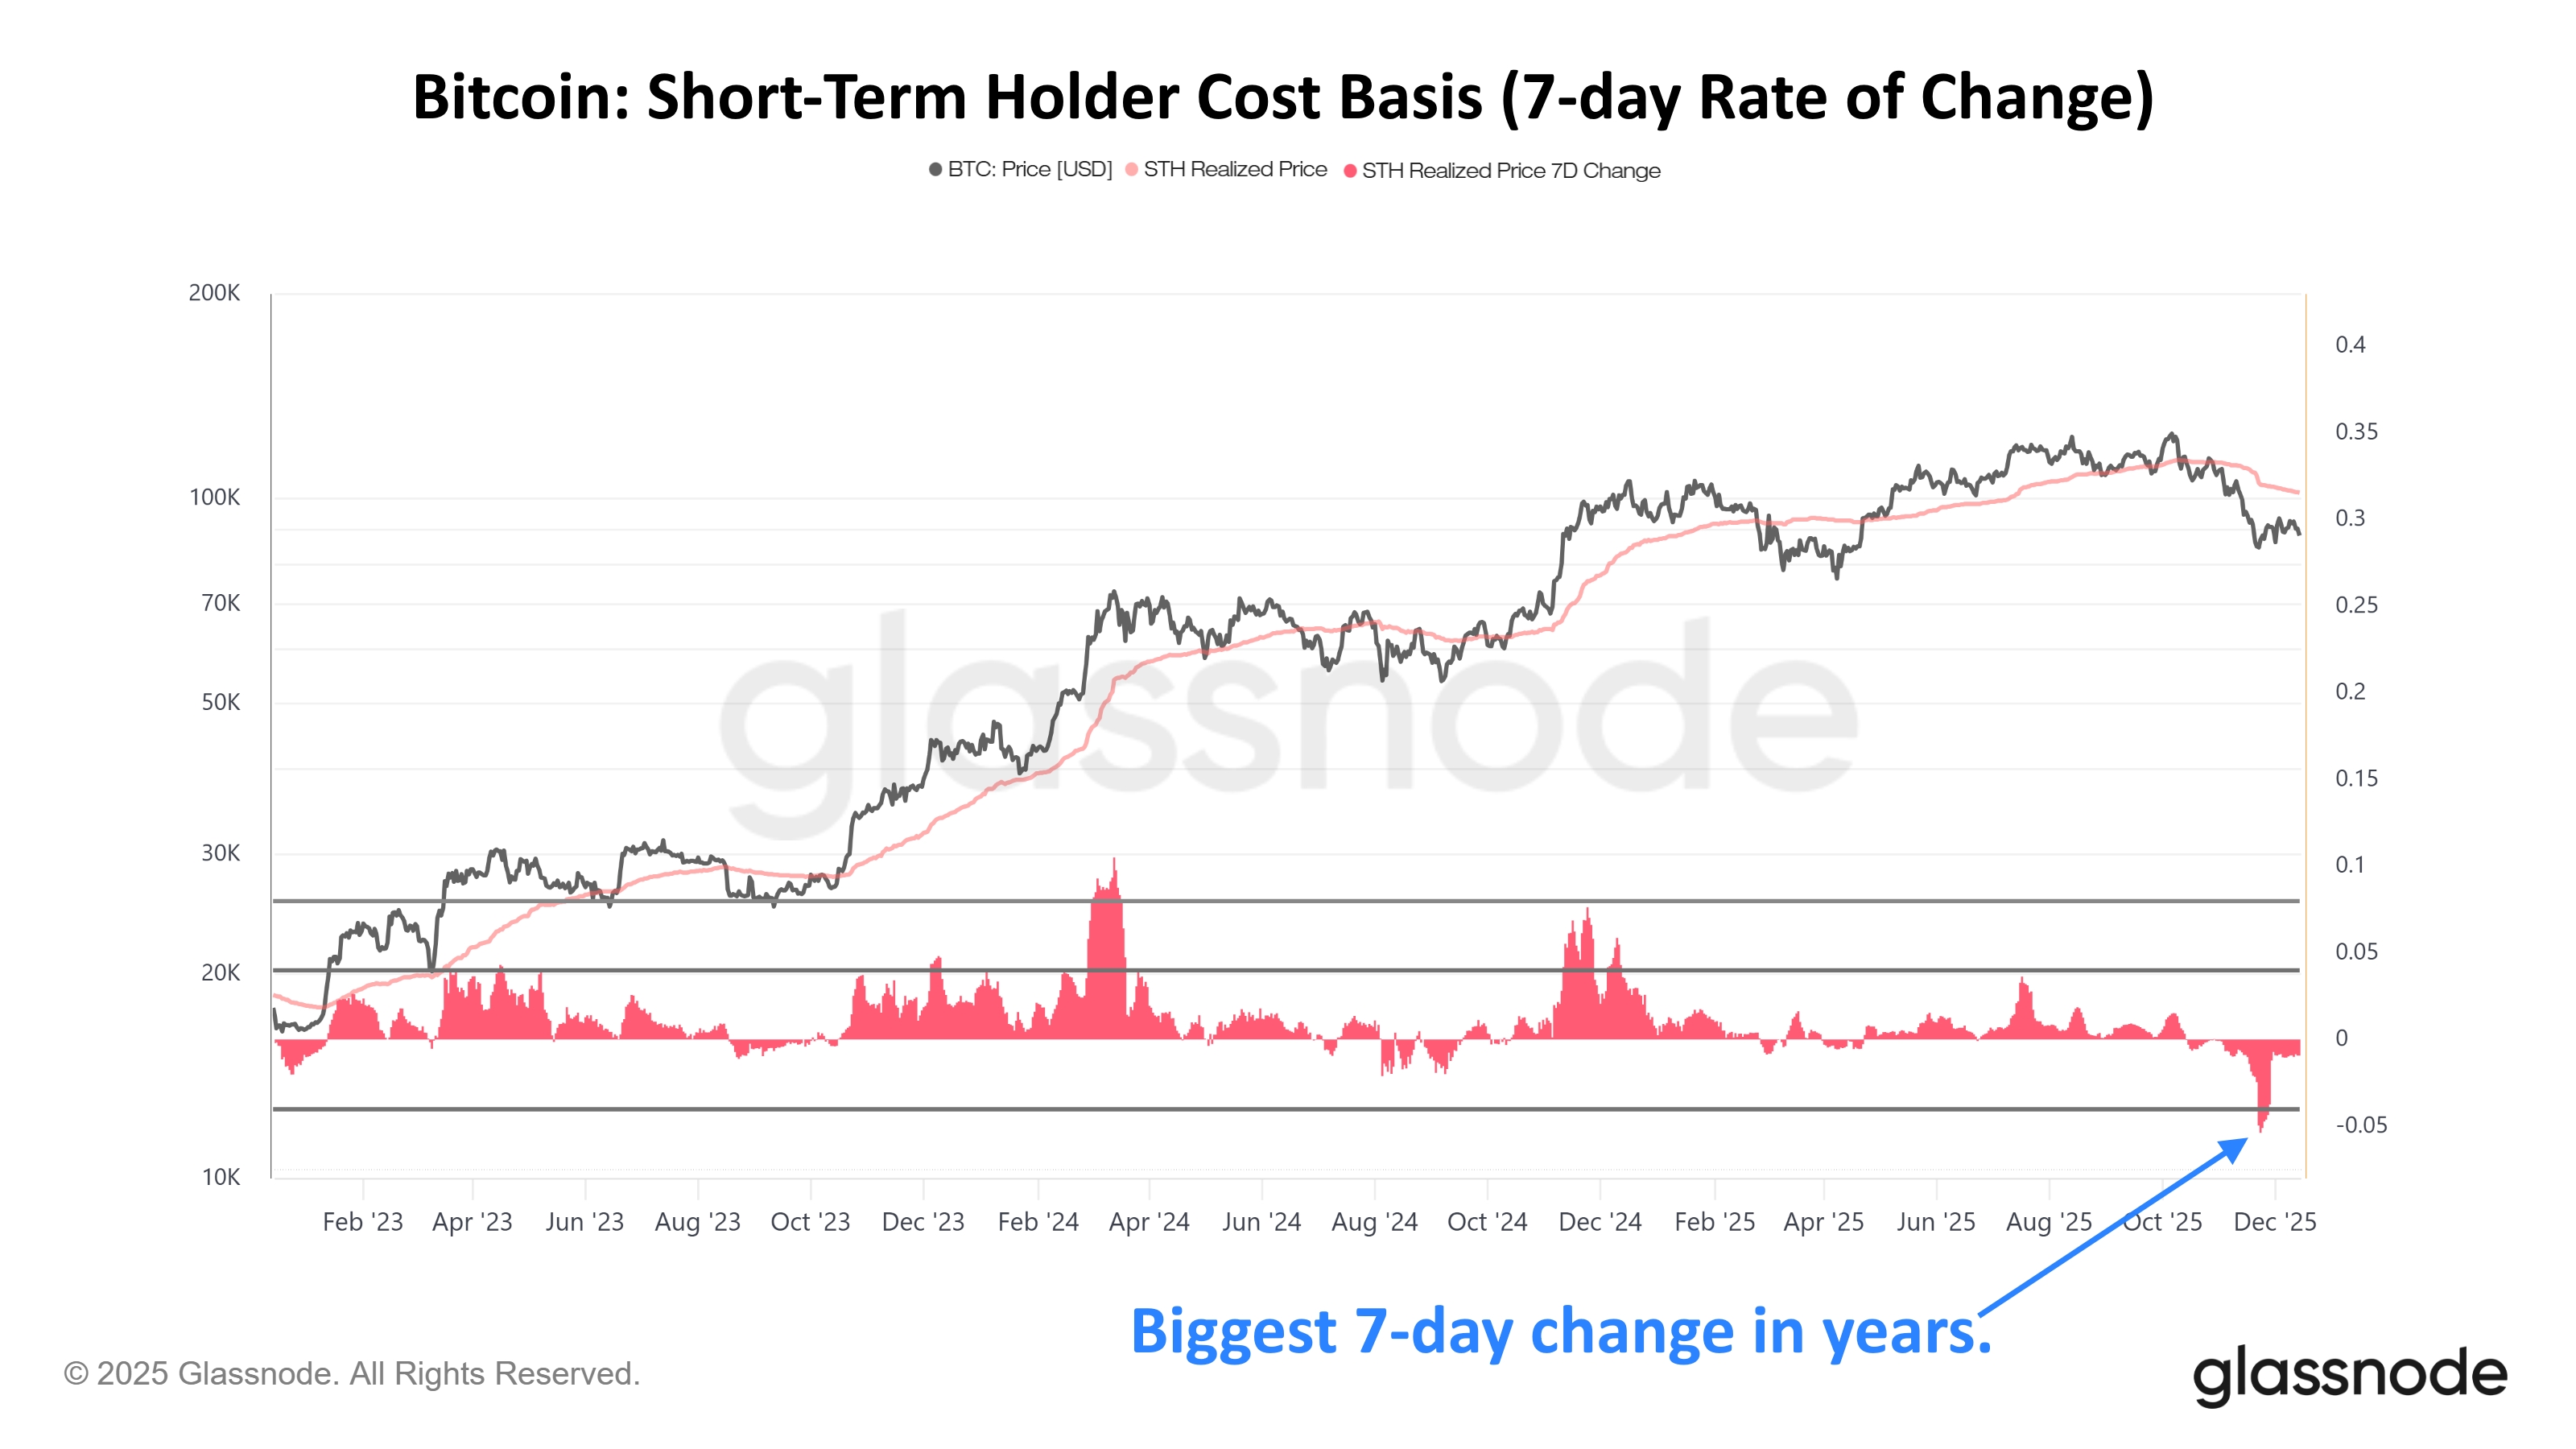
The metric displayed in the chart is the Realized Price of the Bitcoin short-term holders. This indicator measures the average cost basis of investors on the BTC network. The version listed in the graph specifically tracks the cost basis of short-term holders (STHs), entities who entered the market over the last 155 days.

As is visible in the chart, the Bitcoin STH Realized Price saw a notable decline alongside the price crash in the cryptocurrency during November. This suggests investors who bought at higher levels panic capitulated, repricing their coins to the lower post-plunge levels.

This capitulation was so strong that the STH Realized Price saw its largest red 7-day change since the FTX crash back in November 2022.

BTC Price

Bitcoin has witnessed bearish price action during the past day as its price has come down to $85,800 following a drop of about 3.5%.

Bitcoin Price Chart

Strategy Buys Nearly $1 Billion In Bitcoin For Second Straight Week

Bitcoin treasury company Strategy has announced its latest purchase, taking its total investment in BTC beyond the $50 billion milestone.

Strategy Has Added 10,645 BTC With The Latest Acquisition

As announced by Strategy co-founder and chairman Michael Saylor in a new X post, the company has completed another big Bitcoin acquisition. With this new purchase, it has added 10,645 BTC to its reserves, spending $92,098 per token or $980.3 million in total.

The buy has come just a week after Strategy made another acquisition of a similar level. More specifically, the purchase last Monday saw 10,624 BTC entering the treasury company at a cost basis of $963 million. This buy was the firm’s largest since July, and the latest one is even bigger.

On the Monday coinciding with the start of December, Strategy only added a small amount of Bitcoin to its holdings (130 BTC) and a newly announced $1.44 billion USD reserve instead took the spotlight. Saylor noted that the reserve will better equip the company to navigate short-term market volatility.

The mega BTC buys in the two weeks that have followed since then suggest that despite the existence of the USD reserve, the cryptocurrency is still the priority for the treasury firm.

According to the filing with the US Securities and Exchange Commission (SEC), the new 10,645 BTC acquisition occurred in the period between December 8th and 14th, and was funded using sales of Strategy’s STRF, STRK, STRD, and MSTR at-the-market stock offerings.

The treasury company now holds a total of 671,268 BTC, with an acquisition cost of $50.33 billion. At the current exchange rate, the firm’s holdings are worth $57.56 billion, putting it in a net profit of over 14%.

The new purchase means that 2025 has overtaken 2024 in terms of the USD amount invested by Strategy into Bitcoin, as the chart shared by CryptoQuant community analyst Maartunn showcases.

Bitcoin Strategy

From the graph, it’s visible that the difference between the two years isn’t much right now, but 2025 still has a couple of weeks to go. It only remains to be seen whether Strategy will buy more in the coming days and if so, whether the purchases will be similar in size to the latest two.

Despite the scale of the acquisition, Bitcoin has plummeted following Strategy’s new announcement, taking both this week’s and last week’s massive purchases into the red.

The latest decline in the cryptocurrency has also come despite the fact that the spot exchange-traded funds (ETFs) witnessed a net amount of inflows during the past week, according to data from SoSoValue.

Bitcoin Spot ETFs

BTC Price

At the time of writing, Bitcoin is floating around $86,000, down around 4.5% over the last seven days.

Bitcoin Price Chart

Cardano SuperTrend Turns Bearish—Last Signal Preceded 80% ADA Drop

A cryptocurrency analyst has pointed out how Cardano has formed a technical analysis (TA) signal on its weekly chart that last led into a major price drawdown.

Cardano SuperTrend Has Flipped Bearish

In a new post on X, analyst Ali Martinez has talked about a signal that has appeared in the SuperTrend of Cardano. The “SuperTrend” refers to a TA indicator that’s generally used for determining whether a given asset is following a bearish or bullish trend. It’s built using the Average True Range (ATR), another TA indicator that measures the degree of volatility being experienced by the price.

The SuperTrend is represented by a single trendline that acts as both support and resistance, depending on which side the asset is trading. When the price is above this line, the indicator signals that the asset is in a bullish trend. On the other hand, being under the line implies the dominance of a bearish trajectory.

Now, here is the chart shared by Martinez that shows the trend in the SuperTrend of Cardano over the last few years:

Cardano SuperTrend

As displayed in the above graph, the weekly Cardano price broke above the SuperTrend line during 2023 and stayed over it throughout 2024 and much of 2025. Recently, however, the price has finally seen a reversal of trend, with the indicator now giving a bearish signal instead.

In the chart, Martinez has highlighted what happened the last time that this pattern developed in ADA’s 1-week price. It would appear that the flip to a bearish trend led to a decline of more than 80% for the cryptocurrency in 2022. It now remains to be seen whether the SuperTrend giving a sell signal is foreshadowing something similar this time, or if Cardano will see the renewal of bullish momentum despite the pattern.

Cardano isn’t the only coin in the sector that has seen a flip in the SuperTrend recently. As the analyst has highlighted in another X post, the number one cryptocurrency, Bitcoin, has also seen a change in its SuperTrend.

Bitcoin SuperTrend

From the above chart, it’s apparent that the weekly price of Bitcoin is now trading under the SuperTrend line, a sign that a bearish trend is taking over. Like for Cardano, the last time this flip happened was in the last bear market. Back then, BTC dropped by over 60%.

ADA Price

Cardano saw brief recovery above $0.48 last week, but the cryptocurrency has since witnessed a retrace as its price is now back at $0.40.

Cardano Price Chart

Tether’s Bold $1.1 Billion Juventus Play Shut Down As Exor Holds Firm

Tether has seen its Juventus buyout attempt rejected as majority stakeholder Exor has told the stablecoin giant its share is not for sale.

Tether Fails To Acquire Premier Italian Football Club Juventus

On Friday, Tether announced that it had submitted a proposal to acquire Juventus, one of the biggest football brands in the world. The stablecoin firm had previously acquired a 10% minority stake in the club, and with this new plan, it had intended to execute a full buyout.

The first stage had included a proposal to Exor, the holding company of the Agnelli family and majority stakeholder of Juventus. According to Reuters, Tether had offered the firm 2.66 euros per share, a notable premium above the then closing price of 2.19 euros.

In a press release, Exor has responded to Tether, saying that its board has unanimously rejected the bid for its 65.4% controlling stake in Juventus. “Exor reaffirms its previous, consistent statements that it has no intention of selling any of its shares in Juventus to a third party, including but not restricted to El Salvador-based Tether,” noted the company.

Founded in 1897, Juventus has established itself as one of the biggest football clubs globally, with a particularly memorable period of success coming during the 2010s, in which it won nine consecutive titles in the Serie A, the first division of Italian football.

With Exor turning down the deal, the USDT issuer will have to reconsider its approach to the club popularly dubbed as The Old Lady. So far, Tether hasn’t issued any statements in answer.

In the original announcement, Tether had announced that if the firm is able to acquire Exor’s stake, it will move to acquire the remaining shares of the club through a public tender offer at the same share price. This would put the total valuation of Juventus at about $1.17 billion.

Tether had also noted that in the event that the transaction is completed, it will also be prepared to invest 1 billion euros in the football club. “Tether is in a position of strong financial health and intends to support Juventus with stable capital and a long horizon,” said CEO Paolo Ardoino.

While The Old Lady enjoyed a strong period in the last decade, the 2020s haven’t been as kind. Since the 2019-20 season title win, Juventus hasn’t come close to becoming the Italian champion, with its best finish being third place during the 2023-24 season. Juventus also became part of a financial scandal in 2023, with Serie A punishing it with a 10-point deduction for false accounting. Thus, Tether’s interest has arrived when the club has been in a bit of a slump.

USDT, Tether’s stablecoin, has been experiencing growth recently, with its market cap hitting a new record of $186.23 billion, according to data from DefiLlama.

Tether USDT

Bitcoin Price

At the time of writing, Bitcoin is trading around $89,700, down 2.5% over the last week.

Bitcoin Price Chart

XRP Mildly Undervalued On MVRV: What About Bitcoin, Ethereum?

XRP is in a mild undervalued zone according to the 30-day MVRV Ratio. Here’s how other cryptocurrencies like Bitcoin and Ethereum compare.

XRP 30-Day MVRV Ratio Shows Negative Returns

In a new post on X, on-chain analytics firm Santiment has talked about how the 30-day Market Value to Realized Value (MVRV) Ratio is currently looking for the different top coins in the cryptocurrency sector like Bitcoin and XRP.

The “MVRV Ratio” is a popular indicator that keeps track of the ratio between an asset’s market cap and its Realized Cap. The latter capitalization model calculates the cryptocurrency’s total value by assuming the value of each individual token is equal to the spot price at which it was last transacted on the blockchain.

The Realized Cap can be thought of as an estimate of the capital that the investors as a whole used to purchase their tokens. In contrast, the market cap is the value that they are carrying in the present. As the MVRV Ratio takes the ratio between the two, it essentially contains information about the profit-loss balance of the investors.

In the context of the current topic, a very specific form of the MVRV Ratio is of interest: the 30-day version. This metric only tracks the profit-loss balance for the traders who got into the market during the past month.

Now, here is the chart shared by Santiment that shows the trend in the 30-day MVRV Ratio for six assets: Bitcoin, Ethereum, Cardano, XRP, and Chainlink.

XRP, Bitcoin, Ethereum MVRV Ratio

As is visible in the above graph, the 30-day MVRV Ratio hasn’t displayed a uniform behavior across the top cryptocurrencies, indicating that the situation of the 30-day buyers is different for the various assets.

Ethereum currently has the metric at a positive value of 7.2%. This means that market entrants from the past month are sitting on a gain of 7.2% on the network. Bitcoin also has a positive value, but at just a level of 2.4%, the 30-day traders are more-or-less breaking even.

Chainlink also has a very neutral trend with the 30-day MVRV Ratio at a value of -0.3%. Cardano 30-day traders are also in the red, but in its case, the losses are more notable at -4.4%.

Finally, new XRP investors are down 6.1%, implying that the network currently hosts the worst trader profitability. This fact, however, may not actually be negative for the cryptocurrency.

Generally, the higher investor gains get, the more likely they become to participate in a selloff with the aim of profit realization. This can make a top more probable for the asset when its MVRV Ratio is at a high level. Similarly, a deep negative value can be bullish instead, as it suggests profit-takers have probably become depleted.

In the chart, the analytics firm has defined overvalued and undervalued zones based on the 30-day MVRV Ratio. XRP is currently the only one in an undervalued zone, while Ethereum is inside a mild overbought region.

XRP Price

At the time of writing, XRP is floating around $2.04, up 1.5% over the last 24 hours.

XRP Price Chart

Crypto Unrealized Losses Hit $350 Billion, With $85 Billion From Bitcoin Alone

On-chain data shows the Unrealized Loss in the crypto market recently ballooned to $350 billion, with Bitcoin accounting for a significant part of it.

Unrealized Loss Has Spiked In The Crypto Sector After Bearish Price Action

In a new post on X, on-chain analytics firm Glassnode has shared the data related to the Unrealized Loss in the crypto sector. This indicator measures, as its name suggests, the total amount of loss that investors are holding on their tokens right now.

The metric works by going through the transaction history of each token on a given network to find what price it was last moved at. If this last selling price of a token was less than the current spot price of the asset, then that particular coin is assumed to be underwater.

The exact amount of the loss involved with the token is equal to the difference between the two prices. The Unrealized Loss sums up this value for all coins being held at a loss.

Like the Unrealized Loss, there also exists the Unrealized Profit, keeping track of the supply of the opposite type. That is, it accounts for the coins with a cost basis lower than the latest spot price.

Now, here is a chart that shows the trend in the Unrealized Loss for the combined crypto market and Bitcoin over the last few years:

Bitcoin Unrealized Loss

As displayed in the above graph, the Unrealized Loss across the crypto market has surged following the downturn that the sector has gone through since October.

At its peak, the indicator hit a value of $350 billion for the entire market, with Bitcoin alone contributing about $85 billion. These are both elevated levels and showcase the degree of pain among the investors.

Glassnode explained:

With multiple on-chain indicators signalling shrinking liquidity across the board, the market is likely entering a high-volatility regime in the weeks ahead.

In some other news, Bitcoin and Ethereum have shown strong divergence in the Exchange Netflow trend this week, as institutional DeFi solutions provider Sentora has pointed out in an X post.

Bitcoin Vs Ethereum

As is visible above, the Bitcoin Exchange Netflow registered a significant value of -$1.34 billion over the past week. The value being negative implies centralized exchanges faced net withdrawals.

In contrast, the same indicator has witnessed a sharp positive value of $1.03 billion for Ethereum instead. Usually, investors deposit to exchanges when they want to participate in one of the services that they provide, which can include selling. As such, large exchange net inflows can be bearish for the asset’s price.

BTC Price

Bitcoin has again failed to maintain its recovery above $92,000 as its price is back to $90,000.

Bitcoin Price Chart

XRP Daily Fees Down 89% Since February: Network Activity Drying Up?

Data shows the XRP transfer fee has witnessed a significant decrease over the last several months, a sign network activity has been declining.

XRP Transaction Fee Has Dropped To 650 Tokens Per Day

In a new post on X, on-chain analytics firm Glassnode has discussed the latest trend in the Total Transaction Fees indicator for XRP. This metric measures, as its name suggests, the amount of fees that senders on the XRP network attach to their transactions every day.

On blockchains like Bitcoin and Ethereum, the transaction fee goes to the network validator who added the associated move to the next block. In the case of BTC, the network runs on a consensus mechanism called the proof-of-work (PoW), with validators called miners competing against each other using computational resources to get the chance to add the next block to the chain.

While for ETH, validators known as stakers handle consensus by locking in an ETH amount known as the “stake.” This mechanism is known as the proof-of-stake (PoS).

XRP takes an approach that differs from both digital asset giants. In the XRP Ledger Consensus Protocol, network validators maintain a list of other validators that they trust. Validators propose and vote on transactions, with consensus being reached when more than 80% of trusted nodes agree on the validity of the transactions.

The key difference is that in this system, there are no block/staking rewards, and validators aren’t compensated with transaction fees, either. Instead, the fee that users pay is destroyed. This means that every time a transaction occurs, a tiny part of the asset’s supply exits from circulation.

While the destination of the transaction fees is different for XRP when compared to Bitcoin and Ethereum, the network dynamics can still be similar. In other words, high traffic can push the Total Transaction Fees metric up, while low activity periods can lead to a drop in it.

Now, here is the chart shared by Glassnode that shows the trend in the 90-day simple moving average (SMA) of the XRP Total Transaction Fees over the last few years:

XRP Fees

As displayed in the above graph, the XRP Total Transaction Fees witnessed a surge to an extreme level in early 2025. Users were paying 5,900 tokens per day as transfer fees at the peak of this explosion in February.

Since then, however, the blockchain has witnessed a rapid decline in the indicator. Today, the network is witnessing just 650 tokens per day in fees, reflecting a decrease of about 89% from the February high. The 90-day SMA Total Transaction Fees haven’t been this low for the asset since December 2020.

XRP Price

XRP has gone downhill during the last couple of days as its price has returned to the $2.00 level.

XRP Price Chart

Stellar (XLM) Forms Signal That Last Led To 95% Price Rally

A cryptocurrency analyst has pointed out how Stellar has just seen a TD Sequential buy signal. Here’s what happened the last time the pattern surfaced.

Stellar Shot Up The Last Time A TD Buy Signal Appeared At Current Prices

In a new post on X, analyst Ali Martinez has talked about a Tom Demark (TD) Sequential signal that has appeared in the 1-week price of Stellar. The TD Sequential is a technical analysis (TA) indicator that’s used for pinpointing locations of probable reversal in an asset’s price.

The indicator involves two phases. In both of them, it works by counting up candles of the same polarity (that is, whether red or green) in the asset’s chart. These candles don’t have to be consecutive.

During the first phase, called the setup, this count runs until nine candles of a color are in. Once the indicator finishes the setup, the price can be assumed to have reached a potential point of turnaround. Naturally, this signal is a bullish one if the candles leading up to the setup’s completion were red. On the other hand, it’s bearish in the case of nine green candles.

As soon as the setup is over, the second phase, known as the countdown, kicks off. In this phase, the candle count runs until 13. After the countdown is over, the asset could be considered to have arrived at another reversal.

The TD Sequential has just completed the former of the two phases for Stellar. Below is the chart shared by the analyst that shows this pattern forming in the weekly XLM price.

Stellar TD Sequential

As displayed in the graph, Stellar has formed the latest TD Sequential setup with nine red candles, implying that the downtrend may be reaching a state of exhaustion and a bullish reversal could be due for the asset.

Interestingly, this isn’t the first time that XLM has shown a TD Sequential buy signal at the current price levels during the last few months. From the chart, it’s visible that this pattern also emerged when the cryptocurrency was trading at similar levels in March. That setup in the indicator eventually led to a price surge of 95% for Stellar. Given this trend, it’s possible that the latest signal could also prove to be bullish for XLM.

Something to note, however, is that the TD Sequential setup didn’t immediately lead into the big price rally back then; it took a while of consolidation before the breakout appeared.

It now remains to be seen whether the indicator will hold for Stellar this time, and if so, how long a rally will take to appear.

XLM Price

At the time of writing, Stellar is trading around $0.243, down more than 4% over the last week.

XRP Price Chart

Bitcoin Treasuries Have Grown 448% Since Jan 2023: Here’s How Much They Hold Now

Data shows Bitcoin treasury companies have seen an explosive growth trajectory since 2023, gaining relevance as an important pillar of the market.

Public & Private Companies Now Hold More Than A Million Bitcoin

In a new post on X, on-chain analytics firm Glassnode has talked about the trend in the Bitcoin treasuries held by public and private companies. Below is the chart shared by Glassnode that shows changes in both the holdings of the various companies as well as their combined balance.

Bitcoin Treasury Balance

As is visible in the graph, Bitcoin treasuries held by companies saw slow, but steady growth during 2023 and most of 2024, but in late 2024, the growth became much more rapid.

This sharp trajectory continued into 2025 and so far, with the year’s end approaching, the uptrend hasn’t faded. This would suggest that corporates have been accumulating BTC at a significant pace for a year now.

In January 2023, the size of the Bitcoin holdings that private and public firms held stood at 197,000 BTC. Today, that figure has grown to 1.08 million BTC, implying a massive jump of about 448%.

Today, there are about 19.96 million tokens in circulation, so more than 5.4% of the cryptocurrency’s supply is sitting in the treasuries of public and private companies. “Corporate balance sheets are becoming an increasingly significant pillar of demand for BTC,” noted the analytics firm.

A major force behind the increase in Bitcoin corporate holdings is naturally Strategy (formerly MicroStrategy). The Michael Saylor-led firm has been a regular presence in the market for some time now, participating in buying almost every week and making no sales since December 2022.

Strategy currently owns about 660,624 BTC, which means that the treasury company alone accounts for over 61% of all BTC holdings attached to public and private firms.

While Strategy has been a big factor behind the surge in corporate holdings, it hasn’t been the only one. 2025 has seen the rise of treasuries like Metaplanet, which have also contributed to growth in BTC treasuries.

The year has also witnessed a treasury movement related to altcoins, with both Ethereum and Solana seeing a significant amount of accumulation. ETH treasuries went through some sharp growth in mid-2025, but during the recent phase of price decline, buying has slowed down.

That said, it hasn’t hit a complete pause, as institutional DeFi solutions provider Sentora has pointed out in an X post that Ethereum treasuries added a significant amount during November.

Ethereum Treasuries

As displayed in the above chart, Ethereum treasuries added 309,000 ETH during November, and so far in December, they have accumulated another 100,000 ETH.

BTC Price

Bitcoin surged to $94,500 on Tuesday, but the cryptocurrency has since faced a drawdown as it’s now back at $92,200.

Bitcoin Price Chart

Bitcoin Lacks Fresh Momentum As Realized Cap Growth Still Declining

On-chain data shows the Bitcoin Realized Cap Growth indicator has continued to decline recently, a sign new capital inflows lack momentum.

Bitcoin Realized Cap Growth Has Been Heading Down Recently

As explained by CryptoQuant community analyst Maartunn in a new post on X, the Bitcoin Realized Cap Growth has been trending lower recently. The “Realized Cap” is an on-chain capitalization model for BTC that calculates its total value by assuming the value of each individual token is equal to the spot price at which it was last transacted on the blockchain.

This is unlike the usual market cap, which simply calculates the total valuation of the asset by multiplying the number of tokens in circulation with the current spot price, considering the latest value of the cryptocurrency to be the one value for all coins.

In short, what the Realized Cap represents is the amount of capital that the Bitcoin investors as a whole used to purchase the asset’s supply. On the other hand, the market cap is the value that the investors are carrying in the present.

The Realized Cap itself isn’t the indicator of interest in the current discussion, but rather the Realized Cap Growth, measuring the 365-day changes occurring in the Realized Cap.

Changes in the indicator naturally reflect the amount of capital exiting or entering the cryptocurrency. In other words, the Realized Cap Growth contains information about the asset’s netflow.

Now, here is the chart shared by Maartunn that shows the trend in the 7-day and 59-day moving averages (MAs) of the Bitcoin Realized Cap Growth over the last few years:

Bitcoin Realized Cap Growth

As displayed in the above graph, the Bitcoin Realized Cap Growth has witnessed both its 7-day and 59-day MAs reverse down recently, with the former line crossing under the latter.

The trend indicates that growth in the Realized Cap has been slowing down during the recent market downturn. “This suggests Bitcoin is lacking momentum from new cost basis inflows,” noted the analyst.

With the 7-day MA falling below the 59-day MA, the indicator is now flagging the current market to be in a “bear phase.” The last time this signal maintained for an extended duration was alongside BTC’s decline over the first few months of 2025. It now remains to be seen how long momentum from new capital inflows will stay weak for Bitcoin this time around.

In some other news, the Bitcoin short-term holders are still under a notable amount of stress, as CryptoQuant author IT Tech has pointed out in an X post.

Bitcoin STH Profit/Loss Margin

Short-term holders (STHs) are defined as the Bitcoin buyers who got into the market during the past 155 days. Despite the rebound BTC has seen since its November low, STHs are still in a loss of 10%.

BTC Price

At the time of writing, Bitcoin is floating around $92,400, down 1.5% over the last 24 hours.

Bitcoin Price Chart

Solana Enters Bear Territory: Realized Loss Now Outweighs Profit

On-chain data shows the Solana Realized Profit/Loss Ratio has dipped into the loss-taking zone recently, a sign that SOL liquidity has thinned.

Solana Liquidity Back At Levels Associated With Bear Markets

According to data from on-chain analytics firm Glassnode, Solana liquidity has recently contracted to levels that are typically witnessed in a bear market. There are many ways “liquidity” of a cryptocurrency can be assessed, but here, Glassnode has used the Realized Profit/Loss Ratio.

This indicator measures, as its name already implies, the ratio between the amount of profit and loss that the SOL investors as a whole are realizing through their transactions.

The metric works by going through the transaction history of each coin being sold on the network to see what price it was last moved at. If the previous transaction price was less than the latest selling price for any token, then the indicator considers its sale to have realized a net gain. Similarly, the metric adds transactions to the loss-taking category in the opposite case.

The exact amount of profit or loss realized in any transfer is naturally equal to the difference between the latest price and last selling value. The indicator adds up this value for both categories and determines the ratio.

Now, here is the chart shared by the analytics firm that shows the trend in the 30-day moving average (MA) of the Solana Realized Profit/Loss over the last few years:

Solana Realized Profit/Loss

As displayed in the above graph, the Solana Realized Profit/Loss witnessed a sharp spike during the price rally in September. This suggests that profit taking saw an explosion. The indicator maintained at high levels for a while, but following the price peak in October, its value went downhill fast.

In November, the Realized Profit/Loss breached below the 1 mark as SOL plummeted. A value less than 1 on the metric implies loss realization is outpacing profit taking. Since this breakdown, the indicator has only gone lower inside the loss-taking region, a sign investor capitulation has only been becoming more dominant.

Glassnode has noted that the trend signals “liquidity has contracted back to levels typically seen in deep bear markets.” During the 2022 bear market, Solana remained in these conditions for a few months before its price found a bottom.

It now remains to be seen whether the low liquidity will also persist for the cryptocurrency this time, or if the fall into the loss region is only a temporary one for the indicator.

SOL Price

Solana surged to $144 on Tuesday, but the coin has seen a fall back to $138.

Solana Price Chart

New Binance Co-CEO’s WeChat Hacked In Memecoin Pump-And-Dump

Newly-appointed Binance Co-CEO Yi He has seen her WeChat account hacked, with the attacker using it to promote a litte-known memecoin.

Hacker Shilled Memecoin Mubarakah Using Binance Co-CEO’s WeChat

Binance‘s new co-CEO Yi He fell prey to a social media hack Tuesday night, as founder Changpeng “CZ” Zhao has shared in an X post. “Someone hacked @heyibinance’s WeChat account,” said CZ. “Do not buy meme coins from the hackers posts.”

The entity who gained control of Yi He’s account used it to promote a small memecoin called Mubarakah (MUBARA). Like is usually the pattern with hacks like these, investors bought into the token, believing the endorsement to be coming from a well-known industry figure. This sent the memecoin soaring.

On-chain sleuth Lookonchain has revealed how the hacker timed their moves. First, the attacker made two wallets hours in advance, spending 19,479 USDT to buy 21.16 million in Mubarakah.

“After the pump, the hacker has already sold 11.95M $Mubarakah for 43,520 $USDT and still holds 9.21M $Mubarakah($31K), for a total profit of $55K,” explained Lookonchain. The pattern is a clear example of a classic pump-and-dump scheme.

Yi He posted on X that the phone number tied to her WeChat account was taken over, locking her out of the account. A few hours later, she shared that she was able to regain control of the account.

Zhao took the moment to throw a jab at legacy internet systems, saying, “Web 2 social media security is not that strong.” Web 2.0 refers to the traditional online ecosystems most apps still run on, as opposed to the newer, blockchain-powered Web 3.0.

The hack has come just a week after Yi He, who is also a co-founder, was appointed as Binance co-CEO. Previously, she served as chief customer service officer for the cryptocurrency exchange.

In some other news, Binance has become the first digital asset exchange in the world to receive a license from UAE’s ADGM this week, as announced in a press release.

ADGM, standing for Abu Dhabi Global Market, is the international financial center of UAE’s capital, Abu Dhabi. ADGM’s Financial Services Regulatory Authority (FSRA) has given the exchange full authorization to operate its platform in the region.

Due to ADGM’s regulatory requirements, Binance will run its operations through three distinct entities, with each responsible for a separate function: an exchange, a clearing house, and a broker-dealer.

Binance co-CEO Richard Teng noted:

ADGM is one of the most respected financial regulators globally, and holding an FSRA license under their gold standard framework shows that Binance meets the highest international standards for compliance, governance, risk management, and consumer protection.

Bitcoin Price

At the time of writing, Bitcoin is trading around $91,900, down 1% over the last week.

Bitcoin Price Chart

Abu Dhabi Steps Up Crypto Regulation: Tether, Circle Secure Major Approvals

Tether and Circle, issuers of the two largest stablecoins in the world, have just received major regulatory greenlights in UAE’s Abu Dhabi.

Tether’s Stablecoin Recognized As ARFT, While Circle Obtains FSP License

Major developments related to the cryptocurrency sector have occurred in the United Arab Emirates (UAE) this week, with Tether and Circle both winning approvals in Abu Dhabi Global Market (ADGM), the international financial center and free economic zone of Abu Dhabi, UAE’s capital.

First, as Tether has announced in a press release, USDT issued on a number of blockchains has been recognized as an Accepted Fiat-Referenced Token (ARFT) in ADGM. USDT already received approval from ADGM last year, but the previous recognition only included the Ethereum, Solana, and Avalanche versions. With the new regulatory nod, USDT available on Aptos, Celo, Cosmos, Kaia, Near, Polkadot, Tezos, TON, and TRON has also entered the market.

“By extending recognition to USD₮ on several major blockchains, ADGM further strengthens Abu Dhabi’s position as a global hub for compliant digital finance,” said Tether CEO Paolo Ardoino.

USDT being considered as an ARFT means that authorized persons licensed by ADGM’s Financial Services Regulatory Authority (FSRA) can offer regulated activities involving the stablecoin on nearly all its native blockchains. “Introducing USD₮ within ADGM’s regulated digital asset framework reinforces the role of stablecoins as essential components of today’s financial landscape,” noted Ardoino.

Meanwhile, Circle, the issuer of USDC, has also advanced in the region with a new license from the FSRA, according to an announcement. The license, called the Financial Services Permission (FSP), allows the company to operate as a Money Services Provider in ADGM.

Arvind Ramamurthy, ADGM Chief Market Development Officer, said:

Circle’s regulated presence in ADGM reinforces our ambition to build a trusted, institutional-grade digital asset ecosystem in Abu Dhabi, one that enhances market confidence, supports real-world use cases, and cements the UAE’s role as a leading hub for regulated digital finance.

The greenlight from ADGM follows the recognition of Circle’s USD and EUR stablecoins by the Dubai Financial Services Authority (DFSA) in February of this year. The move made USDC and EURC the first stablecoins to be approved in the Dubai International Financial Centre (DIFC).

The new FSP license means “Circle is positioned to expand regulated payment and settlement use cases in the UAE for businesses, developers, and financial institutions,” the statement noted.

Stablecoins have witnessed rapid growth throughout 2025, setting multiple records. The near-constant growth in these tokens, however, saw a break in October, as the combined market cap of this side of the cryptocurrency sector reversed course.

Stablecoin Market Cap

As the above chart from DefiLlama shows, the stablecoin market cap declined to a low in mid-November. Since this bottom, though, capital inflows have returned for these fiat-tied assets, with the market cap once again nearing in on a new record.

Bitcoin Price

At the time of writing, Bitcoin is floating around $90,100, up almost 4% in the last seven days.

Bitcoin Price Chart

Bitcoin In An Opportunity Zone? Hash Ribbons Flash New Buy Signal

On-chain data shows the popular Bitcoin Hash Ribbons indicator has just given a miner capitulation signal. Here’s what this could mean.

Bitcoin Hash Ribbons Now Signaling Miner Stress

As pointed out by CryptoQuant author Darkfrost in an X post, the Bitcoin Hash Ribbons have shown a crossover that has historically corresponded to rising stress among the miners. The Hash Ribbons indicator aims to gauge the situation of the miners by comparing the 30-day and 60-day moving averages (MAs) of the BTC Hashrate, a metric that measures the total amount of computing power that the validators as a whole have connected to the blockchain.

The trend in the Hashrate can act as a representation of the sentiment among the miners, as they usually expand computing power (an increase in the Hashrate) when mining is profitable and/or they believe BTC is heading toward a bullish outcome, while they decommission mining rigs (a drop in the Hashrate) when they are having a hard time breaking even.

The Hash Ribbons indicator basically captures shifts between these two behaviors. When the 30-day ribbon falls below the 60-day one, it means miners are reducing power at a fast rate. This can be a sign that this group is going through capitulation.

Such a crossover has recently formed again for Bitcoin, as the chart below shared by Darkfrost shows.

Bitcoin Hash Ribbons

Thus, it would appear that miners are once again in a phase of capitulation. “Historically, these periods of mining stress have been profitable for Bitcoin investors, with one exception during the 2021 mining ban in China,” noted the analyst.

The signal doesn’t act as a straightforward buy indicator, however, as mining capitulation often doesn’t directly coincide with a bottom. “In the short term, these periods tend to be bearish because miners may need to increase their selling to cover production costs,” explained Darkfrost.

In general, miner capitulation periods have tended to lead into profitable buying windows for the cryptocurrency, although it’s unpredictable how long such a phase would last. From the chart, it’s apparent that sometimes the Hash Ribbons signal has been quite brief, while other times it has been maintained for weeks.

As for what has forced miners to turn off Hashrate recently, the answer likely lies in the bearish trajectory that Bitcoin has witnessed. Miners obtain their reward in BTC denomination, so how the USD value of the coin fluctuates directly affects their dollar revenue.

Before this, miners had been in a phase of rapid expansion alongside the bull rally, which had led to an explosion in the network’s mining Difficulty. With the price plummeting and Difficulty being at extraordinary levels, miners have faced a double whammy during the past month.

BTC Price

Bitcoin saw a recovery above $92,000 on Monday, but it would appear that the asset wasn’t able to maintain it, as its price is now back at $90,300.

Bitcoin Price Chart

Bitcoin Speculation Muted: Glassnode Analyst Calls Perps A ‘Ghost Town’

Glassnode’s senior researcher has pointed out how Bitcoin perpetual futures market is looking like a “ghost town,” with Open Interest continuing to be at muted levels.

Bitcoin Futures Open Interest Has Remained Low Since October Reset

In a new post on X, Glassnode senior researcher CryptoVizArt.₿ has talked about the recent trend in the Bitcoin Open Interest for the perpetual futures market. The “Open Interest” refers to an indicator that measures the total amount of positions related to the asset that are currently open on all centralized derivatives platforms.

When the value of the metric rises, it means the investors are opening new positions related to the asset. Generally, new positions come with fresh leverage for the sector, so the cryptocurrency’s price can become more volatile following an increase in the Open Interest.

On the other hand, the indicator going down suggests the perpetual futures traders are either closing up position of their own volition or getting forcibly liquidated by their platform. Such a trend can lead to more stable price action for BTC due to the clearing of leverage.

Now, here is the chart shared by CryptoVizArt.₿ that shows the trend in the Bitcoin perpetual futures Open Interest (BTC-denominated) over the last few months:

Bitcoin Open Interest

As displayed in the above graph, the BTC-denominated Bitcoin perpetual futures Open Interest saw a sharp plunge back in October as a result of the crash in the cryptocurrency’s price.

Following the leverage flush, the indicator traveled sideways around its lows, but in mid-November, speculation noted an uptick as the asset’s drawdown continued, with the metric’s value peaking alongside the level that has so far acted as the bottom.

Since this high, however, the indicator has cooled off once again and approached the same lows as the ones that followed the massive liquidation event in October. Thus, with Open Interest back under 310,000 BTC, it seems speculative interest in the market has once again become muted.

The recent decline in speculative participation has come alongside a drop in the perpetual futures Funding Rate, a metric tracking the amount of periodic fee being exchanged between the short and long investors.

Bitcoin Funding Rate

From the chart, it’s visible that the Bitcoin perpetual futures Funding Rate has been going down since a while now. “This persistent drift lower reflects a decline in leveraged long conviction, with traders unwilling to pay a premium to maintain upside exposure,” noted the Glassnode researcher.

Based on the recent developments, CryptoVizArt.₿ has called the perpetual futures market a “ghost town.”

BTC Price

At the time of writing, Bitcoin is floating around $90,500, up almost 6% over the last seven days.

Bitcoin Price Chart

Strategy Not Slowed Down By USD Reserve—Drops Nearly $1 Billion On Bitcoin

Just a week after announcing its $1.44 billion USD Reserve, Strategy has made a Bitcoin purchase of nearly $1 billion, one of the largest for 2025.

Strategy Has Made Its Ninth Largest Bitcoin Buy Of The Year

In a new post on X, Strategy co-founder and chairman Michael Saylor has shared info related to the latest routine Monday Bitcoin purchase made by the treasury company.

While the timing of the buy is routine, its scale is not. In total, Strategy has added 10,624 BTC to its holdings with the acquisition. This is the biggest purchase since July’s 21,021 BTC mega-buy.

The new acquisition has cost the firm $90,615 per token or $962.7 million in total. In USD terms, this is the ninth largest addition to the company’s Bitcoin reserves.

This big purchase has come a week after Strategy announced a new shift for the company with its $1.44 billion USD reserve. Saylor said that the reserve will better position the firm to navigate short-term volatility.

The announcement was also accompanied by the usual Monday Bitcoin buy, but at just 130 tokens, it was a relatively small one. If the latest acquisition is to go by, however, the USD reserve doesn’t seem to be stopping Strategy in hoarding more of the cryptocurrency.

According to the filing with the US Securities and Exchange Commission, the new buy, which occurred in the period between December 1st and 7th, was funded using sales of the firm’s STRD and MSTR at-the-market (ATM) stock offerings.

Strategy now holds a total of 660,624 BTC, with an average cost basis of $74,696 per coin or total investment of $49.35 billion. At the current price of the asset, the Bitcoin treasury company’s holdings are worth about $59.68 billion, which means that it’s sitting on a profit of nearly 21% right now.

In some other news, while Strategy has continued its Bitcoin accumulation, the same hasn’t been true for another side of the sector: the spot exchange-traded funds (ETFs).

The spot ETFs refer to investment vehicles that allow investors to gain indirect exposure to BTC. That is, the funds hold the cryptocurrency on behalf of the investors, enabling them to invest into the asset without having to bother with the on-chain side of things.

Since mid-October, the US Bitcoin spot ETFs have mostly faced waves of net outflows as the cryptocurrency’s price has followed a bearish trajectory. The last week of November registered a small positive netflow, however, breaking a streak of four consecutive weeks of outflows.

This turnaround didn’t last, though, with the latest week once again ending with net outflows, as the below chart from SoSoValue shows.

Bitcoin ETFs

The outflows were only modest, coming out at about $87.8 million, but still indicate lingering pessimism in the market.

BTC Price

Bitcoin broke above $92,000 earlier in the day, but the coin has since faced a pullback as it’s now back at $89,900.

Bitcoin Price Chart

Coinbase Is Back In India—And It Wants 30% Crypto Tax Reconsidered

Digital asset exchange Coinbase has restarted crypto trading in India after a two-year absence, with fiat deposits planned to arrive in 2026.

Coinbase Has Returned To India For The First Time Since 2023

As reported by TechCrunch, Coinbase has resumed user onboarding in India for the first time since pulling out of the country back in 2023, more than two years ago. The American crypto exchange ranks as the largest public digital asset company in the world, hosting around $516 billion in assets on its platform.

Initially, the exchange first entered India in 2022, but only a few days after beginning services, it had to suspend UPI payments. UPI, short for Unified Payments Interface, is the most widely adopted real-time digital payments instrument in India. The National Payments Corporation of India (NPCI) had said shortly after Coinbase’s launch that it wasn’t aware of any crypto exchange using UPI.

With UPI access gone, Coinbase users no longer had a way to purchase digital assets on the platform using fiat. The exchange stopped new user signups in June 2023, with a complete discontinuation of services happening in September 2023.

“We had millions of customers in India, historically, and we took a very clear stance to off-board those customers entirely from overseas entities, where they were domiciled and regulated,” said Coinbase’s APAC director, John O’Loghlen, at India Blockchain Week (IBW). O’Loghlen added that the decision to pull out didn’t come without hesitation.

Fast-forward to 2025, and Coinbase announced in March that it had registered with India’s Financial Intelligence Unit (FIU), allowing it to provide crypto services in the country. The platform opened in early access in October, and now, it has seen a full public launch. So far, users can only access crypto-to-crypto trading, but according to O’Loghlen, a fiat on-ramp is planned to become available next year. This would allow users to buy digital assets using the Indian Rupee (INR).

While India isn’t closed off to cryptocurrencies like its northern neighbor, China, it still has a relatively strict digital-asset regulation regime. The nation collects a 30% tax on investor crypto profits and allows for no offsets against losses. Additionally, it charges a 1% Tax Deducted at Source (TDS) on all transactions, as a method of tracking digital asset activity.

Naturally, this taxation regime isn’t ideal for crypto companies, as it directly affects adoption. O’Loghlen said that Coinbase is hoping the Indian government will relax the tax to make it more convenient for investors to hold digital assets.

Reopening its exchange isn’t the only move that Coinbase has made in the subcontinent recently. As announced on its blog, the platform has made an investment in Indian crypto exchange CoinDCX. “Taken together, these steps reflect a clear commitment: we believe India and its neighbors will help shape the future of the global onchain economy,” noted the post.

Bitcoin Price

At the time of writing, Bitcoin is trading around $91,800, up more than 7% over the last week.

Bitcoin Price Chart

XRP Selloff: Whales Shed Coins Worth $1 Billion In A Week

On-chain data shows the XRP whales have distributed a significant amount during the past week, a sign of negative sentiment among large holders.

XRP Whales Have Shed 510 Million Tokens From Their Holdings

As announced by analyst Ali Martinez in a new post on X, XRP whales have participated in a notable amount of selling recently. A “whale” is typically defined as an XRP investor holding between 1 million and 10 million tokens. At the current exchange rate of the cryptocurrency, this range converts to $2 million at the lower end and $20 million at the upper one.

Given the size of the range, the only investors who would qualify for the cohort would be the big-money hands. These holders can carry some influence in the market, making the group a key one for the network.

Now, here is the chart from on-chain analytics firm Santiment shared by Martinez that shows how the supply of the XRP whales has changed over the last few months:

XRP Whales

As displayed in the above graph, the XRP whale supply has been following a downtrend since mid-November, indicating that the large holders have been distributing. The trend has continued during the past week, with entities belonging to the group collectively selling 510 million coins, worth more than $2 billion at the latest price.

At the same time as the selloff over the last few weeks, XRP has witnessed some net bearish price action, implying that the whales may have had a role to play in it.

Given that these humongous entities haven’t shown any signs of slowing down recently, it’s possible that the coin could see a further drop. It only remains to be seen, however, how whale behavior will develop in the coming days.

In some other news, XRP could be set up for a 16% move according to a technical analysis (TA) pattern, as Martinez has pointed out in another X post.

XRP Triangle

From the chart, it’s visible that XRP has roughly been traveling inside a Symmetrical Triangle on the 1-hour timeframe since November. A Symmetrical Triangle is a consolidation channel that involves two converging trendlines approaching each other at an equal and opposite slope.

The coin is already more than halfway through the channel, meaning that its range is getting narrow. A narrower range means retests of the support and resistance levels become more frequent, making either more probable.

Based on the height of the channel, the analyst has noted that a breakout could lead to a 16% move for XRP. It now remains to be seen which direction the asset will exit, and whether the pattern will hold.

XRP Price

XRP has again found a rebound since its retest of the $2.00 level, as its price is now back at $2.09.

XRP Price Chart

From Top To Bottom: Bitcoin’s Largest & Smallest Hands Both Now Accumulating

Data shows distribution on the Bitcoin network has dropped off, with both the largest of whales and small retail hands taking to accumulation.

Bitcoin Accumulation Trend Score Shows Shift Toward Buying

As explained by Glassnode analyst Chris Beamish in an X post, Bitcoin investors have been showing a lot less distribution at the recent price levels. The on-chain indicator of relevance here is the “Accumulation Trend Score,” which tells us about whether BTC holders are buying or selling.

The metric tracks investor behavior using not just the changes happening in their wallet balance, but also accounting for the size of their wallets. This means that larger entities have a higher influence on the score.

When the value of the Accumulation Trend Score is greater than 0.5, it means the investors are displaying a net trend of accumulation. On the other hand, it being under the threshold suggests the dominance of distribution.

Now, here is the chart shared by Beamish that shows how the Accumulation Trend Score has changed for the different Bitcoin investor segments over the last few years:

Bitcoin Accumulation Trend Score

As displayed in the above graph, the Bitcoin Accumulation Trend Score has reflected a varied behavior for the different investor segments during the last couple of months, but very recently, a uniform picture has started to develop.

The smallest of investors in the market, those holding less than 1 BTC, started participating in aggressive accumulation around the time of BTC’s low in November and have since maintained the indicator nearly at a perfect value of 1. This suggests that retail investors have been buying the dip.

Meanwhile, the 100 to 1,000 BTC traders, popularly called the sharks, have been accumulating throughout the drawdown that has followed since the early October peak, indicating that these investors haven’t lost conviction despite the deep decline.

The story is a bit different for the whale cohorts, however. The 10,000+ BTC holders, corresponding to the largest of hands on the network, were in a phase of distribution between August and November, but they have finally started accumulating since the price low, although the Accumulation Trend Score isn’t as high as the retail investors in their case.

The 1,000 to 10,000 BTC whale group didn’t stop distributing even after the bottom, but very recently, their score has just breached the 0.5 mark. With this, a uniform behavior has begun to appear on the Bitcoin blockchain, with investors as a whole opting to expand their wallet balance.

It now remains to be seen how long this trend of accumulation will continue.

BTC Price

Bitcoin has faced a drop of more than 3% over the last 24 hours that has taken its price to $89,300.

Bitcoin Price Chart

❌