Reading view

There are new articles available, click to refresh the page.

Binance XRP Reserves Fall To 2024 Low — Recovery Soon?

While the XRP price displays a clear bearish structure, momentum pushing the price downwards appears to be cooling. A recent analysis into underlying on-chain activity has revealed a shift in investor behavior, providing context to the recently slowed momentum seen.

XRP Holdings Decline To 2024 Low Of 2.6 Billion

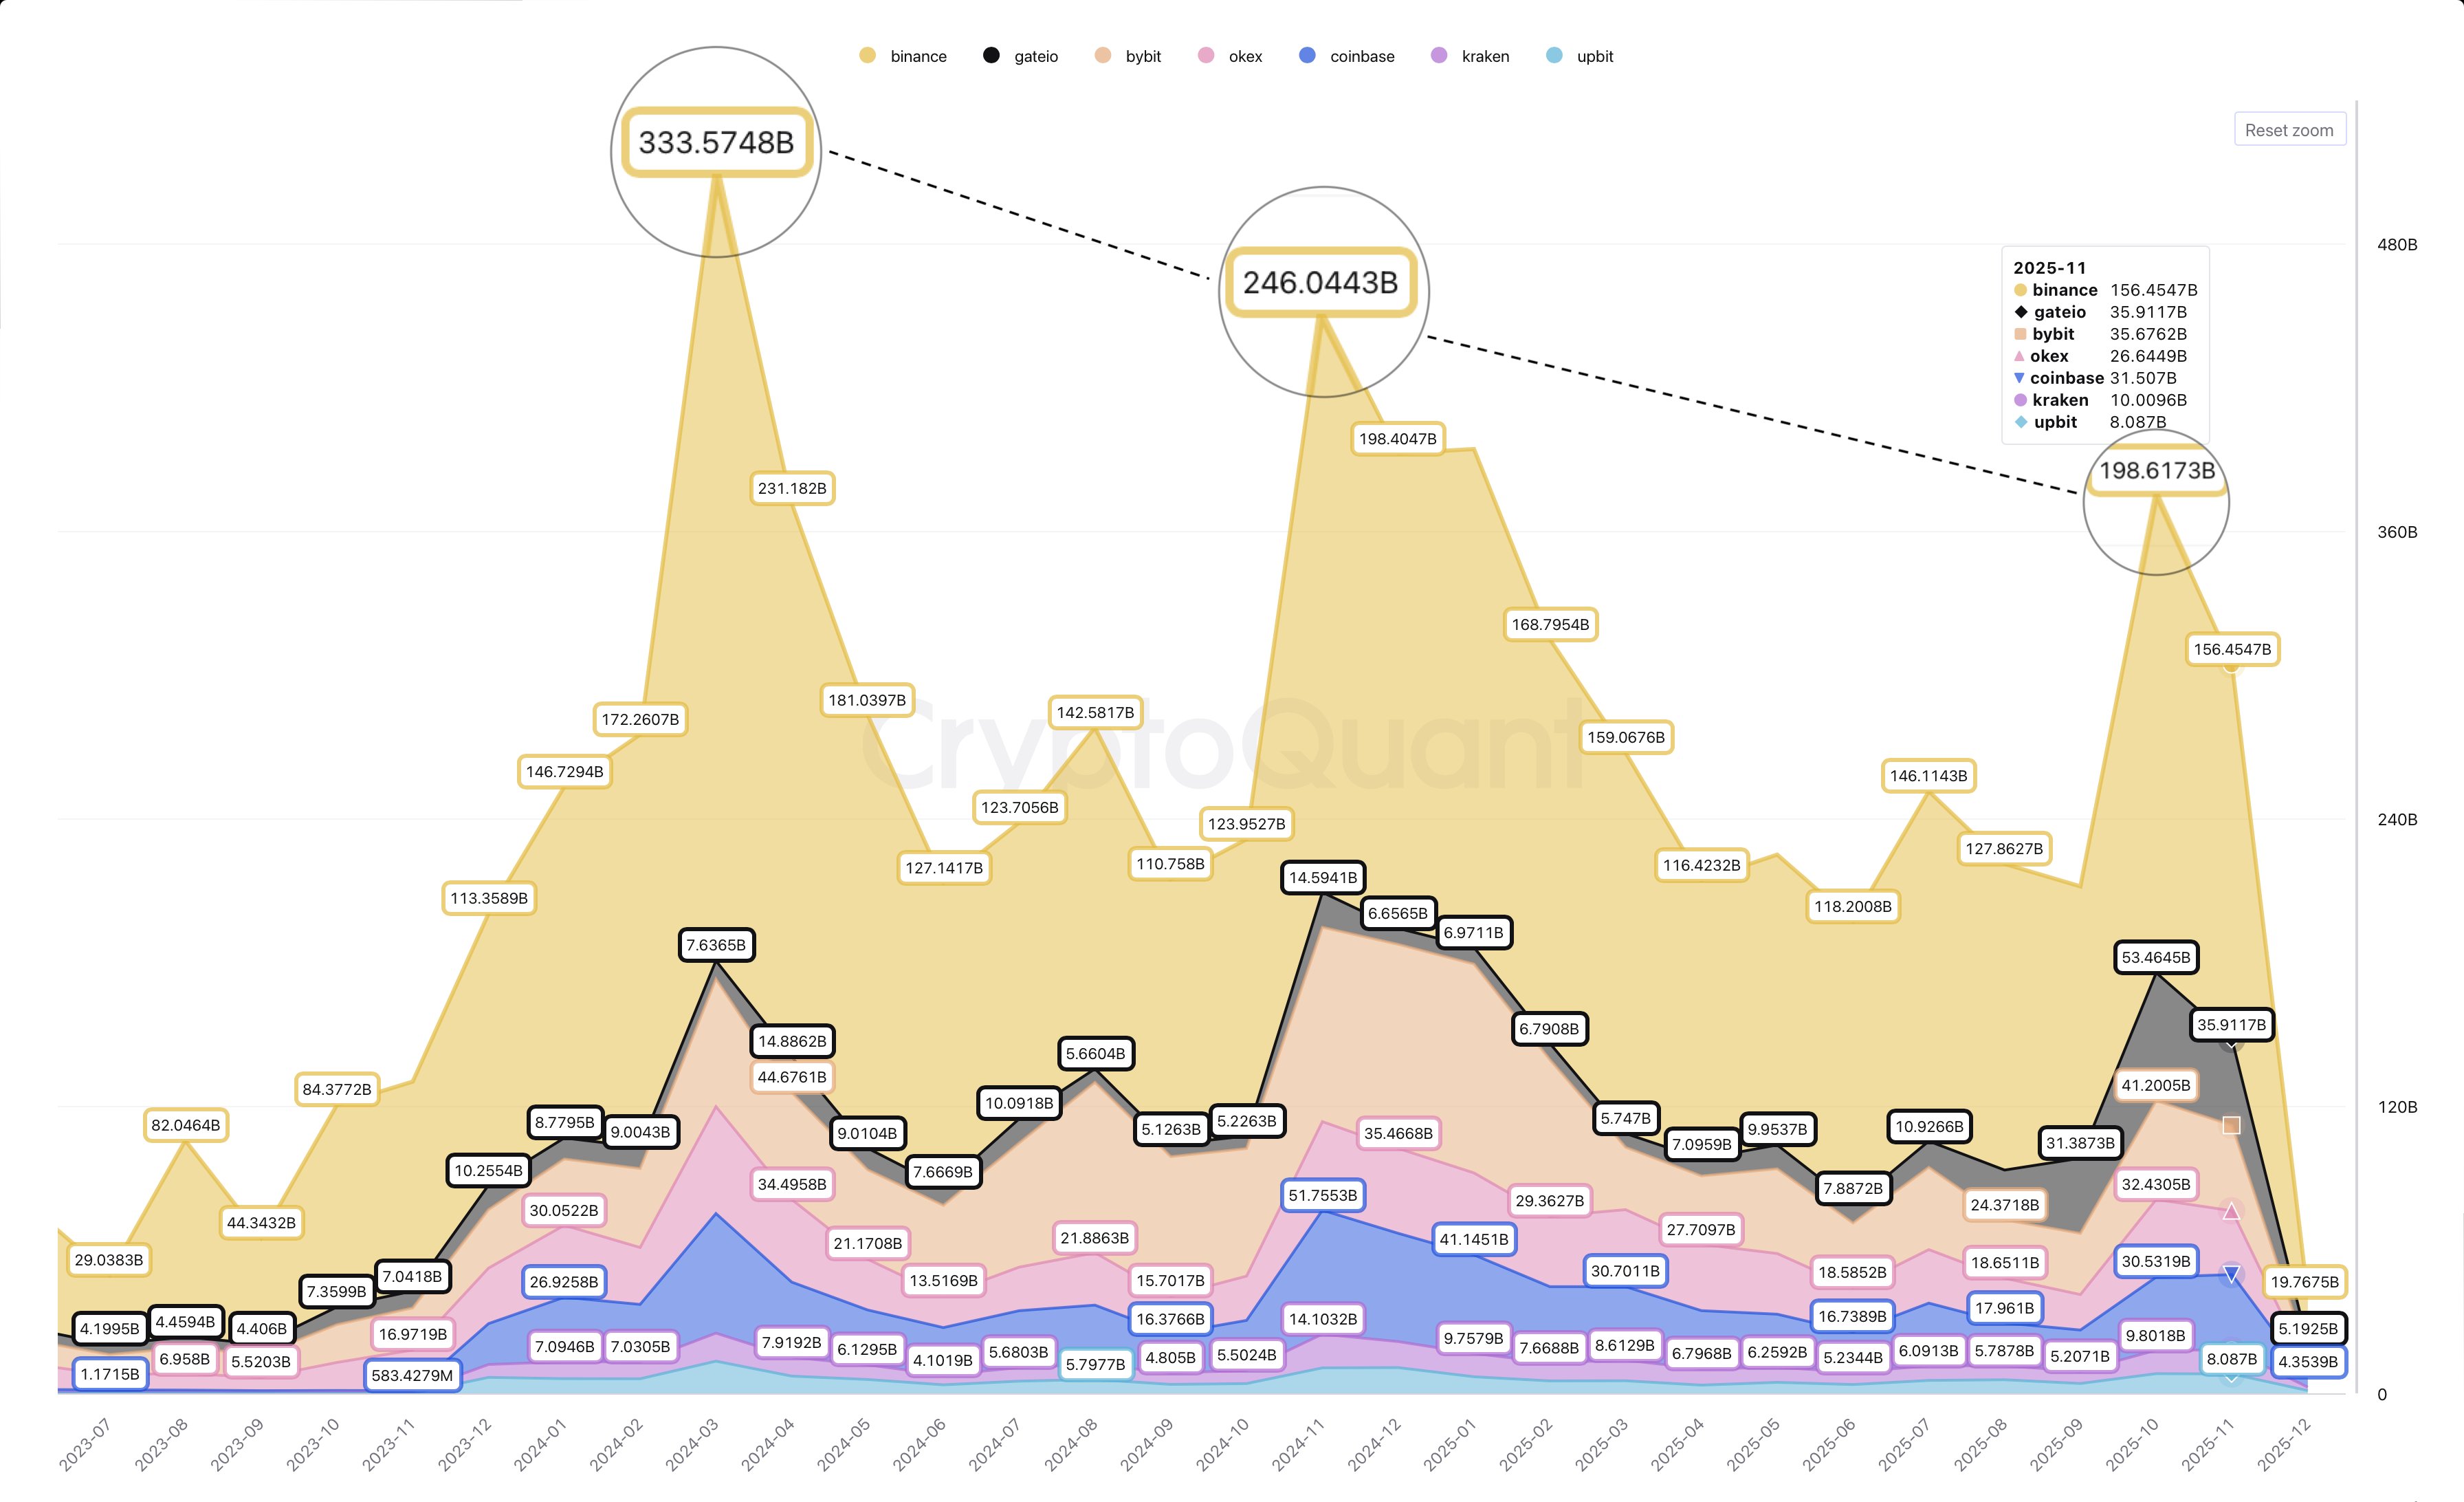
In a QuickTake post on CryptoQuant, the on-chain analytics group Arab Chain explains how the XRP market is experiencing certain shifts in liquidity dynamics. The analysis revolved around data obtained from the XRP Ledger: Exchange Reserve metric, which tracks the total amount of XRP held in wallets associated with centralized cryptocurrency exchanges (in this case, Binance).

According to Arab Chain, XRP’s exchange reserves on the Binance platform have declined, reaching an approximate 2.6 billion reading, the lowest level seen since 2024. Typically, a fall in exchange reserve numbers indicates the tokens’ movement out of centralized platforms into personal wallets for long-term holding or merely transferred out for other on-chain uses.

XRP

Notably, the steady contraction of Binance’s XRP reserves points out that market participants might be more inclined towards holding, as opposed to having a growing selling appetite. Arab Chain cites historical data, explaining that increased outflows from exchanges can be interpreted as a sign of easing bearish pressure. This is because coins outside exchanges are less prone to rapid liquidation events. Also, such a decline during periods where prices remain stable could signal growing accumulation tendencies among investors. 

The analytics group further revealed a unique trait of current data. The present decline in reserves came after previous sharp growths in the XRP exchange reserves. It then becomes clear that the market may simply be “rebalancing its supply structure, with a reduced amount of XRP available for day-to-day trading.” 

It’s worth noting that the contraction in reserves puts the market in a delicately bullish position. In this scenario, the re-entry of buyers into the XRP market could translate into a faster and sharper bullish momentum. On the other hand, a sustained absence of growing reserves dampens the chances of any large-scale sell-off in the short term.

XRP Price Overview 

For most of December, XRP has traded within the $2.123–$2.000 price levels. Popular market analyst, Ali Martinez, however, recently took to X to report that $XRP has to prevail above $2.0, for any hopes of a price recovery to be realistic. In the scenario where $2.0 fails to hold, the altcoin could spiral downwards to as low as $1.20.

As of this writing, XRP trades at approximately $2.02, with CoinMarketCap data reporting a % 0.64% growth over the last 24 hours.

XRP

SEC Publishes Crypto Custody Guidelines For Retail Investors

The US government continues to advocate for cryptocurrency adoption after the Securities and Exchange Commission published a retail investor guide centered around various means of custody. In the bulletin released on Friday, the SEC provides a detailed education on the available ways investors can safeguard their cryptocurrency investments and the associated risks.

SEC Addresses Crypto Custody As Regulatory Acceptance Takes Shape

The Donald Trump-led administration has taken multiple steps in supporting the growth of the digital asset industry in line with the US President’s electoral manifesto. Under the current crypto-friendly stance, the US SEC has adopted a more accommodating regulatory approach compared to the regulation-by-enforcement strategy seen under the Biden administration.

This shift has led to several key developments, including the formation of a dedicated task force, the termination of multiple lawsuits initiated under Biden’s crackdown, and the launch of a new regulatory initiative known as “Project Crypto.” In another encouraging move towards the nascent industry, the regulator has recently released a set of guidelines on proper custody of cryptocurrency.

In this document, the SEC’s Office of Investor Education and Assistance defines a crypto asset as “an asset that is generated, issued, and/or transferred using a blockchain or similar distributed ledger technology network, including assets known as ‘tokens,’ ‘digital assets,’ ‘virtual currencies,’ and ‘coins.’” 

Meanwhile, custody is defined as how and where investors store and access their crypto assets. The Commission touches on the importance of private keys, which they define as an alphanumeric code that allows users to gain access to their digital assets using programs known as crypto wallets. The US regulators also drew comparisons between self-custody and third-party custody, highlighting their peculiarities in terms of control and security responsibility. Other aspects of crypto custody discussed by the SEC include types of crypto wallets (hot and cold), seed phrase, and public key.

Crypto Community Reacts To SEC’s Educational Efforts

Unsurprisingly, the SEC’s published bulletin on crypto custody has drawn applause from many crypto enthusiasts. For example, a market analyst with X username X Finance Bull describes the custody education post as another lever of regulatory acceptance. 

The analyst said: 

The SEC just released an official guide on crypto asset custody for retail investors. Months after dropping the $XRP case, the posture keeps shifting. from resistance to education. I’ve seen this movie before. This is what quiet acceptance looks like.

At press time, the total crypto market cap is valued at $3.04 trillion, after a minor 0.29% growth in the past day.

SEC

Bitcoin And Ethereum Market Structure Points To Crypto Winter – Details

The crypto market has shown a modest price rebound in the last three weeks, returning to a total market cap of $3.07 trillion. During this time, Bitcoin has climbed by 11% from its local bottom at $80,700, while Ethereum has been more aggressive, gaining by 18% within the same period. Despite these reassuring performances, a market analyst with the username PelinayPA postulates that the bear market has commenced, considering certain technical parameters.

BTC & ETH Moving Averages, Trading Volumes Signal Bear Season 

Bear market speculations have been at a heightened level in Q4 2025, as the crypto market suffered extensive price corrections, during which Bitcoin alone retraced by around 36.5%. While the market may have shown some steady upward mobility in recent weeks, many analysts remain convinced the bears have assumed market control, leaving little bullish potential for a full market reversal.

In analyzing Bitcoin’s chart, PelinayPA explains that price is presently trading below the short (7, 14), medium (30, 50), and long-term moving averages (100), indicating a strong sellers’ dominance in the market. However, the more concerning observation is that these averages are sloping downward, suggesting the recent downtrend or corrections may not be temporary.

Bitcoin

Furthermore, the seasoned crypto analyst notes these moving averages are acting as resistance in classic bear-market behavior that initiates a selling spree upon contact with price. In addition, sellers are also aggressive as red candles come with higher volume, while hesitant buyers load the green candles with relatively lower volumes. Based on these technical observations, PelinayPA explains that Bitcoin is not launching a bullish market reversal, but rather remains in a reaction within a larger bear market. 

Meanwhile, the Ethereum market analysis shows a similar situation in that price is trading below key moving averages. However, the short-term MAs (7, 14) are beginning to turn upward. In addition, the price rebounds from lows are stable and stronger while candles are recording shorter wicks, indicating the selling pressure is less aggressive, why buying interest remains visible. 

Therefore, while Ethereum is clearly stronger than Bitcoin, the bullish strength remains insufficient to initiate a trend reversal as long-term MAs remain downward sloping amid low buying volume.

Bitcoin Price Overview

At the time of writing, Bitcoin trades at $90,155 after a minor 0.22% decline in the past 24 hours. Meanwhile, daily trading volume is down by 20.34% and valued at $64.22 billion.

According to PelinayPA, the Bitcoin bull rally is finished, and a deeper price correction is needed before investors see another parabolic surge or all-time high. The analyst predicts Bitcoin to bottom around $50,000 in the “ongoing” bear market, postulating a potential 44.4% decline from the present market prices.

Bitcoin

Bitcoin Investors Brace For BOJ Rate Hike As Market Sell-Off Continues — Details

The Bitcoin market has continued to consolidate within the $90,000 price zone over the last day, reflecting a minor 0.04% gain within this period. Notably, the premier cryptocurrency has witnessed a steady rally in recent weeks, forming the early phases of an ascending channel. To protect this potential uptrend, recent on-chain data shows that investors are moving to initiate a downside and price in the market effect of an anticipated negative catalyst.

Bitcoin Sees High Inflows, Negative Funding Rates As Investors Guard Against Rate Hike

In a QuickTake post on CryptoQuant, the crypto analysis page XWIN Research Japan discusses how potential Japan economic developments are presently impacting the Bitcoin market. Notably, analysts and economists expect the Bank of Japan to announce a 25 bps rate hike at its next policy meeting between December 18-19, as the Asian nation moves to end an ultra-loose monetary regime.

Interest rate hikes are generally interpreted as bearish catalysts as they force investors to move out of risky assets due to less available capital, thereby inducing a price decline. According to XWIN Research Japan, Bitcoin investors may currently be attempting to absorb the resulting price pressure, potentially muting the immediate impact of the primary catalyst itself.


Bitcoin

This theory is based on multiple developments, such as exchange netflows. The analysts at XWIN report that exchange inflows are rising to mirror similar levels seen during previous BOJ hikes. Investors are presently exiting exchanges and minimizing their spot exposure to reduce the market impact of the expected decision.  Meanwhile, the funding rates are also declining, another event seen during past rate hikes. Notably, investors are proactively losing their leverage in what is a pre-event caution movement.

What Next For Bitcoin? 

At press time, Bitcoin tie valued at $90,190, reflecting a market gain of 0.77% in the past week. With the Bank of Japan’s hawkish pivot largely priced in, XWIN Research says that market focus has shifted away from the rate hike itself toward post-announcement yen dynamics.

Going forward, the analysts explain that Bitcoin’s near-term direction may hinge on whether the yen continues to strengthen or if markets respond with a “sell the rumor, buy the fact” reversal, signaling that the adjustment phase is already unfolding. With a market cap of $1.67 trillion, Bitcoin continues to rank as the largest cryptocurrency with a current market dominance of 58.2%

Bitcoin

Bitcoin To Retest $85,000 Mark In Coming Days – Here’s Why

Amid a steady price rebound in the Bitcoin (BTC) market, popular market analyst with the X username KillaXBT is predicting another significant correction in the forthcoming days.

Bitcoin Historical Data Reveals Recurring Monthly 8% Price Decline

In an X post on December 12, KillaXBT outlines a cautious market insight that suggests Bitcoin is headed for a price pullback. According to the renowned analyst, the premier cryptocurrency has consistently recorded an 8% price decline after the 14th day of the last five months. KillaXBT describes this observation as the 14th Pivot, which now holds important implications for Bitcoin in the short term. Since hitting a price bottom of $80,000 in late November, BTC has formed an ascending channel, recording a steady series of higher lows and higher highs.

Bitcoin

However, KillaXBT’s projection is expected to break this channel, potentially halting the nascent uptrend. Going by the recurring price pattern, the analyst states Bitcoin investors should anticipate a minimum 5% price decline after the 14th of December, hinting at a potential retest of the 85,000-$86,000 price zone.

Given the asset’s broader bullish market structure, such a move may represent nothing more than a short-term pullback. However, the prolonged correction seen earlier in Q4 has already set a precedent, leaving room for another phase of deeper downside should momentum weaken.

BTC To Bottom Below $50,000? 

In another X post, KillaXBT shares more bearish projections of the Bitcoin market. This time, the seasoned analyst predicts the crypto market leader will hit a price bottom of $48,905 despite recent price gains. KillaXBT’s bottom target represents Bitcoin’s price as of the approval of the BlackRock IBIT ETF, alongside 11 other Bitcoin Spot ETFs in January 2024. This projection is likely due to the common rationale that the present bullish run has been heavily supported by institutional inflows.


Bitcoin

Notably, the Bitcoin Spot ETFs have been central to these institutional inflows, boasting total net assets of $119.18 billion. The BlackRock IBIT holds over half of this traction as the undisputed market leader with $71.03 billion in net assets and $62.68 billion in cumulative net inflows. 

If Bitcoin were to return to its pre-ETF approval price levels, it would imply an estimated 46% decline from current market prices. Such a move would likely signal a sharp reversal in institutional positioning, suggesting that sustained ETF outflows, rather than retail capitulation, could emerge as the primary catalyst for a renewed crypto winter.

At press time, Bitcoin continues to trade at $90,348, reflecting a 2.18% decline.

Bitcoin

Featured image from Pexels, chart from Tradingview

Tether Submits Bid To Acquire Juventus Football Club — Details

Stablecoin operator Tether has submitted a market bid to acquire a controlling stake in Italian football club Juventus FC. This development follows initial minor investments, as the USDT issuing company looks to deepen its involvement with the footballing institution.

Tether Promises 1 Billion Euros For Sport Development If Bid Succeeds

In Feb 2025, Tether announced a minority stake purchase of 8.2% in Juventus FC. The stablecoin issuer described this acquisition as a strategic move to integrate stablecoins and digital assets into everyday life. Two months later, Tether would boost its holdings to 10%, as the company’s CEO and lifetime Juventus supporter, Paolo Ardoino, explained the move as a commitment to long-term innovation. 

Taking this step further, the USDT operator has submitted an audacious bid to acquire the entire 65.4% controlling stake of the football club from Exor, the listed holding company of the billionaire Italian Agnelli Family. For context, Juventus FC ranks as the third-largest Italian club with a market valuation of $1.87 billion. However, the Old Lady, as it is popularly called, is the most decorated in the land, boasting 71 major honors, which include 36 Serie A championships. 

While Juventus’ momentum has slowed down in recent years, with its last league-winning campaign coming in 2020, the Italian giant has remained relevant by securing three domestic cup trophies since then. Paolo Ardoino explains that Tether’s objective is to contribute to Juventus’ growth and drive exceptional performance.

The Tether CEO said: 

Tether is in a position of strong financial health and intends to support Juventus with stable capital and a long horizon. Our goal is to make a positive contribution to the club’s future, support its sporting performance at the highest level, and help Juventus continue to grow sustainably in a rapidly evolving global sports and media landscape.

To this end, Tether has promised to invest 1 billion Euros in the club if the transaction receives approval from relevant regulatory bodies. However, footballing media The Athletic has reported that sources close to Exor state the Agnelli Family has no intent to divest their stake in Juventus, with the message being “the club is not for sale.”

Notably, Juventus represents one of Tether’s investments, which also includes the Italian media company Be Water and the Canadian video platform Rumble.

USDT Market Overview

At the time of writing, USDT’s total market cap is valued at $186.24 billion, ranking as the largest stablecoin and third-largest cryptocurrency in the world.

Tether

Bitcoin Faces Immediate Key Levels At $76,000 And $99,000 — What Comes Next?

Bitcoin’s bearish momentum has since reached a cool-off state, as price maintains above the last swing low established late November. However, although there has been a steady uptrend, signs of a bullish reversal remain weak. Interestingly, a recent evaluation has been published, which delves into the factors that may affect Bitcoin’s next major move.

Analyst Points To Key Support, Resistance Zones Using MVRV Metric

In an X post released on December 12, market analyst Ali Martinez shares that Bitcoin’s next significant move depends on how the price acts around a set of identified critical levels using data from the MVRV Extreme Deviation Pricing Bands. For context, this metric is used to identify when Bitcoin is undervalued or overvalued, with past activity around certain levels being a defining factor. It serves this function by comparing Bitcoin’s market price to its Realized Price and plotting extreme levels of likely deviation, such as ±0.5 and ±1.0, around the realized price.

From the chart below, $99,000 stands in correspondence to the +0.5 standard deviation band. This price level has historically functioned as a local top, especially in resistance against short-term bullish momentum. This happens because there is an increase in profit-taking among sellers, as they are prone to exiting in the presence of any real opposition.  Interestingly, a significant break above this $99,000 resistance level could be a sign of awakening bullish interest, potentially causing the inflow of bullish momentum upon its retest.

Bitcoin

On the flipside, the most immediate support zone is seen to lie around the $76,000 price. Notably, this region corresponds to the –0.5 deviation band, suggesting that it is a price level where Bitcoin would become undervalued if reached.

Past market cycles also reveal that pullbacks into this price region have often preceded increased upward momentum, owing to the ‘buy-the-dip’ mentality that must have prevailed. Expectedly, a slip beneath this key support zone would be a result of intensified sell pressure within the market. When this development occurs, the Bitcoin price could see an even deeper correction towards the south side of the price.

Metric Suggests $122,000 And $53,000 Are Next Crucial Zones To Watch

Notably, Bitcoin is expected to face another battle in the scenario where it breaks above the $99,000 resistance. Readings from the metric reveal that the +1 standard deviation band stands roughly at $122,000. Bullish rallies have often reached this price region, with significant resistance met to send prices sharply downwards. A break above the +1.0 deviation could therefore precede the formation of a new all-time-high price.

Also, the –1.0 deviation stands at the $53,000 price level. If the –0.5 deviation were to fail, the Bitcoin price could begin a bearish cycle towards $53,000, as it stands as the next significant support. This is so because it has historically functioned as a strong accumulation zone, where a bit of sideways movement was seen before major price expansions followed. At press time, Bitcoin stands at approximately $90,400, with a loss of %1.24 recorded since the last day, per CoinMarketCap data.

Bitcoin

Bitcoin Bullish Structure Weakens As Inter-Exchange Liquidity Touches Red Zone – Details

The Bitcoin market is experiencing a gradual trend reversal following weeks of prolonged price correction between October and November. However, recent on-chain data reveals a concerning trend around BTC’s bullish structure.

Bitcoin IFP Indicator Suggests Market Has Reached Turning Point 

Popular analytics page Arab Chain has shared a cautionary insight on the Bitcoin market despite the moderate price recovery in recent weeks. After Bitcoin suffered a 36.5% correction from its all-time high at $126,000, the market leader has lately experienced a significant rebound, rising from $80,000 to as high as $94,000 in the past three weeks. 

However, data from the Bitcoin Inter-Exchange Flow Pulse (IFP) suggests the upward price momentum might be short-lived. For perspective, the Bitcoin IFP measures the net movement of Bitcoin between exchanges over a given period. Arab Chain explains the IFP indicator continues to trend downward, after breaking below its 90-day moving average (MA), suggesting a weakening market participation amid fewer “bullish” flows between exchanges.

Furthermore, the IFP also sits in the red zone, which historically coincides with or precedes a correction period or weak structural momentum that could precede a broader downtrend. Combined, these developments imply the Bitcoin market is at a critical junction, as there is a reduction in exchange flows that has historically supported the price rallies in past market phases.

Bitcoin

Is The Bullish Run Over?

Amidst the structural weakness highlighted by the IFP indicator, Arab Chain also noted that the price remains relatively high compared to previous levels in similar situations. The analysts explain that this suggests price and inflows are temporarily moving irrespective of each other. Based on historical data, such detachments usually indicate a prolonged price consolidation or a significant period of extended sideways movement until inter-exchange flows can reestablish market dominance. 

Therefore, the Bitcoin bullish structure is not collapsing into a bearish state. However, the IFP metric developments suggest there may not be sustained upward movement in the short term due to the structural slowdown in inter-exchange flows. Moreover, price is likely to become sensitive to changes in the market liquidity. Therefore, there is also significant potential for another correction.

At press time, Bitcoin trades at $90,338, reflecting a 1.82% decline in the past 24 hours. Meanwhile, daily trading volume is up by 34.64% and valued at $82.68 billion. According to Arab Chain, a continuous price rebound will only occur if the IFP successfully reclaims its 90-day MA, thereby signaling an increase in bullish exchange flows.

Bitcoin

Altcoin Rally Alert: 4 Bullish Signals To Watch Out For – Analyst

Prominent market analyst Michael Van de Poppe has shared four market conditions that would confirm an altcoin market rally. Meanwhile, the cryptocurrency market continues to experience a widespread correction, weighing down the price growth of several assets.

Ethereum Outperforms Bitcoin: A Positive Sign For Altcoins?

Ethereum has shown more resilience in the last month than Bitcoin, which is largely interpreted as a bullish signal for altcoin enthusiasts. In the last week alone, the prominent altcoin reported a slight market gain of 0.86% compared to Bitcoin’s loss of 1.95%. When Ethereum outperforms Bitcoin, it encourages increased altcoin activity, as investor confidence spreads beyond the market leader into the broader crypto ecosystem.

However, a full altcoin market takeover only comes into effect after the following technical developments. Firstly, de Poppe explains that Bitcoin, as the market leader, must achieve a breakthrough above $92,000 resistance, potentially testing the $100,000 mark, to signal renewed market strength. Additionally, the analyst states the ETH/BTC ratio must stay above its 20-day moving average (MA), indicating Ethereum’s continued dominance and further encouraging altcoin accumulation. Together, these signals could set the technical bedrock for a significant altcoin rally.

Macro Factors Could Amplify Altcoin Gains

Beyond crypto-specific indicators, de Poppe also touches on broader financial market plays that could initiate the next altcoin move. The analyst suggests that a 5-10% correction in gold prices, coupled with a peak in silver, could encourage capital to flow into riskier assets like cryptocurrencies including cryptocurrencies. 

Meanwhile, a strong upward movement in the Nasdaq would indicate increased investor risk appetite, a development that often translates into heightened activity in the crypto markets. When combined with positive momentum in Bitcoin and Ethereum, these macro signals could create an environment ripe for a substantial altcoin rally. According to de Poppe, the fulfillment of these conditions indicates that altcoins could achieve market gains of 200%-300% in the present market cycle.

Market Overview

At the time of writing, the total cryptocurrency market is valued at $3.04 trillion, following a significant 15.5% decline over the past month. Meanwhile, the altcoin market cap stands at $1.26 trillion, accounting for 41.44% of all circulating digital assets. In tandem, data from CoinMarketCap shows the altseason index at 20/100, as Bitcoin still maintains a dominant grip on overall market performance, with a 58.6% dominance.

In short, the conditions for a full-scale altcoin breakout have yet to materialize,  but the key indicators highlighted above suggest that scenario may be approaching if momentum shifts decisively toward risk assets.

altcoin

Coinbase Premium Turns Critical — Analyst Highlights What It Signals For Bitcoin

The Bitcoin price continues its descent deep into red territory, as investors increasingly tread the capitulation path. Interestingly, a recent on-chain analysis has been carried out, which dives into the underlying factors that typically control Bitcoin’s December price action.

Coinbase Premium Suddenly Flips Into Negative Territory: Why This Is Important

In a QuickTake post on the CryptoQuant platform, crypto education institution XWIN Research Japan reported that the Coinbase Premium Index metric has recently seen a sharp nosedive. For context, this metric measures the price difference between Bitcoin on the Coinbase (USD) market and Bitcoin on other major global exchanges (such as Binance), or the USDT market. By doing so, it reflects the buying or selling biases of US investors and helps derive insights regarding their behavior.

According to the crypto research institute, the decline started around the late period of November, into early December. Because this decline correlates with an also sharp fall in the Bitcoin price, the apparent sentiment shift among investors from the US appears to be the source of the bearish pressure seen early in the month.


Bitcoin

Interestingly, there are historical events that parallel the aforementioned scenario. Typically, December witnesses weaker readings from the Premium when compared to its performance throughout the year. The readings are often near or below zero “largely due to year-end rebalancing and tax-loss harvesting by US institutions and individuals,” XWIN Research highlights.

However, there have been slight deviations from this recurrent pattern. In 2018 and 2022, the Premium saw deep dives into negative zones, as the market was under significant stress in these periods. On another hand, 2020 and 2023 saw positive readings from the Premium, positively correlating with the ongoing bull-market momentum at the time.

‘December 2025 Appears To Be Unique’ — Research Group

XWIN Research Japan, however, made it worthy of note that this year’s scenario has its own “unique twist.” Notably, although the Coinbase Premium began in December with a negative, it has refused to maintain this state. Instead, the analytics platform reports that there was an almost immediate rebound not just into neutral levels, but back into positive territory. 

Because this sharp reversal took place within just a few days, it becomes apparent that the Bitcoin market may have seen the last strengths of extant bearish pressure. Interestingly, historical data reveal that such moves as the market has seen often precede price stabilization, or even short-term recoveries. Thus, if history is anything to go by, the Bitcoin price could be close to a local bottom, after which its recovery might follow.

Ultimately, XWIN Research points out that the stabilization, or sustained downturn, of the Bitcoin price depends mostly on “upcoming US capital flows, derivatives positioning, and premium trends.” At press time, Bitcoin holds a valuation of $89,321, with no significant movement since the past day.

Coinbase

Bitcoin Market Records 21% Crash In November Trading Volume – What This Means For Price

Bitcoin’s (BTC) ongoing price correction has been accompanied by several other negative developments that continue to grab investors’ attention. Most recently, market analyst Darkfost has observed a significant crash in Bitcoin spot trading volume, while highlighting potential long-term implications of such an event.

Binance Records $40B Loss In BTC Monthly Spot Trading 

The spot trading volume refers to the total amount of Bitcoin that is bought and sold for immediate delivery on exchanges within a specific time period. It is a key market indicator used to gauge participation, liquidity, and investor interest. According to Darkfost in an X post on December 6, the Bitcoin market, in November, experienced a major fall in spot trading volume across major crypto exchanges. This development has been attributed to the asset’s price struggles, wherein it recorded a 17.5% devaluation during this period.

On Binance, which accounts for more than half of all Bitcoin spot trading activity, spot volume fell from $198 billion in October to $156 billion in November, representing a 21% decline. The downturn was mirrored across other major exchanges, with ByBit posting a 13.5% drop, Gate.io sliding 33%, and OKX down 18%.


Bitcoin

Interestingly, Darkfost explains that Bitcoin’s recent price action, the major negative catalyst, pales in comparison to previous corrections. However, another red reading in December could initiate a market deterioration marked by conditions such as continued selling pressure, low market confidence, and, importantly, further drops in spot activity.

A continuous decline in spot trading volume primarily mirrors a lack of market interest and is accompanied by other concerning factors, such as a weaker demand, high vulnerability to price swings, and limited support for rallies as investors prefer to sit on the sidelines. This dynamic, in turn, weighs on price growth, creating a self-reinforcing bearish loop.

Spot Trading Volume Peak Sees Consistent Regression 

In related news, Darkfost also reports that the present market cycle has featured a consistent decline in spot trading volume peaks. Notably, the chart above shows a market high of $333.57 billion on Binance in March 2024, followed by the lower peak of $246.04 billion in November 2024, and then just $198.6 billion last October.

This trend becomes even more concerning when looking at the spot-to-futures volume ratio, which currently sits at 0.23, meaning futures activity now accounts for more than 75% of overall trading. In essence, while the Bitcoin market remains active, investor enthusiasm on the spot side is fading. By contrast, traders appear increasingly willing to speculate in the futures market, likely driven by elevated uncertainty and short-term volatility.

At press time, Bitcoin trades at $89,300, reflecting a 0.21% loss in the past day.

Bitcoin

Western Union To Launch Stablecoin Cards For Hyper Inflationary Economies – Details

American multinational financial services company Western Union has unveiled a stablecoin strategy to expand its digital business and cross-border remittances. In particular, the money transfer firm is looking to launch a stablecoin card service targeted at nations with high inflation rates.

Western Union Stablecoin Agenda

Matthew Cagwin, chief financial officer and executive vice-president at Western Union, has shared various ideas the financial service giant holds around the adoption and potential offerings of stablecoins. These revelations were made in a presentation at the UBS Global Technology and AI conference on December 2, 2025. 

Notably, Cagwin acknowledges that Western Union views stablecoins as a significant opportunity to free the company’s cash flow for other purposes. Due to the instantaneous and predictable nature of these cryptocurrencies, the executive outlines a business model in which Western Union can settle transactions immediately, without needing to hold hundreds of millions of dollars for liquidity, as is typical in the traditional financial system.

Notably, Western Union also aims to offer a “stable card”, modeled on the prepaid card in the US but targeted at users in nations with high inflationary pressure. Cagwin explained the need for this product, referencing Argentina as an example. 

The CFO said:

… If you’re — I have a big workforce in Argentina. Can you imagine living in a country where last year, your inflation was 250%, 300%. We gave our employees 4 raises last year because if you didn’t, they made — they couldn’t afford their bills. So imagine a world where your family in the U.S. is sending you $500 home, but by the time you spend it in the next month, it’s only worth $300. So we can see a good utility for our stable card there,…

Cagwin also explains Western Union’s ongoing efforts to establish a digital asset network (DAN). Notably, the financial services firm has established partnerships with four service providers with the intent to offer on-ramp and off-ramp services to users from H1 2026, using the yellow wallets and agents, such as a big box store or check casher.

Western Union Eyes Stablecoin Launch

In addition to the stable card, Cagwin states that Western Union plans to launch a stablecoin, which they believe will scale easily, considering their present business network. In opting against onboarding existing stablecoins, Cagwin explains the firm’s goal of maintaining end-to-end of the proposed coin’s use, economics, and distribution operation.

At press time, the total crypto market cap is valued at $3.05 trillion, after a 0.37% gain in the last day. Meanwhile, total stablecoins are valued at $317.63 billion, representing 10% of circulating digital assets.

Western Union

$3.4 Billion In Bitcoin Options Expires, Triggering Market Squeeze — Details

Bitcoin’s price action has been grossly dramatic throughout the year. After reaching its current all-time-high price of $126,000 in early October, the world’s leading cryptocurrency saw a rapid flip to the downside. Since reaching its October high, Bitcoin spiraled to as low as $80,500, a more than 15% negative deviation in reviewing year on year growth. 

As the market sentiment thus ostensibly leans bearish, an on-chain analysis has recently been published, proffering reasons to believe that the negative sentiment among investors could be growing stronger.

$91,000 Max Pain Point Breached After Friday Options Expiry

In a QuickTake post on CryptoQuant, crypto pundit GugaOnChain brings to light the expiry of about $3.4 billion in Bitcoin options. This expiration event, which took place on Friday, 5th December, is one that typically triggers a “gravitational force” which attracts price to itself. By extension, price tends to move towards a specific price level referred to as the Maximum Pain Point, where option buyers incur the greatest losses, and sellers realize the most profits.

CryptoQuant

In this scenario, the Maximum Pain Point stood at approximately $91,000. As such, the Bitcoin price saw a rapid decline towards this mark. However, by the end of the session, Bitcoin had already slipped beneath its “gravitational force,” reaching as low as $89,500, and entering a range that amplified its buyers’ losses, while also maximizing its sellers’ (market makers) gains.

Negative Funding Rate Further Strengthens Bearish Narrative

GugaOnChain also references readings from the Bitcoin: Funding Rates metric, which tracks the average funding rate across all major perpetual futures exchanges. As the analyst explains, this metric is useful in reading the prevalent market sentiment. For example, negative Funding Rates, such as the current reading of -0.001206, typically indicate the willingness of short traders to pay the longs for their positions. As such, it is evident that the market sentiment is more bearish than bullish.

There appears to be an alignment between the negative funding rates and the sell pressure supplied by the $3.4 billion expired options and breach of the $91,000 Maximum Pain Point. GugaOnChain explains that such a correlation further strengthens the narrative that the Bitcoin market could see an additional significant drop in its price.

While the long-term market direction may be well-defined, its short-term sentiment, however, reflects a more modest stance of utmost caution.  As of press time, Bitcoin is valued at about $89,250. Over the past 24 hours, the premier cryptocurrency has lost approximately 3.38% of its value, per CoinMarketCap data.

Bitcoin

Featured image from Shutterstock, chart from Tradingview

Crypto Regulation: European Commission Proposes Single Oversight Regime

The European Commission has moved to allocate the supervision of crypto companies and their activities under the sole jurisdiction of the European Securities and Markets Authority (ESMA).  This move will end the application of different regulatory styles in several member states operating under the EU’s Markets in Crypto-Assets regulation (MiCA).

ESMA’s Single Crypto Authority To Boost Competitiveness, Innovation – EC

In a Thursday announcement, the European Commission, the executive arm of the European Union (EU), rolled out a series of regulatory measures aimed at creating a singular financial service market. This initiative centers around creating a competitive, innovative, and efficient financial system that offers EU citizens better options for wealth growth and business financing. 

A statement from the announcement read: 

Deeper integration of financial markets is not an end, but a means to create a single market for financial services greater than the sum of its national parts. Simplified access to capital markets reduces costs and makes the markets more appealing for investors and companies across all Member States, irrespective of size.

In particular, the EC’s new regulatory package will move the oversight of Crypto-Asset Service Providers (CASPs), among other groups of businesses to under the sole authority of the ESMA. Interestingly, the EC’s recent move comes just three months after the French, Austrian, and Italian market authorities pushed for a stronger European framework for cryptocurrencies, citing major differences in each national implementation of the MiCA regulations. 

Presently, crypto regulation across the 27 EU member states operates under MiCA, resulting in a patchwork of national approaches which the EC claims is hindering competition and effective cross-border operations. The ESMA’s singular regime aims to eliminate these discrepancies in order to provide a better integrated EU financial market. 

The EC said:

Improvements to the supervisory framework are closely linked to the removal of regulatory barriers. The package aims to address inconsistencies and complexities from fragmented national supervisory approaches, making supervision more effective and conducive to cross-border activities, while being responsive to emerging risks. 

Alongside the new singular regime, the European Commission has also expressed plans to create a friendly environment for the adoption of distributed ledger technology, e.g, blockchains, to spur innovations in the financial sector. However, all these regulatory changes still remain subject to negotiation and approval by the  European Parliament and European Council.

Crypto Market Overview

At the time of writing, the total crypto market cap is valued at $3.04 trillion, following a slight 0.25% loss in the past day. Meanwhile, total trading volume is valued at $135.47 billion.

crypto

Bitcoin Settles In Consolidation Zone – Levels To Watch

Bitcoin (BTC) trades just below $90,000 after a fluctuating week of price action resulted in a net loss of 1.8%. Despite initial hopes of a resurgence in late November, the premier cryptocurrency is now 29.16% away from its all-time high. Going by the price action, popular analyst with the X username PlanD postulates BTC is now in consolidation guided by two major price levels.

Bitcoin Moves In Key Range Between $85,000-$93,000, Market Breakout Awaits

In an X post on December 5, PlanD provides an update on a continued analysis of the Bitcoin market, stating the crypto market leader appears to be building momentum within a set price range. Notably, recent price action has pushed the flagship cryptocurrency below the lower boundary of a broadening ascending channel between $93,000 and $131,000, raising fears of a bear market. However, Bitcoin has repeatedly rebounded, forming a strong consolidation range between $85,400 and $93,000. PlanD defines the present market condition as Bitcoin being in a decision zone and needing a price breakout to determine its next major direction. The analyst states that if Bitcoin moves to overcome the price resistance at $93,000, its initial price target lies at $100,000. A successful reclaim of this psychological six-figure level would confirm renewed bullish intent and stronger potential for a full market revival.

Bitcoin

On the other hand, if Bitcoin breaks below the vital support zone at $85,300, investors should expect steeper losses. In this case, PlanD projects a price drop to around $72,000, representing a potential 19% decline from present market prices. Notably, considering the recent market volatility, the ongoing consolidation may close out sooner than expected, to establish a clear market direction.

Bitcoin Price Overview

According to data from CoinMarketCap, Bitcoin trades at $89,703, reflecting a price loss of 2.99%. Meanwhile, the daily trading volume is up by 4.56% and valued at $63.16 billion.

Following the turbulent price action of the last week, BTC’s price struggles in Q4 continue against previous popular predictions. Still, several bullish indicators could support a rebound before year-end. Key catalysts include a widely anticipated interest rate cut at the upcoming Federal Open Market Committee (FOMC) meeting on December 9–10.

In addition, market sentiment is benefiting from speculation that pro-crypto economist Kevin Hassett could succeed Jerome Powell as Federal Reserve Chair in 2026.

Bitcoin

Bitcoin Bull Season Hinges On Key $82,150 Level – Here’s Why

The Bitcoin market continues to experience high levels of investor uncertainty, as indicated by the unstable price action of the past week. In the last month alone, the leading cryptocurrency has lost about 14% of its value, strengthening fears of an impending bear market. Notably, renowned market expert Ali Martinez has shared some insight on this speculation, highlighting a key technical development that historically precedes an extended downtrend.

Bitcoin Winter Phase To Start Only When Price Loses 730-Day SMA – Analyst 

In an X post on Friday, Martinez presents an on-chain analysis that identifies a key price zone for determining Bitcoin’s price trajectory amid current market volatility. Using data from the Bitcoin Investor Tool metric from Glassnode, the analyst has discovered that extended downtrends in Bitcoin often start once the price falls below its 730-day Simple Moving Average (SMA), a level currently sitting at $82,150. For context, the chart below shows that the 730-day SMA (green), an important long-term indicator, has historically acted as a structural support level during major market cycles. When Bitcoin decisively loses this line, momentum tends to shift, leading to deeper corrections and lengthier bearish periods as seen between 2015-2016, 2019, and 2022-2023.

Bitcoin

However, the chart also presents some bullish insights. Larger cyclical metrics, including the 730-day SMA × 5 band (pink) sitting at $410,771, remain well above the current price, indicating that macro overvaluation is not yet a concern, as the leading cryptocurrency remains far from an overheated zone. According to Ali Martinez, as long as Bitcoin holds above $82,150, the potential for any prolonged downtrend synonymous with a bear market remains minimal, ensuring the bull structure remains intact.

Bitcoin Weekly Net Outflows Hit $800M As Accumulation Rises

In other developments, on-chain analytics firm Sentora reports that the Bitcoin market recorded an $805 million increase in weekly exchange net outflows, indicating that a significant portion of market investors are unfazed by the recent price correction. Instead, they are opting to transfer more of their investment off crypto exchanges, suggesting an intention to hold in anticipation of future price appreciation. Meanwhile, total Bitcoin network fees reached $1.96 million, representing a 7.69% gain from the previous week and indicating an increase in transactions and network activity during this period. At the time of writing, Bitcoin trades at $89,693 following a 2.71% price decline in the last 24 hours.

Bitcoin

❌