❌

Reading view

There are new articles available, click to refresh the page.

Dogecoin (DOGE) Under Heavy Pressureβ€”Is a Bottom in Sight?

Dogecoin started a fresh decline below the $0.1320 zone against the US Dollar. DOGE is now consolidating losses and might face hurdles near $0.1350.

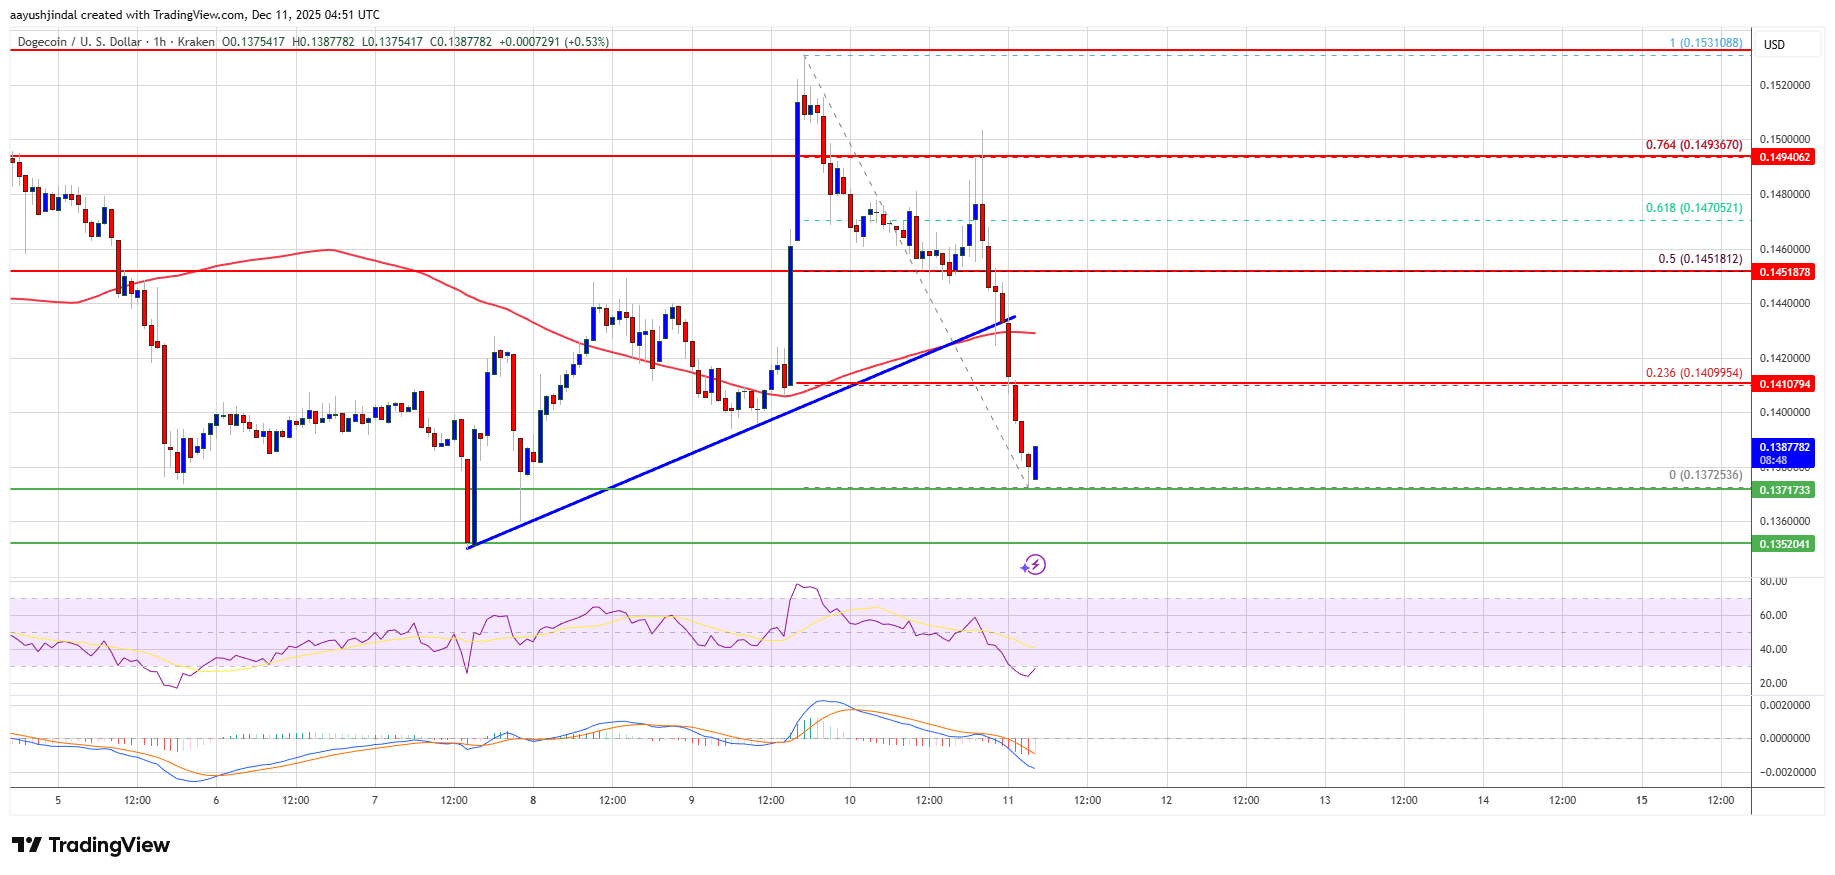
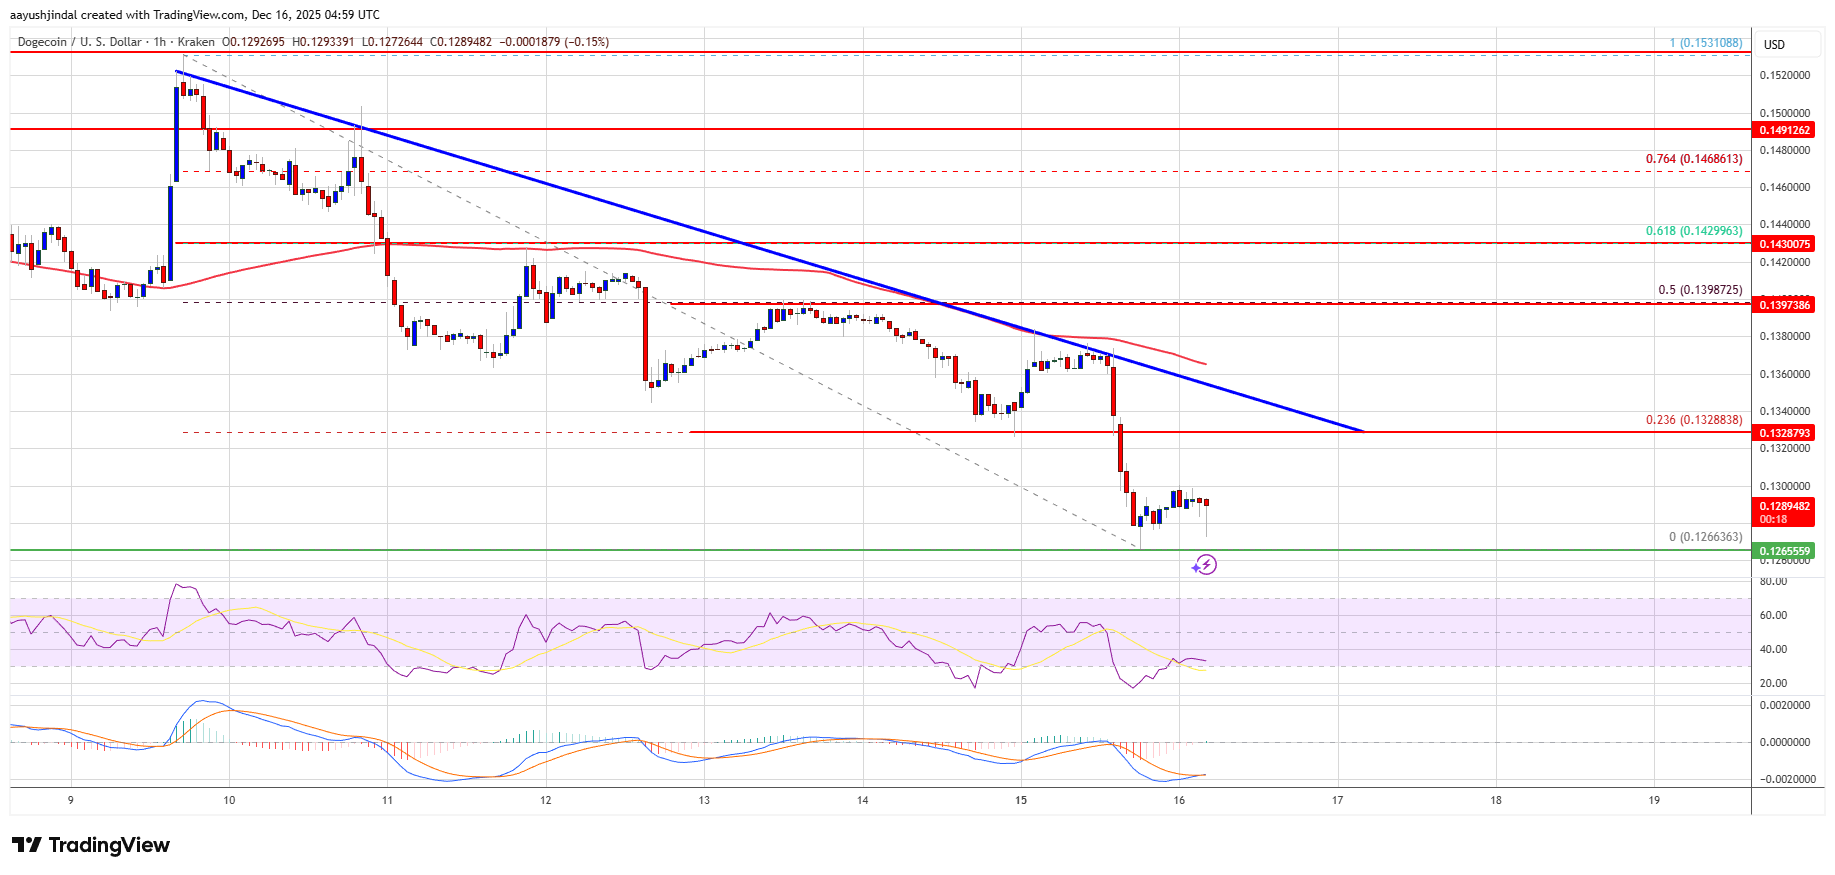
  • DOGE price started a fresh decline below the $0.1320 level.
  • The price is trading below the $0.1300 level and the 100-hourly simple moving average.
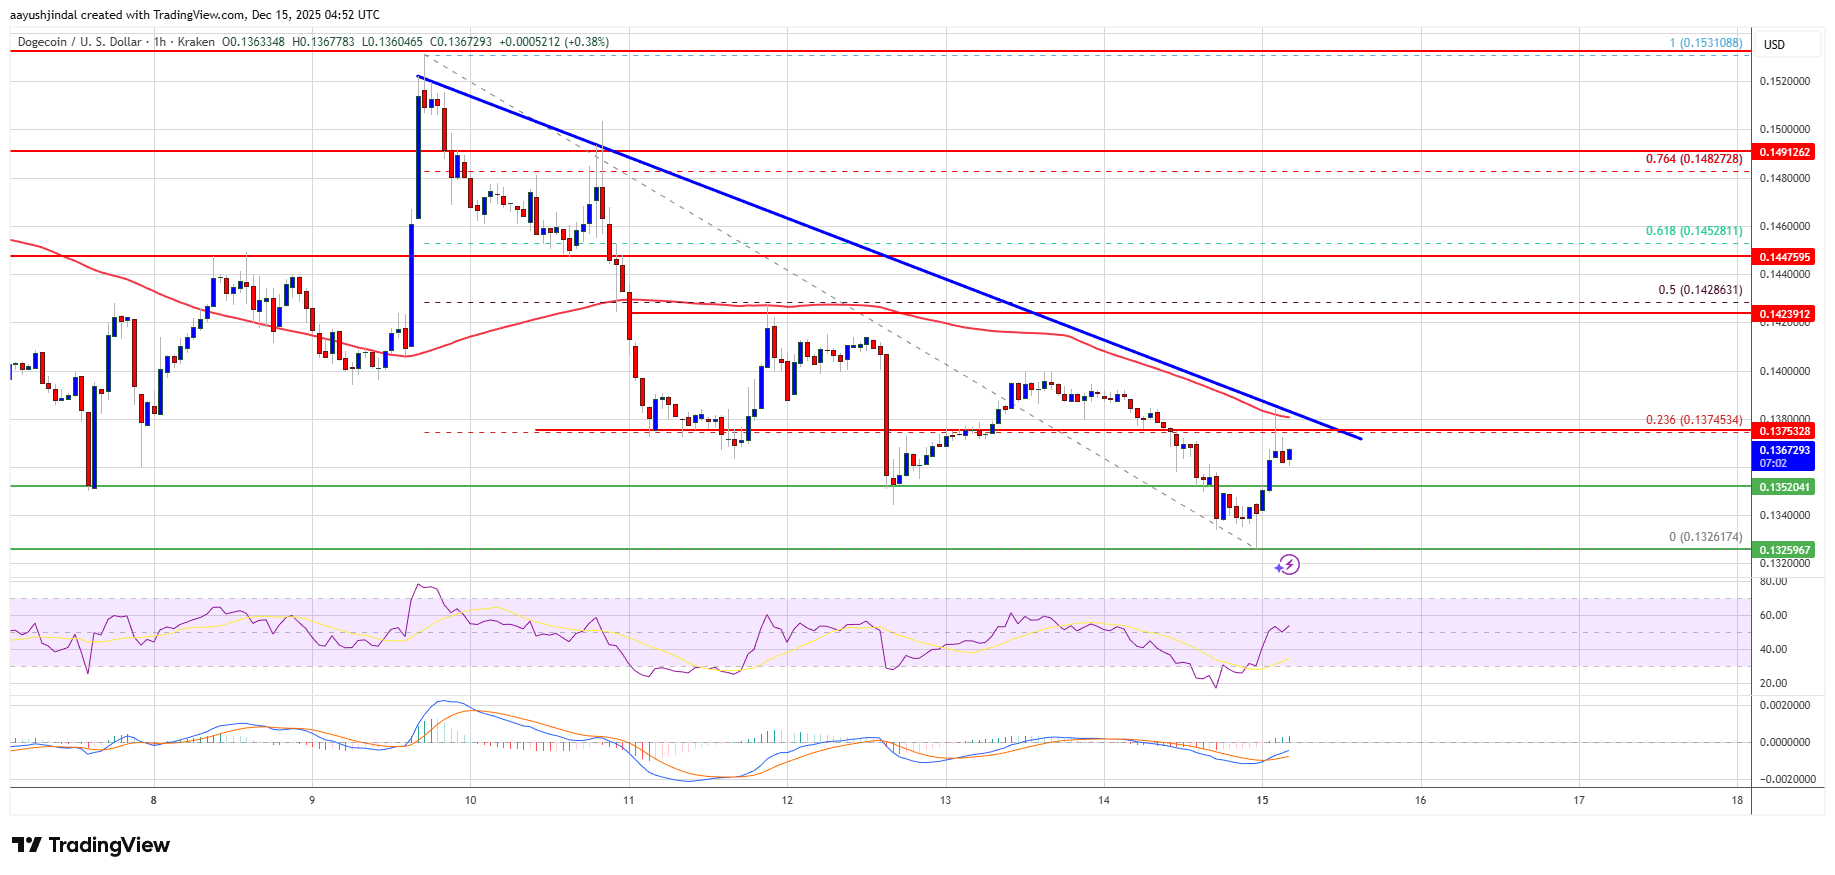
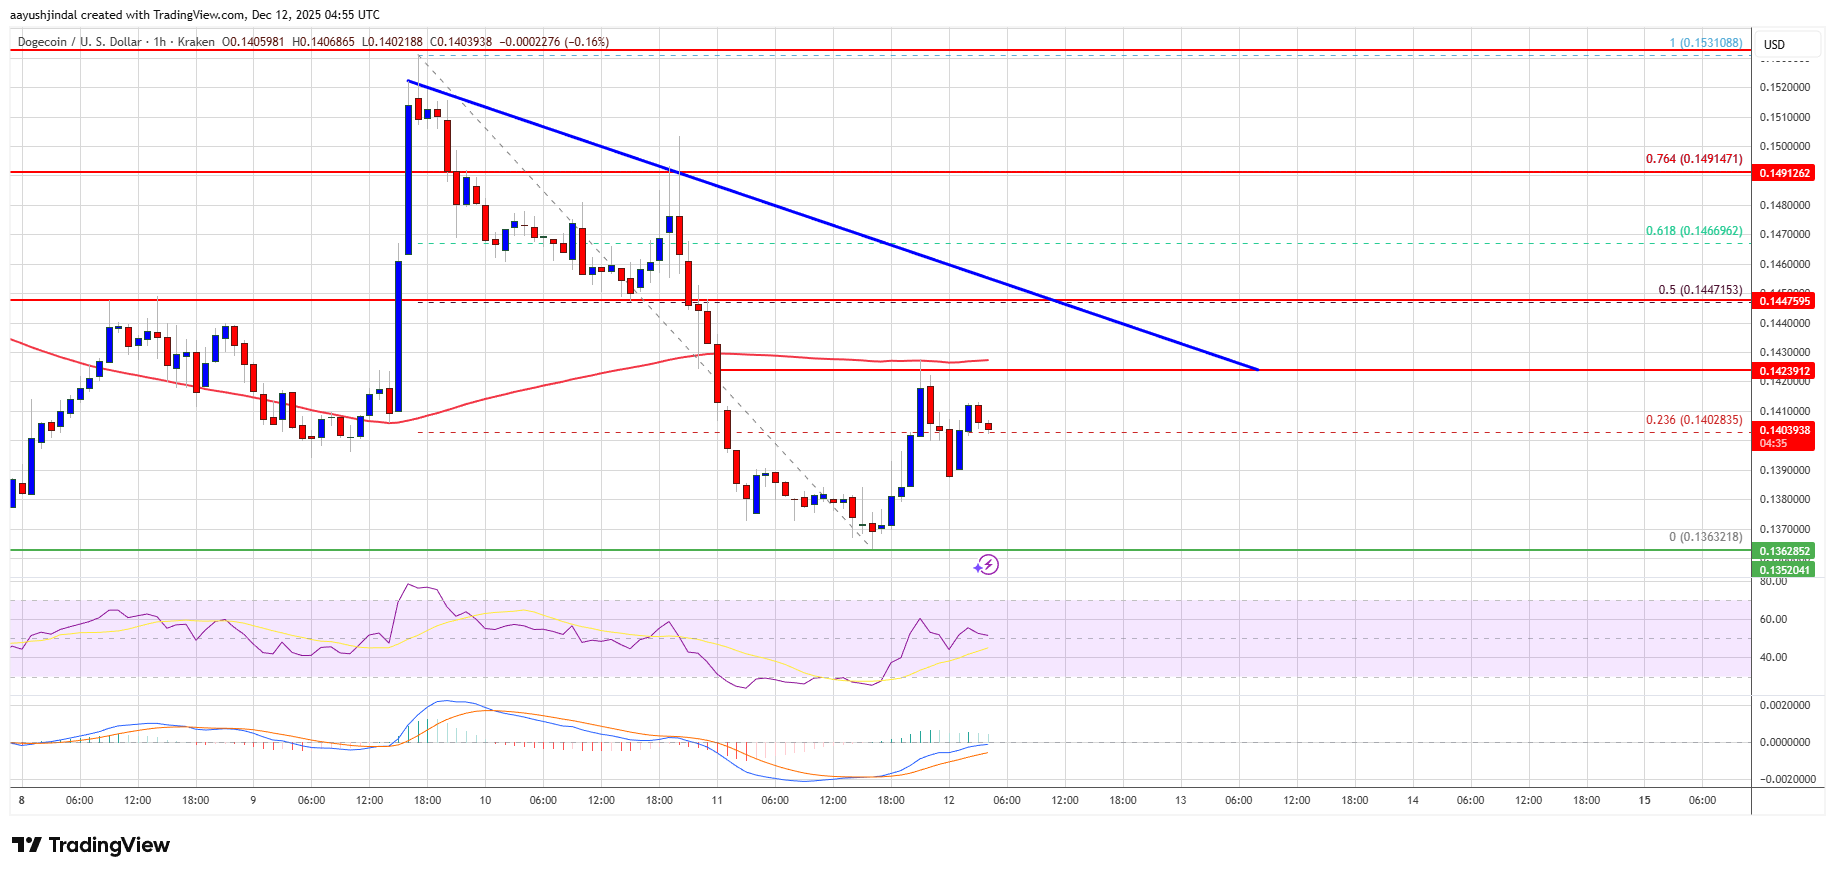
  • There is a key bearish trend line forming with resistance at $0.1340 on the hourly chart of the DOGE/USD pair (data source from Kraken).
  • The price could extend losses if it stays below $0.1340 and $0.1350.

Dogecoin Price Dips Again

Dogecoin price started a fresh decline after it closed below $0.1380, like Bitcoin and Ethereum. DOGE declined below the $0.1350 and $0.1340 support levels.

The price even traded below $0.130. A low was formed near $0.1266, and the price is now showing bearish signs. It is consolidating below the 23.6% Fib retracement level of the downward move from the $0.1530 swing high to the $0.1266 low.

Dogecoin price is now trading below the $0.1300 level and the 100-hourly simple moving average. If there is a recovery wave, immediate resistance on the upside is near the $0.1325 level. The first major resistance for the bulls could be near the $0.1340 level. There is also a key bearish trend line forming with resistance at $0.1340 on the hourly chart of the DOGE/USD pair.

Dogecoin Price

The next major resistance is near the $0.1400 level and the 50% Fib retracement level of the downward move from the $0.1530 swing high to the $0.1266 low. A close above the $0.1400 resistance might send the price toward the $0.1450 resistance. Any more gains might send the price toward the $0.1500 level. The next major stop for the bulls might be $0.1550.

More Losses In DOGE?

If DOGE’s price fails to climb above the $0.1350 level, it could continue to move down. Initial support on the downside is near the $0.1280 level. The next major support is near the $0.1250 level.

The main support sits at $0.120. If there is a downside break below the $0.120 support, the price could decline further. In the stated case, the price might slide toward the $0.1050 level or even $0.10 in the near term.

Technical Indicators

Hourly MACD – The MACD for DOGE/USD is now gaining momentum in the bearish zone.

Hourly RSI (Relative Strength Index) – The RSI for DOGE/USD is now above the 50 level.

Major Support Levels – $0.1280 and $0.1250.

Major Resistance Levels – $0.1340 and $0.1350.

XRP Price Suffers Sharp 5% Dropβ€”Is More Pain Ahead?

XRP price started a fresh decline below $1.950. The price is now struggling and faces resistance near the $1.920 resistance level.

  • XRP price started a fresh decline below the $1.950 zone.
  • The price is now trading below $1.90 and the 100-hourly Simple Moving Average.
  • There is a bearish trend line forming with resistance at $1.980 on the hourly chart of the XRP/USD pair (data source from Kraken).
  • The pair could continue to move down if it settles below $1.850.

XRP Price Dips Again

XRP price attempted a recovery wave above $2.020 but failed to continue higher, like Bitcoin and Ethereum. The price started a fresh decline below $2.00 and $1.950.

There was a move below the $1.920 support level. A low was formed at $1.8550, and the price is now showing bearish signs below the 23.6% Fib retracement level of the downward move from the $2.047 swing high to the $1.8550 low.

The price is now trading below $1.90 and the 100-hourly Simple Moving Average. There is also a bearish trend line forming with resistance at $1.980 on the hourly chart of the XRP/USD pair.

If there is a fresh upward move, the price might face resistance near the $1.90 level. The first major resistance is near the $1.920 level. A close above $1.920 could send the price to $1.950 or the 50% Fib retracement level of the downward move from the $2.047 swing high to the $1.8550 low.

XRP Price

The next hurdle sits at $1.980 and the trend line. A clear move above the $1.980 resistance might send the price toward the $2.050 resistance. Any more gains might send the price toward the $2.120 resistance. The next major hurdle for the bulls might be near $2.150.

More Losses?

If XRP fails to clear the $1.90 resistance zone, it could start a fresh decline. Initial support on the downside is near the $1.8550 level. The next major support is near the $1.820 level.

If there is a downside break and a close below the $1.820 level, the price might continue to decline toward $1.7650. The next major support sits near the $1.7320 zone, below which the price could continue lower toward $1.7050.

Technical Indicators

Hourly MACD – The MACD for XRP/USD is now gaining pace in the bearish zone.

Hourly RSI (Relative Strength Index) – The RSI for XRP/USD is now below the 50 level.

Major Support Levels – $1.850 and $1.820.

Major Resistance Levels – $1.950 and $1.980.

Ethereum Price Sinks Under $3Kβ€”Is Volatility About to Explode?

Ethereum price started a fresh decline below $3,000. ETH is now consolidating and might soon aim to start a recovery wave above $2,980.

  • Ethereum started a fresh decline from the $3,175 zone.
  • The price is trading below $3,000 and the 100-hourly Simple Moving Average.
  • There is a connecting bearish trend line forming with resistance at $3,120 on the hourly chart of ETH/USD (data feed via Kraken).
  • The pair could continue to move down if it settles below the $2,920 zone.

Ethereum Price Dips 5%

Ethereum price failed to stay above $3,150 and started a fresh decline, like Bitcoin. ETH price dipped below $3,120 and $3,050 to enter a bearish zone.

The bears even pushed the price below $3,000. A low was formed at $2,916 and the price is now consolidating losses below the 23.6% Fib retracement level of the downward move from the $3,175 swing high to the $2,916 low.

Ethereum price is now trading below $3,000 and the 100-hourly Simple Moving Average. Besides, there is a connecting bearish trend line forming with resistance at $3,120 on the hourly chart of ETH/USD.

Ethereum Price

If there is another upward move, the price could face resistance near the $2,980 level. The next key resistance is near the $3,050 level and the 50% Fib retracement level of the downward move from the $3,175 swing high to the $2,916 low. The first major resistance is near the $3,080 level. A clear move above the $3,080 resistance might send the price toward the $3,120 resistance. An upside break above the $3,120 region might call for more gains in the coming days. In the stated case, Ether could rise toward the $3,175 resistance zone or even $3,200 in the near term.

More Losses In ETH?

If Ethereum fails to clear the $2,980 resistance, it could start a fresh decline. Initial support on the downside is near the $2,950 level. The first major support sits near the $2,920 zone.

A clear move below the $2,920 support might push the price toward the $2,880 support. Any more losses might send the price toward the $2,840 region. The next key support sits at $2,800.

Technical Indicators

Hourly MACD – The MACD for ETH/USD is gaining momentum in the bearish zone.

Hourly RSI – The RSI for ETH/USD is now below the 50 zone.

Major Support Level – $2,920

Major Resistance Level – $3,080

Bitcoin Price Drops 5%β€”Is the Downtrend Back in Control?

Bitcoin price corrected gains and traded below the $88,000 support zone. BTC is now consolidating and might struggle to clear the $88,500 zone.

  • Bitcoin started a fresh decline from the $90,500 zone.
  • The price is trading below $88,000 and the 100 hourly Simple moving average.
  • There is a bearish trend line forming with resistance at $89,000 on the hourly chart of the BTC/USD pair (data feed from Kraken).
  • The pair might continue to move up if it settles above the $85,000 zone.

Bitcoin Price Dips Further

Bitcoin price failed to gain strength for a move above the $90,000 and $90,500 levels. BTC started a fresh decline and traded below the $88,500 support.

The price even spiked below the $87,000 support. However, the bulls were active near the $85,000 zone. A low was formed at $85,151 and the price is consolidating gains below the 23.6% Fib retracement level of the downward move from the $93,560 swing high to the $85,151 low.

Bitcoin is now trading below $88,000 and the 100 hourly Simple moving average. If the bulls remain in action, the price could attempt another increase. Immediate resistance is near the $87,150 level. The first key resistance is near the $87,500 level.

Bitcoin Price

The next resistance could be $88,000. A close above the $88,000 resistance might send the price further higher. In the stated case, the price could rise and test the $89,000 resistance. There is also a bearish trend line forming with resistance at $89,000 on the hourly chart of the BTC/USD pair. Any more gains might send the price toward the $90,000 level. The next barrier for the bulls could be $91,000 and $91,500.

Another Decline In BTC?

If Bitcoin fails to rise above the $87,000 resistance zone, it could start another decline. Immediate support is near the $85,500 level. The first major support is near the $85,000 level.

The next support is now near the $83,500 zone. Any more losses might send the price toward the $82,500 support in the near term. The main support sits at $80,000, below which BTC might accelerate lower in the near term.

Technical indicators:

Hourly MACD – The MACD is now losing pace in the bearish zone.

Hourly RSI (Relative Strength Index) – The RSI for BTC/USD is now below the 50 level.

Major Support Levels – $85,500, followed by $85,000.

Major Resistance Levels – $88,000 and $89,000.

Dogecoin (DOGE) Slides Deeper Into Redβ€”Is a Bottom in Sight?

Dogecoin started a fresh decline below the $0.1400 zone against the US Dollar. DOGE is now consolidating losses and might face hurdles near $0.1400.

  • DOGE price started a fresh decline below the $0.1400 level.
  • The price is trading below the $0.1380 level and the 100-hourly simple moving average.
  • There is a key bearish trend line forming with resistance at $0.1375 on the hourly chart of the DOGE/USD pair (data source from Kraken).
  • The price could extend losses if it stays below $0.1400 and $0.1420.

Dogecoin Price Dips Further

Dogecoin price started a fresh decline after it closed below $0.1420, like Bitcoin and Ethereum. DOGE declined below the $0.1400 and $0.1380 support levels.

The price even traded below $0.1350. A low was formed near $0.1326, and the price recently corrected some losses. There was a minor increase toward the 23.6% Fib retracement level of the downward move from the $0.1530 swing high to the $0.1326 low.

Dogecoin price is now trading below the $0.1400 level and the 100-hourly simple moving average. If there is a recovery wave, immediate resistance on the upside is near the $0.1380 level. There is also a key bearish trend line forming with resistance at $0.1375 on the hourly chart of the DOGE/USD pair.

Dogecoin Price

The first major resistance for the bulls could be near the $0.140 level. The next major resistance is near the $0.1425 level and the 50% Fib retracement level of the downward move from the $0.1530 swing high to the $0.1326 low. A close above the $0.1425 resistance might send the price toward the $0.1450 resistance. Any more gains might send the price toward the $0.1500 level. The next major stop for the bulls might be $0.1550.

Another Decline In DOGE?

If DOGE’s price fails to climb above the $0.140 level, it could continue to move down. Initial support on the downside is near the $0.1340 level. The next major support is near the $0.1325 level.

The main support sits at $0.130. If there is a downside break below the $0.130 support, the price could decline further. In the stated case, the price might slide toward the $0.1250 level or even $0.1240 in the near term.

Technical Indicators

Hourly MACD – The MACD for DOGE/USD is now gaining momentum in the bearish zone.

Hourly RSI (Relative Strength Index) – The RSI for DOGE/USD is now above the 50 level.

Major Support Levels – $0.1340 and $0.1300.

Major Resistance Levels – $0.1400 and $0.1420.

XRP Price Struggles Near $2.0β€”Breakout Blocked or Pullback Ahead?

XRP price started a fresh decline below $2.00. The price is now struggling and faces resistance near the $2.020 resistance level.

  • XRP price started a fresh decline below the $2.00 zone.
  • The price is now trading below $2.00 and the 100-hourly Simple Moving Average.
  • There is a bearish trend line forming with resistance at $2.020 on the hourly chart of the XRP/USD pair (data source from Kraken).
  • The pair could continue to move down if it settles below $1.950.

XRP Price Dips Again

XRP price attempted a recovery wave above $2.120 but failed to continue higher, like Bitcoin and Ethereum. The price started a fresh decline below $2.050 and $2.020.

There was a move below the $2.00 support level. A low was formed at $1.9525, and the price recently started an upside correction. There was a move above the 50% Fib retracement level of the downward move from the $2.047 swing high to the $1.952 low.

However, the bears are active near $2.00 and $2.020. There is also a bearish trend line forming with resistance at $2.020 on the hourly chart of the XRP/USD pair. The price is now trading below $2.00 and the 100-hourly Simple Moving Average.

If there is a fresh upward move, the price might face resistance near the $2.00 level. The first major resistance is near the $2.020 level or the 61.8% Fib retracement level of the downward move from the $2.047 swing high to the $1.952 low.

XRP Price

A close above $2.020 could send the price to $2.050. The next hurdle sits at $2.080. A clear move above the $2.120 resistance might send the price toward the $2.150 resistance. Any more gains might send the price toward the $2.20 resistance. The next major hurdle for the bulls might be near $2.250.

Another Decline?

If XRP fails to clear the $2.020 resistance zone, it could start a fresh decline. Initial support on the downside is near the $1.9650 level. The next major support is near the $1.950 level.

If there is a downside break and a close below the $1.950 level, the price might continue to decline toward $1.920. The next major support sits near the $1.880 zone, below which the price could continue lower toward $1.820.

Technical Indicators

Hourly MACD – The MACD for XRP/USD is now gaining pace in the bearish zone.

Hourly RSI (Relative Strength Index) – The RSI for XRP/USD is now below the 50 level.

Major Support Levels – $1.950 and $1.920.

Major Resistance Levels – $2.020 and $2.050.

Ethereum Price Drifts Lowerβ€”Is $3,000 About to Be the Battleground?

Ethereum price started a fresh decline below $3,120. ETH is now consolidating and might soon aim to start a recovery wave above $3,200.

  • Ethereum started a downside correction from the $3,250 zone.
  • The price is trading below $3,200 and the 100-hourly Simple Moving Average.
  • There is a connecting bearish trend line forming with resistance at $3,175 on the hourly chart of ETH/USD (data feed via Kraken).
  • The pair could continue to move down if it settles below the $3,050 zone.

Ethereum Price Dips Toward Support

Ethereum price failed to stay above $3,180 and started a fresh decline, like Bitcoin. ETH price dipped below $3,150 and $3,120 to enter a short-term bearish zone.

The bears even pushed the price toward $3,000. A low was formed at $3,026 and the price is now attempting to recover some losses. There was a move above the 23.6% Fib retracement level of the downward move from the $3,273 swing high to the $3,026 low.

Ethereum price is now trading below $3,200 and the 100-hourly Simple Moving Average. Besides, there is a connecting bearish trend line forming with resistance at $3,175 on the hourly chart of ETH/USD.

If there is another upward move, the price could face resistance near the $3,150 level or the 50% Fib retracement level of the downward move from the $3,273 swing high to the $3,026 low. The next key resistance is near the $3,180 level and the trend line.

Ethereum Price

The first major resistance is near the $3,200 level. A clear move above the $3,200 resistance might send the price toward the $3,250 resistance. An upside break above the $3,250 region might call for more gains in the coming days. In the stated case, Ether could rise toward the $3,320 resistance zone or even $3,400 in the near term.

Another Decline In ETH?

If Ethereum fails to clear the $3,200 resistance, it could start a fresh decline. Initial support on the downside is near the $3,080 level. The first major support sits near the $3,050 zone.

A clear move below the $3,050 support might push the price toward the $3,020 support. Any more losses might send the price toward the $3,000 region. The next key support sits at $2,940.

Technical Indicators

Hourly MACD – The MACD for ETH/USD is gaining momentum in the bullish zone.

Hourly RSI – The RSI for ETH/USD is now above the 50 zone.

Major Support Level – $3,080

Major Resistance Level – $3,200

Bitcoin Price Faces Growing Heatβ€”Is Momentum Turning Against Bulls?

Bitcoin price corrected gains and traded below the $90,000 support zone. BTC is now rising and might struggle to clear the $90,500 zone.

  • Bitcoin started a downside correction from the $92,500 zone.
  • The price is trading below $90,000 and the 100 hourly Simple moving average.
  • There is a bearish trend line forming with resistance at $90,650 on the hourly chart of the BTC/USD pair (data feed from Kraken).
  • The pair might continue to move up if it settles above the $90,500 zone.

Bitcoin Price Aims Fresh Increase

Bitcoin price failed to gain strength for a move above the $92,000 and $92,500 levels. BTC started a downside correction and traded below the $90,500 support.

The price even spiked below the $88,000 support. However, the bulls were active near the $87,500 zone. A low was formed at $87,582 and the price is moving higher. There was a break above the 23.6% Fib retracement level of the downward move from the $93,561 swing high to the $87,582 low.

Bitcoin is now trading below $90,000 and the 100 hourly Simple moving average. If the bulls remain in action, the price could attempt another increase. Immediate resistance is near the $90,000 level. The first key resistance is near the $90,500 level. There is also a bearish trend line forming with resistance at $90,650 on the hourly chart of the BTC/USD pair.

Bitcoin Price

The next resistance could be $92,000. A close above the $92,000 resistance might send the price further higher. In the stated case, the price could rise and test the $92,500 resistance. Any more gains might send the price toward the $93,200 level. The next barrier for the bulls could be $94,000 and $94,500.

Another Decline In BTC?

If Bitcoin fails to rise above the $90,500 resistance zone, it could start another decline. Immediate support is near the $88,550 level. The first major support is near the $88,000 level.

The next support is now near the $87,500 zone. Any more losses might send the price toward the $86,500 support in the near term. The main support sits at $85,000, below which BTC might accelerate lower in the near term.

Technical indicators:

Hourly MACD – The MACD is now gaining pace in the bullish zone.

Hourly RSI (Relative Strength Index) – The RSI for BTC/USD is now above the 50 level.

Major Support Levels – $88,550, followed by $88,000.

Major Resistance Levels – $90,000 and $90,500.

Dogecoin (DOGE) Turns Softβ€”Bearish Signals Hint at Fresh Declines

Dogecoin started a fresh decline below the $0.1420 zone against the US Dollar. DOGE is now consolidating losses and might face hurdles near $0.1440.

  • DOGE price started a fresh decline below the $0.1420 level.
  • The price is trading below the $0.1420 level and the 100-hourly simple moving average.
  • There is a key bearish trend line forming with resistance at $0.1440 on the hourly chart of the DOGE/USD pair (data source from Kraken).
  • The price could extend losses if it stays below $0.1420 and $0.1440.

Dogecoin Price Faces Resistance

Dogecoin price started a fresh decline after it closed below $0.1465, like Bitcoin and Ethereum. DOGE declined below the $0.1440 and $0.140 support levels.

The price even traded below $0.1380. A low was formed near $0.1363, and the price recently corrected some losses. There was a minor increase above the 23.6% Fib retracement level of the downward move from the $0.1530 swing high to the $0.1363 low.

Dogecoin price is now trading below the $0.1420 level and the 100-hourly simple moving average. If there is a recovery wave, immediate resistance on the upside is near the $0.1425 level. The first major resistance for the bulls could be near the $0.1440 level. There is also a key bearish trend line forming with resistance at $0.1440 on the hourly chart of the DOGE/USD pair.

Dogecoin Price

The next major resistance is near the $0.1490 level and the 76.4% Fib retracement level of the downward move from the $0.1530 swing high to the $0.1363 low. A close above the $0.1490 resistance might send the price toward the $0.1530 resistance. Any more gains might send the price toward the $0.1550 level. The next major stop for the bulls might be $0.1620.

Another Decline In DOGE?

If DOGE’s price fails to climb above the $0.1440 level, it could continue to move down. Initial support on the downside is near the $0.1380 level. The next major support is near the $0.1360 level.

The main support sits at $0.1320. If there is a downside break below the $0.1320 support, the price could decline further. In the stated case, the price might slide toward the $0.1250 level or even $0.1240 in the near term.

Technical Indicators

Hourly MACD – The MACD for DOGE/USD is now losing momentum in the bearish zone.

Hourly RSI (Relative Strength Index) – The RSI for DOGE/USD is now above the 50 level.

Major Support Levels – $0.1360 and $0.1320.

Major Resistance Levels – $0.1440 and $0.1490.

XRP Price Fights Resistanceβ€”Breakout or Breakdown on Deck?

XRP price started a fresh decline below $2.080. The price is now struggling and faces resistance near the $2.040 resistance level.

  • XRP price started a fresh decline below the $2.050 zone.
  • The price is now trading below $2.050 and the 100-hourly Simple Moving Average.
  • There is a bearish trend line forming with resistance at $2.040 on the hourly chart of the XRP/USD pair (data source from Kraken).
  • The pair could continue to move down if it settles below $2.00.

XRP Price Struggles Near Resistance

XRP price attempted a recovery wave above $2.150 but failed to continue higher, like Bitcoin and Ethereum. The price started a fresh decline below $2.080 and $2.050.

There was a move below the $2.00 support level. A low was formed at $1.993, and the price recently started an upside correction. There was a move above the 23.6% Fib retracement level of the downward move from the $2.177 swing high to the $1.993 low.

However, the bears are active near $2.040 and $2.050. There is also a bearish trend line forming with resistance at $2.040 on the hourly chart of the XRP/USD pair. The price is now trading below $2.050 and the 100-hourly Simple Moving Average.

If there is a fresh upward move, the price might face resistance near the $2.040 level. The first major resistance is near the $2.080 level or the 50% Β Fib retracement level of the downward move from the $2.177 swing high to the $1.993 low.

XRP Price

A close above $2.080 could send the price to $2.012. The next hurdle sits at $2.150. A clear move above the $2.150 resistance might send the price toward the $2.1850 resistance. Any more gains might send the price toward the $2.220 resistance. The next major hurdle for the bulls might be near $2.250.

Another Decline?

If XRP fails to clear the $2.040 resistance zone, it could start a fresh decline. Initial support on the downside is near the $2.00 level. The next major support is near the $1.9880 level.

If there is a downside break and a close below the $1.9880 level, the price might continue to decline toward $1.920. The next major support sits near the $1.880 zone, below which the price could continue lower toward $1.820.

Technical Indicators

Hourly MACD – The MACD for XRP/USD is now losing pace in the bearish zone.

Hourly RSI (Relative Strength Index) – The RSI for XRP/USD is now above the 50 level.

Major Support Levels – $2.00 and $1.9850.

Major Resistance Levels – $2.040 and $2.080.

Ethereum Price Prepares for Upside Moveβ€”Is the Rally About to Return?

Ethereum price started a fresh increase above $3,150. ETH is now consolidating and might soon aim for a clear upside break above $3,350.

  • Ethereum started a downside correction from the $3,450 zone.
  • The price is trading above $3,200 and the 100-hourly Simple Moving Average.
  • There is a new connecting bullish trend line forming with support at $3,180 on the hourly chart of ETH/USD (data feed via Kraken).
  • The pair could continue to move down if it settles below the $3,150 zone.

Ethereum Price Holds Support

Ethereum price managed to stay above $3,150 and started a fresh increase, beating Bitcoin. ETH price gained strength for a move above the $3,300 and $3,320 resistance levels.

The bulls even pushed the price above $3,400. However, the bears were active below $3,450. A high was formed at $3,448 and the price is now correcting gains. There was a move below $3,250, and the price even spiked below the 50% Fib retracement level of the upward wave from the $2,914 swing low to the $3,448 low.

However, the bulls were active near $3,150. Ethereum price is now trading above $3,200 and the 100-hourly Simple Moving Average. Besides, there is a new connecting bullish trend line forming with support at $3,180 on the hourly chart of ETH/USD.

Ethereum Price

If there is another upward move, the price could face resistance near the $3,290 level. The next key resistance is near the $3,320 level. The first major resistance is near the $3,350 level. A clear move above the $3,350 resistance might send the price toward the $3,400 resistance. An upside break above the $3,400 region might call for more gains in the coming days. In the stated case, Ether could rise toward the $3,450 resistance zone or even $3,500 in the near term.

Another Decline In ETH?

If Ethereum fails to clear the $3,320 resistance, it could start a fresh decline. Initial support on the downside is near the $3,200 level. The first major support sits near the $3,150 zone.

A clear move below the $3,150 support might push the price toward the $3,040 support. Any more losses might send the price toward the $3,020 region. The next key support sits at $3,000.

Technical Indicators

Hourly MACD – The MACD for ETH/USD is gaining momentum in the bullish zone.

Hourly RSI – The RSI for ETH/USD is now above the 50 zone.

Major Support Level – $3,180

Major Resistance Level – $3,350

Bitcoin Price Holds Firmβ€”Is a Fresh Bullish Wave About to Start?

Bitcoin price stayed above the $90,000 support zone. BTC is now rising and might soon aim for an upside break above the $94,000 resistance.

  • Bitcoin started a downside correction from the $94,500 zone.
  • The price is trading above $92,000 and the 100 hourly Simple moving average.
  • There is a bearish trend line forming with resistance at $92,950 on the hourly chart of the BTC/USD pair (data feed from Kraken).
  • The pair might continue to move up if it settles above the $93,500 zone.

Bitcoin Price Aims Upside Break

Bitcoin price failed to gain strength for a move above the $94,000 and $94,500 levels. BTC started a downside correction and traded below the $92,500 support.

There was a clear move below the 50% Fib retracement level of the upward move from the $87,776 swing low to the $94,582 high. The price even spiked below the $90,000 support. However, the bulls were active near the $89,500 zone.

They prevented a move below the 76.4% Fib retracement level of the upward move from the $87,776 swing low to the $94,582 high. Bitcoin is now trading above $92,000 and the 100 hourly Simple moving average.

If the bulls remain in action, the price could attempt another increase. Immediate resistance is near the $93,000 level. There is also a bearish trend line forming with resistance at $92,950 on the hourly chart of the BTC/USD pair. The first key resistance is near the $93,500 level.

Bitcoin Price

The next resistance could be $94,000. A close above the $94,000 resistance might send the price further higher. In the stated case, the price could rise and test the $94,750 resistance. Any more gains might send the price toward the $95,000 level. The next barrier for the bulls could be $96,000 and $96,500.

Another Decline In BTC?

If Bitcoin fails to rise above the $93,000 resistance zone, it could start another decline. Immediate support is near the $92,000 level. The first major support is near the $91,200 level.

The next support is now near the $90,000 zone. Any more losses might send the price toward the $89,500 support in the near term. The main support sits at $88,000, below which BTC might accelerate lower in the near term.

Technical indicators:

Hourly MACD – The MACD is now gaining pace in the bullish zone.

Hourly RSI (Relative Strength Index) – The RSI for BTC/USD is now above the 50 level.

Major Support Levels – $91,200, followed by $90,000.

Major Resistance Levels – $93,000 and $94,000.

Dogecoin (DOGE) Slips Back Into the Redβ€”Is Momentum Breaking Down?

Dogecoin started a fresh decline below the $0.1450 zone against the US Dollar. DOGE is now consolidating losses and might face hurdles near $0.1420.

  • DOGE price started a fresh decline below the $0.1450 level.
  • The price is trading below the $0.140 level and the 100-hourly simple moving average.
  • There was a break below a key bullish trend line with support at $0.1450 on the hourly chart of the DOGE/USD pair (data source from Kraken).
  • The price could extend losses if it stays below $0.1420 and $0.1450.

Dogecoin Price Dips Further

Dogecoin price started a fresh decline after it closed below $0.150, like Bitcoin and Ethereum. DOGE declined below the $0.1450 and $0.1420 support levels.

More importantly, there was a break below a key bullish trend line with support at $0.1450 on the hourly chart of the DOGE/USD pair. The price even traded below $0.140. A low was formed near $0.1372, and the price is now showing bearish signs below the 23.6% Fib retracement level of the downward move from the $0.1531 swing high to the $0.1372 low.

Dogecoin price is now trading below the $0.140 level and the 100-hourly simple moving average. If there is a recovery wave, immediate resistance on the upside is near the $0.1410 level. The first major resistance for the bulls could be near the $0.1450 level and the 50% Fib retracement level of the downward move from the $0.1531 swing high to the $0.1372 low.

Dogecoin Price

The next major resistance is near the $0.1495 level. A close above the $0.1495 resistance might send the price toward the $0.1530 resistance. Any more gains might send the price toward the $0.1550 level. The next major stop for the bulls might be $0.1620.

More Losses In DOGE?

If DOGE’s price fails to climb above the $0.1450 level, it could continue to move down. Initial support on the downside is near the $0.1375 level. The next major support is near the $0.1350 level.

The main support sits at $0.1330. If there is a downside break below the $0.1320 support, the price could decline further. In the stated case, the price might slide toward the $0.1250 level or even $0.1240 in the near term.

Technical Indicators

Hourly MACD – The MACD for DOGE/USD is now gaining momentum in the bearish zone.

Hourly RSI (Relative Strength Index) – The RSI for DOGE/USD is now below the 50 level.

Major Support Levels – $0.1350 and $0.1250.

Major Resistance Levels – $0.1420 and $0.1450.

XRP Price Under Pressureβ€”Can It Survive This Support Test?

XRP price started a fresh decline below $2.10. The price is now struggling and faces resistance near the $2.050 pivot level.

  • XRP price started a fresh decline below the $2.040 zone.
  • The price is now trading below $2.020 and the 100-hourly Simple Moving Average.
  • There is a bearish trend line forming with resistance at $2.050 on the hourly chart of the XRP/USD pair (data source from Kraken).
  • The pair could continue to move down if it settles below $2.00.

XRP Price Dips Again

XRP price attempted a recovery wave above $2.120 but failed to continue higher, like Bitcoin and Ethereum. The price started a fresh decline below $2.10 and $2.050.

There was a move below the $2.00 support level. A low was formed at $1.993, and the price is now consolidating losses below the 23.6% Fib retracement level of the downward move from the $2.177 swing high to the $1.993 low.

The price is now trading below $2.050 and the 100-hourly Simple Moving Average. If there is a fresh upward move, the price might face resistance near the $2.0350 level. The first major resistance is near the $2.050 level. There is also a bearish trend line forming with resistance at $2.050 on the hourly chart of the XRP/USD pair.

XRP Price

A close above $2.050 could send the price to $2.085 and the 50% Fib retracement level of the downward move from the $2.177 swing high to the $1.993 low. The next hurdle sits at $2.10. A clear move above the $2.10 resistance might send the price toward the $2.150 resistance. Any more gains might send the price toward the $2.1850 resistance. The next major hurdle for the bulls might be near $2.220.

More Losses?

If XRP fails to clear the $2.050 resistance zone, it could start a fresh decline. Initial support on the downside is near the $2.00 level. The next major support is near the $1.9850 level.

If there is a downside break and a close below the $1.9850 level, the price might continue to decline toward $1.920. The next major support sits near the $1.880 zone, below which the price could continue lower toward $1.820.

Technical Indicators

Hourly MACD – The MACD for XRP/USD is now gaining pace in the bearish zone.

Hourly RSI (Relative Strength Index) – The RSI for XRP/USD is now below the 50 level.

Major Support Levels – $2.00 and $1.9850.

Major Resistance Levels – $2.050 and $2.10.

Ethereum Price Retreats From Resistanceβ€”Is a Trend Reversal Starting?

Ethereum price started a fresh increase above $3,350. ETH is now correcting gains from $3,450 and might decline further below $3,200.

  • Ethereum started a downside correction from the $3,450 zone.
  • The price is trading near $3,200 and the 100-hourly Simple Moving Average.
  • There was a break below a bullish trend line with support at $3,240 on the hourly chart of ETH/USD (data feed via Kraken).
  • The pair could continue to move down if it settles below the $3,200 zone.

Ethereum Price Declines Heavily

Ethereum price managed to stay above $3,200 and started a fresh increase, beating Bitcoin. ETH price gained strength for a move above the $3,320 and $3,350 resistance levels.

The bulls even pushed the price above $3,400. However, the bears were active below $3,450. A high was formed at $3,448 and the price is now correcting gains. There was a sharp decline below the 23.6% Fib retracement level of the upward wave from the $2,914 swing low to the $3,448 low.

Besides, there was a break below a bullish trend line with support at $3,240 on the hourly chart of ETH/USD. Ethereum price is now trading near $3,200 and the 100-hourly Simple Moving Average.

Ethereum Price

If there is another upward move, the price could face resistance near the $3,250 level. The next key resistance is near the $3,300 level. The first major resistance is near the $3,320 level. A clear move above the $3,320 resistance might send the price toward the $3,400 resistance. An upside break above the $3,400 region might call for more gains in the coming days. In the stated case, Ether could rise toward the $3,450 resistance zone or even $3,500 in the near term.

More Losses In ETH?

If Ethereum fails to clear the $3,250 resistance, it could start a fresh decline. Initial support on the downside is near the $3,200 level. The first major support sits near the $3,180 zone and the 50% Fib retracement level of the upward wave from the $2,914 swing low to the $3,448 low.

A clear move below the $3,180 support might push the price toward the $3,150 support. Any more losses might send the price toward the $3,050 region. The next key support sits at $3,000.

Technical Indicators

Hourly MACD – The MACD for ETH/USD is gaining momentum in the bearish zone.

Hourly RSI – The RSI for ETH/USD is now below the 50 zone.

Major Support Level – $3,180

Major Resistance Level – $3,300

Bitcoin Price Slides From Peak Levelsβ€”Is a Bigger Correction on Deck?

Bitcoin price failed to continue higher above $94,000. BTC is now gaining bearish pace and might decline further below $89,500.

  • Bitcoin started a downside correction from the $94,500 zone.
  • The price is trading below $92,000 and the 100 hourly Simple moving average.
  • There was a break below a bullish trend line with support at $91,600 on the hourly chart of the BTC/USD pair (data feed from Kraken).
  • The pair might continue to move down if it settles below the $89,500 zone.

Bitcoin Price Dips Again

Bitcoin price failed to gain strength for a move above the $94,000 and $94,500 levels. BTC started a downside correction and traded below the $92,000 support.

There was a clear move below the 50% Fib retracement level of the upward move from the $87,777 swing low to the $94,583 high. Besides, there was a break below a bullish trend line with support at $91,600 on the hourly chart of the BTC/USD pair.

Bitcoin is now trading below $91,200 and the 100 hourly Simple moving average. The price is now approaching the $89,500 support, and the 76.4% Fib retracement level of the upward move from the $87,777 swing low to the $94,583 high.

Bitcoin Price

If the bulls remain in action, the price could attempt another increase. Immediate resistance is near the $91,200 level. The first key resistance is near the $91,500 level. The next resistance could be $92,000. A close above the $92,000 resistance might send the price further higher. In the stated case, the price could rise and test the $92,850 resistance. Any more gains might send the price toward the $93,500 level. The next barrier for the bulls could be $94,000 and $94,500.

More Losses In BTC?

If Bitcoin fails to rise above the $92,000 resistance zone, it could start another decline. Immediate support is near the $89,500 level. The first major support is near the $88,800 level.

The next support is now near the $87,750 zone. Any more losses might send the price toward the $86,500 support in the near term. The main support sits at $85,000, below which BTC might accelerate lower in the near term.

Technical indicators:

Hourly MACD – The MACD is now gaining pace in the bearish zone.

Hourly RSI (Relative Strength Index) – The RSI for BTC/USD is now below the 50 level.

Major Support Levels – $89,500, followed by $88,800.

Major Resistance Levels – $91,200 and $92,000.

Solana (SOL) Turns Lower From Key Zoneβ€”Is Support About to Be Tested?

Solana failed to stay above $142 and corrected gains. SOL price is now trading below $140 and might find bids near the $135 zone.

  • SOL price started a downside correction below $142 against the US Dollar.
  • The price is now trading above $135 and the 100-hourly simple moving average.
  • There is a bullish trend line forming with support at $135 on the hourly chart of the SOL/USD pair (data source from Kraken).
  • The pair could extend losses if it dips below the $135 zone.

Solana Price Starts Downside Correction

Solana price failed to surpass $145 and started a downside correction, like Bitcoin and Ethereum. SOL dipped below $142 and $140 to enter a short-term bearish zone.

There was a move below the 50% Fib retracement level of the upward wave from the $131 swing low to the $145 high. However, the bulls are active near $136. There is also a bullish trend line forming with support at $135 on the hourly chart of the SOL/USD pair.

Solana Price

Solana is now trading above $135 and the 100-hourly simple moving average. On the upside, the price is facing resistance near the $140 level. The next major resistance is near the $145 level. The main resistance could be $148. A successful close above the $148 resistance zone could set the pace for another steady increase. The next key resistance is $155. Any more gains might send the price toward the $165 level.

More Losses In SOL?

If SOL fails to rise above the $142 resistance, it could start another decline. Initial support on the downside is near the $136 zone and the 61.8% Fib retracement level of the upward wave from the $131 swing low to the $145 high. The first major support is near the $135 level and the trend line.

A break below the $135 level might send the price toward the $132 support zone. If there is a close below the $132 support, the price could decline toward the $125 support in the near term.

Technical Indicators

Hourly MACD – The MACD for SOL/USD is gaining pace in the bearish zone.

Hourly Hours RSI (Relative Strength Index) – The RSI for SOL/USD is below the 50 level.

Major Support Levels – $135 and $132.

Major Resistance Levels – $142 and $145.

XRP Price Positive Streak Fadesβ€”Are Traders Bracing for Volatility?

XRP price started a decent increase above $2.150. The price is now correcting gains and might struggle to stay in a positive zone.

  • XRP price started a downside correction and tested the $2.080 zone.
  • The price is now trading above $2.050 and the 100-hourly Simple Moving Average.
  • There is a bullish trend line forming with support at $2.070 on the hourly chart of the XRP/USD pair (data source from Kraken).
  • The pair could start another increase if it clears $2.120.

XRP Price Dips Again

XRP price started a downside correction from the $2.180 zone, like Bitcoin and Ethereum. The price dipped below the $2.150 and $2.120 levels to enter a consolidation phase.

The price even dipped below the 50% Fib retracement level of the upward move from the $2.042 swing low to the $2.1778 high. However, the bulls remained active above the $2.080 support. There is also a bullish trend line forming with support at $2.070 on the hourly chart of the XRP/USD pair.

The price is now trading above $2.050 and the 100-hourly Simple Moving Average. If there is a fresh upward move, the price might face resistance near the $2.120 level.

XRP Price

The first major resistance is near the $2.150 level, above which the price could rise and test $2.180. A clear move above the $2.180 resistance might send the price toward the $2.2250 resistance. Any more gains might send the price toward the $2.250 resistance. The next major hurdle for the bulls might be near $2.2880.

More Losses?

If XRP fails to clear the $2.120 resistance zone, it could start a fresh decline. Initial support on the downside is near the $2.070 level, the 76.4% Fib retracement level of the upward move from the $2.042 swing low to the $2.1778 high, and the trend line. The next major support is near the $2.050 level.

If there is a downside break and a close below the $2.050 level, the price might continue to decline toward $2.00. The next major support sits near the $1.9850 zone, below which the price could continue lower toward $1.920.

Technical Indicators

Hourly MACD – The MACD for XRP/USD is now gaining pace in the bearish zone.

Hourly RSI (Relative Strength Index) – The RSI for XRP/USD is now below the 50 level.

Major Support Levels – $2.070 and $2.050.

Major Resistance Levels – $2.120 and $2.180.

Ethereum Smashes Resistanceβ€”Bitcoin Left Behind as Momentum Flips Bullish

Ethereum price started a fresh increase above $3,250. ETH is now consolidating gains and might aim for more gains if it clears the $3,380 resistance.

  • Ethereum started a fresh increase above the $3,200 and $3,250 levels.
  • The price is trading above $3,200 and the 100-hourly Simple Moving Average.
  • There is a bullish trend line forming with support at $3,210 on the hourly chart of ETH/USD (data feed via Kraken).
  • The pair could continue to move up if it settles above the $3,350 zone.

Ethereum Price Rallies Over 8%

Ethereum price managed to stay above $3,000 and started a fresh increase, beating Bitcoin. ETH price gained strength for a move above the $3,120 and $3,250 resistance levels.

The bulls even pushed the price above $3,350. However, the bears were active below $3,400. A high was formed at $3,396 and the price is now consolidating. There was a minor drop below the 23.6% Fib retracement level of the upward wave from the $3,094 swing low to the $3,396 low.

Ethereum price is now trading above $3,200 and the 100-hourly Simple Moving Average. There is also a bullish trend line forming with support at $3,210 on the hourly chart of ETH/USD.

Ethereum Price

If there is another upward move, the price could face resistance near the $3,320 level. The next key resistance is near the $3,350 level. The first major resistance is near the $3,380 level. A clear move above the $3,380 resistance might send the price toward the $3,420 resistance. An upside break above the $3,420 region might call for more gains in the coming days. In the stated case, Ether could rise toward the $3,500 resistance zone or even $3,550 in the near term.

Pullback In ETH?

If Ethereum fails to clear the $3,380 resistance, it could start a fresh decline. Initial support on the downside is near the $3,250 level and the 50% Fib retracement level of the upward wave from the $3,094 swing low to the $3,396 low. The first major support sits near the $3,210 zone.

A clear move below the $3,210 support might push the price toward the $3,150 support. Any more losses might send the price toward the $3,050 region. The next key support sits at $3,000.

Technical Indicators

Hourly MACD – The MACD for ETH/USD is gaining momentum in the bullish zone.

Hourly RSI – The RSI for ETH/USD is now above the 50 zone.

Major Support Level – $3,210

Major Resistance Level – $3,380

Bitcoin Price Shows Fresh Strengthβ€”Could This Spark a Rapid Rally?

Bitcoin price started a decent increase above $92,000. BTC is now consolidating gains and might aim for another increase if it clears $93,400.

  • Bitcoin started a downside correction from the $94,500 zone.
  • The price is trading above $92,000 and the 100 hourly Simple moving average.
  • There is a bullish trend line forming with support at $91,500 on the hourly chart of the BTC/USD pair (data feed from Kraken).
  • The pair might continue to move up if it settles above the $93,400 zone.

Bitcoin Price Holds Support

Bitcoin price managed to stay above the $91,000 zone and started a fresh increase. BTC gained strength for a move above the $92,500 and $94,000 levels.

However, the bears were active near $94,500. A high was formed at $94,583 and the price recently corrected some gains. There was a drop toward the 50% Fib retracement level of the upward move from the $89,545 swing low to the $94,583 high.

However, the bulls were active near the $92,000 support. Bitcoin is now trading below $92,000 and the 100 hourly Simple moving average. Besides, there is a bullish trend line forming with support at $91,500 on the hourly chart of the BTC/USD pair.

Bitcoin Price

If the bulls remain in action, the price could attempt another increase. Immediate resistance is near the $92,800 level. The first key resistance is near the $93,200 level. The next resistance could be $94,000. A close above the $94,000 resistance might send the price further higher. In the stated case, the price could rise and test the $94,500 resistance. Any more gains might send the price toward the $95,500 level. The next barrier for the bulls could be $96,200 and $96,500.

More Losses In BTC?

If Bitcoin fails to rise above the $94,000 resistance zone, it could start another decline. Immediate support is near the $92,000 level. The first major support is near the $91,500 level and the 61.8% Fib retracement level of the upward move from the $89,545 swing low to the $94,583 high.

The next support is now near the $90,750 zone. Any more losses might send the price toward the $90,000 support in the near term. The main support sits at $88,800, below which BTC might accelerate lower in the near term.

Technical indicators:

Hourly MACD – The MACD is now gaining pace in the bullish zone.

Hourly RSI (Relative Strength Index) – The RSI for BTC/USD is now above the 50 level.

Major Support Levels – $92,000, followed by $91,500.

Major Resistance Levels – $93,200 and $94,000.

❌