Reading view

There are new articles available, click to refresh the page.

Ethereum Trades Near Whales’ Cost Basis For The Fourth Time Since 2021 – Historic Test

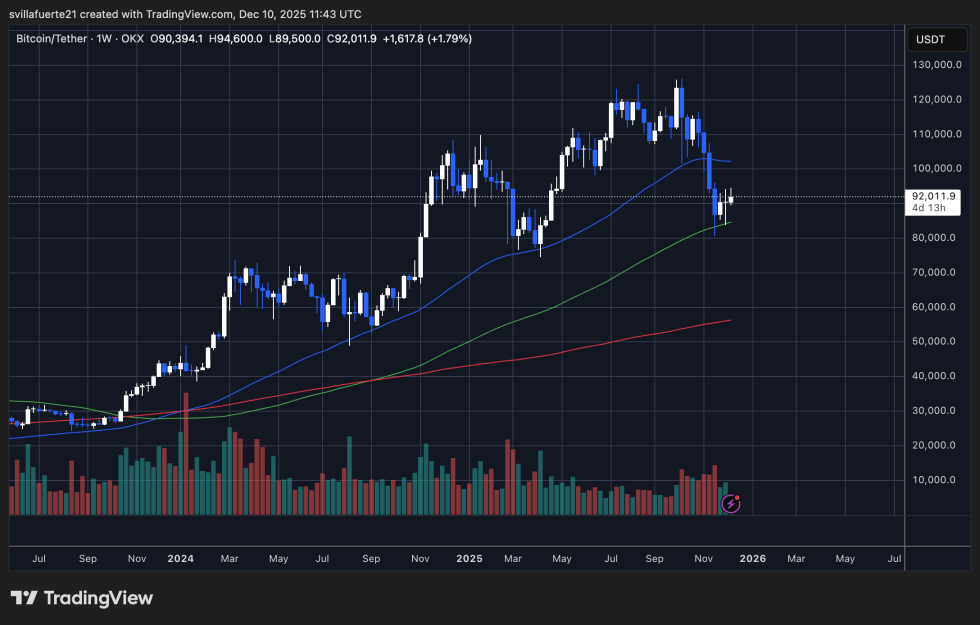
Ethereum is trading above the $3,200 level as bulls attempt to push the price back toward higher resistance zones, but market sentiment remains fragile. Fear and uncertainty continue to dominate as several analysts warn that the broader trend may still point toward a potential bear market. Yet, beneath the volatile price action, key on-chain data is revealing a development that could shape Ethereum’s next major phase.

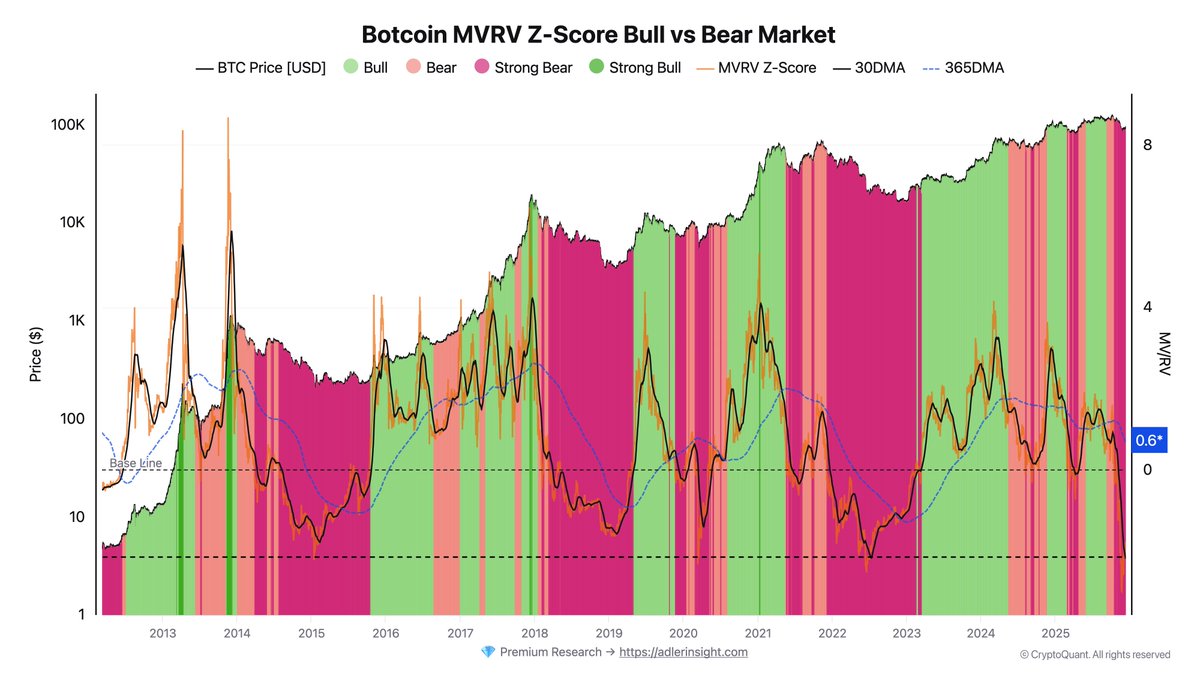
According to a new report from CryptoQuant, a historic signal tied to the realized price of whales holding more than 100,000 ETH has emerged once again. This metric, which tracks the average cost basis of the largest holders, has only been tested a handful of times over the past five years.

Each instance occurred during decisive turning points in Ethereum’s macro trend. Whenever ETH approached or traded near this realized price, it signaled either the exhaustion of a deep downtrend or the beginning of a strong recovery phase.

Today, Ethereum is once again hovering near this critical threshold. With analysts divided and sentiment weakening, the whale realized price has become one of the most important indicators to monitor. Whether ETH bounces or breaks here may determine the direction of the next major trend cycle.

Whale Realized Price as a Cycle-Defining Threshold

The CryptoQuant report highlights the significance of Ethereum’s proximity to the realized price of whales holding at least 100,000 ETH. According to the analysis, ETH has traded very close to this level only four times in the last five years.

Ethereum Realized Price (Balance > 100K ETH) | Source: CryptoQuant

Two of those instances occurred during the capitulation phase of the 2022 bear market, when selling pressure peaked, and long-term confidence was severely tested. The other two have happened this year, underscoring how unusual and cycle-defining the current environment has become.

What makes this metric particularly important is its historical reliability. In the past five years, Ethereum has never traded below the realized price of these mega-whales. This level has consistently acted as a structural floor, signaling areas where the largest and most sophisticated holders refuse to sell at a loss. Their behavior often marks moments of deep undervaluation or macro exhaustion within the market.

Today, that realized price sits near the $2,500 range, placing Ethereum within striking distance of a level that has repeatedly separated long-term accumulation zones from full-scale trend reversals. If ETH holds above this threshold, it would reinforce the idea that large holders still see long-term value—despite fear dominating broader market sentiment.

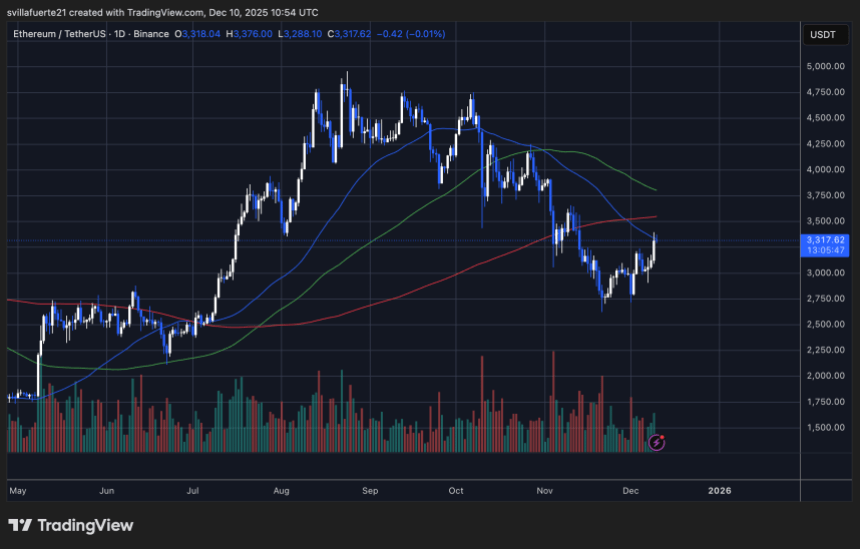
Ethereum Attempts Recovery but Faces Major Overhead Barriers

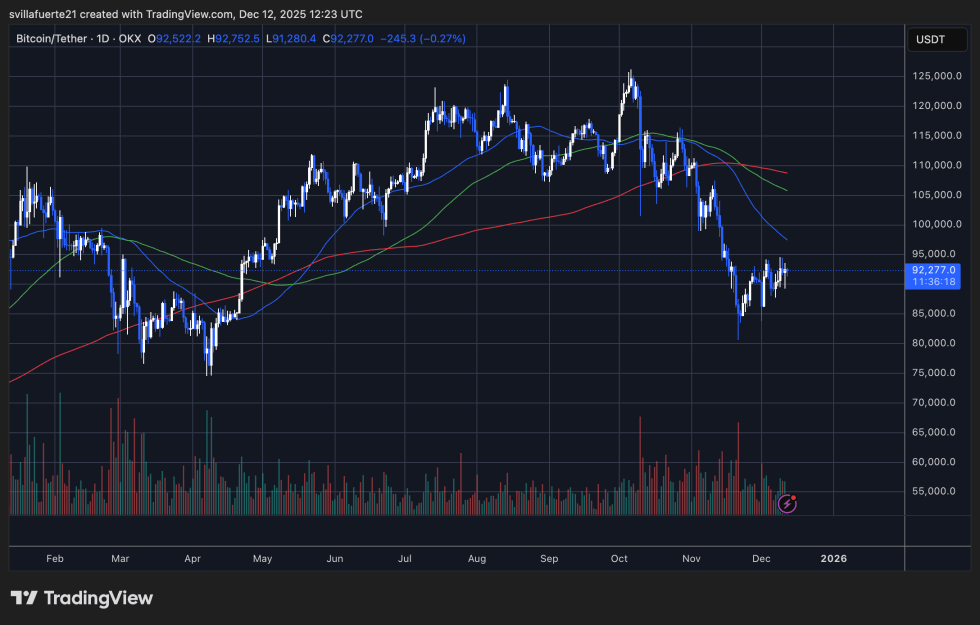
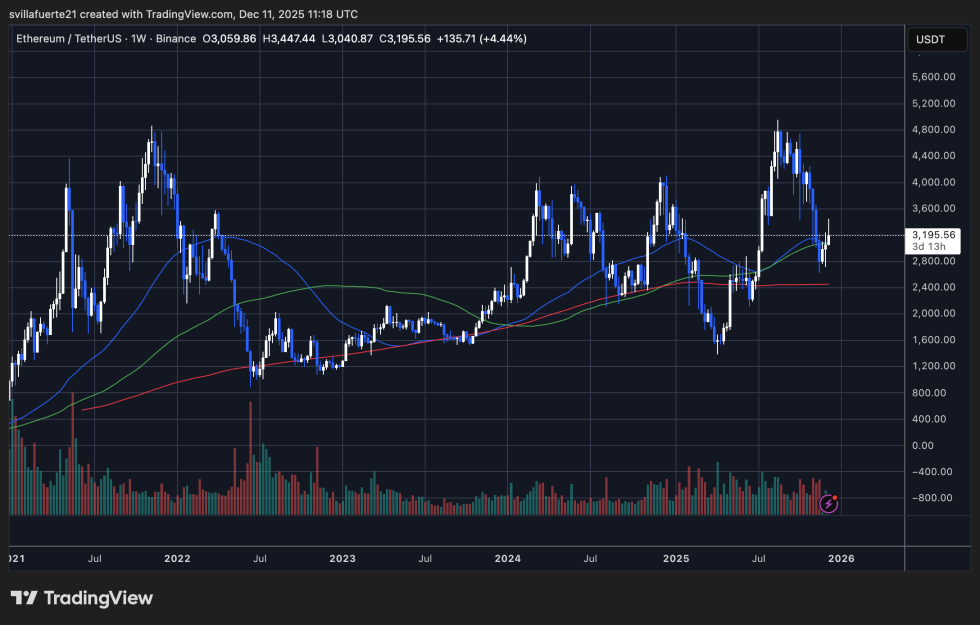
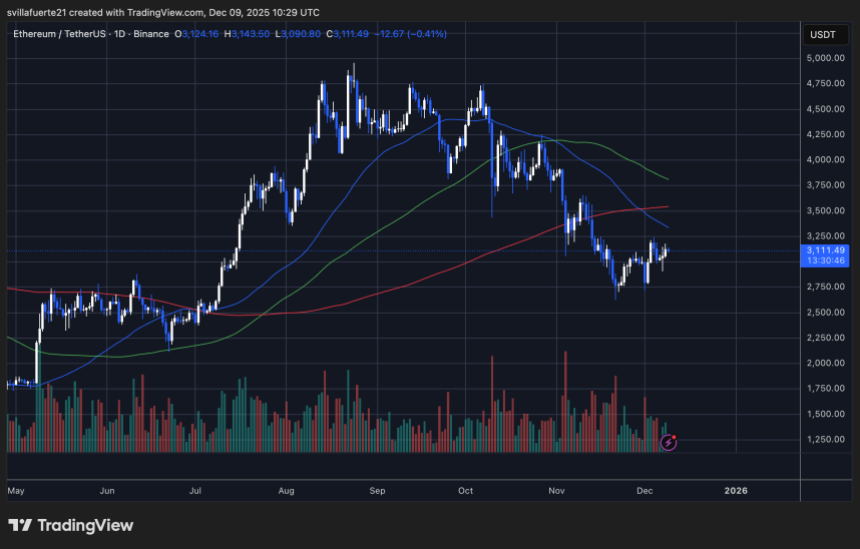
Ethereum’s daily chart shows a market attempting recovery, yet still constrained by significant structural resistance. After rebounding from the sub-$2,900 zone, ETH has reclaimed the $3,200 level and is currently trading near $3,238. While this bounce reflects short-term strength, the broader trend remains fragile.

ETH testing critical resistance level | Source: ETHUSDT chart on TradingView

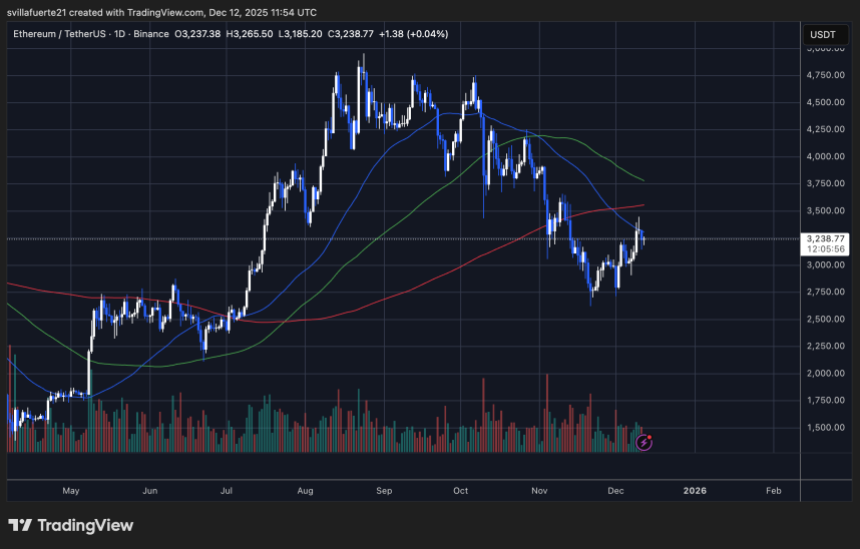
The price is encountering the 50-day moving average, which has acted as dynamic resistance throughout the decline from September’s peak. ETH briefly pierced above it but failed to secure a strong close, signaling hesitation from buyers.

The 100-day and 200-day moving averages remain well above the current price, reinforcing that Ethereum is still operating beneath major trend markers. These moving averages are likely to form an overhead cluster of resistance between $3,400 and $3,600—an area where sellers previously overwhelmed bullish attempts.

Structurally, ETH is forming a potential higher low, but it has not yet produced a higher high—an essential condition for confirming a trend reversal. A clean breakout above $3,350 would strengthen bullish momentum. Conversely, losing $3,150 risks reopening a path toward $3,000 and potentially retesting deeper support levels.

Featured image from ChatGPT, chart from TradingView.com

Bitcoin On-Chain Signals Delay Bull Thesis: MVRV Model Projects Recovery Next Cycle

Bitcoin has failed to reclaim higher prices, reinforcing the growing belief that the market may be entering a deeper bearish phase. After multiple attempts to push above key resistance levels, BTC continues to trade sideways with declining momentum, reflecting a clear shift in investor sentiment. Fear is rising across the market, and price action has yet to show any convincing signs of recovery.

According to new data shared by Axel Adler, several structural on-chain and market indicators now support a continuation of bearish conditions in the months ahead. Adler’s analysis points to weakening demand, persistent sell pressure, and deteriorating liquidity—factors that historically precede prolonged corrective periods.

While Bitcoin has held above critical support zones, its inability to establish higher highs or sustain rebounds suggests that buyers remain cautious and largely defensive.

Moreover, broader market conditions show similar fragility, with derivatives positioning, stablecoin flows, and long-term holder behavior all signaling reduced conviction. This confluence of factors strengthens the bearish thesis and implies that volatility could intensify before the market finds a meaningful bottom.

Bitcoin MVRV Spread Signals a Deep Bear Phase

Adler’s analysis highlights one of the clearest structural indicators pointing toward sustained bearish conditions: the Bitcoin MVRV Z-Score Bull vs. Bear Market model. Specifically, he notes that the 30-day to 365-day MVRV spread is deeply negative and continues to deteriorate.

This spread measures the difference in profitability between short-term and long-term holders, and when the short-term cohort is underperforming significantly, it traditionally signals risk aversion, exhaustion, and weakening demand.

Bitcoin MVRV Z-Score Bull vs Bear Market | Source: Axel Adler

A crossover—when the 30-day MVRV rises above the 365-day metric—has historically marked the transition from bear markets into new bullish phases. However, Adler stresses that such a crossover does not appear imminent under current conditions. The spread remains far below the threshold required for a structural reversal, reinforcing the view that Bitcoin is still entrenched in a deep bear phase within this model’s framework.

Cycle analogs further support this interpretation. Reviewing past market cycles, Adler estimates that the next likely window for a meaningful crossover sits in the second half of 2026. This implies that even if short-term rallies occur, they are more likely to be counter-trend bounces rather than the early stages of a sustainable bull market. Until the MVRV structure improves, broader sentiment may remain decisively bearish.

Price Struggles to Recover Momentum

Bitcoin continues to move sideways, reflecting a market that remains indecisive and structurally weak. The chart shows BTC trading near $92,000 after its sharp decline from the $120,000 region, with recent candles forming a tight consolidation range. This behavior typically signals a temporary stabilization phase rather than a confirmed reversal, especially given the broader bearish context highlighted by on-chain and macro indicators.

BTC consolidates below $95K | Source: BTCUSDT chart on TradingView

The 50-day moving average sits well above the current price, acting as dynamic resistance and indicating that short-term momentum remains firmly bearish. Likewise, the 100-day and 200-day moving averages trend downward, creating a compression zone that BTC has yet to challenge. Until Bitcoin can reclaim these levels with conviction, rallies may continue to be faded by sellers.

Despite the small rebound from sub-$90,000 levels, buying activity remains muted compared to the heavy sell volume that drove the initial breakdown. This suggests that demand is insufficient to absorb higher-timeframe selling pressure.

Structurally, Bitcoin is forming lower highs and lower lows across the daily timeframe, reinforcing a downtrend. A decisive break below $90,000 would expose deeper liquidity zones near $86,000–$84,000. Conversely, reclaiming $96,000 would be the first sign of strength—but current price action shows no such momentum yet.

Featured image from ChatGPT, chart from TradingView.com

XRP Whale Activity Spikes At The Bottom – A Classic Pre-Rally Signal

XRP has been under clear pressure in recent sessions, sliding toward its lowest price of the year as the broader crypto market continues to absorb heavy selling. Sentiment remains fragile, and many traders have shifted into defensive positioning while awaiting clearer macro signals.

According to a new report from CryptoQuant, however, the underlying picture is more complex than the price chart suggests. Despite the short-term decline, XRP whales are becoming increasingly active, showing no hesitation in trading and accumulating even as retail participation weakens.

This divergence between whale behavior and market sentiment is noteworthy. Historically, XRP’s most significant recoveries have begun during phases of deep pessimism, when large holders quietly build exposure rather than chase rallies.

The latest data confirms this pattern: while price approaches yearly lows, whale-driven transaction volume has risen, signaling that high-value wallets are repositioning rather than exiting.

Whale Accumulation and CVD Shift Signal a Potential XRP Bottom

The CryptoQuant report highlights that the recent surge in whale activity follows a pattern often observed during market bottoming phases. Large holders rarely accumulate aggressively during strong uptrends; instead, they tend to build positions quietly during periods of weakness, when sentiment is poor, and prices are depressed.

Their willingness to buy in the current environment—while XRP trades near yearly lows—suggests strategic positioning rather than speculative momentum chasing.

This behavior is typically interpreted as a pre-rally signal. When whales accumulate into weakness, it indicates confidence that current prices offer value and that the downside may be limited. Historically, such phases have preceded meaningful upside moves in XRP, as whale accumulation often absorbs available sell pressure and stabilizes market structure.

Supporting this view, the report also points to a notable shift in the XRP Spot Taker CVD, which has turned taker-buy dominant. This means that aggressive buyers are now driving more of the executed volume, reflecting strengthening demand in real time. A taker-buy dominant CVD often emerges before sustained rallies, as it highlights increasing willingness among market participants to buy at the ask rather than wait for dips.

XRP Ledger Spot Taker CVD | Source: CryptoQuant

Together, rising whale accumulation and a bullish CVD trend paint an increasingly constructive backdrop for XRP’s medium-term outlook.

Price Analysis: Testing Yearly Lows as Structure Weakens

XRP continues to trade near its yearly lows, with the chart showing a clear deterioration in trend structure. Price remains pinned below all major moving averages—the 50-day, 100-day, and 200-day—indicating that bullish momentum has not yet returned. The persistent rejection at the 50-day moving average throughout November and December highlights the strength of overhead resistance and the absence of sustained buying pressure from the broader market.

XRP consolidates around key level | Source: XRPUSDT chart on TradingView

The $2.00 region, now acting as a key horizontal support, has been tested multiple times over the past month. Each retest shows reduced volatility, suggesting that sellers are no longer driving aggressive breakdown attempts. But demand remains too weak to generate a meaningful rebound. A decisive loss of this level could open the door toward the $1.80–$1.90 support zone. XRP previously consolidated during the early stages of the 2025 rally.

Volume also confirms the broader downtrend. Selling spikes stand out noticeably, whereas buy-side volume remains muted. This imbalance reinforces the prevailing bearish structure, even as whale accumulation begins to appear on-chain.

For XRP to shift out of this downtrend, bulls must reclaim the 50-day moving average and produce higher lows. Until then, the chart signals continued caution. Whale activity must begin translating into visible spot demand, or the risk skews to the downside.

Featured image from ChatGPT, chart from TradingView.com

Half-Billion Dollar Bet: Bitcoin OG Scales Multi-Asset Long To $611 Million

Bitcoin enters the week trapped in a tight consolidation range, reflecting a market caught between caution and expectation. Price action has stalled as traders wait for clearer direction after the recent Federal Reserve decision and ongoing macro uncertainty.

Yet beneath the surface, whale activity tells a very different story. According to Lookonchain, one of the most notable market participants—the famous BitcoinOG, known for accurately shorting the market during the sharp October 10 crash—is now aggressively expanding his long exposure across multiple assets.

His current positioning is substantial: 150,466 ETH valued at approximately $491 million, 1,000 BTC worth $92.6 million, and 212,907 SOL totaling $27.8 million. Rather than scaling out or reducing risk during this period of market hesitation, he continues to build, signaling strong conviction in a broader recovery across major cryptocurrencies.

While retail traders and smaller speculators wait for confirmation, this whale is positioning early, anticipating a potential shift in momentum. His actions add a new layer of intrigue to Bitcoin’s consolidation, raising the question of whether smart money is preparing for a trend reversal while the rest of the market hesitates.

Whale Positioning and Strategic Bids Ahead

Lookonchain reports, citing Hypurrscan data, that this whale isn’t just holding an already massive multi-asset long position—he is strategically preparing to increase exposure even further. According to the data, he has placed limit orders to add an additional 40,000 ETH in the $3,030–$3,258 price range and 50,000 SOL at $138.6. These levels are positioned just below current market prices, suggesting he expects—or is at least prepared for—a deeper pullback before the next major move.

Bitcoin OG Whale Orders | Source: Hypurrscan

This behavior is notable because it reflects a deliberate accumulation strategy rather than impulsive buying. By setting large bids at key support zones, he aims to capture liquidity during periods of volatility, effectively using market weakness to scale into long-term positions. Such an approach is typical of sophisticated traders who rely on structured entries rather than reacting to short-term fluctuations.

The scale of these pending orders also indicates that his conviction extends beyond his already massive exposure. If filled, these additions would significantly increase his leverage in the broader crypto market, particularly in Ethereum and Solana. For observers, this raises an important question: is this smart money positioning ahead of a potential macro-driven rebound, or is it a high-risk bet into an uncertain environment?

Bitcoin Price Analysis: Testing Support, Lacking Momentum

Bitcoin’s latest price action on the 3-day timeframe shows a market stuck between recovery attempts and lingering downside pressure. After the sharp November sell-off, BTC stabilized above the $90,000 zone, which is now acting as a short-term support area. Price briefly dipped below this level but was quickly bought back, suggesting that buyers are still defending the region. However, the rebound remains shallow, and the structure lacks the strong momentum typically seen during bullish reversals.

BTC consolidates around key support | Source: BTCUSDT chart on TradingView

The chart shows BTC trading below the 50-day and 100-day moving averages, both of which have now turned downward. This alignment reflects a shift toward medium-term bearish conditions. The 200-day moving average currently sits below the price and has become the most important dynamic support; BTC is hovering directly above it. Historically, when Bitcoin holds the 200-day MA after a major correction, a consolidation phase often follows before a decisive move.

Volume also reinforces the uncertainty. Despite multiple attempts to push higher, buying volume remains muted compared to previous rallies, indicating limited conviction from bulls. Until BTC breaks convincingly above the 50-day MA region near $100K, the market will likely remain in a cautious, range-bound state.

Featured image from ChatGPT, chart from TradingView.com

Ethereum Leverage Hits Highest Level Ever – Market Enters Critical Risk Zone

Ethereum has retraced below the $3,200 level following the Federal Reserve’s decision to cut interest rates by 25 basis points, a move that initially boosted risk assets but quickly shifted market sentiment into uncertainty. While the broader macro backdrop now leans toward looser monetary conditions, Ethereum’s reaction suggests that traders remain cautious, especially after the sharp rally from the $2,800 region earlier this month.

According to fresh data from CryptoQuant, Binance’s Ethereum Estimated Leverage Ratio has climbed to an all-time high of nearly 0.579. This signals that the ETH market has entered a highly sensitive and potentially unstable phase, as open leveraged positions have grown faster than the underlying spot holdings on the exchange. Such extreme leverage typically reflects heightened risk appetite—and often precedes periods of sharp volatility.

This dynamic implies that a large portion of Ethereum’s recent price action has been driven not by organic demand, but by leveraged speculation. With funding structures stretched and traders aggressively positioning for upside, even a modest price swing could trigger a cascade of liquidations, amplifying market movements in either direction. As Ethereum hovers near key support, the combination of elevated leverage and post-FED uncertainty sets the stage for a volatile and decisive period ahead.

Ethereum’s Leverage Structure Signals Growing Fragility

Arab Chain explains that Ethereum’s historically high leverage ratio indicates a structural imbalance in the market. When the volume of open contracts funded by leverage grows faster than the actual spot ETH held on the platform, the entire ecosystem becomes more sensitive to abrupt volatility.

Ethereum Estimated Leverage Ratio | Source: CryptoQuant

In such conditions, traders face a heightened risk of liquidation from even moderate price swings—whether the move is upward or downward. Historically, peaks in this indicator have aligned with periods of intense price pressure, as excessive leverage magnifies the market’s reaction to relatively small shifts in demand or sentiment.

At the same time, Ethereum is currently trading near $3,300, creating a concerning confluence: rising prices supported not by strong inflows or genuine spot demand, but by leverage-driven speculation. This type of rally is inherently unstable. If leverage continues climbing at these extreme levels, the market becomes increasingly vulnerable to a sharp liquidation-driven sell-off should prices pull back.

However, there is an alternative path. If ETH’s price continues to build momentum while the leverage ratio cools slightly, the market could regain a healthier structure—providing a more durable foundation for a sustained upward trend. For now, the estimated leverage ratio remains one of the most critical indicators for evaluating Ethereum’s short-term direction.

ETH Price Action Details

Ethereum’s latest rejection near the $3,350–$3,400 zone highlights the challenges bulls face as the broader trend remains pressured. The chart shows ETH pulling back toward the $3,200 area after a sharp attempt to break above the 100-day moving average (red line). This level continues to act as a major dynamic resistance, repeatedly capping upside momentum throughout November and December.

ETH testing critical resistance | Source: ETHUSDT chart on TradingView

Despite the recent recovery from sub-$2,900 lows, ETH has not yet reclaimed the 50-day moving average (blue line) with conviction. The inability to close decisively above it reinforces the idea that this bounce remains corrective rather than impulsive. Meanwhile, volume on the latest push upward has been modest, suggesting that buyers are not entering aggressively at these levels.

On the downside, the $3,050–$3,100 region is emerging as short-term support. A daily close below this zone could open a path back toward $2,900, especially if risk sentiment deteriorates post-FOMC. Conversely, reclaiming and holding above $3,350 would be the first sign of renewed bullish strength, potentially targeting $3,550 next.

Featured image from ChatGPT, chart from TradingView.com

Bitcoin Whales Refuse to Sell: Historic Signal Emerges As Binance CDD Drops To 2017 Levels

Bitcoin has retraced below the $91,000 level following the Federal Reserve’s decision to cut interest rates by 25 basis points, a move that initially generated volatility across risk assets. While the market’s reaction has leaned bearish in the short term, on-chain data tells a very different story beneath the surface.

According to new insights from CryptoQuant, one of the most striking signals comes from the Exchange Inflow Coin Days Destroyed (CDD) metric on Binance, which has fallen sharply to 380, its lowest reading since September 2017.

CDD is one of the most important indicators for understanding long-term holder behavior because it assigns greater weight to older coins that have accumulated more “coin days.” Low values mean that the BTC moving onto exchanges is predominantly from short-term traders, not long-term holders.

In other words, veteran holders — the investors who historically move markets — are refusing to sell, even as Bitcoin trades near cycle highs.

Long-Term Holders Signal Strong Conviction

CryptoOnchain highlights that the significance of this CDD collapse becomes far clearer when viewed against Bitcoin’s current price context. With BTC trading near $89,600, the market is witnessing an unusually large divergence between price action and long-term holder behavior.

Historically, when Bitcoin approaches or surpasses all-time highs, long-held coins tend to move — triggering spikes in CDD as early investors and whales take profits. This pattern has repeated across past cycles, making elevated CDD a classic top-signal.

Bitcoin Exchange Inflow CDD | Source: CryptoQuant

But this time, the exact opposite is happening. Instead of old coins entering exchanges, Exchange Inflow CDD is collapsing, indicating that almost none of the BTC being deposited onto Binance comes from long-term wallets. CryptoOnchain explains that this phenomenon strongly suggests that Smart Money and long-term whales have zero interest in selling at these levels, even after a multi-month correction.

This refusal to distribute supply removes a major source of overhead resistance and reflects a market dynamic driven increasingly by strong hands. The absence of long-term sell pressure reduces the available liquid supply, often preceding powerful bullish expansions. In simple terms, whales are signaling confidence — not caution — despite short-term volatility, reinforcing the narrative that Bitcoin may be preparing for its next major move.

Bitcoin Price Action: Testing Support Amid Weak Momentum

Bitcoin’s 3-day chart shows the market stabilizing just above the $90,000 level after last week’s sharp post-FED decline. Price remains compressed between the 200-day moving average (red line)—currently acting as primary support—and the 100-day moving average (green line) overhead, which continues to cap upward momentum. This creates a classic squeeze structure where BTC is holding its ground but struggling to reclaim lost trend levels.

BTC consolidates around key level | Source: BTCUSDT chart on TradingView

The recent candle structure highlights a series of higher lows forming near the $89K–$90K region, suggesting buyers are defending this zone as a short-term floor. However, the rejection from the 100-day MA reinforces the broader bearish shift, as BTC remains below both key trend indicators and is yet to reclaim the breakdown level around $100K.

Volume also tells an important story: despite the bounce, buy-side conviction appears weak. The rebound has not been accompanied by a spike in demand, indicating that market participants are cautious following the rate cut and macro uncertainty.

If Bitcoin loses the 200-day MA, the next major support lies closer to $84K, which would open the door to a deeper retracement. Conversely, a decisive close above the 100-day MA near $98K would signal momentum returning to the bulls. For now, BTC remains in a fragile consolidation with limited directional strength.

Featured image from ChatGPT, chart from TradingView.com

This Whale Isn’t Stopping: $392M Ethereum Long And A Tight Liquidation Price Revealed

Ethereum has retraced to the $3,160 level following the highly anticipated FOMC meeting, where the Federal Reserve cut interest rates by 25 basis points. While rate cuts typically support risk assets, Jerome Powell’s comments added a new layer of uncertainty to the market.

By openly acknowledging the risks of weaker growth paired with persistent inflation, Powell introduced the possibility of stagflation—a scenario that historically challenges both equities and crypto. As a result, sentiment across the market remains fragile, and investors are struggling to interpret what this macro shift could mean for Ethereum’s next move.

Despite the volatility surrounding the decision, one major whale continues to act with conviction. According to Lookonchain, the Bitcoin OG who famously shorted the market during the October 10 crash is once again doubling down on his bullish Ethereum position.

Instead of taking profits or reducing exposure after the recent rally, he has continued accumulating aggressively, signaling a strong belief in ETH’s medium-term trajectory even as broader sentiment turns cautious.

Whale Position Ramps Up, But Risk Is Rising

According to Lookonchain, the whale’s position has now surged to 120,094 ETH, valued at approximately $392.5 million. With a liquidation price at $2,234.69, this has become one of the largest and most aggressive long positions currently tracked on-chain.

Bitcoin OG Ethereum Position | Source: Hyperdash

Such a massive allocation signals extreme conviction, especially coming from the same Bitcoin OG who successfully shorted the market during the October 10 crash. However, the scale of this bet also highlights how much risk is now concentrated in a single directional position.

The liquidation price is a key concern. At $2,234, it sits nearly $1,000 below current levels, but in highly leveraged environments—especially during macro uncertainty—prices can retrace violently. Ethereum has already shown a tendency toward sharp intraday moves, and with funding rates rising and leverage across the market stretching to historical highs, even a moderate correction could trigger cascading liquidations.

If ETH experiences a sudden spike in volatility due to shifting macro conditions, a negative reaction to the latest FOMC decision, or a broader market unwind, the whale’s position could come under significant pressure. While large whales often influence market sentiment, this setup illustrates how thin the margin for error has become.

ETH Testing Resistance While Momentum Weakens

Ethereum has retraced to the $3,196 level after failing to hold above the $3,300 zone, signaling that bullish momentum is beginning to weaken. The daily chart shows ETH rejecting the red 200-day moving average, a key long-term trend indicator that has acted as resistance throughout the recent downtrend. Until ETH breaks and closes decisively above this level, the broader structure remains vulnerable.

ETH consolidates below key resistance | Source: ETHUSDT chart on TradingView

The 50-day moving average is still sloping downward, reflecting persistent selling pressure despite last week’s rebound. Meanwhile, the 100-day moving average sits well above the current price, reinforcing the heavy overhead resistance ETH must overcome to reestablish a bullish trend. Volume has also declined compared to the early December bounce, suggesting buyers are losing strength as price approaches major resistance levels.

Related Reading: Bitcoin Exchange Reserves Fall To Lowest Levels on Record: The Bullish Signal Most Traders Are Missing

Structurally, ETH remains in a mid-term downtrend, forming lower highs and lower lows since September. Although the recent push from the $2,800 region shows buyers defending key support, the rejection at $3,350 highlights that sellers are still in control at higher levels.

If ETH fails to regain the 200-day moving average soon, a retest of the $3,050–$3,100 support range becomes likely. Conversely, a strong reclaim above $3,350 could open the door for a move toward $3,500, but the market will need renewed momentum to get there.

Featured image from ChatGPT, chart from TradingView.com

Ethereum Net Taker Volume Bottoms Rise: A Repeat Of The 2025 Pre-Rally Setup?

Ethereum has retraced below the $3,200 level following the Federal Reserve’s decision to cut interest rates by 25 basis points, a move that initially sparked volatility across the crypto market. While many expected a stronger reaction from Ethereum, the asset instead slipped lower as traders reassessed the macro environment and the implications of a potential shift toward stagflation. Despite this pullback, on-chain data suggests that the underlying market structure may be quietly improving.

According to new insights from CryptoQuant, Ethereum’s Net Taker Volume (30-day moving average) is showing a clear upward trend in its lows. This metric tracks the balance between aggressive buyers and sellers in the derivatives market. Although ETH remains under selling pressure, the data reveals that the intensity of aggressive selling has been weakening steadily over the past several weeks. Each subsequent negative low is forming higher than the previous one, signaling that sellers are losing dominance.

While the broader sentiment remains cautious, subtle improvements in Net Taker Volume suggest that ETH’s current weakness may be masking the early stage of a larger structural shift.

Net Taker Volume Signals a Potential Structural Shift

According to CryptoQuant’s CoinCare, Ethereum may once again be approaching a pivotal turning point. The report highlights that a similar Net Taker Volume structure appeared earlier this year. After forming a clear bottom in January 2025, the metric began to trend upward—even while remaining in the negative zone—indicating that aggressive sellers were gradually losing strength.

Ethereum Net Taker Volume | Source: CryptoQuant

By April, Net Taker Volume flipped decisively into positive territory. From that exact moment, Ethereum entered one of its strongest rallies of the cycle, surging more than 3x and printing a new all-time high.

Current conditions echo that same pattern. Since the peak of selling pressure in September, the market has continuously absorbed sell flows for nearly three months. Each negative low in Net Taker Volume has formed higher than the previous one, revealing improving market resilience despite the broader downtrend. If this trajectory holds, CoinCare estimates that a positive flip in Net Taker Volume may be only about a month away.

Historically, this transition from negative to positive has marked the beginning of Ethereum’s most explosive breakout phases. A confirmed move into positive territory would represent a high-probability trigger for the next expansion toward new all-time highs, signaling that momentum is quietly rebuilding beneath the surface.

ETH Weekly Structure Attempts a Recovery

Ethereum’s weekly chart shows the market attempting to stabilize after several weeks of volatility, with price currently trading near $3,195 following a strong rebound from the $2,800 zone. This area acted as a key demand region in mid-2024 and has once again provided support, preventing a deeper breakdown. The recent weekly candle reflects renewed buying interest, closing firmly above the 50-week moving average, a level that often defines medium-term trend direction.

ETH consolidates around key level | Source: ETHUSDT chart on TradingView

Despite this rebound, ETH still faces structural challenges. The 100-week moving average — now overhead — has acted as resistance throughout the current downtrend, and the price rejected it again on the latest push toward $3,447. Until Ethereum can reclaim this dynamic resistance with conviction, the broader trend remains neutral to slightly bearish.

Volume also shows a notable shift: sell-side activity has been declining over the past month, while buyers are beginning to step in more aggressively at key support levels. This aligns with the improvement in on-chain metrics, suggesting weakening selling pressure.

For bulls, the next major objective is a weekly close above $3,400, which would signal a potential trend reversal. A failure to break this level, however, risks another retest of $2,900–$2,800, where market sentiment would again be tested.

Featured image from ChatGPT, chart from TradingView.com

Crypto Hedge Funds Retreat To Stablecoins Ahead of Rate Cut – Data Warns of a Familiar Pattern

Bitcoin is holding firm above the $92,000 level after rebounding from a brief dip to $90,000, but market sentiment remains decisively bearish. Despite the crypto market stabilization, confidence is fragile as traders brace for heightened volatility ahead of the December FOMC meeting. Bulls are attempting to regain momentum, yet the broader market continues to position defensively.

According to a detailed report by XWIN Research Japan, crypto hedge funds and large institutional players are shifting into clear risk-off mode. On-chain data reveals a notable divergence: BTC balances on centralized exchanges are falling, while USDT and USDC reserves are steadily climbing.

This behavior indicates that professional investors are reducing direct crypto market exposure and instead building up stablecoin liquidity on exchanges—capital that can be deployed rapidly depending on the FOMC outcome.

This rise in Stablecoin Exchange Reserves is a textbook sign of event-driven hedging. Institutions are preparing for volatility rather than betting outright on a directional move. Historically, such positioning emerges when markets expect meaningful policy decisions that could reshape short-term liquidity conditions.

Funding Rates Reveal the Market’s True Positioning

According to the XWIN Research Japan report, Funding Rates make the current crypto market structure even clearer. During the August–October 2025 period, funding surged as short-term traders aggressively loaded into long positions ahead of the FOMC decision, only to collapse sharply once the announcement was released.

Bitcoin’s price followed the same pattern: a strong pre-event rally driven by expectations, followed by a swift reversal as leveraged traders were forced to unwind. This fits the historical sequence of rate-cut expectations followed by a temporary rally, and a post-announcement deleveraging and decline.

The report highlights that today’s crypto market is showing similar behaviors. CME futures open interest has stalled, signaling that institutional traders are avoiding high-conviction directional bets. Whale spot holdings remain flat, suggesting that major players are positioned defensively rather than accumulating. At the same time, stablecoin inflows are accelerating, a hallmark of event-driven hedging as capital waits on the sidelines for clarity.

Bitcoin Funding Rates | Source: CryptoQuant

As XWIN Research Japan notes, whether the Fed cuts rates or not, one pattern remains consistent: volatility expands sharply during FOMC week. The danger lies in chasing the pre-meeting bounce without respecting the historical tendency for post-announcement shakeouts. In this environment, risk management—not prediction—is the winning strategy.

Total Crypto Market Cap Holds Key Support But Lacks Momentum

The Total Crypto Market Cap chart shows the market stabilizing around the $3.1 trillion level after a sharp multi-week decline. This area sits just above the 100-week moving average, a historically important dynamic support zone that often defines whether the broader cycle maintains bullish structure or shifts into deeper corrective territory. For now, buyers have stepped in to defend this region, preventing a breakdown that could have opened the door to a retest of the $2.7T–$2.8T area.

Crypto Total Market Cap | Source: TOTAL chart on TradingView

Despite the bounce, the structure remains fragile. The market is still trading below the 50-week moving average, which has now begun to bend downward—a sign that momentum has weakened across major assets like Bitcoin, Ethereum, and key altcoins. Volume has not shown a strong surge on the rebound either, suggesting that institutional conviction remains cautious ahead of the FOMC meeting and macro uncertainty.

A decisive reclaim of the $3.3T–$3.4T zone would shift momentum back in favor of bulls, opening room for a broader recovery. However, failure to break above this cluster of resistance could reinforce the idea that the recent bounce is only corrective. For now, the total market cap hovers at a crossroads, with macro events likely to determine the next major move.

Featured image from ChatGPT, chart from TradingView.com

The Whale Who Can’t Stop Buying: BitcoinOG Scales Ethereum Long To $280M After Price Surge

Ethereum is trading with renewed strength after breaking above the $3,300 level and briefly pushing toward $3,400, signaling a potential shift in short-term momentum. However, despite this recovery, bullish conviction remains fragile. Many analysts continue to warn that the broader trend still leans bearish, emphasizing that Ethereum has yet to reclaim the structural levels needed to confirm a macro reversal.

Yet one signal has captured significant attention: according to fresh data from Lookonchain, a major whale known as BitcoinOG has doubled down on his Ethereum long position. This trader is widely recognized for being the whale who successfully shorted Bitcoin during the October 10 market crash, a move that earned him substantial profits and elevated his reputation across the on-chain analysis community.

Rather than taking profits after ETH’s recent pump, he has expanded his long exposure—an unusually aggressive stance at a time when most traders remain cautious.

His renewed commitment raises questions about whether smart money is quietly positioning for a larger upside move, even as broader sentiment remains skeptical. If momentum holds, Ethereum may be preparing for a far more significant move than the market currently expects.

Whale Positioning and FOMC Impact

According to Lookonchain, the whale known as BitcoinOG has now expanded his position to 85,001 ETH, valued at roughly $280 million, and is currently sitting on more than $16 million in unrealized profit. Such an aggressive accumulation during a period of widespread caution signals a notable divergence between retail sentiment and whale behavior.

BitcoinOG Ethereum Position | Source: Lookonchain

When a trader with a proven track record positions this heavily on the long side, it often reflects a strategic conviction that market conditions could soon shift in favor of higher prices.

However, this positioning unfolds just as the market approaches a pivotal macro event: the FOMC meeting. The Federal Reserve’s decision on interest rates can dramatically influence liquidity, risk appetite, and short-term volatility across all risk assets, including Ethereum.

A rate cut could inject optimism into the market by weakening the US dollar and improving overall liquidity conditions. Conversely, a hawkish tone or a smaller-than-expected policy adjustment could trigger a sell-the-news reaction, especially with ETH nearing resistance.

For Ethereum, whale accumulation combined with macro uncertainty creates a high-stakes environment. If liquidity expands post-FOMC, ETH could gain momentum. If not, even strong whale positions may face short-term pressure.

ETH Testing Breakout Strength Ahead of Key Resistance

Ethereum’s 4-hour chart shows a decisive shift in momentum, with ETH pushing firmly above the $3,300 level after a clean breakout from its multi-week downtrend. This move marks one of the strongest bullish impulses since early November, supported by rising volume and a clear reclaim of the 50 EMA and 100 EMA.

The 200 EMA (red), which previously acted as dynamic resistance throughout the decline, has now been tested and is beginning to flatten—often an early indication that bearish momentum is losing dominance.

ETH setting a fresh high | Source: ETHUSDT chart on TradingView

However, ETH is now hovering directly below a critical resistance zone around $3,380–$3,420, a level where sellers previously stepped in aggressively. The current consolidation just beneath this zone reveals an undecided market: bulls attempt to establish acceptance above $3,300, while bears defend the next resistance layer.

If buyers manage to flip $3,320 into solid support, the path toward $3,500 becomes more achievable, especially if broader market sentiment improves. Conversely, a rejection from the $3,400 area could trigger a short-term pullback toward $3,200–$3,250, where moving averages are now stacked as layered support.

Featured image from ChatGPT, chart from TradingView.com

Pre-FOMC Tension: Will Bitcoin Repeat Its Post-Cut Pattern?

Bitcoin is holding firm above the $92,000 level after rebounding from last week’s dip toward $90,000, offering bulls a brief moment of relief. Yet despite this stabilization, market sentiment remains decisively bearish, with many traders expecting further downside unless a clear shift in momentum emerges. The timing couldn’t be more crucial: the Federal Reserve’s upcoming rate decision has become the central focus for investors, and the market is bracing for heightened volatility.

According to a new CryptoQuant report, Bitcoin’s historical behavior around rate cuts offers meaningful context. Over the years, Fed interest rate cuts have generally aligned with upward movements in BTC, largely because lower rates weaken the US dollar, stimulate liquidity, and support risk assets. However, the report highlights an important nuance—the immediate reaction is rarely straightforward.

In several past instances, Bitcoin rallied ahead of rate cuts, only to show muted or even negative price action once the decision was announced, indicating that markets had already priced in the move.

This dynamic creates a layer of uncertainty heading into the FOMC meeting. While macro conditions align with long-term bullish trends for Bitcoin, the short-term outlook remains fragile, shaped by sentiment, positioning, and the market’s anticipation rather than the announcement itself.

Historical Patterns Signal Caution Ahead of the FOMC

According to the report by GugaOnChain on CryptoQuant, Bitcoin’s past reactions to Federal Reserve rate cuts offer a clear framework for understanding the risks heading into this week’s FOMC meeting. The historical data paints a picture of mixed and often counterintuitive behavior.

For example, following the 25 basis point cuts in September 2025, Bitcoin barely reacted at all. In another instance, BTC surged to a four-week high—only to drop nearly $2,000 shortly after, settling into a period of muted stability. These reactions underscore how quickly sentiment can shift once policy decisions are fully priced in.

Volatility has also played a defining role. Both the September and October rate decisions triggered brief pre-FOMC rallies, followed by notable declines once the announcements were made. After the September cut, volatility spiked sharply as traders unwound leveraged positions, revealing how sensitive Bitcoin remains to event-driven positioning.

Bitcoin Open Interest | Source: CryptoQuant

This leads to the recurring “buy the rumor, sell the news” pattern, a dynamic that GugaOnChain warns could repeat. Because of this, monitoring market leverage—including funding rates and open interest—is crucial. Equally important are liquidity flows, such as exchange reserves and ETF activity. Together, these indicators help traders anticipate short-term price movements as Bitcoin prepares for another potentially volatile macro event.

Testing Recovery but Still Below Key Trend Levels

Bitcoin’s weekly chart shows the market attempting to stabilize above the $92,000 level after a sharp multi-week correction from the $120,000 region. The recent rebound from the $89,000–$90,000 zone highlights strong demand at the 100-week moving average (green line), which is currently acting as a critical dynamic support.

Historically, this MA has served as a structural backbone for Bitcoin during mid-cycle pullbacks, and the latest bounce reinforces its relevance.

BTC consolidates around key level | Source: BTCUSDT chart on TradingView

However, despite the recovery, BTC remains firmly below the 50-week moving average (blue line), a level that previously marked bullish continuation phases throughout 2024 and early 2025. Until price reclaims this region—now sitting near $100,000—the broader market structure leans corrective rather than impulsively bullish. The lower highs formed since the peak also suggest that bears still retain control over the medium-term trend.

Volume behavior adds another layer: although buying volume has picked up modestly, it remains significantly weaker than the aggressive selling pressure seen during the November–December decline. This indicates that buyers are showing interest, but conviction has yet to return in full force.

Featured image from ChatGPT, chart from TradingView.com

Why Ethereum’s Rally Isn’t Overheated – And Where Demand Must Grow Next

Ethereum has pushed above the $3,350 level, injecting fresh momentum into the market after weeks of uncertainty. Yet despite this breakout, overall sentiment remains clouded by fear, with many analysts still warning that the broader structure points toward a developing bear market. Traders now find themselves at a pivotal juncture: is this the beginning of a sustained recovery, or merely a temporary rally before further downside?

According to a new CryptoQuant report, one of the most revealing indicators right now is Ethereum’s funding rate behavior across major exchanges. Unlike the explosive funding spikes seen during the two major rallies earlier this year, the current move shows a remarkably restrained funding environment. During those earlier surges, funding rates climbed aggressively into overheated territory, signaling euphoric long leverage and speculative excess — conditions that closely preceded short-term market tops.

This time, however, funding remains far more subdued. The absence of aggressive long positioning suggests that the current rally is not being driven by excessive leverage, which gives the move a different character compared to earlier spikes. Whether this signals healthier accumulation or simply a lack of conviction remains the core question as Ethereum approaches the next decisive phase.

Muted Funding Rates Highlight a Cautious But Potentially Constructive Rally

The CryptoQuant report highlights that, unlike previous explosive rallies, Ethereum’s current funding rates remain unusually low, even after its sharp recovery from the $2.8K region. This subdued funding environment signals that the derivatives market is not yet saturated with speculative long positions.

Buyers are stepping in, but modest leverage drives this move compared to past phases dominated by aggressive traders. Consequently, spot accumulation drives the current advance more than overheated futures activity.

Ethereum Funding Rates | Source: CryptoQuant

This difference carries important implications. Without a surge in speculative demand, Ethereum may struggle to ignite the kind of full bullish continuation leg seen in earlier breakout cycles. Historically, strong uptrends have required funding rates to expand meaningfully as traders chase price, forcing shorts to cover and fueling upward momentum. That behavior has not yet emerged in the current structure.

However, this muted landscape is not inherently bearish. Instead, it reflects a recovering market, not an overextended one. This leaves Ethereum with room to climb further — if demand strengthens. At the same time, the lack of leverage means the rally remains vulnerable; strong resistance rejections could quickly weaken momentum unless fresh buyers step in.

Testing Key Resistance as Momentum Builds

Ethereum’s daily chart shows a notable shift in momentum as the price pushes toward $3,320, extending its rebound from the sub-$2,800 lows. This recovery phase has been steady rather than explosive, reflecting a market that is stabilizing but still facing key overhead challenges.

ETH testing critical resistance level | Source: ETHUSDT chart on TradingView

The first major test is the 200-day moving average (red line), which ETH is now approaching after several weeks of trading below it. Historically, reclaiming this level has marked the transition from corrective phases into renewed bullish cycles, but a clean breakout is far from guaranteed.

The structure of the recent move highlights improving buyer confidence: ETH has formed a series of higher lows, indicating accumulation after the capitulation-like November drop. Although buyers are active, the relatively subdued volume profile suggests they lack broad-based conviction. A stronger influx of volume must flip the trend decisively bullish.

The 50-day and 100-day moving averages remain above the current price and are both aligned downward, reinforcing that ETH is still technically in a broader downtrend. For momentum to extend, Ethereum must break above the $3,350–$3,400 resistance zone, where prior support turned into resistance.

Featured image from ChatGPT, chart from TradingView.com

Bitcoin Exchange Reserves Fall To Lowest Levels on Record: The Bullish Signal Most Traders Are Missing

Bitcoin is holding above $90,000 as the market heads into a highly anticipated FOMC meeting, a moment that could define the next direction for risk assets. But while price action keeps traders on edge, on-chain indicators are painting a surprisingly different picture beneath the surface. According to a new CryptoQuant report by XWIN Research Japan, Bitcoin’s exchange reserves have continued to fall sharply throughout 2025, even as price corrected toward the $90K range.

The data shows that the total amount of BTC held on centralized exchanges has dropped to 2.76 million BTC, reaching one of the lowest levels ever recorded. What makes this trend even more striking is its timing: during the steep November–December sell-off, exchange balances did not rise—they fell faster. The report highlights this behavior in the red-marked zone of the chart, showing accelerating outflows while the price was dropping.

This pattern signals something unusual: investors are not sending coins to exchanges to sell into weakness. Instead, they continue withdrawing BTC into long-term custody, suggesting confidence rather than capitulation. As volatility builds ahead of the FOMC decision, the contrast between short-term price fear and long-term accumulation is becoming one of the most important dynamics in the current Bitcoin market.

Shrinking Exchange Reserves Signal Structural Strength

The report emphasizes that Bitcoin’s rapidly shrinking exchange reserves carry important structural implications for the market. When fewer coins sit on centralized exchanges, it means less Bitcoin is available for immediate sale, effectively tightening the liquid supply. According to the data, this decline is not being driven by short-term speculators but by long-term holders and institutional entities steadily moving BTC into self-custody or cold storage.

Bitcoin Exchange Reserve | Source: CryptoQuant

What makes this trend remarkable is its timing. Historically, sharp price declines trigger a wave of inflows to exchanges as investors prepare to sell or panic-exit their positions. This cycle, however, tells a very different story. Even as Bitcoin corrected into the $90K region, exchange balances kept falling, suggesting that buyers with a long-term outlook are actively accumulating rather than retreating.

This divergence between price action and on-chain behavior signals underlying strength. While short-term volatility may continue—especially around macro catalysts like the FOMC meeting—the broader structure points toward a market quietly tightening its available supply. As reserves move toward historic lows, a future “supply shock” becomes increasingly plausible.

Despite the weak spot market performance, on-chain metrics are slowly turning bullish, hinting that the foundation for the next major trend may already be forming beneath the surface.

BTC Tests Critical Support as Market Awaits Direction

Bitcoin’s price action on the 3-day chart shows a market attempting to stabilize after a sharp corrective phase. BTC is currently trading around $90,437, hovering just above the 200-day moving average — a level that has historically acted as a major dynamic support during mid-cycle retracements. The recent bounce from the $87K–$88K region suggests that buyers are defending this zone, but the structure remains fragile as long as the price stays below the 50-day and 100-day moving averages, both of which are now sloping downward.

BTC consolidates around key level | Source: BTCUSDT chart on TradingView

The chart reveals a clear shift in momentum. After months of steady higher lows, Bitcoin broke its ascending structure in late November, leading to a fast drop toward the high-$80K range. Volume increased during the decline, indicating stronger participation on the sell side. However, the subsequent candles show shrinking sell volume, hinting at exhaustion among short-term sellers.

For a meaningful recovery, BTC must reclaim the $95K–$97K area, where previous support turned into resistance. Failure to break that zone would likely keep the market in a consolidation phase, with risks of another retest of the 200-day MA.

Featured image from ChatGPT, chart from TradingView.com

Classic Bitcoin Buy Signal Returns: Are Miners Hinting The Next Accumulation Phase?

Bitcoin is trading at a decisive moment, holding just above the $90,000 mark after several days of tight consolidation. Despite reclaiming this key level, the market continues to struggle with upward momentum, leaving traders uncertain about the next major move. Yet beneath the surface, a key on-chain indicator has triggered fresh interest among analysts. According to top analyst Darkfost, the Hash Ribbons have just flashed a new buy signal — a development that historically aligns with strong medium-term performance for Bitcoin.

Darkfost emphasizes that this signal is not a cue to rush blindly into the market, but rather a meaningful piece of data worth highlighting. Hash Ribbon signals typically appear during periods of miner stress, when mining difficulty forces weaker miners to shut down.

These moments often precede significant accumulation phases, as selling pressure from distressed miners fades. With the exception of the unprecedented 2021 mining ban in China, every previous Hash Ribbon buy signal has produced profitable outcomes for patient investors.

Understanding The Bitcoin Hash Ribbons Signal

Darkfost explains that the Hash Ribbons indicator is built around the evolution of Bitcoin’s hashrate, comparing the 30-day and 60-day moving averages to detect periods of miner stress. When the 30-day MA of the hashrate falls below the 60-day MA, it signals that mining difficulty is rising relative to miner profitability.

In these phases, less efficient miners are often forced to scale back operations or shut down entirely, reducing the overall network hashrate.

Bitcoin Hash Ribbons | Source: CryptoQuant

While mining difficulty itself is influenced by several factors — including electricity costs, hardware efficiency, block rewards, and, of course, Bitcoin’s price — the key point is that miner capitulation tends to create short-term selling pressure. Miners may liquidate part of their reserves to stay afloat, often contributing to temporary weakness in the market.

However, Darkfost emphasizes that these periods of stress historically present strong mid-cycle accumulation opportunities. As weaker miners exit and difficulty adjusts downward, the market often enters a healthier phase where selling pressure subsides, and long-term participants begin to accumulate BTC at discounted prices.

Over the years, Hash Ribbon buy signals have frequently marked early stages of major recoveries, offering investors a structural, data-driven advantage even when sentiment appears uncertain.

Testing Support as Momentum Weakens

Bitcoin continues to trade just above the $90,000 level, showing signs of stabilization after several weeks of heavy downside momentum. The chart reveals that BTC has bounced off the 100-day moving average (green), which is now acting as a key dynamic support zone. This level has historically served as an important midpoint during major pullbacks, and the market’s ability to hold above it suggests that selling pressure may be easing.

BTC testing long-term support | Source: BTCUSDT chart on TradingView

However, the price remains well below the 50-day moving average (blue), which has begun to curve downward — a signal that short-term momentum still leans bearish. For a stronger recovery, Bitcoin must reclaim this moving average and convert it into support. Until then, rallies may struggle to extend meaningfully.

Volume has also compressed significantly compared to the earlier stages of the uptrend. This decline indicates hesitation from both buyers and sellers, often typical during consolidation phases following sharp corrections. The lack of aggressive selling is a constructive sign, but the absence of strong buy-side interest keeps BTC vulnerable to further swings.

If Bitcoin holds above the $90K–$88K area, it could build a base for a broader rebound. A breakdown below this region, however, would open the door to deeper retracements toward the mid-$80K range.

Featured image from ChatGPT, chart from TradingView.com

Bitcoin OG Doubles Down On Ethereum With A Massive $209.8M Long – Find Out His Liquidation Price

Ethereum is holding above the $3,000 level for the fourth consecutive day as the market enters a decisive week dominated by the upcoming FOMC meeting. Traders are cautiously positioning ahead of the Federal Reserve’s announcement, aware that liquidity signals and rate expectations could determine whether this recovery continues—or breaks down.

Despite the recent stabilization, fear remains firmly in control. Many analysts warn that if ETH loses the $3K floor, the market could face a deeper retracement, especially with volatility expected to spike around the macro event.

Amid this uncertainty, on-chain data from Lookonchain has revealed a striking development: BitcoinOG, the same whale who famously shorted the market during the violent October 10 crash, has now dramatically increased his bullish exposure to Ethereum. According to the data, he has ramped up his long position to 67,103.68 ETH, valued at approximately $209.8 million.

Whale Positioning Adds a New Layer of Volatility

According to Lookonchain, the BitcoinOG whale is now sitting on more than $4 million in unrealized profit from his massive Ethereum long. His position of 67,103.68 ETH, currently valued at over $209 million, comes with a liquidation price of $2,069.49, a level far below current market conditions but still within the realm of possibility if macro pressure intensifies.

BitcoinOG Whale Ethereum Long Position | Source: Lookonchain

This liquidation threshold is especially important because it reveals the whale’s risk appetite and how aggressively he’s leveraging this bet. A liquidation level near $2,070 implies confidence that Ethereum won’t revisit its deeper range lows, even as the market remains fragile ahead of the FOMC meeting. It also shows he has a significant margin buffer behind the trade, suggesting strategic positioning rather than impulsive speculation.

However, large leveraged positions can act as double-edged swords for the broader market. If price begins trending toward his liquidation zone, cascading liquidations across other longs could accelerate downside momentum. Conversely, whales with deep pockets often defend key levels to protect their positions.

ETH Higher-Timeframe Trend Remains Fragile

Ethereum’s weekly chart shows the market fighting to stabilize above the $3,000–$3,150 zone, a level that now acts as the primary support band after weeks of heavy selling. The recent bounce from the mid-$2,700s has created a short-term relief structure, but ETH still trades well below its 50-week moving average, which is beginning to curl downward—a signal that the broader trend is losing momentum.

ETH consolidate around key level | Source: ETHUSDT chart on TradingView

The chart highlights a clear pattern: each rebound over the past six months has produced lower highs, reflecting persistent seller dominance whenever ETH approaches the $3,500–$3,800 region. This repeated rejection zone marks a key resistance cluster that bulls must reclaim to shift the medium-term outlook back toward bullish continuation.

Volume also remains relatively muted compared to earlier stages of the cycle, suggesting that current buying interest is hesitant. Without a surge in spot demand, rallies may continue to fade quickly.

On the positive side, ETH has reclaimed the 200-week moving average, an important long-term support that historically acts as a pivot between macro bull and bear phases. As long as this level holds, Ethereum retains structural strength.

ETH is in a neutral-to-bearish consolidation, and a decisive weekly close above $3,300 is needed to confirm regained momentum.

Featured image from ChatGPT, chart from TradingView.com

Ethereum Sees Largest Binance Inflow Since 2023 – Warning Sign?

Ethereum has spent the past several days consolidating in a tight range between $3,000 and $3,200, signaling a moment of hesitation as the broader market struggles to find direction. Despite attempts to push higher, momentum has flattened, and uncertainty continues to dominate sentiment. Many analysts now warn that Ethereum may be entering a deeper bearish phase, pointing to weakening spot demand, fragile market structure, and fading optimism across major exchanges.

However, one on-chain development has captured the market’s attention. According to new data from CryptoQuant, December 5, 2025 saw a massive spike in Ethereum Exchange Netflow to Binance, marking one of the largest daily inflows in years. Such a surge typically raises questions about investor intentions: large inflows often signal that holders are moving ETH onto exchanges with the potential to sell, increasing the probability of short-term volatility or downside pressure.

Yet the broader context matters. Ethereum’s price remains above key support, suggesting that the market is in a critical decision zone rather than a confirmed breakdown. This combination of consolidation, rising caution, and an unusually large exchange inflow sets the stage for what could become a pivotal moment for ETH as traders prepare for the next major move.

Massive Netflow Surge Raises Caution for Ethereum

According to data from CryptoOnchain shared on CryptoQuant, Ethereum experienced a striking shift in exchange activity on December 5, 2025. The netflow to Binance reached 162,084 ETH while the price hovered near $3,021, marking the largest daily positive netflow since May 2023. Such an influx is significant, not only because of its size but because of what it typically signals: a rise in the number of investors moving ETH from self-custody to exchanges.

Ethereum Exchange Netflow on Binance | Source: CryptoQuant

Historically, large positive netflows are interpreted as potentially bearish, suggesting that holders may be preparing to sell or rebalance. When deposits drastically outweigh withdrawals, it can precede heightened selling pressure, especially when the market is already in a fragile state. Inflows of this magnitude can act as a temporary supply shock; if even a portion of this ETH hits the order books as market sells, the price could face increased volatility or short-term corrective pressure.

Because of this, traders should closely monitor how Binance absorbs this liquidity. Watching order book depth, open interest reactions, and subsequent netflow patterns will reveal whether this was a one-off spike or the beginning of a broader shift in investor behavior. In a market this delicate, even a single inflow event can set the tone for the days ahead.

ETH Price Attempts Stabilization

Ethereum’s daily chart shows a market in the process of stabilizing, but still weighed down by significant structural resistance. After dipping below $2,800 in late November, ETH has managed to reclaim the $3,100 region, where it has been consolidating for several days. This range-bound behavior signals a pause in the prior downtrend, yet the recovery lacks the strong momentum typically seen in bullish reversals.

ETH consolidates between key levels | Source: ETHUSDT chart on TradingView

The 50-day and 100-day moving averages remain positioned above the current price, forming a clear zone of resistance between $3,250 and $3,500. These declining MAs highlight that the broader trend still favors sellers, and ETH will need a decisive breakout above them to shift market sentiment. The 200-day MA, sitting higher, reinforces the idea that Ethereum is still trading below its long-term trend structure.

Volume has also weakened during this rebound, suggesting that buyers are hesitant to commit aggressively at current levels. The recent spike in exchange netflows adds another layer of caution, raising the possibility of increased near-term selling pressure.

ETH is showing early signs of stabilization, but the path forward requires stronger conviction. Until price breaks above the cluster of moving averages, this recovery remains fragile and vulnerable to renewed downside pressure.

Featured image from ChatGPT, chart from TradingView.com

FOMC Week Playbook: Bitcoin Has Followed the Same Pattern Twice—Will History Repeat?

Bitcoin started the week attempting to reclaim the $92,000 level, a move that hints at early signs of recovery after weeks of volatility and uncertainty. This renewed strength arrives at a critical moment for global markets, as investors turn their attention to one event: the upcoming FOMC meeting. According to a new CryptoQuant report by XWIN Research Japan, the central question is whether the Federal Reserve will finally begin cutting interest rates—a decision that could reshape market expectations heading into 2026.

Historical data provides an important context. During the last two rate-cut announcements on September 17 and October 29, Bitcoin followed a strikingly similar pattern. Prices climbed in the days leading up to each meeting, reflecting optimism and speculation.

Immediately after the announcements, the market experienced a brief bounce, only to fall sharply soon after. This behavior highlights a common reaction in macro-driven markets: although rate cuts are usually seen as bullish, they often fuel a “buy the rumor, sell the news” dynamic in the short term as traders lock in profits.

With Bitcoin hovering below major resistance and macro uncertainty rising again, the coming days may determine whether this attempted recovery evolves into momentum—or fades into another corrective swing.

Market Positioning Meets Macro Reality

Rather than simply repeating past rate-cut reactions, the current setup requires placing Bitcoin’s behavior in the broader macroeconomic landscape—a landscape that looks very different from previous cycles. While XWIN Research highlights the historical “up first, down later” pattern around FOMC cuts, the real story lies in how today’s liquidity conditions interact with on-chain signals.

Stablecoin exchange reserves now reflect not just crypto sentiment but the macro backdrop. With the US nearing the end of quantitative tightening and global liquidity subtly improving, rising stablecoin reserves would confirm that investors are preparing to deploy capital into risk assets.

If reserves remain flat or decline, it may indicate hesitation tied to uncertainty over inflation persistence or concerns about policy missteps.

Funding rates, meanwhile, must be interpreted through the lens of a market recalibrating after a 36% correction while still operating in a high-rate environment. Excessive long leverage during a macro turning point—especially if the Fed cuts earlier than expected—creates the perfect setup for volatility spikes.

Neutral or mildly positive funding, however, would suggest traders are not overextended, allowing Bitcoin to absorb macro news more smoothly.

Bitcoin Funding Rates | Source: CryptoQuant

Ultimately, Bitcoin’s reaction to the FOMC will depend on the interplay between improving macro liquidity conditions and the internal positioning of the market. This cycle’s environment is more complex—and potentially more supportive—than prior rate-cut events, making risk-managed positioning more crucial than prediction.

Weekly Chart Shows Stabilization But Trend Still Vulnerable

Bitcoin’s weekly chart shows the market attempting to stabilize after a sharp multi-week correction, with price hovering around $91,800. The current candle is printing a modest rebound, signaling that buyers are stepping in near the green 100-week moving average, a level that has acted as a cyclical support zone in past downturns. This reaction suggests that long-term participants are defending the structure, even as momentum remains weak.

BTC consolidates above $90K level | Source: BTCUSDT chart on TradingView

Despite the bounce, BTC continues to trade well below the 50-week moving average, which has curled downward—evidence that medium-term trend pressure still leans bearish. The breakdown from the $110K–$100K region triggered a decisive shift in sentiment, and the latest consolidation under $95K reflects a market still searching for direction rather than forming a clear recovery trend.

Volume also tells an important story: selling spikes in recent weeks have been met with noticeably softer buy-side volume, indicating that bulls are present but not yet aggressive. Until a sustained surge in demand appears, rallies near the 50-week MA are likely to face resistance.

If Bitcoin holds the 100-week MA and forms higher weekly lows, a recovery phase could build. Failure to maintain this zone, however, would expose deeper downside levels and confirm a broader trend reversal.

Featured image from ChatGPT, chart from TradingView.com

Where Are the Sellers? Low Bitcoin Inflows Hint At Holder Conviction Amid Deepest Pullback of 2025

Bitcoin is attempting to reclaim the $92,000 level as bullish momentum gradually returns after weeks of uncertainty. The market has spent nearly two months in a corrective phase, shedding roughly 36% from its highs, yet signs of stabilization are beginning to emerge. A new CryptoQuant report from analyst Darkfost highlights a striking deviation from typical mid-cycle correction behavior—one that may explain why sentiment is starting to shift.

According to the report, inflows of cryptocurrencies onto Binance remain unusually low, even as Bitcoin has experienced one of its deepest pullbacks of the cycle. Historically, during significant corrections, investors tend to send large amounts of BTC and other assets to exchanges, signaling growing willingness to sell and escalating market fear. This pattern appeared repeatedly in past downturns, often marking periods of capitulation.

But this time, the data suggests something different: investors are not rushing to offload their holdings. Instead, they appear more comfortable holding through volatility, showing patience rather than panic. Such low inflows contrast sharply with prior mid-cycle resets and hint at a more resilient market structure beneath the surface—one where holders may be preparing for the next phase rather than abandoning ship.

A Shift in Inflows Reveals Unusual Investor Behavior

Darkfost notes that today’s data shows a markedly different behavior from what Bitcoin typically displays during major corrections. Instead of focusing on BTC alone, the analysis aggregates total inflows of all cryptocurrencies sent to Binance, offering a broader view of market intent. The logic behind this metric is straightforward: rising inflows signal growing selling pressure, while shrinking inflows indicate that investors prefer to hold rather than exit their positions.

Binance Total Coins Inflows | Source: CryptoQuant

During previous downturns, inflows surged. In April 2024, right after Bitcoin hit a new all-time high at $73,800, total inflows exceeded 200 million coins, reflecting intense selling pressure. A similar spike appeared in December 2024, as BTC broke above $100,000, signaling that investors were preparing to lock in profits.

Today’s environment looks nothing like those periods. Despite experiencing a much deeper correction, inflows are five times lower—and notably stable. Investors are not sending coins to exchanges, which means they’re not eager to sell. Instead, they are sitting through the decline, showing patience rather than panic.

This unusual calm suggests a more confident market structure. If selling pressure continues to fade, this investor restraint could become one of the most constructive signals supporting a future bullish recovery once the correction runs its course.

Bitcoin Price Action Shows Early Signs of Stabilization

Bitcoin’s latest 3-day chart shows the market attempting to stabilize after a sharp two-month correction that pushed the price from above $120,000 to the recent lows near $84,000. The current rebound toward $91,960 reflects improving short-term sentiment, but the broader structure still leans bearish until key levels break.

Bitcoin testing critical level | Source: BTCUSDT chart on TradingView

One of the most important developments is BTC’s interaction with the 200-day moving average (red line). The price dipped below it during the flush-out but has now reclaimed it slightly, a signal that sellers may be losing momentum. Historically, regaining the 200MA on high timeframes marks the first stage of recovery after major corrections. However, confirmation requires follow-through and stronger volume—something that remains limited for now.

The 50MA and 100MA sit well above price, reflecting the depth of the recent decline and acting as overhead resistance. The clustering of these moving averages between $100,000 and $110,000 forms a heavy supply zone. Bulls would need several consecutive strong candles to break back into that region.

Volume has decreased notably during the rebound, suggesting that buyers are still cautious. Until BTC reclaims the $96K–$98K area—where structural resistance and realized-price bands align—this move remains a relief bounce rather than a confirmed bullish reversal.

Featured image from ChatGPT, chart from TradingView.com

Smart Whales Align: Top Performers Go All-In On Ethereum Long Positions With Over $425M in Exposure

Ethereum has reclaimed the $3,150 level after a volatile stretch, offering a rare sign of strength in an otherwise uncertain market. The broader crypto landscape remains sharply divided: some analysts argue that ETH and the rest of the market still face downward continuation, potentially setting new local lows, while others believe this correction is simply a reset before a much larger bull cycle—possibly extending into 2026.

Yet one signal stands out clearly amid the noise: smart whales are unanimously going long on ETH. On-chain data shows that several of the most profitable and consistent whale traders—each with tens of millions in realized gains—have opened substantial long positions, collectively exceeding hundreds of millions of dollars. Their coordinated behavior indicates confidence that Ethereum’s recent lows represent opportunity rather than danger.

This alignment among top-performing whales introduces a compelling counterpoint to bearish narratives. While retail sentiment remains fragile, the most sophisticated market participants appear to be positioning for a larger move ahead. As Ethereum stabilizes above $3,150, the question now becomes whether whale conviction will prove to be early—or correct.

Top Performers Load Up on Ethereum

According to Hyperdash data shared by Lookonchain, some of the most successful and influential whales in the market are aggressively accumulating Ethereum—sending a strong signal that high-conviction players expect upside ahead.

One of the most notable is BitcoinOG, the trader widely recognized for shorting the market during the violent 10/10 crash, a move that earned him significant credibility. With a total realized PNL of $105 million, BitcoinOG is now positioned firmly on the bullish side, holding 54,277 ETH worth approximately $169.48 million.

BitcoinOG Ethereum Position | Source: Hyperdash

Another major player is the well-known Anti-CZ whale, named for his historical pattern of taking the opposite side of positions favored by Binance founder Changpeng Zhao. With an impressive $58.8 million in total PNL, this whale is currently long 62,156 ETH—a massive $194 million position. His trades have often been early indicators of broad market direction, adding weight to this shift toward bullish exposure.

Finally, pension-usdt.eth, a consistently profitable whale address with $16.3 million in realized gains, is long 20,000 ETH valued at $62.5 million.

Taken together, these positions reflect a unified stance among top-performing whales: despite market uncertainty, they are positioning for Ethereum strength.

Weekly Structure Shows Early Signs of Stabilization

Ethereum’s weekly chart reveals a market attempting to regain its footing after a sharp multi-week decline from the $4,500 region. The recent reclaim of $3,150 is a meaningful development, as this level aligns closely with prior weekly support from mid-2024 and sits just above the 50-week moving average—an area that often acts as a trend-defining zone. ETH briefly dipped below this region during the November selloff, but buyers stepped in aggressively, producing a strong weekly wick that signals demand at lower levels.

ETH consolidates around critical level Source: ETHUSDT chart on TradingView

Despite this recovery attempt, ETH remains below key resistance levels. The 20-week and 100-week moving averages are positioned above the current price and converging, creating a zone of potential rejection unless momentum strengthens. For now, ETH is trading in a transitional structure: no longer trending downward aggressively, but not yet showing a confirmed bullish reversal on high timeframes.

Volume patterns also support this interpretation. Selling volume has diminished compared to the capitulation phase, while recent green candles show moderate but steady buying interest—suggesting accumulation rather than full risk-on behavior.

If ETH can establish consecutive weekly closes above $3,200–$3,300, the chart opens the door for a retest of the $3,600–$3,800 range. Failure to hold $3,150, however, risks another move toward $2,800 support.

Featured image from ChatGPT, chart from TradingView.com

Ethereum Loses Momentum While OI Holds Steady: Binance Data Shows A Market Reset

Ethereum has reclaimed the $3,150 level after a volatile Sunday session that left traders divided on what comes next. Some analysts warn that ETH’s recent bounce is nothing more than a temporary pause before the downtrend resumes, while others see signs of a potential bullish reversal forming at current levels.

Fresh data from Binance reveals that Ethereum is now entering a delicate phase. Price momentum has clearly weakened, yet open interest remains relatively high despite the decline from the $3,900 region. This disconnect highlights a major shift in futures market behavior: traders are holding positions, but not aggressively increasing them.

The 30-day open interest Z-Score currently sits at 0.50, indicating that OI is just slightly above its 30-day average—well within normal volatility bands. Unlike previous corrections, where open interest surged during heavy selling, the current reading suggests neither extreme leverage buildup nor panic-driven position closures.

This unusual combination—weakening momentum paired with stable open interest—underscores a market in transition. Whether Ethereum resumes its downtrend or begins carving out a recovery will depend on how quickly momentum returns to spot and futures markets in the days ahead.

Open Interest Stability Signals a Market in Repositioning

According to the Arab Chain report on CryptoQuant, Ethereum’s $6.61 billion in open interest highlights that traders are still holding a substantial share of their positions despite the sharp decline from $3,900 to below $3,200. This divergence—falling price but steady OI—is characteristic of market repositioning phases, where traders reduce activity without fully exiting the market.

The supporting metrics reinforce this view: the OI avg30 sits at $6.44 billion, and the OI std30 at $329 million, indicating that current fluctuations remain well within normal volatility ranges. There is no sign of aggressive position buildup or liquidation pressure.

Binance Ethereum Open Interest Z-Score | Source: CryptoQuant

With the Z-Score at 0.50, the modest rise in open interest does not suggest overwhelming bearish leverage. Instead, it shows that traders are still engaging with the market and selectively building new positions as price declines. This level of participation is important: it signals that the derivatives market is active but not overheated.

Ethereum’s price weakness, driven by fading momentum after failing to sustain its previous highs, leaves the market at an inflection point. If large traders are predominantly short, stable OI could support the continuation of downward pressure. However, if long positions dominate, this same stability may lay the groundwork for a rebound once momentum returns.

Testing Momentum as Bulls Attempt to Reclaim Control

Ethereum is attempting to stabilize above the $3,150–$3,160 zone after a volatile multi-week decline. The chart shows ETH rebounding from a local low near $2,750, forming a short-term rising structure. However, momentum remains fragile. The 50-day SMA continues to slope downward and sits well above current price action, reinforcing the broader downtrend. Until ETH can break and close above this moving average, upside attempts will likely face resistance.

ETH conolidates around key level | Source: ETHUSDT chart on TradingView

The 100-day SMA is also declining, converging with the $3,350–$3,400 region—an area that could act as the next major ceiling for any bullish continuation. Meanwhile, the 200-day SMA remains flat but sits just above price, creating an additional barrier around $3,250–$3,300. This cluster of resistance levels confirms that Ethereum is still operating within a corrective structure despite the recent bounce.

Volume has tapered off noticeably compared to the heavy sell-side spikes seen in November. This suggests that the rebound may be driven more by diminishing selling pressure than strong spot demand. If volume remains weak, ETH may struggle to build enough momentum for a sustained recovery.

Featured image from ChatGPT, chart from TradingView.com

❌