Reading view

There are new articles available, click to refresh the page.

Ethereum Price Prediction: ETH Supply Just Hit a 10-Year Low – Supply Shock Could Create Explosive Rally

A supply shock scenario is brewing, fuelling bullish Ethereum price predictions as centralized exchanges now hold their lowest share of circulating supply in a decade.

The altcoin is growing in scarcity this market cycle, with adoption channels like staking, restaking, layer-2s, digital asset treasuries, and private wallets siphoning off exchange liquidity.

These pipelines have created the tightest supply conditions to date. Exchanges now control just 8.7% of circulating Ethereum, the lowest share since Ethereum went live in 2015.

Ethereum Exchange Supply. Source: GlassNode.
Ethereum Exchange Supply. Source: Glassnode.

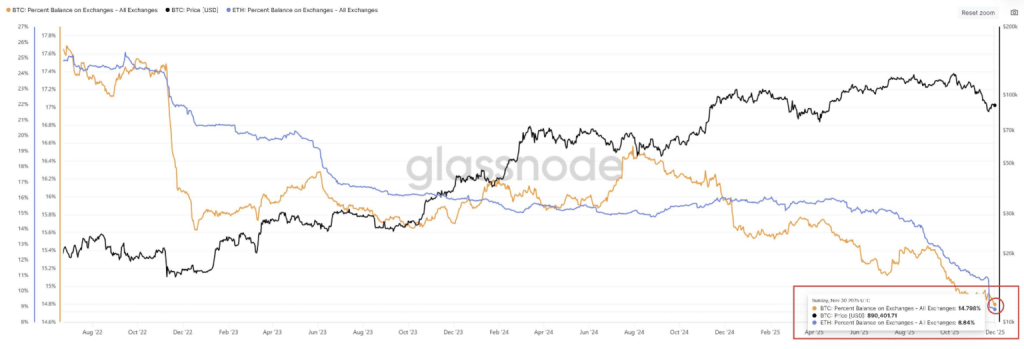
Fresh exposure through U.S. TradFi products such as ETFs deepens the trend. Institutional-grade demand has driven aggressive accumulation under long-term holding strategies.

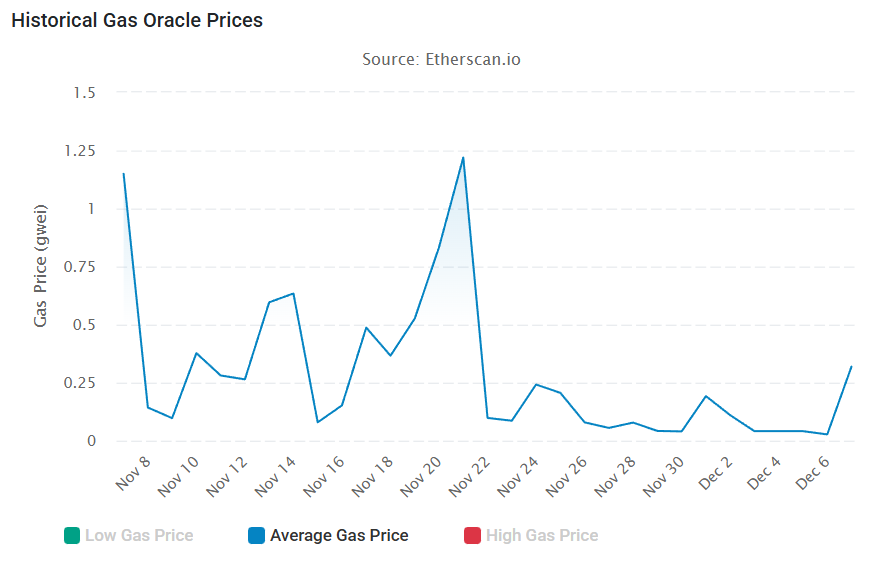
With fewer tokens available, traders are watching for signs of a supply squeeze. Scarcity could trigger sharp upside volatility as demand collides with shrinking liquidity.

Ethereum Price Prediction: Is ETH Ready To Surge?

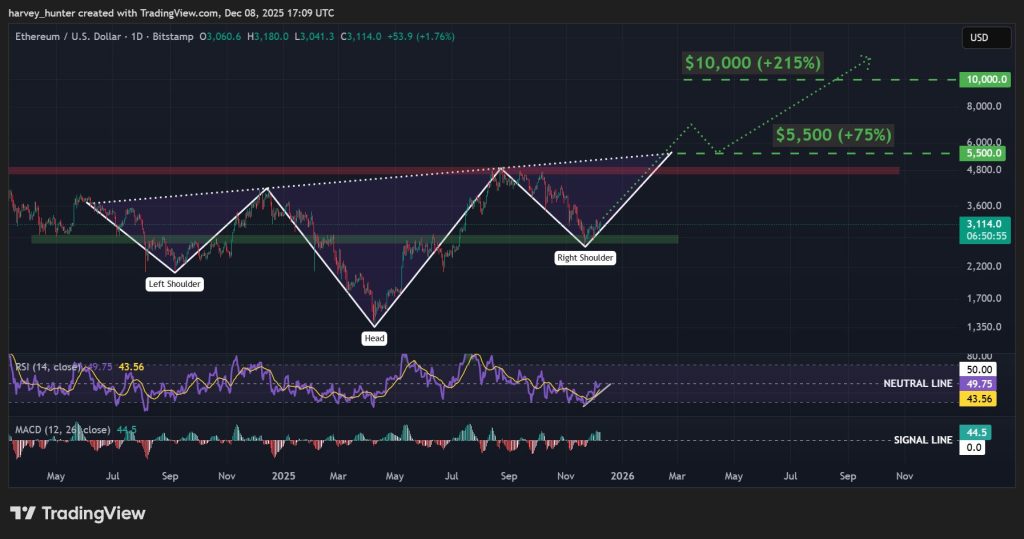
This scarcity could help fuel the breakout of a bullish head and shoulder pattern, now unfolding.

The Ethereum price has confirmed a local bottom at $2,750, forming higher lows in a fresh uptrend that solidifies the right shoulder.

ETH USD 1-day chart, bullish head-and-shoulders pattern. Source: TradingView.

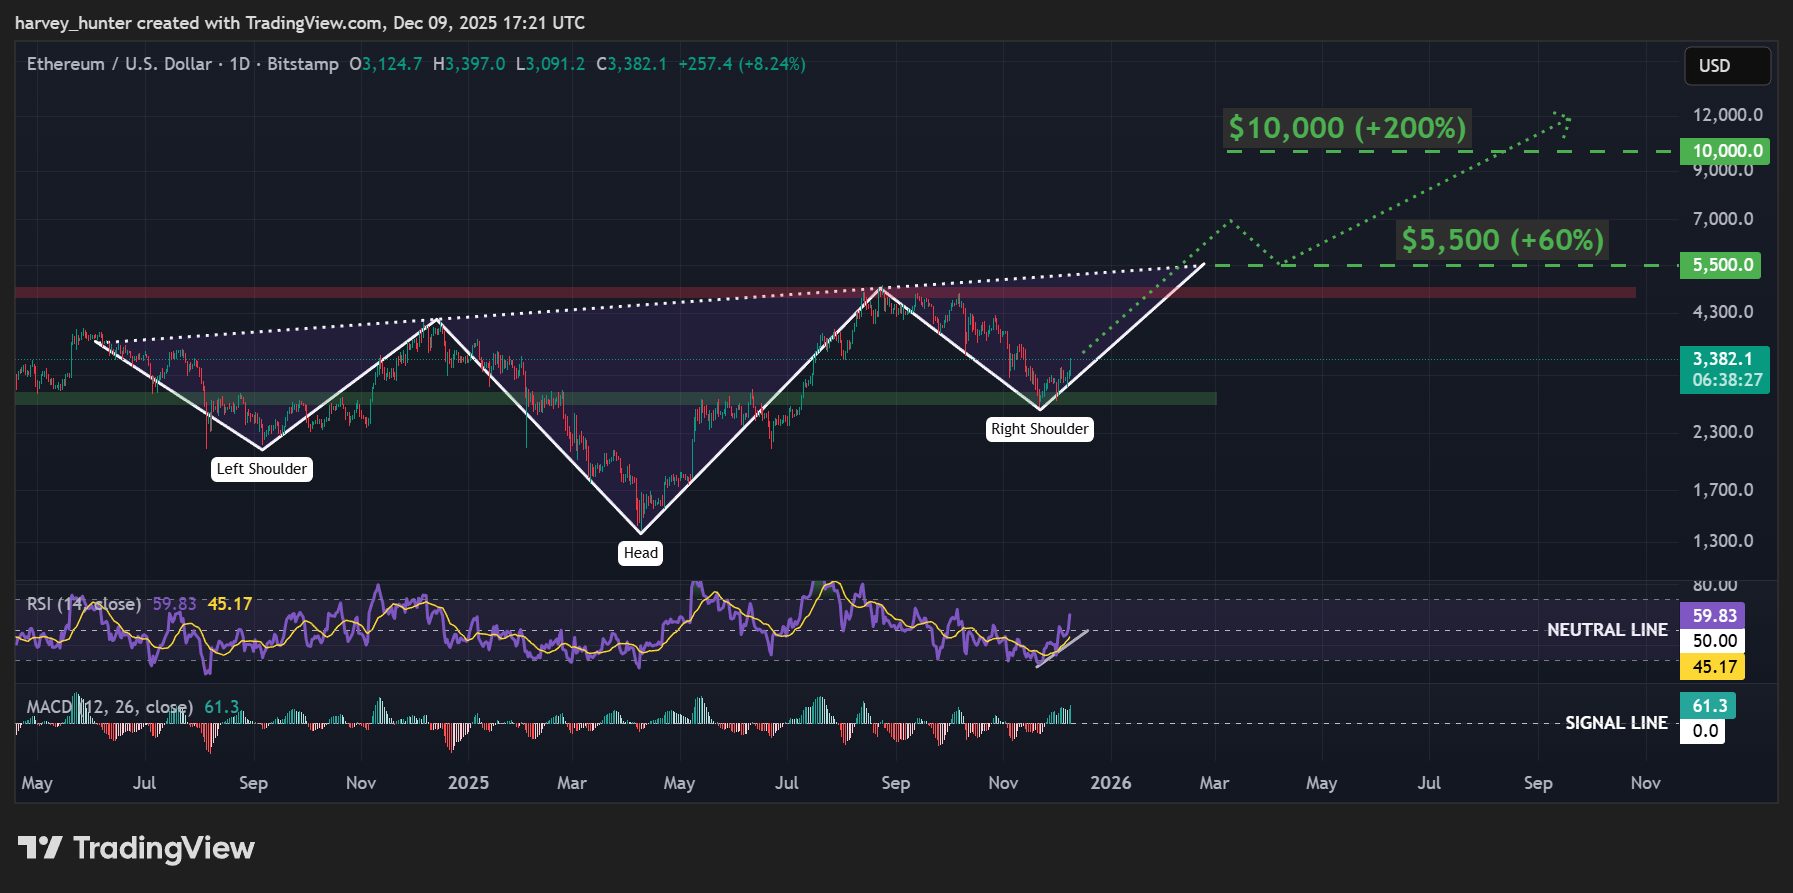
Momentum indicators add validity to the trend. The RSI has made a decisive move above the 50 neutral line for the first time since the downtrend began in October, a telling sign of a bottom.

The MACD follows suit, continuing to widen its lead above the signal line and demonstrating a lasting uptrend.

A fully realised pattern breakout could see the neckline reclaimed around $5,500, reclaiming past all-time highs and entering new price discovery in a 60% move.

But as the bull market matures, scarcity only stands to increase, compounding the effects of mainstream adoption and use cases. The move could extend 200% to $10,000.

SUBBD: Mainstream Adoption Could Send This Coin Parabolic

With a shift to pro-crypto regulation, the transition to Web3 has been accelerated. And with it, platforms based in real-world utility like SUBBD ($SUBBD) are gaining traction.

Positioned as an AI-powered content platform, SUBBD is redefining the $85 billion subscriber economy by giving creators true ownership and fans genuine access.

Never miss a sale again.

As a top creator, your audience is global. It's just not possible to cater to everyone – you can't be online 24/7 🫠

That's where your personal AI Assistant comes in, to handle requests and secure payments. Sleep peacefully knowing you're making money… pic.twitter.com/ju9VjLBmea

— SUBBD (@SUBBDofficial) March 26, 2025

By cutting out the middlemen, $SUBDD puts control back in the hands of those who create real value.

Creators can monetize directly, while fans gain access to exclusive content, early releases, and meaningful interactions through token-gated perks.

The project has already raised almost $1.3 million in presale, and post-launch, even a small share of the industry could push its valuation significantly higher.

With SUBBD, both sides of the community win — creators earn more, and fans get closer while embracing the decentralization use cases crypto was built for.

Visit the Official SUBBD Website Here

The post Ethereum Price Prediction: ETH Supply Just Hit a 10-Year Low – Supply Shock Could Create Explosive Rally appeared first on Cryptonews.

Pi Coin Price Prediction: $10M Fraud Lawsuit Hits as 2 Billion Tokens Dumped – Is Pi Coin Going to $0?

Investors are stepping back as a $10 million lawsuit accuses Pi Network of a large-scale fraud scheme, casting a shadow over bullish PI coin price predictions.

Questions of unauthorized transaction, a secret 2 billion Pi token dump, and deliberately delayed network migration have sparked an exodus, with the altcoin down 5%.

According to court filings, plaintiff Harro Moen claims the scheme unfolded over several years and caused significant financial damage. He is seeking $10 million in damages.

🚨 Is a lawsuit really going to be filed against #PiNetwork?

I don't know if this is true or false, but I do know that its value will soon decrease, and people's trust in it will also diminish.@PiCoreTeam needs to respond now. pic.twitter.com/fMDQj5ouCD

— The Times of PiNetwork (@PiNetwork24X7) December 7, 2025

Moen credits an April 10, 2024 unauthorized transfer of 5,137 PI tokens from his verified wallet to an unknown address to a scheme to dump over 2 billion PI of user funds.

He further added that the situation was worsened by the failure to migrate his remaining 1,403 tokens to the Pi Network Mainnet, exposing him to heavy unrealised losses.

The complaint also argues that despite marketing Pi Network as decentralized, the defendants allegedly maintained centralized control by operating only three validator nodes.

These accusations threaten to worsen Pi Network’s biggest pain point: adoption. The project already lacks a meaningful use case to sustain long-term growth, and now builders may sideline the layer-1 entirely.

Its liquidity strain may deepen further, with short-term speculative trading amplifying deflationary pressure as token unlocks continue at an average pace of 6.1 million PI per day.

Pi token 30-day unlock schedule. Source: PiScan.

Pi Coin Price Prediction: Is a Recovery Still Possible?

The controversy comes as the PI coin price tests a strong confluence of support with the lower boundary of a 2-month ascending triangle and the 0.5 Fib retracement level.

PI USDT 12H chart, symmetrical triangle pattern. Source: TradingView.

Momentum indicators show bullishness peeking through. The RSI has bounced from near-oversold levels, typically a bottom marker in corrections.

The MACD also slowly closes in on a golden cross above the signal line, a sign of growing strength.

As a launchpad, this support could set up a breakout to the patterns $0.40 target, an 8-% gain from current prices.

Still, the lawsuit could dent bearish sentiment enough to disrupt the slow growth. A breakdown targets all-time lows, 30% lower at $0.15.

And below that lies a dangerous gap area, with little historical support to cushion downside, which opens the door to a 65% decline to the 1.618 Fib retracement at $0.075.

Bitcoin Hyper: A Layer-2 Attracting Talk For Better Reasons

Those who jumped to Pi Network as an alternative Layer 1 to the leading crypto may be forced to reconsider, as the Bitcoin ecosystem finally addresses its biggest limitation: ecosystem growth.

Bitcoin Hyper ($HYPER) is bridging Bitcoin’s security and stability with Solana’s speed, creating a new Layer-2 network that unlocks scalable and efficient use cases Bitcoin couldn’t support alone.

The project has already raised almost $30 million in presale, and post-launch, even a small share of Bitcoin’s trading volume could push its valuation significantly higher.

Bitcoin Hyper is fixing the slow transactions, high fees, and limited programmability that have capped Bitcoin’s potential – just as the market turns bullish.

To buy HYPER at the presale price and before it lists on exchanges, visit the official Bitcoin Hyper website and connect a crypto wallet such as Best Wallet.

You can swap crypto or use a bank card to make the purchase in seconds.

Visit the Official Website Here

The post Pi Coin Price Prediction: $10M Fraud Lawsuit Hits as 2 Billion Tokens Dumped – Is Pi Coin Going to $0? appeared first on Cryptonews.

Ethereum Price Prediction: Founder Vitalik Pushes Bold New Idea to Beat High Fees – Will This Change How ETH Works Forever?

Vitalik Buterin is pushing for a market to predict future gas costs, a problem that has long overshadowed bullish Ethereum price predictions.

He argues that multi-year low gas fees have bred complacency, with a massive shift in retail activity to cheaper Layer 2 networks like Base and Arbitrum sidelining the altcoin’s issue.

Average Ethereum gas price. Source: Etherscan,
Average Ethereum gas price. Source: Etherscan.

His solution: an on-chain prediction market designed to help users secure future gas prices and mitigate sudden spikes in transaction costs on the network.

We need a good trustless onchain gas futures market.

(Like, a prediction market on the BASEFEE)

I've heard people ask: "today fees are low, but what about in 2 years? You say they'll stay low because of increasing gaslimit from BAL + ePBS + later ZK-EVM, but do I believe you?"…

— vitalik.eth (@VitalikButerin) December 6, 2025

An on-chain futures curve would provide a clear signal of long-term market expectations. It would permit users to prepay for block space and lock in costs regardless of future spikes.

With a shared reference point for future network conditions, developers could buy gas insurance to cap operating costs ahead of critical events, while heavy users could also offset future fee spikes by taking the opposite market position.

This all amounts to a more favourable platform for users, facilitating the transition from web-2 to web-3 as blockchain technology needs the reliability expected at the institutional level.

Ethereum Price Predictions: Adoption Could Fuel New All-Time Highs

The potential adoption of controlled gas fees could bring to Ethereum could help fuel the breakout of a bullish 19-month head-and-shoulder pattern, now unfolding.

The Ethereum price has confirmed a local bottom after with higher highs forming after its bounce from a historical demand zone around $2,750, and with it the right shoulder.

ETH USD 1-day chart, bullish head-and-shoulders pattern. Source: TradingView.

Momentum indicators show this bullishness is now being realised. The RSI is closing in on the 50 neutral line, forming several higher lows as buyers step in.

The MACD also displays a growing lead on the signal line, suggesting a sustained bullish trend.

A fully realised pattern breakout could see the neckline reclaimed around $5,500, reclaiming past all-time highs and entering new price discovery in a 90% move.

But as the bull market matures, if Ethereum finds a bigger part to play in the transition from Web2 to Web3, the move could extend 250% to $10,000.

SUBBD: A Web3 Solution to an $85 Billion Industry

With a shift to pro-crypto regulation, the transition to Web3 has been accelerated. And with it, platforms based in real-world utility like SUBBD ($SUBBD) are gaining traction.

Positioned as an AI-powered content platform, SUBBD is redefining the $85 billion subscriber economy by giving creators true ownership and fans genuine access.

Never miss a sale again.

As a top creator, your audience is global. It's just not possible to cater to everyone – you can't be online 24/7 🫠

That's where your personal AI Assistant comes in, to handle requests and secure payments. Sleep peacefully knowing you're making money… pic.twitter.com/ju9VjLBmea

— SUBBD (@SUBBDofficial) March 26, 2025

By cutting out the middlemen, $SUBDD puts control back in the hands of those who create real value.

Creators can monetize directly, while fans gain access to exclusive content, early releases, and meaningful interactions through token-gated perks.

The concept is already gaining traction. $SUBBD has surpassed $1.3 million in presale, as investors back the shift toward a decentralized creator economy.

With SUBBD, both sides of the community win — creators earn more, and fans get closer while embracing the decentralization use cases crypto was built for.

Visit the Official SUBBD Website Here

The post Ethereum Price Prediction: Founder Vitalik Pushes Bold New Idea to Beat High Fees – Will This Change How ETH Works Forever? appeared first on Cryptonews.

Solana Price Prediction: “Zero Risk” Turns Out to Be Wrong – Did This Exchange Expose a Hidden Danger in Crypto?

Jupiter has admitted it overstated claims about “zero risk” lending, denting Solana price predictions as one of its key DeFi drivers gets pushed to the sidelines.

The altcoin is wrapped up in a controversy, stemming from now-deleted posts that described Jupiter Lend vaults as carrying “isolated risk.”

Example deleted post of “isolated risk” claims. Source: X, @JupiterExchange.

Jupiter COO Kash Dhanda clarified on X that while the vaults are isolated, the use of rehypothecated assets exposes users to risk as shocks in one part of the system can still pass through those reused assets.

The vaults are designed to limit contagion, but Dhanda acknowledged the team should not have implied they were completely insulated.

The correction has not stopped the crypto community from sidelining Jupiter. Lending protocol Kamino has blocked users from migrating funds to Jupiter Lend, citing the misrepresentation.

As a contributor to over $616 million in network activity, an exodus of Jupiter Lends could weigh on Solana through weaker adoption and decreased usage of SOL as a utility token.

Solana Price Prediction: Can Solana Survive Without Jupiter Lends?

While Jupiter Lends has weakened as a contributor of inflows into the Solana ecosystem, the market reaction has not derailed a potential launchpad setup.

The formation of a higher low solidifies the $120 level as the base of a double-bottom pattern, a reversal setup that is now being reflected by momentum indicators.

SOL USD 1-day chart, double bottom fuels descending triangle. Source: TradingView.

The MACD is no longer declining, but holding a wide lead above the signal line, while the RSI continues to form higher lows as it approaches the 50 neutral line. Both are strong indicators of a bullish shift.

Still, the Solana price has yet to surpass the double-bottom neckline around $145, a level it must reclaim as support for the $210 target to play out.

Such a shift would set up a retest of the wider year-long descending triangle resistance, creating a breakout scenario targeting levels near $500 for a potential 260% gain.

A target that stands to extend much higher as the bull run matures in 2026, with anticipated U.S. interest rate cuts stimulating demand and a potential 630% $1,000 run.

Solana appears more in tune with wider market narratives than the Jupiter controversy.

Bitcoin Hyper: Solana Might Be The Wrong Coin to Watch

Those who jumped to Solana as an alternative Layer 1 to the leading crypto may be forced to reconsider, as the Bitcoin ecosystem finally addresses its biggest limitation: ecosystem growth.

Bitcoin Hyper ($HYPER) is bridging Bitcoin’s security and stability with Solana’s speed, creating a new Layer-2 network that unlocks scalable and efficient use cases Bitcoin couldn’t support alone.

The project has already raised over $30 million in presale, and post-launch, even a small share of Bitcoin’s trading volume could push its valuation significantly higher.

Bitcoin Hyper is fixing the slow transactions, high fees, and limited programmability that have capped Bitcoin’s potential – just as the market turns bullish.

Visit the Official Bitcoin Hyper Website Here

The post Solana Price Prediction: “Zero Risk” Turns Out to Be Wrong – Did This Exchange Expose a Hidden Danger in Crypto? appeared first on Cryptonews.

XRP Price Prediction: Ripple CEO Says Bitcoin Will Double by 2026 – How High Can XRP Go?

Brad Garlinghouse argues that Bitcoin has yet to realise its full bullishness this cycle, and with it, bullish XRP price predictions may still be on track.

Speaking at Binance Blockchain Week 2025, he dismissed the current bearish mood around crypto as temporary and completely out of sync with the fundamentals supporting the market.

2026 has the potential to be “the most bullish year in crypto yet,” with institutions paving the way for a $180,000 Bitcoin.

💥BREAKING:

RIPPLE $XRP CEO BRAD GARLINGHOUSE PREDICTS BITCOIN WILL HIT $180,000 BY THE END OF 2026. pic.twitter.com/uIRgKm7zIr

— Crypto Rover (@cryptorover) December 3, 2025

The pro-crypto regulatory shift in the U.S. has unlocked one-fifth of global GDP, with institutional-level demand only just being tapped into with the introduction of ETFs.

And they have only just permeated the mainstream with traditional asset manager giants outside of digital-native firms playing “catch-up,” introducing their vast clientele.

Garlinghouse rejects the idea that ETF demand has peaked, noting the few crypto offerings represent just 1–2% of all ETF assets, a tiny fraction that leaves enormous upside.

XRP is a standout beneficiary with steps towards regulation, like the GENIUS stablecoin Act, paving the way for its infrastructure, like stablecoins, to become mainstream.

Ripple’s stablecoin approvals in Abu Dhabi and Dubai reinforce that point; stablecoins are no longer experimental, they’re becoming embedded in real financial systems.

XRP Price Prediction: How High Can XRP go in 2026?

December is shaping a strong launchpad into 2026 with a strong confluence of support laying the groundwork for a 4-month descending channel breakout.

The lower boundary of this consolidation is about to be retested, aligning with the level that has provided a firm bottom market throughout the bullish phase of the market cycle at $1.90.

A strong technical setup for a launchpad, and momentum indicators could support it.

XRP USD 1-day chart, descending channel. Source: TradingView.

While its most recent attempt has ended in rejection, the RSI is now testing the 50 neutral line after weeks in deep oversold territory. Strength is building towards a bullish shift.

While the MACD verges on a death cross below the signal line, it may prove short-lived as XRP nears the confluence zone.

The key breakout threshold lies at $2.70, a former strong support level that recently flipped to resistance. Reclaiming this zone could confirm a breakout targeting an 80% upside move to $3.70.

And with further U.S. interest rate easing expected into and growing institutional involvement, the setup could extend much higher, eyeing $5 in the approach of past all-time highs for a 150% run.

SUBBD: Strong Fundamentals at Their Earliest

With market conditions shaping up for a 2026 bull run, capital is rotating into the next high-upside contender, and increasingly, SUBBD ($SUBBD).

Positioned as an AI-powered content platform, SUBBD is redefining the $85 billion subscriber economy by giving creators true ownership and fans genuine access.

Never miss a sale again.

As a top creator, your audience is global. It's just not possible to cater to everyone – you can't be online 24/7 🫠

That's where your personal AI Assistant comes in, to handle requests and secure payments. Sleep peacefully knowing you're making money… pic.twitter.com/ju9VjLBmea

— SUBBD (@SUBBDofficial) March 26, 2025

By cutting out the middlemen, $SUBDD puts control back in the hands of those who create real value.

Creators can monetize directly, while fans gain access to exclusive content, early releases, and meaningful interactions through token-gated perks.

The concept is already gaining traction. $SUBBD nears $1.4 million in presale, as investors back the shift toward a decentralized creator economy.

With SUBBD, both sides of the community win — creators earn more, and fans get closer while embracing the decentralization use cases crypto was built for.

Visit the Official SUBBD Website Here

The post XRP Price Prediction: Ripple CEO Says Bitcoin Will Double by 2026 – How High Can XRP Go? appeared first on Cryptonews.

Solana Price Prediction: Institutions Pile In as Staking Hits 3.1M SOL – Could SOL Overtake Bitcoin in 2026?

Institutions are jumping at the opportunity to gain exposure to SOL staking yields, contributing 3.1 million SOL in a testament to bullish Solana price predictions.

As the designated staking backend for institutional products, Staking service Marinade has seen its Total Value Locked (TVL) increase 3 fold to $436 million over November.

Marinade Total Value Locked (TVL). Source: SolanaFloor.

This adoption has been catalysed with the launch of several spot SOL staking ETFs as a regulated means to gain access to the altcoin’s yields.

Over November, these ETFs saw a 22-day inflow streak despite amounting to the second-worst month of the year. TradFi markets chose to buy the dip on SOL as other ETFs like Bitcoin bled.

U.S. Spot Solana ETF Netflows. Source: SoSoValue.

Demand that only stands to grow with fresh touch points for institutional-grade exposure, like the recently unlocked 50 million clientele of the second-largest asset manager, Vanguard.

As the favored accumulation strategy over Bitcoin, Solana is in a favorable position to outperform the leading cryptocurrency if the bull run returns for 2026.

Solana Price Prediction: Where Could Solana Go In 2026

December is shaping a strong launchpad into 2026 as Solana forms a clean double-bottom pattern along a firm support throughout the bullish phase of this market cycle at $120.

And with momentum indicators verging on bullishness, the structure is acting as a clear bottom to the two-month Solana price decline.

While its most recent attempt has ended in rejection, the RSI is now testing the 50 neutral line after weeks in deep oversold territory. The MACD has also built a strong lead on the signal line.

Both suggest the early stages of a fresh uptrend as buyers step back in.

Still, the Solana price has faltered at the double-bottom neckline around $145, a level it must reclaim as support for the $210 target to play out.

Such a shift would set up a retest of the wider year-long descending-triangle resistance, creating a breakout scenario targeting levels near $500 for a potential 260% gain.

Though a near-term catalyst, such as a decision to ease U.S. interest rates next week, may be required to stimulate risk sentiment.

And with further macroeconomic easing expected through 2026 and growing institutional involvement, the setup could extend toward a much larger move, eyeing $ 1,000 for a 630% run.

Bitcoin Hyper: A Reason Bitcoin Could Still Outpace Solana

Those who jumped to Solana as an alternative Layer 1 to the leading crypto may be forced to reconsider, as the Bitcoin ecosystem finally addresses its biggest limitation: ecosystem growth.

Bitcoin Hyper ($HYPER) is bridging Bitcoin’s security and stability with Solana’s speed, creating a new Layer-2 network that unlocks scalable and efficient use cases Bitcoin couldn’t support alone.

The project has already raised over $30 million in presale, and post-launch, even a small share of Bitcoin’s trading volume could push its valuation significantly higher.

Bitcoin Hyper is fixing the slow transactions, high fees, and limited programmability that have capped Bitcoin’s potential – just as the market turns bullish

Visit the Official Bitcoin Hyper Website Here

The post Solana Price Prediction: Institutions Pile In as Staking Hits 3.1M SOL – Could SOL Overtake Bitcoin in 2026? appeared first on Cryptonews.

Pepe Coin Price Prediction: Chart Signals Flash Green – But One Silent Metric Has Traders Whispering 

Key technicals are flashing green, and traders are banking on the fact that bullish Pepe price predictions finally have the support to be realised.

The often-overlooked Bollinger Bands may be the clearest tell. After spending two months below the central basis line, the meme coin has finally broken above it as buyers return.

PEPE USDT 1-day chart, Bollinger bands. Source: TradingVeiw.

The bands are also narrowing, signalling a volatility squeeze that marks a shift away from the prior freefall and adds weight to a bottom taking shape.

Market participants appear to be leaning into the setup. Open Interest has risen 26% since the second bounce, adding more than $55 million as traders re-engage with the price action.

PEPE Open Interest. Source: Coinglass.

And they appear to be positioning for further upside, with a Long-Short Ratio of 1.03 suggesting the majority of traders are longing the PEPE price.

Pepe Price Prediction: The Strongest Bottom Signal Yet?

This potential bottom appears to have taken shape as a double-bottom reversal, with a second bounce along the $0.000004 level now gaining momentum.

Pepe now tests the pattern’s neckline at $0.0000049, a level that must flip to support to confirm the bullish setup.

Momentum indicators support further upside. The MACD widens its gap above the signal line while the RSI approaches the 50 neutral line for the first time in two months, both signals that buyers are controlling the move.

Fully realised, the pattern targets a measured 50% move to reclaim November highs at $0.0000075. But if this level can be flipped to support, it may mark the start of an extended rally.

And with supportive market conditions, such as a U.S. interest rate ease in December to stimulate demand for riskier plays PEPE, it could push 240% to May highs at $0.0000165.

Pepe Node: A Better Way to Buy the Dip

If the past two months have proven anything, it’s that it can be difficult to buy the dip on volatile tokens like meme coins without leaving yourself exposed to heavy losses.

PepeNode ($PEPENODE) helps with an easier way to accumulate, without needing to time the market — the pitfall of most meme coin investors.

It’s a simple mine-to-earn (M2E) game. No hardware needed.

Just log in, acquire virtual nodes, stack rigs, and configure your setup to start earning passive rewards, diversified across top-performing meme coins.

Momentum is climbing fast. The presale has already passed $2.25 million, while early stakers can still earn up to 573% APY.

And thanks to a built-in deflationary model, where 70% of all $PEPENODE spent on nodes and rigs is burned, scarcity supports long-term token value.

PepeNode stands out as a smarter way to capture some of the market’s strongest upside—without worrying about timing the perfect entry.

Visit the Official PepeNode Website Here

The post Pepe Coin Price Prediction: Chart Signals Flash Green – But One Silent Metric Has Traders Whispering  appeared first on Cryptonews.

Solana Price Prediction: Trillion-Dollar Asset Manager Vanguard Just Backed SOL – Is the SOL Target Now $1,000?

The new week has brought a major development for Solana, with growing interest from traditional finance helping fuel bullish Solana price predictions.

Vanguard, one of the world’s largest asset managers with over $11 trillion under management, has reversed its crypto ban.

Clients can now access crypto-related ETFs and mutual funds through the platform, marking a major shift in mainstream adoption.

🚨NEWS: Vanguard, the world’s 2nd largest asset manager with about $11T in AUM, has made @Solana ETFs available across its platform, opening access to roughly 50 million clients. pic.twitter.com/T45y5EMGLz

— SolanaFloor (@SolanaFloor) December 2, 2025

Even a small share of that capital would translate into explosive growth, and Solana is a standout beneficiary as the proven institutional play of choice.

The altcoin saw a 22-day inflow streak during crypto’s second-worst month of the year as TradFi markets chose to buy the dip on Solana over other ETF offerings.

U.S. Spot SOL ETF Daily Inflows. Source: SoSoValue.

And with the fresh exposure, Solana ETFs are once again catching a bid from investors, with $46.7 million in inflows the day of the announcement.

Solana Price Predictions: Could Vanguard Fuel a $1000 Move

This fresh touch point for inflows arrives as Solana flashes its strongest bottom signal yet with a double bottom pattern forming along a historic support trendline.

The $120 level has marked local bottoms throughout the bullish phase of the market cycle, and it appears to act as a launchpad yet again as momentum indicators flip bullish.

SOL USD 1-day chart, double bottom fuels descending triangle. Source: TradingView.

The RSI is testing the neutral line after being trapped in oversold conditions for the past 2 months while the RSI builds a lead above the signal line. Both suggest that buyers are taking control of the prevailing trend.

With a decisive break above the double bottom neckline at $144, the fully realised structure eyes a push to $210.

This would trigger a retest of a wider year-long descending triangle pattern, creating a potential breakout scenario eyeing much higher targets around $500, a 250% gain.

With anticipated U.S. interest rate cuts in December set to stimulate risk sentiment across investment markets, Vanguard exposure could fuel a larger 600% move to $ 1,000 for SOL.

SUBBD: An Early Play With Fundamentals Just as Strong

With market conditions shaping up for an explosive year-end, capital is rotating into the next high-upside contender, and increasingly, SUBBD ($SUBBD).

The project is redefining the $85 billion subscriber economy by giving creators true ownership and fans genuine access through an AI-powered content platform.

Never miss a sale again.

As a top creator, your audience is global. It's just not possible to cater to everyone – you can't be online 24/7 🫠

That's where your personal AI Assistant comes in, to handle requests and secure payments. Sleep peacefully knowing you're making money… pic.twitter.com/ju9VjLBmea

— SUBBD (@SUBBDofficial) March 26, 2025

By cutting out the middlemen, $SUBDD puts control back in the hands of those who create real value.

Creators can monetize directly, while fans gain access to exclusive content, early releases, and meaningful interactions through token-gated perks.

The concept is already gaining traction. $SUBBD nears $1.4 million in presale, as investors back the shift toward a decentralized creator economy.

With SUBBD, both sides of the community win — creators earn more, and fans get closer while embracing the decentralization use cases crypto was built for.

Visit the Official SUBBD Website Here

The post Solana Price Prediction: Trillion-Dollar Asset Manager Vanguard Just Backed SOL – Is the SOL Target Now $1,000? appeared first on Cryptonews.

Cardano Price Prediction: Hoskinson Says 99% of Cryptos Will Die – But ADA May Be One of the Last Coins Standing 

Charles Hoskinson says short-term price swings caused by speculation are not a concern for ADA.

Instead, he believes Cardano has long-term strength and remains confident in a bullish Cardano price prediction.

He also warned that 99% of altcoins fail over time, but Cardano is part of the 1% that has survived and grown past a $10 billion market cap over the past decade.

JUST IN: #Cardano $ADA Founder Charles Hoskinson says "99.9% of cryptocurrency ventures fail. Cardano is one of only a handful, like XRP, and Ethereum, that have survived over the last 10 years, and has value greater than $10 billion." pic.twitter.com/8IBG7Smqbb

— Angry Crypto Show (@angrycryptoshow) December 1, 2025

These comments come to combat chatter that ADA has failed to impress this cycle. Even in the post-halving bullish phase in its historical four-year cycle, it still trades 85% below its 2021 all-time high of $3.10.

In a recent podcast, Hoskinson blamed this weak performance on the outsized influence of macroeconomic events on the crypto market.

A headwind that is now clearing as the U.S. Fed makes a significant policy shift, ending quantitative tightening (QT) alongside a $13.5 billion liquidity boost for banks.

With liquidity entering the market and hopes of a December interest rate ease to stimulate risk appetite, speculative assets like ADA stand to see new demand into 2026.

Cardano Price Prediction: ADA May Survive, But Can it Thrive?

This week may have laid the groundwork for a breakout push, with a second bounce from $0.387 forming a double bottom reversal structure.

This could be the fuel needed for an escape from the descending channel that has kept it in controlled consolidation over the past year.

ADA / USD 1-day chart, descending channel. Source: TradingView.

Momentum indicators favor a rise. The RSI has made a sharp bounce from the 30 oversold threshold, while the MACD widens its lead above the signal line. Both indicators show a new uptrend taking shape.

The double bottom stands to reverse the November breakdown with a target around $0.60, reclaiming the support that has gilded lows through the consolidation at $0.50.

With this higher and firmer support, a successful breakout could see upside extend to cycle highs and into new price discovery, targeting a 300% move to $1.80.

SUBBD: These Fundamentals Could Eye a Spot in the 1%

With market conditions shaping up for a 2026 bull run, capital is rotating into the next wave of breakout projects with solid fundamentals, and increasingly, SUBBD ($SUBBD).

Positioned as an AI-powered content platform, SUBBD is redefining the $85 billion subscriber economy by giving creators true ownership and fans genuine access.

Never miss a sale again.

As a top creator, your audience is global. It's just not possible to cater to everyone – you can't be online 24/7 🫠

That's where your personal AI Assistant comes in, to handle requests and secure payments. Sleep peacefully knowing you're making money… pic.twitter.com/ju9VjLBmea

— SUBBD (@SUBBDofficial) March 26, 2025

By cutting out the middlemen, $SUBDD puts control back in the hands of those who create real value.

Creators can monetize directly, while fans gain access to exclusive content, early releases, and meaningful interactions through token-gated perks.

The concept is already gaining traction. $SUBBD nears $1.4 million in presale, as investors back the shift toward a decentralized creator economy.

With SUBBD, both sides of the community win — creators earn more, and fans get closer while embracing the decentralization use cases crypto was built for.

Visit the Official SUBBD Website Here

The post Cardano Price Prediction: Hoskinson Says 99% of Cryptos Will Die – But ADA May Be One of the Last Coins Standing  appeared first on Cryptonews.

PEPE Price Prediction: Price Bounces Off Yearly Low – Is the Frog About to Flip the Chart and Shock Everyone?

Pepe appears to have diverged from a textbook bearish setup, with yearly lows shaping up as a launchpad for bullish Pepe price predictions.

An early-week 17% bounce has affirmed $0.000004 as a firm bottom marker for the meme coin through this market cycle’s bullish phase.

That stability now puts the validity of a 9-month bearish head-and-shoulders breakdown into question.

PEPE / USDT 1-week chart, head-and-shoulder pattern. Source: TradingView.

While the pattern had pointed to a potential 77% decline, a decisive rebound like this may signal an early bailout. Still, market participants appear to be oblivious to the setup as profit-taking continues.

One long-term PEPE Token holder deposited their remaining $3.5 million worth of PEPE to Coinbase, now having a zero balance for the first time since June 2024.

That behavior reflects a broader trend, with the Chaikin Money Flow on Coinbase plunging into deeply negative territory at –0.3, signaling significant profit-taking pressure.

PEPE Chaikin Money Flow (CMF). Source: TradingView.

Pepe Price Prediction: The Next Move Could Shock Everyone

Zooming in, the divergence appears to stem from a double-bottom reversal forming with a second bounce developing along the yearly low.

Its play-out has shifted attention toward a potential breakout from a broader descending channel, and momentum indicators now support the bullish setup.

The RSI has turned bullish for the first time in two months, pushing above the neutral line as buyers step back. The MACD mirrors the shift, printing a golden cross above the signal line.

Fully realised, the pattern sets eyes on a pre-October liquidation event demand zone at $0.000009 for a 95% gain.

And with supportive market conditions, such as a U.S. interest rate ease in December to stimulate demand for riskier plays PEPE, it could push 5x to all-time highs at $0.000028.

PepeNode: A Simpler Way to Position For the Bull Run

With most bull run setups flying under the radar under bearish market sentiment, it can be difficult to secure entries without leaving yourself exposed to potential heavy losses.

PepeNode ($PEPENODE) helps with an easier way to accumulate, without needing to time the market — the pitfall of most meme coin investors.

It’s a simple mine-to-earn (M2E) game. No hardware needed.

Just log in, acquire virtual nodes, stack rigs, and configure your setup to start earning passive rewards that diversify across top-performing meme coins.

Momentum is climbing fast. The presale has already passed $2.25 million, while early stakers can still earn up to 576% APY.

And thanks to a built-in deflationary model, where 70% of all $PEPENODE spent on nodes and rigs is burned, scarcity supports long-term token value.

PepeNode stands out as a smarter way to capture some of the market’s strongest upside—without worrying about timing the perfect entry.

Visit the Official PepeNode Website Here

The post PEPE Price Prediction: Price Bounces Off Yearly Low – Is the Frog About to Flip the Chart and Shock Everyone? appeared first on Cryptonews.

Dogecoin Price Prediction: DOGE Tumbles Toward Total Collapse – But is This the Best Buying Opportunity?

A sharp breakdown below Dogecoin’s long-term support trendline is stirring debate over the next major move, with Dogecoin price prediction searches surging across the space.

Having reached the 1 Fib retracement level at $0.13, meme coin DOGE now sits at a crucial juncture where a bounce or deeper collapse could define the coming months.

DOGE / USDT 1-day chart, Fibbonnaci levels. Source: TradingView.

A decisive close beneath $0.13 would expose Dogecoin to the deeper 1.618 Fib extension around $0.02, an 85% drop from current prices.

But it could also mark the start of the next bull run, acting as the launchpad to a deceptively bullish setup noted by popular pseudonymous X analyst Trader Tartigrade.

The latest monthly candle closed below a year-long ascending trendline, a move that has historically preceded a “massive DOGE season,” not a crash.

Dogecoin Price Prediction: How High Could DOGE Go?

The $0.13 level also aligns with the lower boundary of a year-long descending triangle, creating a potential breakout setup.

A recent double-bottom reinforces the pattern, positioning $0.13 as the base for a move to reclaim the 0.618 Fib level at $0.19 and establish a firmer higher footing.

DOGE / USDT 1-day chart, descending triangle pattern. Source: TradingView.

Momentum indicators now support the idea. The RSI shows a clear bullish divergence against recent price action, hinting at underlying strength.

The looming MACD death cross may prove short-lived if bullish pressure returns.

A clean breakout from the triangle sets up a roughly 220% measured move toward previous highs near $0.50, with a full pattern target of $1, a potential 530% rally.

Though such a move likely hinges on supportive market conditions, such as a U.S. interest rate ease in December to stimulate demand for riskier plays like meme coins.

PepeNode: An Easier Way to Accumulate

With most coins still teetering between bull run and collapse, it can be difficult to secure entries without leaving yourself exposed to heavy losses.

PepeNode ($PEPENODE) helps with an easier way to accumulate without needing to time the market—the pitfall of most meme coin investors.

It’s a simple mine-to-earn (M2E) game. No hardware needed.

Just log in, acquire virtual nodes, stack rigs, and configure your setup to start earning passive rewards that diversify across top-performing meme coins.

Momentum is climbing fast. The presale has already passed $2.2 million, while early stakers can still earn up to 577% APY.

And thanks to a built-in deflationary model, where 70% of all $PEPENODE spent on nodes and rigs is burned, scarcity supports long-term token value.

PepeNode stands out as a smarter way to capture some of the market’s strongest upside—without worrying about timing the perfect entry.

Visit the Official PepeNode Website Here

The post Dogecoin Price Prediction: DOGE Tumbles Toward Total Collapse – But is This the Best Buying Opportunity? appeared first on Cryptonews.

BNB Price Prediction: Binance Coin is Approaching the Best Buying Level in 6 Months – What Happens Next?

Binance Coin is flashing its strongest buy signal in six months, a trend line that has underpinned some of the most bullish BNB price predictions.

The 20-month structure has served as a firm bottom marker for the altcoin through this market cycle’s bullish phase, guiding consolidation and sparking surges.

BNB / USDT 2-day chart, 20-month support. Source: TradingView.

Now the trendline is back in play near $750, just another 15% below current prices, and broader market conditions favour it as a launchpad once again.

The U.S. macro narrative sets a bullish precedent. The Federal Reserve has just shifted course, ending quantitative tightening and injecting $13.5 billion in liquidity to support banks.

Whoa! The FED just injected $13.5B into the banking system via overnight repos.

2nd Largest liquidity boost since c-vid ! pic.twitter.com/A9nnllQqg2

— Josh Philip Phair (@JoshPhilipPhair) December 2, 2025

With fresh liquidity entering the system and expectations of a December rate cut to revive risk appetite, speculative assets like BNB could see renewed demand heading into 2026.

BNB Price Prediction: How High Could the Next Bull Run Go?

The 20-month support also corresponds with the lower boundary of an ascending broadening wedge, forming a potential breakout setup

As a launchpad, it could reset focus on a reversal towards its upper resistance, particularly with momentum indicators to show any decisive signs of bullishness.

If the level holds as a launchpad, it could refocus attention on a reversal toward the wedge’s upper resistance, particularly with momentum indicators yet to show decisive signs of bullishness.

BNB / USDT 1-day chart, ascending broadening wedge pattern. Source: TradingView.

The RSI has yet to print any meaningful divergence from price action, signalling a prevailing downtrend despite its recent rebound from the 30 oversold zone.

The recent MACD golden cross may also prove short-lived.

Zooming out, the weekly RSI has not yet touched the 30 oversold threshold, while the weekly MACD is only now approaching a golden cross, a telling sign that there is still room to fall.

The key breakout line sits near $1,050, and a confirmed move above it could send BNB into new price discovery, targeting a 70% rally toward $1,500.

SUBBD: The Next Big Low Cap Gem?

With market conditions shaping up for a 2026 bull run, market participants are positioning behind the next high-upside contenders, and increasingly, SUBBD ($SUBBD).

Positioned as an AI-powered content platform, SUBBD is redefining the $85 billion subscriber economy by giving creators true ownership and fans genuine access.

Never miss a sale again.

As a top creator, your audience is global. It's just not possible to cater to everyone – you can't be online 24/7 🫠

That's where your personal AI Assistant comes in, to handle requests and secure payments. Sleep peacefully knowing you're making money… pic.twitter.com/ju9VjLBmea

— SUBBD (@SUBBDofficial) March 26, 2025

By cutting out the middlemen, $SUBDD puts control back in the hands of those who create real value.

Creators can monetize directly, while fans gain access to exclusive content, early releases, and meaningful interactions through token-gated perks.

The concept is already gaining traction. $SUBBD nears $1.4 million in presale, as investors back the shift toward a decentralized creator economy.

With SUBBD, both sides of the community win — creators earn more, and fans get closer while embracing the decentralization use cases crypto was built for.

Visit the Official SUBBD Website Here

The post BNB Price Prediction: Binance Coin is Approaching the Best Buying Level in 6 Months – What Happens Next? appeared first on Cryptonews.

❌