Forget Bitcoin, The Uber-Wealthy Are Now Rapidly Buying XRP: CEO
Jake Claver, CEO of Digital Ascension Group, says ultra-wealthy families are rapidly accumulating XRP, and he believes most XRP holders still don’t realize how rare their position is. In a video posted on X, Claver revealed that his firm has been in recent conversations with large family offices that are now making significant allocations into XRP.
His comments arrive at a moment when XRP’s long-term narrative is witnessing increased interest due to ETFs, and they highlight a shift happening among investors who have always avoided cryptocurrencies altogether.
Wealthy Families Quietly Accumulating XRP
Claver explained that XRP ownership is currently extremely limited relative to the global population, noting that only around 8 million wallets exist on the XRPL. Half of those wallets contain fewer than 100 XRP, which makes existing holders far more uncommon than they may think. He contrasted this with Bitcoin’s widespread ownership, arguing that XRP is still early in its adoption curve.
He said the wealthy families showing interest are not looking for quick profits. According to him, they have already built their fortunes and instead see XRP as a form of insurance. According to his post, these families are buying crypto, not to get richer, but to protect the wealth they already have.
He described their interest in cryptocurrencies as a hedge. These investors want something uncorrelated in their portfolios ahead of any potential shock in traditional markets.
Claver’s $10K Price Target And The Conditions He Outlined
When asked where he sees the price of XRP going, Claver stated that he believes the cryptocurrency could be trading at $10,000 by late 2026 or early 2027. He tied this prediction to how much ecosystem infrastructure becomes active on the XRPL over the next two years.
He said the network would need substantial institutional-grade utilities, including XRP treasury systems, Evernorth’s launch, on-chain borrowing mechanisms, and new amendments to the XRP Ledger that will bring in additional compliance layers and smart-contract features.
His projection assumes that rising network volume will require higher liquidity levels and that price stability at four- and five-figure ranges will only be achievable if the ledger is handling large-scale financial flows. He also pointed to ETFs as a major factor in shaping supply and demand, noting that as ETF adoption grows, more XRP will be locked away in long-term institutional products.
Speaking of ETFs, Spot XRP ETFs are now approaching $1 billion in total net assets and could cross that threshold within the next few days. Since their debut, these funds have taken in about $897.35 million worth of XRP from exchanges and OTC desks, and they have yet to record a single day of outflows.
This growing demand ties directly into a quiet change happening among institutions, a trend Ripple’s CEO Brad Garlinghouse recently highlighted. He explained that Ripple is seeing notable activity through Ripple Prime, where long-watching institutions that once stayed out due to regulatory uncertainty or simple risk aversion are finally beginning to step in.
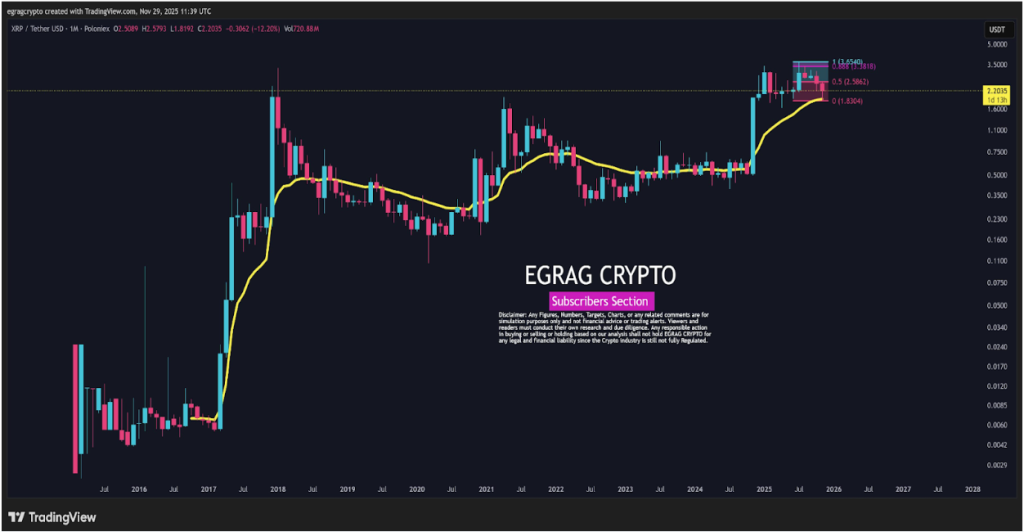
Featured image from Unsplash, chart from TradingView