Reading view

There are new articles available, click to refresh the page.

Ethereum Rewards Keep Rolling In As SharpLink Posts Fresh Staking Gains

Many major companies continue to lock in on Ethereum, the second-largest digital asset, despite the ongoing volatile action of the altcoin’s price. One of the methods currently adopted by these companies to grow their ETH portfolios is via Ethereum Staking, where they earn notable rewards.

SharpLink Scores Another Major Ethereum Staking

In the ever-evolving world of cryptocurrency, the Ethereum staking economy is still demonstrating its durability. As the staking economy gains traction, SharpLink Gaming, a leading public company, is once again at the center of this wave, with massive rewards from its ETH staking positions.

Being the first publicly traded company to adopt ETH as its primary treasury reserve asset, SharpLink continues to increase its exposure to Ethereum, as evidenced by its staking gains. A recent post on the X platform by the company reveals another round of significant staking rewards in the past week.

This development showcases the power of ETH’s proof-of-stake network in general as well as the company’s increasing yield performance. Furthermore, the most recent gains are bolstering confidence in long-term staking plans, which comes at a time when investors are keeping a closer eye on on-chain returns than ever.

As seen in the latest report, SharpLink scooped in over 446 ETH from staking rewards just last week. It was worth noting that since the company launched its ETH treasury in June 2025, they has experienced a persistent rise in their cumulative staking rewards.

Ethereum

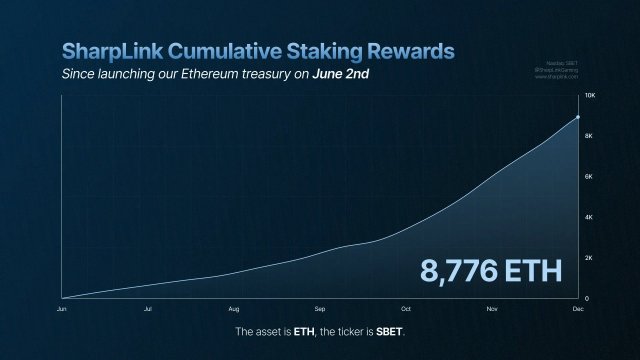
Following the recent gains, the total cumulative rewards have reached 8,776 ETH, which seems to have ignited a frenzy in the community. The firm’s ETH holdings remain 100% staked in an institutional-grade manner and maintain compounding value for the treasury.

Mlik Road, a crypto enthusiast, highlighted that at current prices and holdings, SharpLinks’ latest staking reward in one week is valued at $1.38 million. Interestingly, this amounts to around $70 million in income for the gaming firm annually.

As rewards keep rolling in, the important part of this development is that this figure is only expected to continue growing. When the price of ETH rises, the staking revenue of SharpLink will increase. In addition, when the firm’s ETH holdings increase, its staking income will multiply.

Whales Are Adding More ETH To Their Wallets

Ethereum’s bounce appears to have shifted the sentiment of investors, especially large investors or whales, toward a bullish standpoint. According to Santiment, a leading market intelligence and on-chain data analytics platform, ETH was a notable gainer on Tuesday, with a rise of +8.5% and an optimistic accumulation trend from whales and sharks.

Related Reading: Ethereum Emerges As A Dollar Settlement Powerhouse, Outpacing Traditional Payment Networks – Details

While these big investors have resumed ETH accumulation, retail holders have been offloading their holdings at a fast rate. Data shared by Santiment shows a massive accumulation of 949,240 ETH worth $3.15 billion in the past 3 weeks by whales. Meanwhile, small retail investors have gone on a selling spree, dumping 1,041 ETH over the past week.

Ethereum

Historic Reversal: Ethereum ETF Flows Plunge To Worst Month Since Launch

Ethereum’s momentum in institutional markets just hit a major roadblock. After months of enthusiasm surrounding spot Ethereum exchange-traded funds (ETFs), new data has shown that ETF flows have sunk to their worst monthly total since their launch. The sharp drop reflects a broader cooldown in investor demand, as market volatility and shifting risk appetite weigh on crypto allocations.

Will Staking ETFs Emerge To Stabilize Flows?

In an X post, a crypto analyst known as Milk Road revealed that the Ethereum ETFs had just printed their worst month on record since launch, which is roughly $1.4 billion in net outflows, the largest single-month withdrawal that ETH has ever encountered. 

Historically, ETF flow reversals tell more about liquidity pressure in the broader financial system than the long-term fundamentals of the asset itself. When redemptions spike this hard, it’s usually a sign that broader risk sentiment is cracking, not that the asset itself broke.

Ethereum

Meanwhile, most investors don’t know that while ETFs were handing back, Digital Asset Treasuries (DATs) stepped in as aggressive buyers. BitMine Immersion Technologies (BMNR) quietly added over 300,000 ETH, worth nearly $800 million at the time, to its treasuries. If the ETF outflow continues to accelerate, the near-term price action will remain choppy as liquidity gets strained at the edges.

However, if DAT inflows continue scaling, it builds the foundation for a tighter supply setup into 2026. The tension between this panicked short-term selling pressure and the quiet structural long-term accumulation is the most important dynamic for positioning.

Why ETH Reserves Are Becoming Strategic Corporate Assets

Crypto trader Bull Theory has noted that last week, BitMine bought an astonishing 138,452 ETH, worth $437.7 million. This single transaction solidifies their position as the largest ETH treasury in the world, holding 3.86 million ETH, valued at $12.4 billion and accounting for 3.2% of the entire circulating supply.

The true source of rising ETH demand is that Wall Street is quietly building on ETH. BlackRock, with $13.5 trillion AUM, has launched tokenized funds on ETH and has filed for a staked ETH ETF. JPMorgan, with $4 trillion, Deutsche Bank, with $1.1 trillion, and Standard Chartered, with $800 billion, are developing tokenization and DeFi infrastructure using ETH and its Layer-2 networks. 

Institutions like Amundi, HSBC, BNY Mellon, Coinbase, Kraken, and Robinhood are all using ETH rails for custody and settlement or rollup infrastructure for scaling and security. Furthermore, large companies are now holding and staking ETH for yield. BitMine alone expects to generate $400 million+ a year in staking revenue from its position. 

Tom Lee believes that as staking demand grows and institutions scale tokenization increases, ETH could reach $12,000 in 2026. “A Bitcoin miner is now the largest Ethereum whale, Wall Street is building on ETH, and treasuries are shifting toward yield. ETH is quickly becoming part of the Global Financial System.” Bull Theory noted.

Ethereum

Bitcoin Treads Water At $90,000 — Market Braces For FOMC To End The Compression Phase

Bitcoin is currently holding steady, trading water around the critical $90,000 level as the market enters a period of high compression. With ETF inflows slowing down, the price lacks the momentum to break through overhead resistance. The highly anticipated FOMC meeting is expected to provide the necessary catalyst to end the current consolidation and dictate Bitcoin’s next major directional move.

BTC Compression Intensifies: Scaling Back Intraday Scalps

According to a recent update from Lennaert Snyder, Bitcoin continues to tighten within a compression phase. The market has been trading in an increasingly narrow range, signaling that a larger move is approaching. Snyder noted that the scalp long and short setups from his previous analysis played out well.

He explained that as compression increases, the reward-to-risk ratio naturally declines. While the trades were profitable, they still fell into the category of “C-setups,” meaning they lacked the cleaner momentum and clarity found at range boundaries. Snyder emphasized that the best trading opportunities always emerge at the edges of a range.

With the current setup, his focus remains on the key resistance area around $94,000. A breakout above that level could offer long opportunities, while a failure there may open the door for shorts. On the downside, if price sweeps the lows and returns to the $87,400 support region, long entries are likely following signs of reversal.

Bitcoin

However, he added that if Bitcoin fails to show strength during this phase, he is not eager to take new long positions. A deeper retest of the $83,200 zone could become the next area of interest, though he expects any move toward that level to come with a liquidity sweep. 

Snyder also mentioned that he remains in shorts as a hedge, with scalp shorts still acceptable for traders who understand the increased risk at this stage. He concluded by highlighting the importance of the upcoming FOMC meeting, noting that the market is likely to stay muted until then.

Upcoming FOMC Meeting Dictates Bitcoin’s Next Major Move

Analyst Ted, in a recent update, revealed that BTC is currently in a state of consolidation around the $90,000 level. This tight range-bound movement suggests that while selling pressure is not dominant, buyers are also struggling to push the price higher aggressively.

Ted attributed the market’s current stagnation and its inability to break above major resistance levels to a slowdown in institutional investment. Specifically, he noted that recent ETF inflows have slowed down, removing a major source of directional buying pressure that typically drives breakouts.

Furthermore, the analyst highlighted that a critical macroeconomic event is pending: the FOMC meeting is scheduled for tomorrow, and the market’s next significant directional move will be heavily dependent on the outcome.

Bitco0in

Ethereum Emerges As A Dollar Settlement Powerhouse, Outpacing Traditional Payment Networks – Details

In the broadening blockchain sector, the Ethereum network remains a dominant force, heavily utilized and constantly selected by crypto players to carry out their on-chain operations. A recent report shows that Ethereum is transitioning from blockchain to the big league, as the network overtakes dollar-denominated transactions across digital payments.

A Leader In Dollar Transactions

With a surge in stablecoin transfer volume, Ethereum is no longer only a rival in the cryptocurrency space. In a post on the X platform, Leon Waidmann, a market expert and head of research at On-Chain Foundation, reported that ETH is currently surpassing some of the largest traditional payment networks in the world in terms of raw transaction volume.

Data from the post reveals a surge in dollar-denominated transactions on Ethereum, which has triggered new conversations about its increasing prominence as a layer of global settlement. This spike shows that the blockchain’s changing role in finance is becoming more difficult for institutions to ignore as volumes surge past expectations.

With one month remaining in the year, the amount of ETH stablecoin transfers in Q4 has already exceeded that of Q3. According to the data, the leading network has recorded nearly $6 trillion in stablecoin volume in the fourth quarter of this year alone, reflecting its growing demand for payment settlement.

Ethereum

When it comes to dollar-dominated transaction volume, the blockchain has already outpaced both Visa and Mastercard transaction volumes in the current quarter. Given the surge in stablecoin transfer volume, Ethereum is gradually becoming the major settlement layer for digital dollars.

Waidmann stated that the size makes early Decentralized Finance (DeFi) activity appear insignificant by comparison. In the meantime, the conventional financial infrastructure is being surpassed by the on-chain economy.

Ethereum Network’s Throughput Exhibiting Robust Growth

As demand for Ethereum as the main settlement layer grows, the network is also quietly entering a new phase of its evolution. This change is one that is characterized by accessibility, efficiency, and quickness rather than traffic jams and soaring costs.

Waidmann highlighted that ETH scaling is rising, alongside growing throughput and declining transaction costs. With transaction prices continuously declining and network throughput surging, the blockchain is demonstrating concrete evidence that its long-promised scaling vision is coming to pass.

As a result, Ethereum will be able to handle an increasing amount of activity over time. However, the network’s usage cost continues to decline, drawing close to zero. Currently, Layer 2s take care of the heavy execution while the mainnet settles the valuable transactions. Should these two lines continue to move in opposite directions, ETH is scaling just as planned.

At the time of writing, the price of ETH was still holding above the $3,100 level despite recording a more than 1% decline in the last 24 hours. Its trading volume has also witnessed a bearish action, dropping by over 4% in the past day.

Ethereum

XRP ETFs Shatter Records With Their Biggest Weekly Inflows To Date, Wall Street Flocking In?

Despite a recent bounce and the broader cryptocurrency market gradually turning bullish, the price of XRP remains confined between the $2 and $2.12 range. XRP’s price may be experiencing sideways movements, but both retail and institutional investors are still showing heightened appetite for the leading alctoin via the Spot Exchange-Traded Funds (ETFs).

A Record-Breaking Week For The XRP ETFs

In the world of digital asset investments, XRP is emerging as one of the major assets that is gaining serious attention among investors and traders. Following a significant inflow of cash into exchange-traded funds linked to the leading cryptocurrency, it is once again in the limelight of crypto investment.

A crypto enthusiast known as XRP Update on the social media platform X has outlined that the altcoin is currently undergoing massive validation. While the broader market cools down, Spot XRP Exchange-Traded Funds (ETFs) record their largest weekly inflows since the products were launched.

A massive wave of capital flowing into a fund indicates that sentiment among investors, especially institutions, is undergoing a powerful shift. In addition, it suggests that major investors may be actively preparing for the altcoin’s next notable move upward rather than remaining on the sidelines.

XRP

According to the data shared by the enthusiast, the funds amassed inflows valued at $289 million in a single week, marking its most successful week ever. After this week of bullish trading for the funds, they have now recorded massive inflows in 6 consecutive weeks. 

These 6-week inflows currently represent nearly 30% of the total Assets Under Management (AUM), which is likely associated with the recent United States ETF launches. When ETF inflows surge, it typically implies that institutional demand is increasing again, indicating that high-net-worth investors are exploring the token.

The Fund Takes The Lead In Cryptocurrency Spot ETF

XRP has just reached a major milestone that reflects its growing position as a valuable and reliable investment strategy. Brad Garlinghouse, the Chief Executive Officer (CEO) of Ripple, announced that the token has emerged as the fastest-moving crypto Spot ETF on the market.

After more than 4 weeks of launch, the fund continues to record inflows, reaching $1 billion in AUM in the US, making it the fastest ETF. This type of growth was last seen with its Ethereum counterpart, which launched late last year. With over 40 crypto ETFs introduced this year in the US alone, Garlinghouse has offered his take on what the development means, highlighting two key takeaways. 

According to the Ripple CEO, demand for regulated cryptocurrency goods is pent up. Additionally, millions more people who don’t need to be experts may now use crypto thanks to Vanguard’s offering of access to regular retirement and trading accounts for Americans.

For this new generation of off-chain crypto holders, Garlinghouse noted that durability, stability, and community are all important but often overlooked factors.

XRP

Bitcoin Active Addresses Slide As ETF Era Rewires Market Participation — Here’s Why

Bitcoin’s on-chain activity has shown a sharp slowdown since spot Bitcoin exchange-traded funds (ETFs) launched. While institutional inflows into these products have accelerated, the number of active BTC addresses has declined. As Wall Street embraces BTC exposure, the network’s grassroots participation appears to be undergoing a significant transformation.

In an X post, the CEO of SwanDesk, financial analyst Jacob King, pointed out that Bitcoin active addresses have been in a steady decline since the US spot BTC ETFs launched in January 2024, and the irony is obvious.

Why Retail Participation Shows Signs Of Fatigue

 For years, BTC maximalists have pushed for Wall Street adoption, believing institutional involvement would unlock the next wave of mass usage. Instead, on-chain participation has dropped sharply as retail lost interest.

King noted that these Bitcoiners have piled into the ETF for a quick, early FOMO bump, and then bailed, leaving behind a market where the asset is increasingly traded by proxy. According to King, ETF investing kills BTC’s core principles. While investors no longer hold or control their own assets as banks do, which is the very system BTC was designed to challenge, greed always beats ideology.

Bitcoin

Market watcher Crypto Seth has revealed that the net inflows into BlackRock and Fidelity’s spot BTC ETFs have been relatively subdued since October 10, when the largest liquidation events happened. Seth believes that this might turn into a momentum reversal soon, as the US stock market is at 1% below new highs despite retail sentiment remaining stuck in extreme fear.

Seth also pointed out that the macro backdrop is shifting in BTC’s favor. This is because the Federal Reserve ended its Quantitative Tightening (QT) program on December 1, 2025, wrapping up a multi-year effort that shaved nearly $3 trillion from the balance sheet since 2022. 

Since the US Fed rate is still at 4.00%, more interest rate cuts are on the horizon, which is higher than both Europe and China. The BlackRock iShares BTC Trust (IBIT), which was launched in January 2024, is currently the firm’s most profitable exchange-traded fund (ETF) based on annual fee revenue, despite being less than two years old.

Unlocking Bitcoin Without Compromising Its Core Principles

Bitcoin is seeing key initiatives that improve its ecosystem. Every market cycle that has promise to unlock Bitcoin for decentralized finance (DeFi), RioSwap is one of the few products built on infrastructure that was capable of unlocking it in a truly decentralized way. 

According to Mintlayer, this was powered by Mintlayer’s native HTLC architecture, as RioSwap introduces a Decentralized Exchange (DEX) that allows BTC to move directly into decentralized markets without wrapping, unbridging, and is fully in the user’s control. With the RioSwap testnet now live, Mintlayer sees this as the start of a new liquidity phase for BTC where the asset will become an active participant in the decentralized market on its own terms.

Bitcoin

Ethereum Inches Toward A Critical Decision Point: Bullish Break Or Deeper Dive?

Ethereum is edging closer to a major decision point as price action tightens between key support and resistance levels. Momentum is building, but the market now awaits to see whether bulls can force a breakout or if a deeper pullback ensues.

Ethereum Holds The Line: $3,000 Support Ignites Fresh Upside

According to a recent update by analyst Ted Pillows, Ethereum has demonstrated resilience in the face of recent market volatility. The asset successfully held up the crucial $3,000 level and is now showing signs of moving higher, suggesting that this level remains a strong foundation for the current price action.

Ted highlighted a significant external factor contributing to the upward pressure: some large whales have reportedly opened ETH long positions. This institutional or large-scale buying interest has been identified as a major driver fueling the current price move, suggesting that deep-pocketed investors anticipate further appreciation.

Ethereum

The analyst provided a clear trigger zone for the next significant leg up. If ETH can break decisively above the $3,300–$3,400 level, it will serve as structural confirmation, expected to trigger a swift rally to the next resistance zone between $3,700 and $3,800.

However, Ted also outlined the risk scenario. A failure to break above the $3,300–$3,400 zone could result in the asset turning back down for another retest of the foundational $3,000 zone.

Upside Reaction Expected From Major Support Zone

In an earlier update, More Crypto Online highlighted that Ethereum is currently reacting from a major weekly support zone, suggesting that an upside move remains likely. However, the analysis also noted the possibility of one more low before a stronger reaction takes shape, keeping both scenarios firmly in play.

The key resistance area above remains the most important region to watch. Once ETH approaches this zone, the market will essentially be forced to decide which direction it will take over. Both bullish and bearish scenarios remain valid based on the broader market structure. 

What ultimately shifts the probability toward one side is how ETH behaves at these critical levels. A sustained hold and strong reaction could reinforce the bullish case, while weakness or rejection could signal the opposite.

For now, the market is still in the phase before major confirmation. If Ethereum loses support and forms a clear five-wave decline to the downside, the bearish “white scenario” becomes the leading outlook. Until then, the chart simply outlines the conditions that will reveal the market’s preferred path once price makes its next decisive move.

Ethereum

Ethereum On Exchanges Crashes To Historic Low Amid Market Volatility, A Bullish Signal For Price?

Ethereum saw a bounce back above the $3,000 price market, with bullish sentiment gaining momentum among investors, especially those on centralized exchanges. Even with the market experiencing sideways movements, the overall supply of ETH on crypto exchanges has fallen sharply, hitting unprecedented levels.

Lowest Supply Of Ethereum On Exchanges

Recent signals from on-chain metrics indicate that the Ethereum market environment is undergoing a quiet yet significant transformation. This unfolding trend is due to the sharp drop in the supply of ETH available on cryptocurrency exchanges.

Related Reading: Ethereum Network Fatigue? Monthly On-Chain Transactions Drops As Activity Slows Down

As reported by Coin Bureau on the social media platform X, ETH supply on centralized exchanges has hit levels not seen in years. With more holders choosing long-term storage, staking, and self-custody over keeping their assets available for trade, this significant supply drain indicates a change in investor behavior.

Data from the ETH Percent Balance on Exchanges metric shows a total of 8.7% of Ethereum supply available on exchanges, marking the lowest level since ETH’s launch in 2015. 

Ethereum

As exchange reserves decrease, the structural pressure on ETH’s circulating supply is increasing, which could create a scenario for a more explosive price environment. Coin Bureau stated that several crypto analysts are currently warning that tightening liquidity might trigger a robust rally when demand recovers.

Mid-Size Whale Holders Are Still Existing In The Market

Despite a sharp withdrawal of ETH from exchanges, selling pressure still remains in the market as indicated by the Ethereum Accumulation Heatmap. After examining the metric, Alphractal, an advanced investment and on-chain data analytics platform, uncovered that wallet addresses holding 1,000 ETH to 10,000 ETH, or mid-size whales, are offloading their holdings, signaling weakening sentiment among the group due to ongoing market fluctuations.

According to the metric, these investors carried out heavy distribution just near the price top. The cohort was the one who took advantage of the euphoria to secure profits while others were celebrating at the all-time high.

What’s interesting is that these investors are still selling, mounting heavy bearish pressure on the market, which is likely fueling the current bearish wave. Meanwhile, wallet addresses holding at least 10,000 ETH or mega whale holders continue to be considerably more neutral, with relatively light distribution, demonstrating no panic, no aggressive buying, at least not yet.

Such a trend suggests that supply behavior is not completely aligned with the euphoria of retail investors. These accumulation and distribution patterns are vital to gauge those who are actually driving ETH’s price moves. It also determines those who are quietly heading for the exit, while others are still entering.

At the time of writing, the price of ETH was trading at $3,135, demonstrating a more than 3% rise in the last 24 hours. Bullish sentiment seems to be returning strongly, as evidenced by an over 142% increase in trading volume over the past day.

Ethereum

XRP Mixed Signals: Latest Metrics Point To A Market At Crossroads

On Sunday, XRP staged a bounce to the $2.1 price level, flipping the market into a bullish atmosphere. However, on-chain metrics are flashing conflicting signals as the market splits between bullish and bearish narratives due to a disparity in investors’ actions on major exchanges.

A Two-Sided XRP Market Mood Emerges

XRP, a leading altcoin, has sent one of its most perplexing signals in recent months, leaving traders unsure about what to expect next in the market or price. Arthur, a market expert and official partner of the BingX crypto exchange, has outlined a distinct behavior among investors in two regions.

According to the market expert, the altcoin is exhibiting a mixed signal right now after examining the activity of investors on the Binance and Bithumb exchanges. Currently, investors on the Binance exchange are demonstrating bullish activity while those on Bithumb are displaying signs of weakening sentiment and uncertainty.

On the Binance side, Arthur noted that the supply of XRP on the exchange is experiencing a steady decline. This persistent withdrawal from the largest cryptocurrency exchange in the world is mostly carried out by large investors known as whale holders, which is causing a tightening supply.

XRP

Such a pattern extends beyond simple reshuffling from these key investors. Furthermore, it points to a strategic move by wealthy investors, who usually take action ahead of more general market trends. Historically, the movement of these high-value wallets’ assets away from centralized exchanges is a sign that the cohort could be getting ready for an impending market catalyst.

Meanwhile, on Upbit and Bithumb, the expert reported that there is a steady flow of XRP into the two largest crypto exchanges in South Korea. When coins flow into exchanges, it usually points to short-term selling pressure, suggesting that investors in the Asian region are currently locking in profits.

Heightened Demand For The Altcoin Via ETFs

Demand for XRP is still waxing strong in certain key areas, especially the Spot Exchange-Traded Funds (ETFs). Following weeks of market turbulence, institutional appetite for the altcoin appears to have increased, creating a strong new tailwind.

In another X post, Arthur reported that the altcoin has experienced steady inflows over the last 15 days, signifying the longest continuous run since funds tracking the token started trading. Within this timeframe, the expert highlighted that the funds have recorded a whopping $900 million Asset Under Management (AUM). 

Despite modest price movement, this consistent flow of funds indicates that big investors are discreetly increasing exposure, indicating growing confidence in XRP’s long-term prospects. With the Clarity Act set to gain approval, the expert is confident that the development could attract more inflows into the funds. It may also see retail investors, institutional investors, and ETFs moving in a single direction.

XRP

Here’s Why XRP Positions Itself As Treasury-Grade Rail For Institutions Moving Trillions

The narrative around XRP has definitively moved past the era of pure retail speculation. While the global financial system is accelerating its transition to real-time settlement, XRP is emerging as a contender for enterprise-level treasury flows. As Ripple’s institutional network continues to expand, the altcoin is stepping into a role where digital assets can enhance liquidity management and power the next generation of global value transfer.

Why RippleNet’s Expanding Network Drives Enterprise Confidence

The bearish view of XRP is clouding the bigger transformation happening behind the scenes. Analyst Xfinancebull has mentioned on X that XRP is embedding itself into the financial engines where global treasury systems teams move trillions. With the GTreasury acquisition, Ripple gains access to the operational layer where $12.5 trillion in enterprise liquidity flows.

This is about the altcoin becoming a native rail inside the financial command centers of over 1,000 multinational giants where trillions move. Treasury teams move real money, not just $100 payments, but payroll, supply chain financing, and liquidity management across continents. 

The XRP niche is that it moves trillions fast, 24/7, across borders. Meanwhile, Ripple now controls the infrastructure platform that interacts with BNY Mellon to move trillions and automates finance at scale.

According to Xfinancebull, the token goes from a speculative asset to invisible plumbing. This shift doesn’t make the front-page headlines, but it moves everything behind them. Most analysts won’t notice that this has unlocked the token to become a standard settlement rail in the GTreasury automation stack, making its utility broader, invisible, and massive.

Founder of Lux Lions NFT and host of the crypto Blitz YouTube show, RipBullWinkle, stated that the Federal Reserve has officially halted its Quantitative Tightening (QT) measures, ending the two-year liquidity drain that weighed down the entire crypto sector. 

Vanguard, the world’s second-largest asset manager with $11 trillion in AUM, has reversed course and will now allow clients to have access to the regulated crypto ETFs. This single move clears the path for trillions in passive capital, a macro environment of liquidity, compliance, and global settlement that XRP is engineered for. 

How XRP Defies The Market Slump With A Rare Positive Performance

While the crypto market has been struggling to find its footing, an observer and researcher of the current tech shift, SMQKE, has noted that WisdomTree data shows that XRP is the only major cryptocurrency posting positive year-to-date returns in 2025. On a year-to-date basis, where the broader markets were pulling back, the altcoin has stood out as the lone performer, holding onto a modest +4% gain year-to-date.

In a challenging year for most large-cap digital assets, it has emerged as the top-tier asset with a positive year-to-date performance. Even after experiencing drawdowns in line with the broader market during Q4, XRP has demonstrated remarkable relative resilience and remains up +4% YTD and +12% over the past 12 months.

XRP

Bitcoin Structure Tightens: One Break Above This Zone Could Ignite A Run To $107,000

Bitcoin finds itself at a critical crossroads, hovering between two major price zones that could define its next big move. Buyers and sellers are locked in a tight battle, and the market now waits for a decisive break. A push above key resistance could open the door to $107,000, while weakness at support risks a deeper slide toward $71,000.

Bounce Scenario: A Return Toward The Pink Box And Descending Trendline

Kamile Uray, in her latest update on Bitcoin, noted that BTC failed to hold above the $90,720 level on the hourly chart, triggering the expected decline. The first immediate support now sits at $87,644, while the deeper support range lies between $83,822 and $82,477. If buyers defend this zone successfully, Bitcoin could attempt another climb toward the pink box region and retest the descending trendline overhead.

Uray explained that a sustained move above the pink box resistance on the daily timeframe would open the door for Bitcoin to challenge the descending blue trendline. A confirmed breakout from this area could strengthen bullish momentum, pushing the price toward the next major resistance levels at $98,200 and $107,500. A break above $107,500 alongside the descending trendline would serve as a strong signal that the broader uptrend is ready to continue.

Bitcoin

However, she warned that a daily close below $82,477 would shift the market structure toward further weakness, placing Bitcoin at risk of revisiting lower levels. Even so, Uray highlighted one critical area of strength: the $74,496–$71,237 zone. This region represents the key breakout top from November 2024 and is considered a strong historical support. In this area, buyers may step in aggressively, potentially setting the stage for an upward reversal.

Bitcoin Price Rejection At $93,000–$95,000 Zone

According to Crypto Candy, Bitcoin’s latest price action has been unfolding precisely in line with expectations. After facing rejection in the $93,000–$95,000 resistance zone, BTC dipped sharply and nearly touched the anticipated support range at $86,000–$87,500. This move reflects the broader market’s reaction to heavy selling pressure near the upper resistance band.

Crypto Candy emphasized that the $86,000–$87,500 zone now serves as a crucial pivot area. If buyers successfully defend this support and the price stabilizes above it, Bitcoin could once again revisit the $93,000–$95,000 range, or even push beyond it.

Such a rebound would signal renewed bullish momentum and set the stage for another attempt at breaking higher resistance levels. However, the analyst also warned that failure to hold the $86,000–$87,500 support could trigger deeper downside movement. If the level gives way, Bitcoin may slide to lower price zones in the coming days as bearish pressure strengthens.

Bitcoin

Ethereum Shows Strength: Indicators Suggest Bigger Moves Ahead

Ethereum is gaining momentum, and several technical signals suggest that a significant move could be on the way. With key support levels holding and bullish patterns forming, the market may be setting up for a notable upside.

Golden Pocket Rejection: Confirming The High-Risk Scenario

In a recent update on X, analyst Luca referenced his recent market commentary, noting that Ethereum price action unfolded exactly as he had anticipated, with the price tapping into the lost high-timeframe support range. This range aligned with the golden pocket between the 0.5 and 0.618 Fibonacci retracement levels, and the price rejected there, confirming the high-risk scenario he had highlighted in advance.

Since that rejection, the price has broken below the key 0.618 Fibonacci Point of Interest (POI). However, the asset is still managing to hold above the crucial 1-Day Bull Market Support Band. Luca stressed that this band has historically served as a strong reversal spot over the last couple of months. Thus, he believes the current low-timeframe market structure is not yet fully invalidated.

Ethereum

Despite this technical hold, the analyst reiterated his cautious approach, stating that until he sees clear signs of strength on the low-timeframes, signs that can durably confirm the bottom is in and that key support levels are properly reclaimed, he won’t scale out of his edges.

Luca concluded that until that concrete bullish confirmation materializes, the most likely outcome for the immediate future remains further consolidation. The market needs time to absorb the recent volatility and build a new base before a more durable reversal to the upside can take hold.

ETH/BTC Trendline Breakout: Market Risk Appetite Returns

Crypto analyst Paramatik outlined that a major structural event has occurred on the ETH/BTC charts: a falling trend breakout. This is a highly significant development, although Paramatik suggests that a retest of this broken trendline may occur before the upcoming Federal Reserve meeting.

The analyst provided clarity on what this breakout means for the broader market. First and foremost, this situation is interpreted as a strengthening signal for Ethereum. When ETH begins to gain value relative to Bitcoin, it typically indicates that the market’s overall risk appetite is returning, as investors shift capital from BTC to ETH.

Secondly, the gained strength in Ethereum is often the key trigger for the start of the much-anticipated altcoin season. This is because investors first shift funds from BTC to ETH, and then move capital into the riskier, smaller altcoins in hopes of achieving higher returns.

Paramatik summarized his findings by stating that this breakout in the ETH/BTC pair is not merely a technical line break; it is a harbinger of a market direction change. The analyst concluded with an analogy that the market has reached a state where every external event, even humorously irrelevant ones, could affect crypto prices.

Ethereum

Here’s Why Bitcoin Volatility Sparks Fresh Attention On MicroStrategy

The Bitcoin price volatility is once again drawing attention to MicroStrategy, the company whose strategy has become a major market reference point, with billions in accumulated BTC and a track record of aggressive buying during downturns. As traders search for stability in a shaky market, Strategy’s stance is being watched closely for what it might signal about the next phase of BTC’s trend.

Why MicroStrategy’s Next Move Could Redirect Market Momentum

Bitcoin’s recent volatility has put MicroStrategy (MSTR), the largest corporate holder of BTC, in the limelight. Walter Bloomberg has revealed on X that analysts are watching closely to see if the company could influence the cryptocurrency’s price if it sells some of its holdings.

According to JPMorgan, Strategy can avoid forced sales as long as its enterprise value-to-BTC holdings ratio stays above 1.0, which currently stands at 1.13 BTC. However, analysts continue to debunk these claims, accusing JPMorgan of spreading misinformation about market manipulation and the company.

Walter stated that if the ratio remains above this level, BTC markets may stabilize and ease recent market pressure. Due to the market pressure, the firm has slowed its BTC purchases, adding 9,062 BTC last month compared to 134,480 BTC a year ago, reflecting a more cautious accumulation approach amid a broader crypto downturn. Its stock has dropped roughly 42% over the past three months.

Additionally, challenges include the potential exclusion from MSCI indices, which could trigger $8.8 billion in passive fund outflows if index funds are forced to divest. However, MicroStrategy holds a $1.4 billion reserve for dividends and interest, helping it avoid selling its BTC even if the price falls further. In the meantime, there is no proof that MicroStrategy is in danger of liquidation.

How Institutional Behavior Builds A Higher Floor For Bitcoin

In a market speculation, Bitcoin is currently experiencing one of the most significant capital migrations in its history, fueled by institutional adoption. Analyst Matthew noted that the current BTC market cycle from 2022 to 2025 has already absorbed an unprecedented amount of new capital, surpassing all previous BTC cycles. This growth is a reflection of the market’s maturity and the ecosystem’s innovative approach to liquidity through regulated instruments.

Bitcoin

Furthermore, the network has incorporated more than $732 billion in fresh capital in the current cycle, surpassing the $388 billion that was injected during the 2018 to 2022 cycle. At that time, the surge helped push BTC market capitalization to an all-time high record of $1.1 trillion, a metric that indicates a much higher aggregate cost base for new institutional investors.

Related Reading: Why Bitcoin Traders Fear A Repeat Of July 2024’s Crash Next Week

Meanwhile, the total settlement volume in the decentralized BTC protocol was approximately $6.9 trillion in just 90 days. Despite this, the number of active on-chain entities dropped from 240,000 to 170,000 per day, which is a reflection of liquidity migration of capital flows into spot ETFs.

Bitcoin

This Key Dogecoin Metric Shows The Market Is Entering Into An Accumulation Territory

As Thursday drew to a close, the entire cryptocurrency market flipped sharply bearish again, causing Dogecoin’s price to fall below the $0.15 mark. Despite the persistent struggle to produce another major rally, traders’ sentiment seems to be turning bullish, leaning towards accumulation, as indicated by a key on-chain metric.

Dogecoin Moving Into Accumulation Mode

A fresh reading indicates that the Dogecoin market is currently at a pivotal juncture that could shape its next trajectory and price dynamics. Sina Estavi, a builder and the Chief Executive Officer (CEO) of Bridge AI, reported that on-chain data is pointing to a decisive shift in the current market trend of DOGE.

Estavi’s research is based on the key Dogecoin Bubble Risk Model, a metric that determines when the price of an asset is significantly overvalued relative to its fundamental value. After examining this crucial metric, the builder has found a shocking trend that suggests the meme coin is experiencing a positive market phase.

According to the expert, the data from the metric is quite clear, showing that DOGE is currently not in a bubble phase. It is worth noting that the bubble-risk indicator only flashes red when speculative excess rises to extreme levels. Meanwhile, recent data is showing that the signal is muted in comparison to previous market cycles. 

Dogecoin

This development opposes the tales of fear that frequently emerge with significant price fluctuations. Rather, the signal suggests that the market is acting in a surprisingly stable manner, bolstered by consistent accumulation, strong holder belief, and robust network activity.

Estavi highlighted that from a structural standpoint, Dogecoin is shifting into an accumulation territory, not a blow-off top. In the meantime, this measure is unfolding as a subtle but potent indicator that the asset’s base is still far stronger than critics believe.

Active Addresses Showing Up At A Substantial Rate

The gradual shift into accumulation territory is evidenced by the massive wave of active wallet addresses on the Dogecoin network. Despite the ongoing volatility in the market and pullback in DOGE’s price, new investors appear to be reappearing at a substantial rate.

Ali Martinez, a market expert and trader, shared this development, which points to renewed demand and confidence in the leading meme coin. Data from Martinez shows that Dogecoin recorded over 71,589 active addresses on the network as of Thursday.

As seen on the chart, the figure marks the highest spike in the metric since September 2025. This rapid expansion suggests that genuine momentum is developing beneath DOGE’s current market trend, possibly foreshadowing a significant shift in market behavior and future price direction.

At the same time, heightened accumulation has also been ongoing within the whale cohort. In another X post, Martinez noted that whale investors have gone on a buying spree, scooping up millions of DOGE in the last 2 days. Within the time frame, the cohort acquired over 480 million DOGE, valued at approximately $71.2 million at current prices.

Dogecoin

Bitcoin’s Latest Drop Isn’t Just Another Correction, But A Clear Capitulation Event – Here’s Why

After a brief moment of bullish performance in Bitcoin, the price experienced a sudden pullback due to a broader market shakedown, which caused BTC to revisit the $90,000 threshold. While this pullback has sparked a frenzy in the cryptocurrency community, on-chain data has revealed a shocking trend about the sudden pullback.

True Capitulation, Not A Routine Bitcoin Pullback

The market was rocked by a recent decline in the price of Bitcoin, but this pullback comes with an extra layer. Alphractal, an advanced investment and on-chain data analytics platform, has shed crucial insights about the decline using several key indicators to determine the unseen trend.

After carrying out its research, the on-chain platform revealed that the latest Bitcoin drop was not just another correction, but a clear instance of a capitulation event. This abrupt turnaround seems to have embodied all the characteristics of a full-scale capitulation event. These include an emotional flush-out when panic selling, forced liquidations, and intense dread came together in one dramatic moment.

Alphractal’s reading is backed by three major signals that rarely show up together, suggesting a pivotal moment for BTC. Such a trend may be the turning point that reshapes the short-term trajectory of the crypto king.

The first signal highlighted by the platform comes from the Bitcoin Hash Rate, which has witnessed a steady decline over the last 30 days. Presently, miners are turning off their machines, triggering heightened pressure on the ecosystem. When miners begin to lose money, it typically implies that the market might have reached its peak.

Another signal is coming from the BTC price drawdown. After a fast, violent drop, the metric is hitting extreme levels beyond the historical median. This is not just a technical drop, but it’s pain, triggered by forced selling and liquidation.

A Rare Trend And A Good Entry Opportunity

Finally, the last signal is the recent spike in active supply as those holding BTC for months or years have begun spending their coins. A behavior of this kind only unfolds when investors exhibit heightened caution, causing sentiment to drop. 

An interesting aspect about this trend is that when these 3 signals flash in unison, the Capitulation Oscillator tends to rise. This is a moment that nearly always denotes the conclusion of a downward trend or a leveling phase, as was the case in 2021.

Bitcoin

While it has played out in previous scenarios, it is not a guarantee of an immediate bottom. However, moments like these have historically been uncommon and frequently present opportunities that only occur once or twice every cycle, especially for those rooted in on-chain data.

Joao Wedson, the founder of Alphractal, also confirms these signals, which point to real capitulation. According to Wedson, the recent correction was the most severe capitulation event since 2022. 

Nonetheless, this has traditionally led to the formation of long accumulation regions before the price makes its next macro direction. In other words, Wedson noted that the highest probability scenario is that 2025 will end in a broad sideways range; a classic phase of accumulation or redistribution.

Bitcoin

Chainlink Bullish Path – This Zone Will Decide The Next Big Move

Crypto analyst CryptoWzrd, in a recent Chainlink daily technical outlook, noted that the candle closed slightly bearish, but the overall structure remains constructive and pushes toward the key $16.00 resistance, where momentum could shift quickly. According to the analyst, a retest of the $13.50 support or a break above the $15.20 resistance will be the critical trigger for the next major trade setup.

Indecisive Daily Close Sets the Stage For A Critical Trendline Test

CryptoWzrd noted that both LINK and LINKBTC closed the daily candle in an indecisive manner, reflecting uncertainty in the short-term market direction. Despite this hesitation, the broader structure remains intact, and price action is approaching a technically significant point that will play a crucial role in determining the next major move for Chainlink.

According to the analyst, LINKBTC is now testing its daily lower-high trendline. A series of bullish candles emerging from this zone would be a strong signal that buyers are re-entering the market. If this momentum builds, it is likely to spill over into Chainlink, potentially triggering an impulsive rally.

Chainlink

Should bullish confirmation appear, LINK could drive toward the $16 resistance level, a region that has been tested multiple times in the past. A clean breakout above $16 would open the door for a swift extension toward the next major hurdle for the bulls $20 resistance, marking a significant continuation of upward momentum.

On the downside, CryptoWzrd emphasized that the $12 level stands as the primary support. A daily close below this level would weaken the bullish structure and could signal a deeper correction. Until then, the trendline test remains a critical focal point where LINK’s uptrend will continue or reverse.

ChainLink Choppy Intraday Movement Signals Caution

Conclusively, the analyst highlighted that the intraday chart was characterized by being somewhat choppy and trading within a very tight, small range. This consolidation phase often precedes a significant directional move, but it has made short-term trading decisions challenging without a clear trigger.

The analyst defined a specific setup to watch for: a bearish pullback towards the $13.50 support level, followed by a decisive bullish reversal, would serve as the ideal trigger for a long position. Such a trade would initially target the $15.20 resistance and potentially move toward higher levels thereafter.

By confirming immediate strategic focus, the analyst stated that his attention “tomorrow will remain on the lower time frame chart development” to scout the next optimal scalp opportunity. This indicates a short-term, opportunistic trading mindset by waiting for the confined range to break or for the identified mean-reversion setup at $13.50 to play out.

Chainlink

Ethereum Coils For A Breakout As IH&S + Heavy Accumulation Emerges

Ethereum is approaching a critical moment as multiple bullish signals begin to align. A clear Inverse Head & Shoulders formation, combined with rising accumulation and weakening trend rejection, suggests that the market may be gearing up for a powerful upside move. With momentum tightening and key levels coming into focus, ETH now stands on the verge of a breakout that could set the stage for its next major rally.

Inverse Head And Shoulders Signals Brewing Momentum

According to a recent update shared by crypto analyst Donald Dean, Ethereum may be gearing up for a significant move. He highlighted the development of a potential inverse head and shoulders pattern, a classic bullish reversal formation that often precedes strong upward momentum. This emerging structure suggests that ETH could soon shift into a more aggressive bullish phase if confirmed.

Dean also pointed out that the weekly chart is showing solid support near the 50% Fibonacci retracement level, positioned around $2,750. Adding to the bullish signals, a hammer candle has appeared on the weekly timeframe, hinting at buying pressure stepping back in after recent downside movement.

Ethereum

If the pattern plays out, Dean noted that Ethereum’s first major target lies at $4,109, a level that would allow ETH to challenge previous resistance/support zones. Reclaiming this region would mark a meaningful shift in momentum and strengthen the bullish outlook for the asset.

Beyond that, the next upside target sits near $5,766, which aligns closely with the 1.618 Golden Ratio extension calculated at approximately $5,793.51. Dean described this confluence as particularly noteworthy, suggesting that if Ethereum breaks above its nearer targets, a larger rally toward this golden-ratio level becomes a realistic possibility.

Growing Accumulation Suggests Bulls Are Preparing For Action

In an earlier analysis, LSTRADER reminded followers of the impressive move from $1,600 to $4,800, noting that this surge had been identified in advance through both the ETH chart and the ETH/BTC setup. The analysis captured the momentum shift that preceded the rally, reinforcing the value of tracking key structural signals.

In the current market structure, LSTRADER noted that the chart clearly shows multiple instances where the trend faced rejection. Despite these rejections, the trend is steadily losing strength while accumulation continues to build, a combination that typically reflects growing bullish interest and the potential for an upward breakout.

However, LSTRADER stressed that no major move should be assumed until the trendline itself is broken, and confirmation is still required. For now, patience is key as traders continue monitoring the structure and waiting for a decisive shift in trend direction.

Ethereum

Reversal Loading? Bitcoin, Ethereum, And Solana Build Powerful High-Time-Frame Structures

In the volatile theatre of the cryptocurrency market, Bitcoin, Ethereum, and Solana are showing signs of a potential high-time-frame reversal. After weeks of stress and price compression, each of the top assets is now stabilizing at key structural support levels. The multiple leading cryptocurrencies are flashing similar recovery setups at the same time.

The current crypto landscape may be setting up one of the most powerful high-time-frame reversals across Bitcoin, Ethereum, and Solana. An investor and trader known as MacroCRG on X highlighted that yesterday, all three assets printed a bullish engulfing candle, a strong signal that buyers are stepping back in with intent.

Market Leaders Hint At A Shift Before Smaller Assets Follow

On the weekly chart, each asset is showing the early stages of an inside-week breakout paired with a false breakdown. MacroCRG pointed out that a similar structure on the ES (S&P 500 futures) chart from April, where the breakdown of inside-week structure led to a breakout that never looked back when the bull secured the weekly close.

Related Reading: Institutions Exit Bitcoin In Large Tranches, Ethereum, Solana And XRP See Massive Buy-Ins

For this setup to take hold, these prices need to close the week above the key highlighted highs on the chart. However, there’s still a long way to go before the weekly close will confirm the breakout, and the bulls need to follow through with conviction and remove any doubt.

The founder of the ProMintClub investment community, ProMint, has spotted a high-conviction whale trader aggressively building long positions across the crypto market. Currently, the trader is leading the Lighter leaderboard with over $64 million in profit and loss, while maintaining an 83% long bias. His Lighter account has the highest profit and loss with over $8 million. These are insane numbers compared to everyone else on the leaderboard.

Bitcoin

Data shows that the trader has made five deposits into his Lighter account, which total around $6 million in capital. His positions are spread across BTC, ETH, SOL, AAVE, along with smaller plays such as PAXG and PUMP, consistently entering at strong timing points and riding momentum higher.

Even though funding costs have flipped heavily negative, he is not backing down. Presently, this is the top-performing account on Lighter, and this is serious capital deployed with conviction.

How Increased Partners Drive Sustained Volume Demand

According to Chainflip Labs, November marked one of the strongest performance months in the protocol’s history, clearing over $583 million in swap volume, which is the second-best month ever for the network. 

Demand remained sustained across BTC, ETH, and SOL routes, and more partners are routing flow through the network than ever before. The trend clearly shows that Chainflip will continue to scale.

Bitcoin

Bitcoin Market Signals A Pivotal Turning Point – Here Are The Main Drivers Behind It

Several key Bitcoin metrics are beginning to exhibit bullish action once again alongside the renewed upward traction in the asset’s price. With this kind of trend that points to growing momentum, the crypto king appears to be gearing up for a pivotal shift driven by newfound appetite from investors.

A Key Market Shift Unfolding For Bitcoin

Bitcoin has experienced a rebound as the crypto landscape turns bullish again, sending its price back above the $90,000 mark. Following the bounce on Wednesday, the BTC market appears to have reached a critical junction as it hints at an impending shift in the current trend.

Delving into the market performance, Darkfost, an author at CryptoQuant and market expert, has outlined the key driver behind the unfolding shift. In the research shared on the X platform, the expert revealed that the market today is heavily driven by derivatives. In addition to the derivatives-driven market, 2025 has been the most speculative year Bitcoin has ever seen in its existence.

Bitcoin

Another key driver highlighted by the market expert is the actions of investors in the United States and the renewed demand at the institutional level. Darkfost’s research hinges on a critical Bitcoin metric, one that shows the average evolution of the Coinbase Premium Gap in the monthly timeframe and the Spot Bitcoin Exchange-Traded Funds (ETFs) netflows.

Specifically, this metric is the Bitcoin ETF – Netflow USD Vs. Coinbase Premium. It is worth noting that the Coinbase Premium Gap calculates the pricing difference between Coinbase Pro and Binance. This helps illustrate the behavior of different groups of investors. While Coinbase Pro is typically used by institutions and whales, Binance, which has the largest volume, is available to everyone.

The Coinbase Premium Gap decreased from +$109 to -$40 since October 16, when Bitcoin was valued at almost $113,000. Such a drop suggests that institutional investors sharply decreased their positions. 

BTC ETFs Netflows Impact On The Market

Interestingly, the trend was also observed in ETF netflows, which also flipped negative. During the period, BTC fell from $113,000 to $80,000, reflecting how much the US and institutional demand influence the market

As seen in the past, large negative swings have frequently indicated market bottoms, provided that the trend thereafter begins to turn. A trend of this kind is what is playing out in the market today.

However, current data reveals that the Coinbase Premium Gap has bounced back to -$13 while the average ETF netflow is valued at around -$100 million. This comeback in both sectors indicates that in the near term, the situation seems to be improving, and BTC’s price is reacting appropriately to the crucial shift. 

As a result, Darkfost predicts that a new all-time high for BTC may happen quickly if this pattern continues in the long run. The ongoing shift may be subtle, but it is noticeable as the market appears to be preparing for a phase that might largely change the course of Bitcoin.

Bitcoin

XRP Adopted As Treasury Asset by Listed Japanese Company – A First Of Its Kind

Even with its price facing volatility, XRP, one of the top 5 crypto assets by market cap, is still gaining recognition around the world. XRP is currently picking up pace at a significant rate in regions such as Asia, and large companies are starting to adopt the leading altcoin in order to create a treasury reserve backed by the token.

Japan-Listed Firm Goes Crypto With XRP Treasury

As a leading asset in the cryptocurrency and financial landscape, XRP is making notable inroads into the Asian region. A publicly traded corporation in Japan has chosen to include the token directly on its balance sheet, causing a new uproar in the country’s corporate sector.

Specifically, this move, which has sent ripples throughout the community, is being carried out by AltPlus, a company that focuses on the design, creation, and running of mobile and social games. The Japanese company has decided to engage with the altcoin by including it in its official treasury strategy, bolstering the XRP Treasury initiative.

In the report shared by BankXRP, a crypto and DeFi enthusiast, outlined that the token is now officially part of the corporate strategy of AltPlus, marking its shift into the ever-evolving cryptocurrency landscape. This move reflects an act of conviction among institutional investors in an environment where the majority of corporations still keep a wary eye on digital assets.

XRP

According to the pundit, the move was revealed in the company’s new shareholder filing. This new document confirms that the firm will purchase and hold XRP alongside Bitcoin, the flagship cryptocurrency, as a strategic asset. AltPlus aims at acquiring value in the long run, diversification, and staking-based income.

The filing details a complete transition of AltPlus into digital assets as the company expands into crypto operations. In this way, the firm is improving its balance sheet and navigating Web3 connections across its gaming and Internet Protocol (IP) ecosystem.

A Huge Wave Of Capital Flowing Into The Asset

While the crypto market is slowly recovering, several major assets witnessed a massive wave of capital, with XRP being among the leaders in inflows. A significant inflow into the altcoin reflects the growing conviction among retail and institutional investors.

Data from CoinShares disclosed by Coin Bureau on X shows that the altcoin pulled in capital worth $289 million in a week, which marks one of its biggest yet. The large inflow coincides with an improvement in investors’ sentiment toward the token, driven by strategic advancements in the larger ecosystem and expanding usefulness throughout international payment corridors.

Meanwhile, the total net inflows for digital asset Exchange-Traded Funds (ETFs) recorded in a week were more than $1 billion, signaling intensifying market interest. As more liquidity pours into digital assets, on-chain activity and market depth seem to be rising dramatically.

XRP

❌