Reading view

There are new articles available, click to refresh the page.

XRP Price Predictions: AI Forecasts $4.40 By March 2026, Analysts Target Up To $6

Recent bullish predictions for the XRP price have emerged, hinting at a potential for new all-time highs (ATHs) by March 2026 for one of the market’s leading altcoins.

XRP Price Projected To Reach New ATH By Q1 2026

According to projections from ChatGPT, XRP could reach approximately $4.40 by the first quarter of 2026, a notable increase of 120% from current levels around $2.

In contrast to the AI forecast, some analysts believe that the XRP price has the potential for a stronger rally. They suggest that structural changes could allow XRP to exceed $5 and potentially approach $6 by 2026. 

Several factors support their optimistic view. For instance, key aspects of the US Securities and Exchange Commission’s (SEC) case against Ripple were resolved earlier this year, which they believe could encourage banks and payment providers to adopt XRP for cross-border transactions, fostering greater confidence in its utility.

Additionally, Ripple’s ecosystem is expanding well beyond XRP. In December 2024, the company launched a dollar-pegged stablecoin known as RLUSD, which has already achieved a market cap exceeding $1 billion. 

While RLUSD itself may not directly boost XRP’s price, it has the potential to attract more participants to Ripple’s network, thereby creating secondary demand for XRP as a bridging asset. 

Analysts posit that a steady pipeline of RLUSD adoption could enhance Ripple’s revenue growth, consequently driving the XRP price higher.

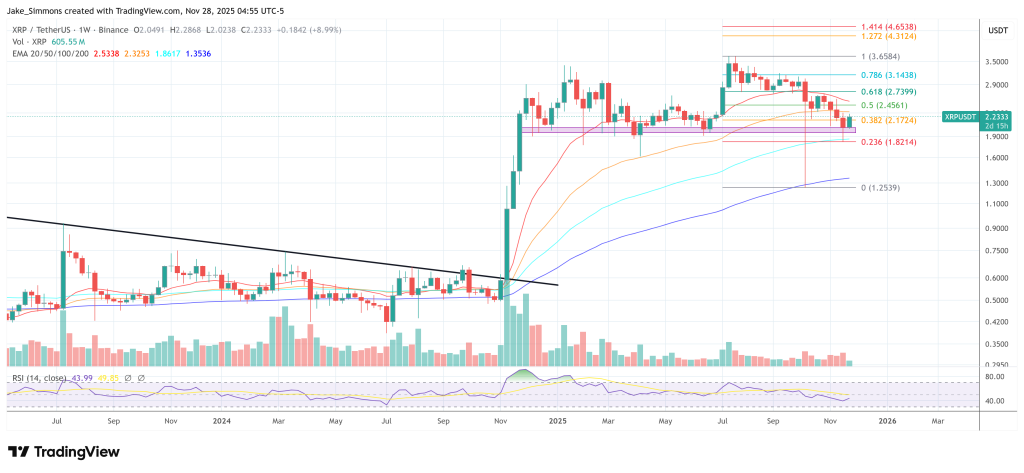
$2.60 Key For Momentum Shift

Moreover, analysts point to the upcoming Bitcoin (BTC) Halving, expected in 2028, as a potential catalyst for a broad crypto market rally. The analysts assert that the XRP price has historically benefited from such cycles.

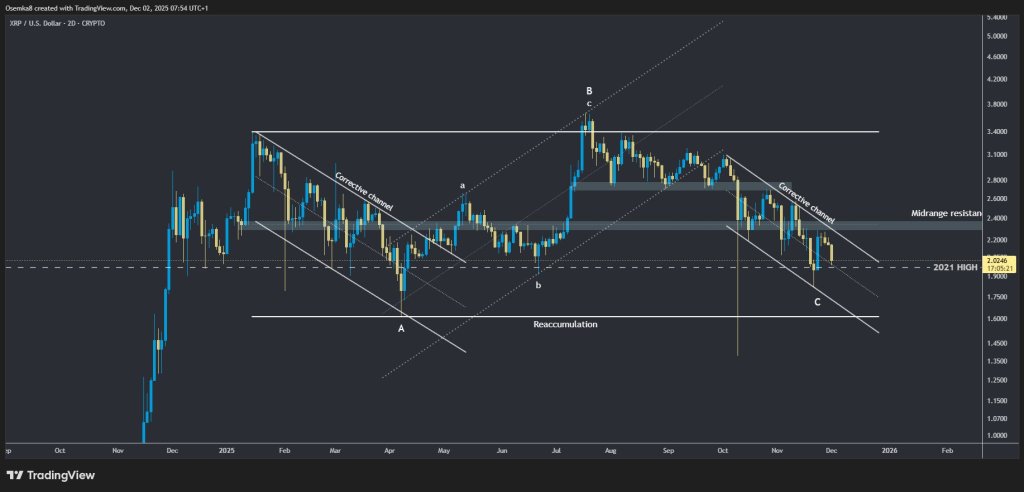
From a technical standpoint, chart analysts see XRP setting up for a potential breakout. Price action has formed a base around the low $2 range, which could lay the groundwork for further recovery. 

According to the analysts, if bullish momentum can push the token above significant resistance levels around $2.60, it could change momentum indicators to a positive stance. Moreover, a sustained rally into the mid-$3 territory might then pave the way for XRP to reach the $4 to $5 range.

XRP Price

When writing, the XRP price stands at $2.14, recording a 1.6% drop in the past 24 hours. 

Featured image from DALL-E, chart from TradingView.com 

XRP Flashes 3-Drive Reversal As Bulls Eye Explosive Break Above $2.50

XRP is testing a key inflection zone above $2.00 as two independent frameworks from crypto analysts Dom (@traderview2) and Osemka (@Osemka8) converge on a potential reversal – with clearly defined levels at roughly $2.00, $2.22 and $2.50 marking the battlefield.

XRP Price Consolidation Nears Its End

On the higher-timeframe 2-day chart, Osemka frames the structure as a classic flat correction built on top of the 2021 high. “Here’s the range and levels to help you navigate it. We’re basing on top of 2021 high,” he writes, adding that “we’ve also never broken down after going sideways for this long, so I remain with my view of this being an accumulation range and a flat correction.”

His chart shows XRP oscillating in a horizontal band whose floor aligns with the 2021 high, labeled as a “Reaccumulation” area. Price has repeatedly tagged this support and bounced, while midrange resistance in the low-to-mid $2 zone has capped multiple rallies. Above, a higher horizontal line marks the January spike, which Osemka treats as the cycle top.

XRP price analysis

Internally, he maps an A–B–C corrective sequence. The B leg forms a dotted ascending channel, labeled as a 3-legged “abc” wave. “That dotted ascending range in the middle (3 legged abc wave in B) has me optimistic as that is a corrective move that is synonymous for a flat correction,” he explains. “Meaning the top was in January and this indeed is only a sideways correction.” The current C leg is contained within a downward “Corrective channel” pointing back toward the lower band.

For Osemka, even a deeper test of support would not necessarily be bearish for the larger structure: “If we end up taking the lower end of the range with C leg it’ll remain to be seen. But if so, it’d be a great buying opportunity.” He also calls XRP “a perfect example on why I view BTC also as a flat correction with the top in January,” arguing that “while Bitcoin is messy, XRP is very clean.”

Why Its Now Or Never For XRP

Dom zooms in on the last six weeks of that broader range and focuses on the microstructure that could trigger a move back toward the upper band. “If you inverse the chart over the last 6 weeks, you’ll see a perfect 3 drive pattern, a very accurate reversal setup in crypto,” he writes. On the non-inverted chart, this corresponds to three downside pushes that fail to extend lower, followed by what he calls a higher low: “We can see a HL has finally formed which can hint at the first sign of a trend change developing.”

XRP price analysis

His 8-hour chart highlights the monthly rolling VWAP as the key pivot. “Bulls needs to regain the monthly rVWAP around $2.22 and that would be the shift for a rally back towards ~$2.50,” Dom says. That ~$2.50 area aligns with higher VWAP clusters and the upper portion of Osemka’s range.

Order-book and skew data back his view that conditions are ripe for a break if buyers step in. “Orderbooks are clear, if there was a time, it’s now for this trend to shift,” he notes, pointing to relatively clean liquidity overhead and a recovering skew after a washed-out short side.

XRP order books

The downside is equally explicit: “If this setup fails, acceptance under $2 is next and the end of year is ugly.” That would mean a decisive loss of the long-defended support band built on the 2021 high and a deeper completion of the C leg in Osemka’s flat-correction structure.

For now, XRP remains compressed between the $2.00 support, the $2.22 monthly rVWAP trigger and the ~$2.50 upside magnet, with the six-week 3-drive pattern and flat-correction range jointly defining one of the clearest technical inflection points on the XRP chart this year.

At press time, XRP traded at $2.1798.

XRP price

Analyst Teases $7.50 XRP Moonshot But Only After A Final Flush

Crypto analyst Charting Guy (@ChartingGuy) is mapping out a sharply asymmetric setup for XRP, arguing that the token is locked in a textbook Wyckoff reaccumulation and is “still NOT bearish in the slightest” despite a year of range-bound trading.

Why XRP Is Still Not Bearish

His work is based on XRP/USD Bitstamp charts posted on X on 27 November 2025. On the weekly view, XRP trades around $2.23 after an 8–9% gain on the week, consolidating below the 2025 peak at approximately $3.317, which he marks as the 1.0 Fibonacci level. The retracement is drawn from the cycle low near $0.11400 up to that high, producing a ladder of levels that structure the entire thesis.

XRP Fibonacci analysis

Key Fibonacci levels include 0.5 at about $0.61495, 0.618 at $0.91531, 0.702 just above $1.20 and, crucially, 0.786 at $1.61246. A broad highlighted band covers the prior 2021 high zone and this 0.786 cluster, roughly from the mid-$1s into the low-$2s. Charting Guy describes this as XRP “building support on prior cycle high as well as top of golden pocket,” referring to the 0.618–0.786 retracement area.

Above the 2025 high, he plots classic Fibonacci extensions: 1.272 at about $8.29661, 1.414 around $13.38940 and 1.618 near $26.63038. His immediate scenario, however, stops short of those levels, projecting a move toward roughly $7.50.

XRP Price Roadmap For 2026

The detailed roadmap appears on a two-day XRP/USD chart overlaid with a Wyckoff schematic. The structure begins with a Preliminarily Supply (PSY) phase and a Buying Climax (BC) into the low-$3 zone, followed by a Secondary Test (ST) and an Automatic Reaction (AR) that defines the lower boundary of the range. Horizontal lines mark that floor near $1.61184, an intermediate band around $1.95, resistance at approximately $2.90 and the upper ceiling just above $3.30.

XRP Wyckoff analysis

During mid-2025, XRP prints an “UT Phase B” upthrust into that $3+ resistance before rolling into a downward-sloping channel. The upper boundary of this channel, labeled “CREEK,” connects a series of lower highs, while the lower boundary guides price back toward the $1.61–1.70 support.

In the scenario path, XRP spikes down to test the blue horizontal at $1.61184. This move is annotated as the “SPRING” — Wyckoff’s final shakeout below range support. Price then rebounds to retake the $1.95 area, marked “TEST,” and establishes a higher low between roughly $2.00 and $2.20 as the first “LPS” (Last Point of Support).

From there, the schematic shows a decisive break of the descending “CREEK” trendline, the “JATC” or “Jump Across The Creek,” as XRP accelerates from around $2.20–2.30 through the $2.90 resistance. That breakout is followed by a “SOS” (Sign of Strength) above the former ceiling, with another LPS holding around the $2.90 region and confirming the flip of resistance into support.

The right edge of the 2D chart then projects a steep markup phase. XRP rallies from roughly $3.00 to just above $7.50 before stalling, even though it remains below the 1.272 weekly extension at $8.29661.

Alongside the charts, Charting Guy pushes back against bearish momentum narratives centered on the monthly RSI. He notes that the RSI peak occurred in January 2025 and “lost momentum ALL 2025 while XRP stayed sideways in a range and held its own,” calling this “a very textbook reaccumulation signal where indicators lose steam to reset and price stays stable.”

The technical message is unambiguous: as long as the $1.61–1.70 band holds, Charting Guy views XRP’s extended consolidation as preparation, not distribution—anticipating a final flush below $1.70, followed by a Wyckoff-style breakout sequence toward approximately $7.50.

At press time, XRP traded at $2.23.

XRP price

Challenges Loom For XRP: Expert Predicts Price Decline To $1 By 2026

XRP, the fourth-largest cryptocurrency in the market, experienced a notable flash crash on October 10th, plummeting toward $1.25, with a subsequent decline last week bringing it down to $1.82. 

Fast-forward to the end of the month: The digital currency has reclaimed some ground and surpassed the $2 mark in the past 24 hours. However, obstacles remain that could hinder XRP’s rally, as analyst Sean Williams of The Motley Fool has noted.

Major Catalysts Behind XRP’s Price Surge This Year

In a recent report, Williams pointed out that while XRP has rallied by 34% over the past year, compared to Bitcoin’s (BTC) 14% retracement, the path ahead is fraught with challenges. 

However, when examining the token’s price performance, which surpassed that of the other top 10 cryptocurrencies year-to-date, Williams identified one of the most significant catalysts for XRP’s rise as occurring last year when President Donald Trump was re-elected.

Additionally, the resolution of the litigation between Ripple— the company behind XRP— and the US government has played a crucial role in boosting the altcoin’s value. 

The approval of spot XRP exchange-traded funds (ETFs) in the US also contributed to its upward momentum, alongside the increasing utility of RippleNet, which is used by over 300 financial institutions globally, some relying on XRP as a bridge currency for cross-border transactions.

Looking ahead, Wall Street analysts, including Geoff Kendrick of Standard Chartered, have set an ambitious XRP price target of $12.50 by 2028, which would imply a major upside of over 500% for the altcoin in the next three years. 

However, Williams cautions that with a clearer understanding of the factors that have driven the cryptocurrency’s recent successes, several headwinds could derail its potential rally, possibly sending its price back to $1 by 2026.

Key Challenges Ahead For The Altcoin

A critical challenge for XRP in the coming year is the absence of new catalysts. Williams asserted that with significant cash flows into these ETFs now behind, the leading altcoin may find it difficult to maintain momentum in 2026.

Another hurdle is the reality of the altcoin’s adoption rates, which may not be as impressive as some proponents claim. While over 300 institutions are using RippleNet, it pales in comparison to the more than 11,000 institutions utilizing the SWIFT system for cross-border payments. 

Given this landscape, the token faces an uphill battle in trying to replace SWIFT, particularly as RippleNet does not necessitate the use of XRP for transactions. 

Additionally, while the altcoin boasts an average settlement time of three to five seconds—a significant improvement over traditional methods, which can take up to a week—alternative cryptocurrencies like Solana (SOL) and Stellar (XLM) also offer competitive transaction speeds. 

Lastly, the token’s price is also influenced by broader equity market trends. While cryptocurrencies and stocks are typically separate trading assets, they have recently moved in tandem with Wall Street. 

As illustrated by the S&P 500’s Shiller Price-to-Earnings Ratio peaking at 41.20 in late October, the stock market appears historically overpriced. Williams asserts that if the S&P 500 undergoes a correction or bear market, it is likely that cryptocurrencies, including XRP, will follow suit.

XRP

At the time of writing, XRP was trading at $2.19, recording a nearly 9% price recovery over the past week. 

Featured image from DALL-E, chart from TradingView.com 

❌