Reading view

There are new articles available, click to refresh the page.

Crypto Sell-Off: Binance, Coinbase, Dump Over $2 Billion In Bitcoin As Prices Dip Below $90,000

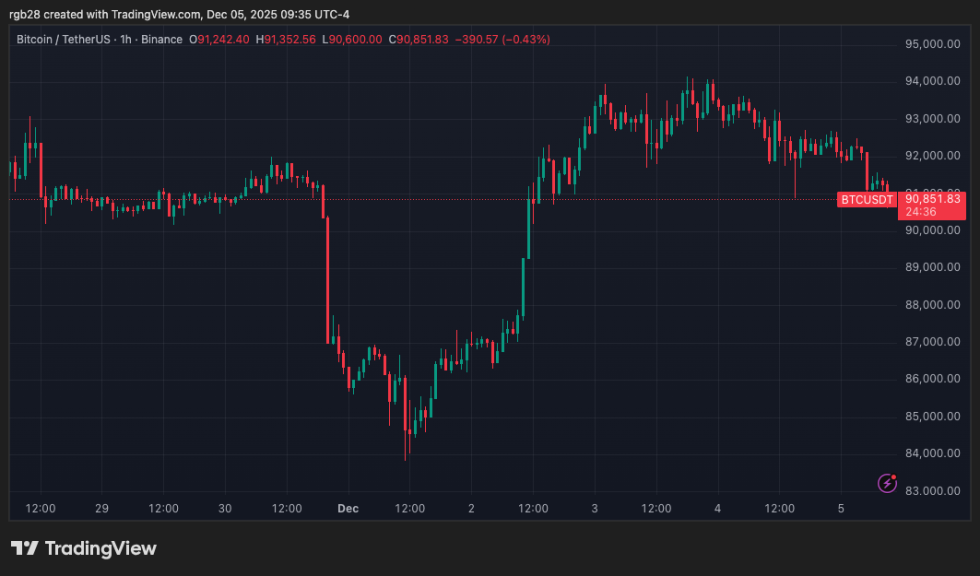
The cryptocurrency market experienced another wave of liquidations on Friday, with Bitcoin (BTC) prices dipping below the critical support level of $90,000. This decline followed a brief rally that had seen its price rise approximately $3,000 above this threshold earlier in the week.

Crypto Market Faces $430 Million In Liquidations 

Data from CoinGlass reveals that nearly $430 million in liquidations occurred across the crypto market over the past 24 hours, predominantly affecting leveraged long positions, which accounted for about $350 million. 

During this period, Bitcoin underwent a 3.5% retracement, with its price settling at just above $89,120—a stark 29% below its all-time high of over $126,000 reached in October.

Crypto

Market expert OxNobler recently highlighted the role of both retail and institutional investors in this downturn. In a post on social media platform X, OxNobler detailed the reason behind Bitcoin’s decline: significant sell-offs by major players. 

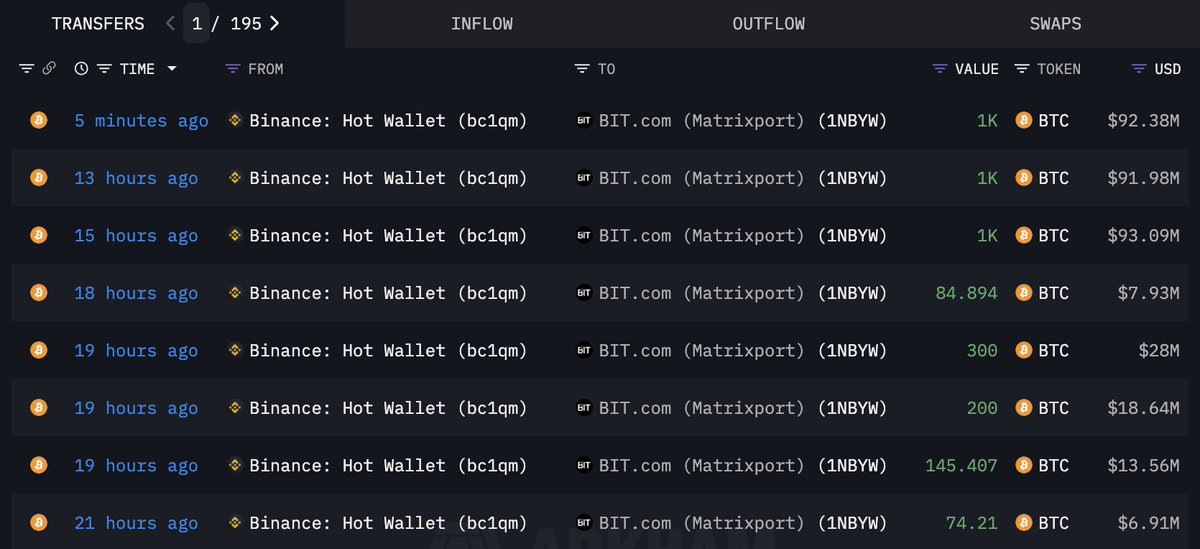
According to the analyst, the world’s largest cryptocurrency exchange, Binance, sold 4,000 BTC; U.S.-based Coinbase (COIN) liquidated 5,675 BTC; and traditional finance giant Fidelity sold 3,288 BTC. Additionally, market maker Wintermute offloaded 1,793 BTC. 

Notably, the analyst pointed out that Strategy, formerly MicroStrategy, which is the largest public company holder of Bitcoin with over 650,000 coins, has also sold over 3,820 coins in this same time frame.

The firm’s sell-off comes on the heels of speculation regarding Strategy’s potential to liquidate some of its holdings due to the substantial losses affecting its financial performance amid declining Bitcoin prices. 

When Strategy CEO Phong Le was questioned about the possibility of selling off Bitcoin, he acknowledged that while the firm’s former CEO, Michael Saylor, has consistently opposed selling, circumstances may change if the company’s stock trades below the net value of its Bitcoin holdings, which aligns with the recent actions taken by the firm.

Coinbase Analysts Predict December Recovery 

Interestingly, while these institutional sell-offs have contributed to the current market dip, Coinbase’s institutional division has projected a potential recovery for the crypto market in December, citing improving liquidity, a 92% probability of the Federal Reserve (Fed) cutting rates, and supportive macroeconomic conditions.

Analysts have pointed out several reasons for optimism, including the recovery of liquidity, the resilience of the “AI bubble,” and the attractiveness of short US dollar trades at current levels. 

However, OxNobler warned that the situation may not be so straightforward. Alongside the activities of major institutions, he noted that BlackRock, the world’s largest asset manager, had recently sold $130 million worth of Bitcoin and Ethereum (ETH).

Furthermore, Vitalik Buterin, one of Ethereum’s co-founders, seems to have resumed selling Ethereum, with millions of ETH being moved from the foundation’s wallet through Gnosis Safe.

Ultimately, OxNobler asserts that these institutional activities may have a hand in manipulating crypto prices and preventing them from climbing to higher levels and key resistance points. 

Crypto

Featured image from DALL-E, chart from TradingView.com 

‘Stablecoins Are Here To Stay’: IMF Calls For Global Cooperation To Prevent Financial Risks

As stablecoins continue to gain worldwide momentum, the International Monetary Fund (IMF) has called for global cooperation to avert potential macro financial stability risks related to the rapidly growing sector and to turn the industry “into a force for good.”

Stablecoins To Foster Innovation, Financial Inclusion

On Thursday, the IMF released a 56-page report discussing the growing influence of stablecoins, their potential use cases in mainstream financial markets, and the risks associated with the sector’s varying oversight.

Amid the sector’s rapid growth, the organization highlighted that the two largest stablecoins, USDT and USDC, have tripled their market capitalization since 2023, reaching a combined $260 billion. Meanwhile, their trading volume has increased by around 90% to $23 trillion in 2024, with Asia surpassing North America in stablecoin activity volume.

stablecoins

The IMF noted two major potential benefits from stablecoins. First, they could enable faster and cheaper cross-border payments, especially for remittances, which can cost 20% of the amount being sent and face some delays.

However, “being a single source of information, blockchains can greatly simplify the processes linked with cross-border payments and reduce costs,” the Fund’s economists explained in a blog post.

Second, stablecoins could expand financial access, driving innovation by increasing competition with established payment service providers, therefore, making retail digital payments more accessible to underserved customers.

They could facilitate digital payments in areas where it is costly or not profitable for banks to serve customers. Many developing countries are already leapfrogging traditional banking with the expansion of mobile phones and different forms of digital and tokenized money.

Notably, competition with already established providers could lower costs and lead to enhanced product diversity, “leveraging synergies between digital payments and other digital services.”

IMF Warns Of Fragmented Oversight

Despite their potential benefits, stablecoins also carry significant risks, the IMF explained, including de-pegging and collapsing if the underlying assets lose value or if users lose confidence in the ability to cash out. Per the report, this could also trigger fire sales of the reserve assets and disrupt financial markets.

Stablecoins could also accelerate a “currency substitution” dynamic, where individuals and companies abandon their national currency in favor of a foreign one, like US dollars or euros, due to instability or high inflation.

The organization noted that the dynamic decreases a country’s central bank’s ability to control its monetary policy and serve as the lender of last resort, damaging the financial sovereignty of affected nations.

In addition, the potential to reduce cross-border frictions and make faster and cheaper transactions could be undermined by a lack of interoperability if various networks are unable to connect or are restricted by different regulations and other hurdles.

“Stablecoin regulation is in its infancy, so the ability to mitigate these risks remains uneven across countries,” the organization affirmed, noting that “the IMF and the Financial Stability Board have issued recommendations to safeguard against currency substitution, maintain capital flow controls, address fiscal risks, ensure clear legal treatment and robust regulation, implement financial integrity standards, and strengthen global cooperation.”

As reported by Bitcoinist, the FSB vowed in October to address the evolving threats from private finance and the growing use of stablecoins, promising to increase the global watchdog’s policy response and overhaul its surveillance system to make it more flexible and quicker.

Nonetheless, major jurisdictions have taken different stances in key areas, as the IMF detailed, which could result in the exploitation of gaps between jurisdictions and issuers to locate where oversight is weaker.

All this underscores the need for strong international cooperation to mitigate macrofinancial and spillover risks (…). Tokenization and stablecoins are here to stay. But their future adoption and the outlook for this technology are still mostly unknown.

The organization concluded that “improving the existing global financial infrastructure might be easier than replacing it. Achieving the best possible balance will require close cooperation among policymakers, regulators, and the private sector.”

stablecoins, bitcoin, btc, btcusdt

From Top To Bottom: Bitcoin’s Largest & Smallest Hands Both Now Accumulating

Data shows distribution on the Bitcoin network has dropped off, with both the largest of whales and small retail hands taking to accumulation.

Bitcoin Accumulation Trend Score Shows Shift Toward Buying

As explained by Glassnode analyst Chris Beamish in an X post, Bitcoin investors have been showing a lot less distribution at the recent price levels. The on-chain indicator of relevance here is the “Accumulation Trend Score,” which tells us about whether BTC holders are buying or selling.

The metric tracks investor behavior using not just the changes happening in their wallet balance, but also accounting for the size of their wallets. This means that larger entities have a higher influence on the score.

When the value of the Accumulation Trend Score is greater than 0.5, it means the investors are displaying a net trend of accumulation. On the other hand, it being under the threshold suggests the dominance of distribution.

Now, here is the chart shared by Beamish that shows how the Accumulation Trend Score has changed for the different Bitcoin investor segments over the last few years:

Bitcoin Accumulation Trend Score

As displayed in the above graph, the Bitcoin Accumulation Trend Score has reflected a varied behavior for the different investor segments during the last couple of months, but very recently, a uniform picture has started to develop.

The smallest of investors in the market, those holding less than 1 BTC, started participating in aggressive accumulation around the time of BTC’s low in November and have since maintained the indicator nearly at a perfect value of 1. This suggests that retail investors have been buying the dip.

Meanwhile, the 100 to 1,000 BTC traders, popularly called the sharks, have been accumulating throughout the drawdown that has followed since the early October peak, indicating that these investors haven’t lost conviction despite the deep decline.

The story is a bit different for the whale cohorts, however. The 10,000+ BTC holders, corresponding to the largest of hands on the network, were in a phase of distribution between August and November, but they have finally started accumulating since the price low, although the Accumulation Trend Score isn’t as high as the retail investors in their case.

The 1,000 to 10,000 BTC whale group didn’t stop distributing even after the bottom, but very recently, their score has just breached the 0.5 mark. With this, a uniform behavior has begun to appear on the Bitcoin blockchain, with investors as a whole opting to expand their wallet balance.

It now remains to be seen how long this trend of accumulation will continue.

BTC Price

Bitcoin has faced a drop of more than 3% over the last 24 hours that has taken its price to $89,300.

Bitcoin Price Chart

Bitcoin Bull Run Set To Last Until 2027, Analysts Highlight Influential Factors

Many in the crypto space have echoed a familiar sentiment over recent months: “The four-year crypto market cycle is dead.” Experts from the Bull Theory assert that while the four-year cycle may have come to an end, the Bitcoin bull run itself is merely delayed and could stretch until 2027.

Why The Four-Year Cycle May Be Ending

In a recent post on social media platform X, formerly known as Twitter, the Bull Theory analysts noted that the concept of Bitcoin adhering to a neat four-year cycle is weakening. 

They highlighted that significant price movements over the last decade weren’t solely driven by Halving events; rather, they were influenced by shifts in global liquidity. 

The analysts pointed to the current landscape of stablecoin liquidity, which remains high despite recent downturns, indicating that larger investors are still engaged in the market, poised to invest when appropriate macroeconomic conditions arise.

In the US, Treasury policies are emerging as pivotal catalysts. The recent buybacks are notable, but the analysts emphasize that the larger narrative lies in the Treasury General Account (TGA) balance, which is currently around $940 billion—almost $90 billion above its normal range. 

This surplus cash is likely to flow back into the financial system, enhancing financing conditions and adding liquidity that typically gravitates toward risk assets.

Globally, the trends appear even more promising. China has been injecting liquidity for several months, while Japan recently announced a stimulus package worth approximately $135 billion, alongside efforts to simplify cryptocurrency regulations. 

Canada is also moving toward easing its monetary policy, and the US Federal Reserve (Fed) has officially halted its quantitative tightening (QT) measures—a historical precursor to some form of liquidity expansion.

Political And Monetary Factors Align To Create Bullish Condition

The analysts explained that when major economies adopt expansive monetary policies simultaneously, risk assets like Bitcoin tend to respond more rapidly than traditional stocks or broader markets. 

Additionally, potential policy tools, such as the Supplementary Leverage Ratio (SLR) exemption—implemented in 2020 to allow banks more flexibility in expanding their balance sheets—could return, resulting in increased credit creation and overall market liquidity.

There is also a political dimension to consider. President Trump has discussed potential tax reforms, including abolishing income tax and distributing $2,000 tariff dividends. 

Furthermore, the likelihood of a new Federal Reserve chair who supports liquidity assistance and is constructive toward cryptocurrency could bolster conditions for economic growth.

Extended Bitcoin Uptrend

Historically, whenever the Institute for Supply Management’s Purchasing Managers’ Index (ISM PMI) surpasses 55, it has been followed by periods of altcoin season. The probability of this occurring in 2026 appears high, according to the Bull Theory.

The convergence of rising stablecoin liquidity, the Treasury’s injection of cash back into markets, global quantitative easing, the cessation of QT in the US, potential bank-lending relief, pro-market policy shifts in 2026, and major players entering the crypto sector suggests a very different scenario than the old four-year halving model. 

The analysts concluded that if liquidity expands concurrently across the US, Japan, China, Canada, and other significant economies, Bitcoin is unlikely to move counter to that trend.

Therefore, rather than experiencing a sharp rally followed by a prolonged bear market, the current environment indicates a more extended and broader uptrend that could span through 2026 and into 2027.

Bitcoin

Featured image from DALL-E, chart from TradingView.com

Gold Buys Hit New Highs — Is Bitcoin About To Join The Party?

Reports have disclosed that central banks around the globe have stepped up purchases of gold this year, with one month standing out. In October 2025, officials bought 53 tons of gold, a level that analysts say is the highest monthly demand seen this year. These moves reflect growing concern about inflation, weaker currencies and rising geopolitical risk.

Central Bank Buying Surges

According to data cited by financial outlets, 2025 is on track to be the fourth-highest year this century for institutional gold accumulation when measured net year-to-date through October. Analysts at Deutsche Bank put gold’s share of central-bank reserves at about 24%, a level not seen since the 1990s. Those figures help explain why governments that once moved away from bullion are returning to it now.

Bitcoin Enters The Conversation

Some banks and market researchers are now asking whether Bitcoin could play a similar role for national treasuries. Based on reports from major financial firms, Deutsche Bank projects that Bitcoin could appear on central-bank balance sheets by 2030 as a complementary reserve asset.

Central banks are ramping up gold purchases:

Global central banks purchased +53 tonnes of gold in October, the most since November 2024.

This marks a +194% jump compared to July, and the 3rd-straight monthly acceleration.

In the first 10 months of the year, central banks have… pic.twitter.com/7pZWyEjjvf

— The Kobeissi Letter (@KobeissiLetter) December 4, 2025

Bitcoin’s market profile has changed: liquidity has risen, and price swings have been less extreme during recent months even though volatility remains higher than older reserve assets. Bitcoin also reached a record above $123,500 in recent trading, a price point that has captured wide attention.

A Few Banks Are Testing The Idea

A small number of central banks are now at least studying the idea more seriously. The Czech National Bank, for example, has discussed the possibility of a “test allocation” to learn how crypto might behave inside a reserve mix. Those conversations tend to focus on custody, accounting rules and how to report gains or losses, rather than immediate buying.

On Gold & Bitcoin: Why Officials Are Cautious

Risk is the main reason most central banks have not moved faster. Bitcoin still shows larger price swings than standard reserve assets, and global rules for how to hold and audit crypto are not uniform. Based on expert commentary, regulators and auditors would need clear guidance before many central banks felt comfortable adding crypto to official reserves.

What This Could Mean For Markets

If even a handful of national banks were to allocate a small share of reserves to Bitcoin, demand could rise sharply and change how markets view the asset. A modest sovereign allocation would not replace gold or the US dollar, but it could give Bitcoin a stronger role as a hedge for countries facing currency weakness or rising inflation. At the same time, such a move would push more work into custody and compliance services, which would have to scale up quickly.

Gold buying by central banks is already significant — 53 tons in one month and about 24% of reserves in gold for some — and that Bitcoin is being discussed as a possible next step for some policymakers. The path from discussion to adoption is uncertain, and many technical and legal questions remain. Still, the debate has moved from theory to test runs and official reports, making this one of the more closely watched trends in global finance this year.

Featured image from Unsplash, chart from TradingView

Bitcoin Price Slides Below $90,000 – Is A Retest Of The November Lows Near?

Bitcoin (BTC) is retesting a crucial support area after its price slid 5% from the recent highs and fell below the $90,000 barrier. Some analysts have suggested that the cryptocurrency’s structure remains intact, but warned that it must bounce quickly or risk retesting the November lows.

Bitcoin Retests $88,000 After Rejection

On Friday, Bitcoin lost the recently reclaimed $90,000 level, falling to a key support area before stabilizing. The flagship crypto has been attempting to recover from the November market correction, which sent its price to a seven-month low of $80,600.

Since reaching its local lows two weeks ago, the cryptocurrency has traded within a macro re-accumulation range, between $82,000 and $93,500, attempting to break out of this zone on Wednesday, when it reached a multi-week high of $94,150.

However, as the first week of December approaches its end, BTC has lost the upper area of its local range again, falling below its monthly open and tapping the $88,000 support.

Amid the drop, Analyst Ted Pillows noted that BTC has been struggling to reclaim the $94,000 resistance, adding that price “wants to go lower here before another breakout attempt.”  Therefore, he suggested that a bounce back from the $88,000-$89,000 support zone is likely.

Altcoin Sherpa affirmed that the ongoing retest would confirm whether the recent bounce was “just lower highs and price is going lower or if we actually have any juice to bounce to like 100k or something.”

The analyst outlined two potential outcomes. In the first scenario, the flagship crypto would retrace to the $87,000-$89,000 area and bounce above the $93,000-$94,000 resistance levels.

In the second scenario, Bitcoin would continue to move sideways below the local resistance before eventually sliding to the November lows and potentially lower levels. Per the analysis, the leading cryptocurrency must bottom quickly, or it will risk the second outcome.

BTC Shows Shallowing Pullback Tendency

Analyst Rekt Capital also pointed out that Bitcoin continues to face rejection from the range high resistance. However, he considers that investors should not worry as long as the pullback isn’t as big as the previous ones.

If “the rejection is shallower than the previous two, then this resistance will continue to weaken until eventually breached,” he explained, adding that “as long as this weakening continues, BTC should be able to finally breach this resistance over time & try to challenge the multi-week Downtrend above.”

Earlier this week, the analyst affirmed that BTC’s consolidation structure will remain intact as long as Bitcoin closes the week above the range lows. He also noted that its Macro Downtrend, which “has been dictating resistance throughout this phase of the cycle,” remains the dominant structural barrier and the level to break.

As the price stabilized between the $88,500-$89,350 area, the analyst added that today’s retracement “continues to be a shallower pullback than the previous two,” which keeps the range “‘retrace shallowing’ tendency” intact.

He noted that Bitcoin could technically drop into the ascending two-week support trendline, or tap the $86,000 level and still perform a shallower correction than the recent 10% drop.

As of this writing, Bitcoin is trading at $89,400, a 2.9% decline in the daily timeframe.

Bitcoin, btc, btcusdt

Bitcoin Price Faces Potential 60% Decline As Expert Warns Of ‘Major Bull Trap’

Despite the Bitcoin price recovery above the crucial $90,000 threshold—a level that has historically served as a supportive floor for the cryptocurrency—the market is exhibiting signs that a further correction may be imminent. 

Bitcoin Price Recovery At Risk?

Market expert Rekt Fencer recently shared insights on social media platform X, formerly known as Twitter, suggesting that the Bitcoin price might be forming what he calls a “massive bull trap.” 

This term refers to a deceptive bullish signal in which the price briefly surpasses a resistance level, in this case, the $90,000 mark, only to reverse into a decline. Such movements can entrap investors who bought in during the peak, leading to significant losses.

Fencer pointed out a troubling pattern reminiscent of early 2022 when Bitcoin reclaimed its 50-week moving average (MA)—currently positioned above $102,300—before experiencing a severe decline of roughly 60%, plummeting below $20,000 by June of that year. 

Bitcoin price

He indicated that the recent price recovery following major drops to $84,000 should not be interpreted as a signal of near-term success, especially since the Bitcoin price is currently trading under the 50-week MA.

If historical trends repeat, this could mean that Bitcoin might see a significant drop, potentially reaching around $36,200, which could potentially represent the low point of the bearish cycle for the cryptocurrency. On the other hand, there are analysts who retain a bullish outlook. 

BTC Bottom In Sight? 

Market researcher and analyst Miles Deutscher expressed a confident sentiment, stating he believes there is a 91.5% likelihood that the Bitcoin price has hit its bottom, based on his analysis of key developments. 

He noted that recent weeks have been dominated by negative news stories, including concerns surrounding Tether (USDT) and the implications of China’s actions on crypto, which he asserts often mark local price bottoms.

Moreover, Deutscher pointed out a shift in market flows from predominantly bearish to bullish. He explained that the trading environment has recently seen a resurgence in buying momentum, with large investors, or “OG whales,” ceasing their selling. This change has been reflected in the order books, indicating a possible stabilization in market sentiment.

Additionally, the liquidity landscape appears to be shifting, with market conditions tightening in recent months. The potential appointment of a new Federal Reserve chair known for dovish policies, coupled with the official end of quantitative tightening (QT), could further influence market dynamics in favor of buyers.

Deutscher concluded by emphasizing that given the extreme levels of fear, uncertainty, and doubt (FUD) in the market, combined with improvements in trading flows, he believes that the odds favor the notion that the Bitcoin price has indeed reached its bottom.

Featured image from DALL-E, chart from TradingView.com 

Bitcoin Adoption Is Just Getting Started — 200x Growth Possible, Tom Lee Says

Fundstrat’s Tom Lee told attendees at Binance Blockchain Week that he believes the worst leg of the recent crypto slump is likely over and that markets may be ready for a gradual recovery. He pointed to weakening selling pressure and growing underlying activity as reasons for cautious optimism.

Market Sentiment May Be Near A Turning Point

According to Lee, mood on the street turned darker after October, with many investors showing fatigue after steady losses. He said the current selling looks closer to exhaustion than to the start of another major decline. Trading desks have cut back. Volume has thinned. Sentiment is low. Lee argued that often, when pessimism peaks, conditions for a reversal begin to form.

Bitcoin Drawdowns Are Not Uncommon

Based on reports, Bitcoin has fallen about 36% from its all-time high in the recent retreat. That size of drop has happened in prior cycles, including 2017 and 2021, and has been followed by rallies that reached new records.

“Crypto prices likely bottomed. The best years of growth are still ahead: there is 200x adoption to come.” – Tom Lee, Chairman of Bitmine pic.twitter.com/fPWbWdaosO

— Binance (@binance) December 4, 2025

Lee pointed to long-term returns for bitcoin and ether compared with some traditional assets over the last decade, saying crypto’s gains were larger. He used that history to support the idea that patient holders have been rewarded after past stress.

Tokenization Could Be A Major Story In 2026

Lee also presented tokenization as a key theme for the future. He said large institutions are preparing to move more financial products on-chain and that, if real estate joins the shift, close to a quadrillion dollars in assets could eventually be tokenized.

Stablecoins were cited as an early example of why tokenized instruments can attract demand. He suggested that a broader institutional push could add steady interest to the market over time.

BlackRock’s Bitcoin ETF Was Highlighted As A Signal

Reports have disclosed that BlackRock’s bitcoin ETF has become one of the firm’s top fee-earning products, a fact Lee used to show growing involvement from legacy finance. That kind of institutional participation, he argued, points to deeper engagement from big players who were previously on the sidelines.

Adoption Gap Suggests Large Upside

According to Lee, only 4.4 million bitcoin wallets hold more than $10,000 in BTC, while nearly 900 million people globally have more than $10,000 in retirement savings.

He said that gap shows how early the market still is and argued that if just a fraction of those savers put money into bitcoin, adoption could expand by as much as 200 times. The figure is speculative, he acknowledged, but he used it to show the potential scale for future demand.

What This Means For Investors Now

Lee questioned whether the old four-year cycle should be used as a strict guide. He suggested recent moves were driven more by de-leveraging and structural shifts than by the halving rhythm that shaped earlier cycles.

Featured image from Unsplash, chart from TradingView

Bitcoin Treasury Company Is About To List on The New York Stock Exchange

On 3rd December, official filings and press releases announced Twenty One Capital’s upcoming debut on the New York Stock Exchange (NYSE), positioning the company as one of the largest Bitcoin treasury firms ever to enter public markets. The listing brings a dedicated Bitcoin balance sheet into Wall Street’s core ecosystem, signaling a structural shift in how institutional investors can gain long-term BTC exposure.

A Bitcoin Treasury Giant Steps Onto The NYSE Stage

Twenty One Capital’s NYSE entry is anchored by its business combination with Cantor Equity Partners (CEP), the SPAC serving as the public-market vehicle for the transaction. CEP shareholders have already approved the merger, and the deal is expected to close around December 8. Once completed, the combined entity will operate as Twenty One Capital, Inc. and begin trading on December 9 under the ticker XXI. 

The original announcement, released through official press channels and SEC-related filings, emphasized CEP’s central role in enabling the listing and establishing the company’s public-market structure. CEO Jack Mallers also highlighted the milestone on X, noting the company’s readiness for its debut.

According to this press announcement, Twenty One Capital will debut with an estimated 43,500 BTC, a reserve valued near $4 billion at recent market levels. This immediately places it among the top corporate Bitcoin treasuries globally. Unlike companies that hold Bitcoin as a secondary reserve, Twenty One is specifically engineered around a Bitcoin-native model. The firm intends to report “Bitcoin-per-share,” providing investors a transparent look at how much BTC each equity unit represents. It also pledges full, on-chain proof-of-reserves, positioning itself as a high-transparency asset custodian at launch.

This model effectively transforms Twenty One into a regulated balance-sheet wrapper for Bitcoin. It lowers operational friction for institutional allocators who want direct BTC exposure without the complexities of crypto custody, self-storage, or exchange-based acquisition. By listing on the NYSE rather than relying on ETFs or derivatives, Twenty One creates a regulated public equity vehicle that holds, safeguards, and transparently tracks Bitcoin for institutional and retail investors alike.

Wall Street’s New On-Ramp To Institutional BTC Exposure

The market impact of Twenty One’s listing reflects the accelerating integration of Bitcoin into mainstream financial architecture. The company’s backers—including Tether-linked entities, Bitfinex-aligned interests, SoftBank-connected capital, and Cantor’s public-markets network—provide a cross-sector foundation aimed at bridging crypto-native philosophies with institutional liquidity channels. 

Under this structure, Twenty One aims to become a long-term institutional treasury vessel—a regulated balance sheet that accumulates BTC and gives investors an equity-linked way to participate in Bitcoin’s upside without engaging directly with crypto custody or trading infrastructure.

As the NYSE debut approaches, Twenty One Capital embodies a pivot point where BTC’s role in capital markets shifts from speculative asset to institutional treasury instrument. If XXI attracts sustained flow, it could set a new blueprint for how corporate entities engage with Bitcoin—anchoring Wall Street’s next phase of digital-asset adoption.

Bitcoin price chart from Tradingview.com

Russia Steps Deeper Into Crypto As State Bank Prepares Direct Trading

VTB, Russia’s second-largest bank, has told clients it plans to let them buy and sell real cryptocurrencies through its brokerage service, with a target rollout in 2026 pending regulator approval.

According to the bank, the move would go beyond the derivative products that most Russian banks have offered so far. It is a clear shift toward opening traditional finance to digital assets, at least for now among wealthy clients.

Client Eligibility And Timetable

Reports have disclosed that VTB intends to begin with high-net-worth customers only. The bank set thresholds for its initial offering: clients with assets above $1.3 million or annual income over $649,000 would be eligible at first.

Andrey Yatskov, who heads VTB’s brokerage arm, said there is “sharp demand” from clients for access to actual crypto, not just paper products tied to token prices. The bank has picked 2026 as the planned start year, but it made that clear the launch depends on regulators signing off.

Real Crypto, Not Just Contracts

Based on reports, the service would allow ownership of the underlying coins — not merely derivative contracts or token-linked notes. That is a significant distinction in Russia, where until recently banks were limited to offering exposure through derivative instruments.

Allowing customers to hold coins directly would require legal and compliance work, from custody arrangements to anti-money-laundering controls. Those steps are on the critical path before any retail expansion can happen.

Potential Market Signals

VTB has also given investors a sense of how it views crypto as an asset class. The bank recommended a 7% allocation to crypto for some investor profiles, and its internal forecasts have mentioned medium-term Bitcoin price targets in the $200,000–$250,000 range under favorable conditions.

If VTB moves forward, it could be the first major Russian bank to operate in this way — a signal that some parts of the financial sector see token ownership as something to be offered through mainstream channels.

Regulatory Hurdles And Geopolitics

The plan is not risk free. Russian regulation of crypto is still evolving, and any permit to offer direct trading will require approval from the relevant authorities. Sanctions and other geopolitical pressures could alter timelines or force changes to how the service is structured. Compliance teams will need to reconcile domestic rules with international restrictions that affect many big banks operating in or dealing with Russia.

For now, the rollout remains conditional. VTB’s timeline, client criteria, and product design all hinge on legal clarifications and regulator consent. Market participants and clients will likely follow announcements from the Bank of Russia and other agencies to judge how soon broader access might come.

Featured image from Pexels, chart from TradingView

Binance Founder Crushes Bitcoin Critic In Game-Changing BTC Vs. Gold Debate

The Binance Blockchain Week event in Dubai became the center of a high-stakes showdown between traditional and digital innovation, with Bitcoin and gold going head-to-head. Investors, tech enthusiasts, and financial experts watched closely as Binance founder Changpeng Zhao expertly debated renowned Bitcoin critic Peter Schiff, making a compelling argument for why Bitcoin is better than gold. 

Binance Founder Dominates Bitcoin And Gold Debate

During the Binance Blockchain Week in Dubai, Schiff and CZ faced off in a high-profile debate over the value of Bitcoin versus Gold. Schiff defended gold as a safe, stable, and tangible asset while the Binance founder made a compelling case for Bitcoin’s adoption, utility, value, and global reach. 

Throughout the debate, which lasted over an hour, CZ consistently demonstrated the practical advantages of Bitcoin, leaving Schiff’s gold argument largely on the defensive. The Binance founder emphasized Bitcoin’s transparent and predictable supply and its role in the modern financial systems. He pointed to hundreds of millions of users who rely on Bitcoin for payments, savings, and transfers. 

Schiff argued that Bitcoin lacks inherent value and is mainly driven by hype and faith that its price will rise. He stated that gold remains tangible, centuries old, scarce, and valuable in industry, making it superior to BTC. He further asserted that “nobody needs” Bitcoin and that the cryptocurrency is “backed by nothing.”

Practical demonstrations played a key role in the debate between Schiff and CZ. The Binance founder explained how Bitcoin and crypto payments already improve financial efficiency, especially in emerging markets. Schiff questioned whether these transactions truly count as money, since merchants ultimately receive traditional currency. CZ’s response highlighted the importance of adoption and network effects, noting that people who use BTC directly for payments give it real-world significance.

The debate also considered the preferences of younger generations. CZ asked Schiff whether millennials and Gen Z favoured Bitcoin or gold. The Bitcoin critic responded sharply, suggesting that they would choose gold. He pointed out that, with many young investors losing money on BTC, gold offers a safer, more appealing alternative. The Binance founder countered that younger people understand digital value more intuitively and prefer mobile, borderless, and censorship-resistant assets. 

Digital Value And The Future Of Money

The debate between CZ and Schiff also highlighted the changing definition of money. Bitcoin functions as a decentralized network that enables instant settlement and transparent verification. Its adoption has also helped evolve the financial economy, facilitating faster and more seamless cross-border payments. Schiff argued that gold’s scarcity and industrial demand preserve its value and make it a reliable hedge against economic uncertainty. 

Tokenization also became a point of agreement during the discussion, with Schiff emphasizing that gold can be digitized and tokenized for easier ownership and distribution without moving the physical metal. CZ contended that Bitcoin offers similar advantages while also enabling global financial inclusion. They also discussed the supply of both assets, with the Binance founder noting that Bitcoin has a visible supply, while gold doesn’t. 

They also talked about the performance of both assets over the years. Schiff argued that gold had outperformed BTC over the past four years. CZ contended that Bitcoin has far outpaced gold over the last 8 years, and since its launch in 2009, it has skyrocketed from a few cents to an ATH above $126,000. He concluded his debate, predicting that Bitcoin’s growth will outpace gold over time.

Bitcoin

Is The Bitcoin Bottom In? Top Analyst Assigns 91.5% Probability

Crypto analyst Miles Deutscher has issued one of the most forceful bottom calls of this cycle, assigning a 91.5% probability that Bitcoin’s low is already in. In a X thread on December 4, he wrote: “F*ck it. I’m putting my neck on the line here. I’m 91.5% certain that the BTC bottom is in. And if it is, A LOT of people are about to be caught offside.”

Is The Bitcoin Bottom In?

Deutscher bases his conviction on four “pillars”: market reaction to news, the historical behaviour of FUD events, a shift in flows, and an improving global liquidity backdrop. Each pillar is scored in an internal model that culminates in a 91.5/100 bullish reading.

He starts with price behaviour versus headlines. Over recent days, he notes, the market has digested an “influx of bad news” – including renewed Tether FUD, another round of “China banning crypto,” MicroStrategy scrutiny and concerns around a Bank of Japan–driven yen carry trade unwind.

“Despite all this bad news, price rallied,” he writes, calling this “the first time since the major selloff began” that Bitcoin has responded positively to a destructive news cycle. He underscores an old trading adage: “The reaction to news is more important than the news itself. This tells you everything you need to know.”

The second pillar is a systematic look at whether such FUD clusters tend to coincide with local lows. Deutscher says he backtested “every single time Tether, China, BOJ, and Microstrategy FUD entered the market” in a similar way. His conclusion is stark: “Every single time, these FUD events marked a local bottom. Tether FUD = bottom.

China ‘banning’ crypto = bottom. Bank of Japan/carry trade concerns = bottom. Microstrategy FUD = bottom.” On this basis, his AI model assigns the maximum score of 28/28 to this pillar. He cautions that “in isolation, this factor doesn’t matter much,” but argues that, combined with the first pillar, it “starts to paint a convincing bull case.”

The third pillar is flows, which he calls “the most critical factor (net buy/sell pressure).” For the past weeks, flows were “aggressively negative” with OG whales selling and ETFs dumping. Recently, he argues, this picture has changed. ETF inflows are “starting to stabilise & uptick,” treasury-company holdings remain stable, and “OG whales have stopped relentlessly dumping (this is clear on the orderbooks).” This earns a 22.5/25 score in his model. He adds one key caveat: as long as DATs exist, “there are material risks.”

The fourth pillar is the liquidity and macro environment. Deutscher notes that market liquidity had been tightening for months, but now “things are shifting back toward increased market liquidity,” with global financial conditions “reloosened to near highs.” He highlights “macro tailwinds” and adds that a new, potentially more dovish Fed chair is coming and “QT has now officially ended.” This set of factors receives a 9/10 score in his framework.

Aggregating all four pillars leads to the headline figure: “With all four market pillars taken into account, we arrive at a final score of 91.5/100.”

Deutscher, however, explicitly lists caveats. He points out that US markets “have been on a massive run” and may need to cool off, that DATs “are still seeing some short-term pressure,” and that ETF flows “can flip negative at any time.” His conclusion is probabilistic rather than absolute: “Markets are a game of probabilities, and I think the odds are in favour of the bottom being in – given the extreme FUD we’ve had and the market’s reaction to it.”

At press time, Bitcoin traded at $91,035.

Bitcoin price

Here’s Why Bitcoin Volatility Sparks Fresh Attention On MicroStrategy

The Bitcoin price volatility is once again drawing attention to MicroStrategy, the company whose strategy has become a major market reference point, with billions in accumulated BTC and a track record of aggressive buying during downturns. As traders search for stability in a shaky market, Strategy’s stance is being watched closely for what it might signal about the next phase of BTC’s trend.

Why MicroStrategy’s Next Move Could Redirect Market Momentum

Bitcoin’s recent volatility has put MicroStrategy (MSTR), the largest corporate holder of BTC, in the limelight. Walter Bloomberg has revealed on X that analysts are watching closely to see if the company could influence the cryptocurrency’s price if it sells some of its holdings.

According to JPMorgan, Strategy can avoid forced sales as long as its enterprise value-to-BTC holdings ratio stays above 1.0, which currently stands at 1.13 BTC. However, analysts continue to debunk these claims, accusing JPMorgan of spreading misinformation about market manipulation and the company.

Walter stated that if the ratio remains above this level, BTC markets may stabilize and ease recent market pressure. Due to the market pressure, the firm has slowed its BTC purchases, adding 9,062 BTC last month compared to 134,480 BTC a year ago, reflecting a more cautious accumulation approach amid a broader crypto downturn. Its stock has dropped roughly 42% over the past three months.

Additionally, challenges include the potential exclusion from MSCI indices, which could trigger $8.8 billion in passive fund outflows if index funds are forced to divest. However, MicroStrategy holds a $1.4 billion reserve for dividends and interest, helping it avoid selling its BTC even if the price falls further. In the meantime, there is no proof that MicroStrategy is in danger of liquidation.

How Institutional Behavior Builds A Higher Floor For Bitcoin

In a market speculation, Bitcoin is currently experiencing one of the most significant capital migrations in its history, fueled by institutional adoption. Analyst Matthew noted that the current BTC market cycle from 2022 to 2025 has already absorbed an unprecedented amount of new capital, surpassing all previous BTC cycles. This growth is a reflection of the market’s maturity and the ecosystem’s innovative approach to liquidity through regulated instruments.

Bitcoin

Furthermore, the network has incorporated more than $732 billion in fresh capital in the current cycle, surpassing the $388 billion that was injected during the 2018 to 2022 cycle. At that time, the surge helped push BTC market capitalization to an all-time high record of $1.1 trillion, a metric that indicates a much higher aggregate cost base for new institutional investors.

Related Reading: Why Bitcoin Traders Fear A Repeat Of July 2024’s Crash Next Week

Meanwhile, the total settlement volume in the decentralized BTC protocol was approximately $6.9 trillion in just 90 days. Despite this, the number of active on-chain entities dropped from 240,000 to 170,000 per day, which is a reflection of liquidity migration of capital flows into spot ETFs.

Bitcoin

The $13.5 Billion Liquidity Injection That Could Send Bitcoin And Crypto Prices Flying

Bitcoin has been struggling to build momentum in recent weeks, and the return of cash into the system is raising questions about whether this could be the moment that changes the tone of the crypto market. That growing sense of anticipation has already started to show up in prices, with the total crypto market cap climbing more than $250 billion from its $3.016 trillion low on December 2.

What Happened: The Liquidity Injection And Why It Matters

After officially bringing its multi-year quantitative tightening (QT) program to an end, the central bank followed up with a $13.5 billion overnight repo operation, funneled through the New York Fed. Banks brought $13.5 billion in Treasuries to the Fed, the Fed accepted all of it, and instantly injected $13.5 billion of fresh reserves into the system.

The move, which is the second-largest liquidity injection since the COVID-19 crisis, effectively puts an end the steady shrinkage of bank reserves that has persisted for years, easing pressure on short-term funding markets and signaling a more accommodative liquidity environment.

The crypto market responded almost instantly. A handful of major assets began turning green within hours of the injection, with Bitcoin leading the charge with an instant break above $92,000.

The influx was visible at a macro level as well: the total crypto market cap climbed from a December 2 low of $3.016 trillion to $3.269 trillion by December 4. A gain of more than $250 billion in under 48 hours

What Investors Should Watch Next

Ending QT leads to better liquidity and often create a bullish environment for equities and other riskier investments like cryptocurrencies. However, although a single liquidity event does not guarantee a sustained multi-month rally, this injection stands out not just for its size but for what it represents. 

Related Reading: 4 Bitcoin Indicators That Led To Market Rallies In The Last 2 Years Have Returned

In a CNBC interview, Fundstrat’s Tom Lee stated that the Fed’s decision to stop QT will be a turning point for the cryptocurrency market. Lee pointed out that the last time the Fed ended QT, the market rose about 17% within three weeks.

The previous time the Fed brought quantitative tightening to a stop was in July 2019, roughly a year after it began reducing its balance sheet. In the three weeks that followed, the S&P 500 climbed about 5%. Bitcoin’s also initially rallied in the same period, but its strongest reaction came months after, towards late 2019 and early 2020.

Bitcoin

Large-Scale Bitcoin Outflow: Matrixport Removes $352.5M From Binance

Bitcoin is holding firmly above the $92,000 level after several days of relief and a stronger-than-expected rebound across the market. Yet despite the positive price action, analysts remain deeply divided. Some interpret this move as a classic relief rally within a broader downtrend, warning that the macro structure still favors a deeper correction.

Others see the recent recovery as the first sign that Bitcoin may be stabilizing and preparing for another bullish phase. The uncertainty reflects the conflicting signals coming from both derivatives and spot markets.

Adding fuel to the discussion, new on-chain data from Arkham shows that Matrixport withdrew 3,805 BTC—worth approximately $352.5 million—from Binance within the last 24 hours. This is a significant development, as Matrixport is one of Asia’s largest crypto financial service platforms, founded by Jihan Wu, the co-founder of Bitmain. The firm provides institutional-grade investment products, lending, trading, and asset management solutions to high-net-worth clients and funds across the region.

Maxiport Bitcoin Withdrawals | Source: Arkham

Large withdrawals from exchanges by institutions like Matrixport often signal accumulation, reduced selling pressure, or repositioning for custody and long-term holding. Combined with Bitcoin’s stabilization above $92K, this data adds an important layer of complexity to the current market outlook.

Institutional Positioning and a Changing Macro Landscape

Matrixport’s withdrawal of 3,805 BTC from Binance signals a potentially meaningful shift in institutional positioning. Large entities rarely move this size of capital without intention. Such withdrawals typically imply reduced selling pressure and a preference for custody over exchange liquidity, often interpreted as quiet accumulation.

For a firm managing billions in client assets, reallocating Bitcoin off exchanges suggests growing confidence in medium-term price stability or an expectation of improving market conditions.

This move arrives at a pivotal moment in the global macro environment. The Federal Reserve has ended Quantitative Tightening (QT), marking a major transition from liquidity withdrawal to a more accommodative stance. Historically, the end of QT has preceded periods of asset reflation, as systemic liquidity begins to stabilize.

At the same time, Japanese bond yields have surged, signaling stress in one of the world’s most influential funding markets. A spike in Japanese yields often triggers global liquidity adjustments, particularly through the carry trade, which can ultimately redirect capital toward risk assets—including Bitcoin.

Additionally, markets expect the Federal Reserve to cut interest rates soon, further easing financial conditions. Lower rates weaken the dollar, reduce funding costs, and typically stimulate inflows into alternative and high-beta assets.

In this environment of softening monetary policy and rising liquidity, Matrixport’s aggressive Bitcoin accumulation could reflect growing institutional conviction that the worst of the downturn is behind us—and that Bitcoin may be entering a more favorable macro phase.

BTC Price Analysis: Testing Recovery Momentum

Bitcoin’s daily chart shows the market attempting to stabilize after the sharp decline that pushed price toward the mid-$80,000s. The rebound into the $91K–$93K zone marks the first meaningful recovery attempt, but the structure still reflects caution.

BTC testing critical demand level | Source: BTCUSDT chart on TradingView

BTC remains below the 50-day and 100-day SMAs, which have both started to slope downward, signaling that the broader trend has not yet shifted back in favor of the bulls. Until Bitcoin reclaims these moving averages with strong volume, the market will likely see this move as a relief rally rather than a confirmed reversal.

Price is currently consolidating above the 200-day SMA, a level that often acts as a long-term trend gauge. Holding this region is essential; losing it would risk a deeper drop toward earlier support zones near $82K–$84K. Volume activity during the bounce shows some improvement, yet it remains far below the levels seen during the late-October peak, suggesting that buyers are cautious and large players are not fully engaged.

The chart also shows a clear lower-high structure forming since September, confirming the bearish pressure that has dominated the last several weeks. For sentiment to shift decisively, BTC must break above $95K and rebuild momentum toward the psychological $100K mark. Until then, volatility and hesitation remain the defining features of this recovery.

Featured image from ChatGPT, chart from TradingView.com

Bitcoin Must Break $97K To Restore Confidence Among Youngest Long-Term Holders – Details

Bitcoin is trading around $91,000 after a minor dip earlier today, and uncertainty continues to dominate sentiment. The market sits at a crossroads: a small but vocal group of analysts argues that the recent correction served as a healthy reset before a continuation of the broader uptrend, while the majority of traders believe the first leg of a new bear market is already underway. With price action still showing hesitation, the debate grows louder by the day.

According to top analyst Darkfost, a critical threshold will help determine Bitcoin’s next major direction. He highlights the importance of the Realized Price of the youngest Long-Term Holder (LTH) band, which currently sits at $96,956. This metric marks the transition point between short-term and long-term holders and is viewed as a psychological and structural barrier for market stability.

Reclaiming this level would push these young LTHs back into a comfortable profit zone, reducing their incentive to sell and helping to restore confidence across the market. Until Bitcoin closes decisively above $97K, Darkfost warns that caution is warranted, as volatility remains high and the risk of further downside persists.

Why the $97K Threshold Matters for Bitcoin’s Next Major Move

Darkfost emphasizes that the $96,956–$97,000 zone plays a crucial role in shaping Bitcoin’s next phase. This level represents the Realized Price of the youngest Long-Term Holder band, meaning it reflects the average cost basis of investors who recently transitioned from short-term to long-term holding behavior. When Bitcoin trades below this threshold, these holders sit at an unrealized loss, increasing the likelihood of panic selling and adding pressure to the market.

Bitcoin Realized Price UTXO Age Bands

Breaking above this zone would flip sentiment for this group almost immediately. Darkfost explains that reclaiming $97K would place these investors back into a comfortable profit position, restoring their confidence and expectations of potential gains. Once this psychological weight lifts, these holders typically choose to keep accumulating rather than selling, which naturally brings more stability to the market.

However, he cautions that Bitcoin’s failure to close above $97,000 keeps the risk tilted to the downside. As long as the price remains below this band, the market stays vulnerable, and volatility may continue.

Even if BTC successfully reclaims $97K, Darkfost reminds that this is only the first step. The market would still need stronger structural confirmation—such as reclaiming key moving averages and rebuilding demand—to validate a true bullish reversal that could eventually lead to a new all-time high.

BTC Weekly Structure Shows Early Signs of Stabilization

Bitcoin’s weekly chart reflects a market trying to stabilize after a sharp multi-week correction that dragged the price from above $115,000 down toward the mid-$80,000s. The latest weekly candle shows a firm rebound from the 100-week moving average (green line), now acting as dynamic support around the $84,000–$86,000 region. This level historically attracts long-term buyers, and the strong wick rejection confirms renewed demand.

BTC consolidates around key level | Source: BTCUSDT chart on TradingView

BTC is currently trading near $91,300, sitting just below the 50-week moving average (blue line), which now acts as resistance. A clean reclaim of this moving average—currently positioned around $95K–$97K—would significantly improve the technical outlook and align with on-chain signals calling for a recovery. Until then, the trend remains neutral-to-bearish on higher timeframes.

Volume during the recent bounce stands out, showing one of the strongest buying reactions since early 2025. This suggests that long-term holders and institutional buyers may be stepping in as the price approaches key value zones.

However, Bitcoin is not out of danger. Failures to break above $97K would leave the structure vulnerable to another leg down, potentially retesting $86K or even deeper liquidity pockets around $80K.

Featured image from ChatGPT, chart from TradingView.com

Bitcoin’s Latest Drop Isn’t Just Another Correction, But A Clear Capitulation Event – Here’s Why

After a brief moment of bullish performance in Bitcoin, the price experienced a sudden pullback due to a broader market shakedown, which caused BTC to revisit the $90,000 threshold. While this pullback has sparked a frenzy in the cryptocurrency community, on-chain data has revealed a shocking trend about the sudden pullback.

True Capitulation, Not A Routine Bitcoin Pullback

The market was rocked by a recent decline in the price of Bitcoin, but this pullback comes with an extra layer. Alphractal, an advanced investment and on-chain data analytics platform, has shed crucial insights about the decline using several key indicators to determine the unseen trend.

After carrying out its research, the on-chain platform revealed that the latest Bitcoin drop was not just another correction, but a clear instance of a capitulation event. This abrupt turnaround seems to have embodied all the characteristics of a full-scale capitulation event. These include an emotional flush-out when panic selling, forced liquidations, and intense dread came together in one dramatic moment.

Alphractal’s reading is backed by three major signals that rarely show up together, suggesting a pivotal moment for BTC. Such a trend may be the turning point that reshapes the short-term trajectory of the crypto king.

The first signal highlighted by the platform comes from the Bitcoin Hash Rate, which has witnessed a steady decline over the last 30 days. Presently, miners are turning off their machines, triggering heightened pressure on the ecosystem. When miners begin to lose money, it typically implies that the market might have reached its peak.

Another signal is coming from the BTC price drawdown. After a fast, violent drop, the metric is hitting extreme levels beyond the historical median. This is not just a technical drop, but it’s pain, triggered by forced selling and liquidation.

A Rare Trend And A Good Entry Opportunity

Finally, the last signal is the recent spike in active supply as those holding BTC for months or years have begun spending their coins. A behavior of this kind only unfolds when investors exhibit heightened caution, causing sentiment to drop. 

An interesting aspect about this trend is that when these 3 signals flash in unison, the Capitulation Oscillator tends to rise. This is a moment that nearly always denotes the conclusion of a downward trend or a leveling phase, as was the case in 2021.

Bitcoin

While it has played out in previous scenarios, it is not a guarantee of an immediate bottom. However, moments like these have historically been uncommon and frequently present opportunities that only occur once or twice every cycle, especially for those rooted in on-chain data.

Joao Wedson, the founder of Alphractal, also confirms these signals, which point to real capitulation. According to Wedson, the recent correction was the most severe capitulation event since 2022. 

Nonetheless, this has traditionally led to the formation of long accumulation regions before the price makes its next macro direction. In other words, Wedson noted that the highest probability scenario is that 2025 will end in a broad sideways range; a classic phase of accumulation or redistribution.

Bitcoin

Chainlink Bullish Path – This Zone Will Decide The Next Big Move

Crypto analyst CryptoWzrd, in a recent Chainlink daily technical outlook, noted that the candle closed slightly bearish, but the overall structure remains constructive and pushes toward the key $16.00 resistance, where momentum could shift quickly. According to the analyst, a retest of the $13.50 support or a break above the $15.20 resistance will be the critical trigger for the next major trade setup.

Indecisive Daily Close Sets the Stage For A Critical Trendline Test

CryptoWzrd noted that both LINK and LINKBTC closed the daily candle in an indecisive manner, reflecting uncertainty in the short-term market direction. Despite this hesitation, the broader structure remains intact, and price action is approaching a technically significant point that will play a crucial role in determining the next major move for Chainlink.

According to the analyst, LINKBTC is now testing its daily lower-high trendline. A series of bullish candles emerging from this zone would be a strong signal that buyers are re-entering the market. If this momentum builds, it is likely to spill over into Chainlink, potentially triggering an impulsive rally.

Chainlink

Should bullish confirmation appear, LINK could drive toward the $16 resistance level, a region that has been tested multiple times in the past. A clean breakout above $16 would open the door for a swift extension toward the next major hurdle for the bulls $20 resistance, marking a significant continuation of upward momentum.

On the downside, CryptoWzrd emphasized that the $12 level stands as the primary support. A daily close below this level would weaken the bullish structure and could signal a deeper correction. Until then, the trendline test remains a critical focal point where LINK’s uptrend will continue or reverse.

ChainLink Choppy Intraday Movement Signals Caution

Conclusively, the analyst highlighted that the intraday chart was characterized by being somewhat choppy and trading within a very tight, small range. This consolidation phase often precedes a significant directional move, but it has made short-term trading decisions challenging without a clear trigger.

The analyst defined a specific setup to watch for: a bearish pullback towards the $13.50 support level, followed by a decisive bullish reversal, would serve as the ideal trigger for a long position. Such a trade would initially target the $15.20 resistance and potentially move toward higher levels thereafter.

By confirming immediate strategic focus, the analyst stated that his attention “tomorrow will remain on the lower time frame chart development” to scout the next optimal scalp opportunity. This indicates a short-term, opportunistic trading mindset by waiting for the confined range to break or for the identified mean-reversion setup at $13.50 to play out.

Chainlink

Strategy’s Bitcoin Appetite Dries Up In 2025 — What Happened?

Strategy, the Michael Saylor-led corporate Bitcoin buyer long watched by investors, has sharply cut back purchases this year, according to CryptoQuant. Once a steady force of demand, its monthly buys have fallen dramatically, changing the way market watchers view institutional support for Bitcoin.

Sharp Drop In Monthly Purchases

Based on reports, Strategy’s monthly accumulation peaked around 134,000 BTC in late 2024. By November 2025 that figure had dropped to roughly 9,100 BTC. That move amounts to about a 93% decline from the high-water mark. Buying this month was almost nil, with only 135 BTC recorded early in December. Those numbers show how quickly a major buyer can thin out.

Strategy’s Bitcoin buying has collapsed through 2025.

Monthly purchases fell from 134K BTC at the 2024 peak to just 9.1K BTC in November 2025, only 135 BTC so far this month.

A 24-month buffer makes one thing clear: they’re bracing for the bear market. pic.twitter.com/qEwXR3JQ82

— CryptoQuant.com (@cryptoquant_com) December 3, 2025

A Big Buy Amid The Pullback

Reports have disclosed that on November 17, 2025, Strategy made a sizeable purchase of roughly 8,178 BTC, a buy worth near $835 million at the time. The purchase was the largest for the firm since July and pushed its total holdings to about 649,870 BTC. But while that single entry was large, it did not reverse the broader trend: overall monthly activity is far lower than it was a year earlier.

Big Holdings But More Cash On Hand?

According to CryptoQuant, Strategy has also piled up cash — about $1.4 billion has been set aside. That reserve is being held to cover dividend payments, debt servicing and other company needs. Observers say this signals a shift toward preserving liquidity rather than steady accumulation of Bitcoin. In other words, the company appears to be prioritizing cash stability over more buys for now.

What CryptoQuant And Others Are Watching

Market analysts are taking the slowdown as a warning sign that corporate appetite for Bitcoin treasuries may be cooling. If other big holders act the same, the structural demand that helped support prices could weaken.

Some traders will read the figures as a move to brace for a possible bear market. Others point out that Strategy’s enormous stash — nearly 650,000 BTC — still gives it room to ride out a downturn without having to sell immediately.

Key signals to monitor include the monthly purchase totals going forward and any change in Strategy’s cash holdings. Observers will be watching to see if the company returns to regular Bitcoin purchases or if the reduced buying becomes the standard.

It’s also important to monitor other corporate treasuries, because if several slowdowns occur together, the market for newly issued and available Bitcoin could tighten significantly.

Featured image from JRU, chart from TradingView

❌