❌

Reading view

There are new articles available, click to refresh the page.

XRP Ledger Explodes As Activity Experiences One of Its Strongest Growth Waves Yet

XRP may be holding above the $2 price mark for a brief period, but the leading altcoin is still facing heightened bearish pressures at that level due to a broader market pullback on Monday. Even with the ongoing downward trend in price, XRP is still experiencing robust engagement as evidenced by the massive surge in activity on the XRP Ledger.

An Explosive uptick In XRP Ledger’s Activity

Prices are constantly dwindling along with the entire crypto market, but the XRP Ledger is seeing sharp engagement within the bearish period. After months of quiet and reduced adoption, the Ledger has roared back to life, recording one of its strongest growth waves yet.

Arthur, a community member and official partner of the BingX cryptocurrency exchange, shared this surge in activity on the social media platform X. This isn’t a mild rise; it’s a growth wave with significant weight behind it, the kind that indicates an expanding utility rather than fleeting speculation.

Furthermore, the sharp growth in activity suggests that more investors are choosing to conduct their day-to-day XRP operations on the Ledger, reflecting a renewed conviction in the network. The Ledger’s current activity spike is centered around the rise in Account Set transactions to a point not seen in years.

XRP

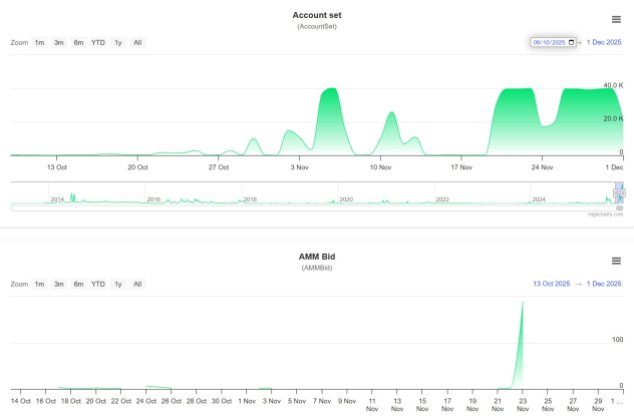
After navigating through XRPL metrics, the expert revealed that more than 40,000 Account Set transactions were carried out on the Ledger, marking its highest level in years. Such a massive wave of transactions to a new peak suggests that the Ledger may be speeding into its next phase in a market where many chains find it difficult to sustain momentum.

At the same time, there was also a surge in Automated Market Maker (AMM) bids just after November 23 concluded, indicating that preparations are taking place on the network. With Ripple’s stablecoin RLUSD approvals, AMM rollout, and the onboarding of institutional investors at an accelerated rate, it simply implies that the Ledger is picking up pace.Β 

Open Interest Suffers A Steep Decline

While the price of XRP has pulled back, the decline appears to be heavily impacting investors’ sentiment toward the altcoin. Its derivatives market has significantly lost its weight in a single and steep decline as Open Interest (OI) experiences a sharp drop.

In a report from Glassnode, a leading on-chain data analytics platform, the token’s futures open interest fell from 1.7 billion XRP in early October to 0.7 billion XRP by the end of November. This figure represents a more than 59% flush out from October to November alone.

The funding rates have also followed suit, recording a drop from 0.001% to 0.001% in the 7-day Simple Moving Average (SMA). A combination of the drop in open interest and funding rates marks a structural pause in the altcoin’s speculators’ appetite to bet heavily on an upward direction. At the time of writing, the altcoin was trading at $2.02 after falling by over 1% in the last 24 hours.

XRP

Bitcoin At A Thrilling Crossroads: Breakout Or Breakdown Ahead?

As the market matures and the broader economic landscape shifts, Bitcoin has once again found itself at a thrilling crossroads, with the entire crypto market watching closely as momentum builds on both sides of the chart. This moment of market volatility is a profound inflection point, where the interplay of rising institutional adoption and changing global macroeconomic conditions is converging.

Historical Breakout Zones Align With Price Structure

Bitcoin is currently sitting at a thrilling crossroads. In an X post, an analyst known as CryptoCrewU has stated that BTC is witnessing the strongest bearish divergence in years, paired with a rare 2-week close below the 21-period Simple Moving Average (SMA) of this bull run.

Furthermore, the Relative Strength Index (RSI) is currently dipping into levels reminiscent of past pivotal moments in 2015, 2018, the COVID-19 pandemic, and the 2022 bottoms. Meanwhile, the Stoch RSI has yet to cross upwards, hinting at the full extent of the potential move ahead.

While fear is at its peak in the market right now, history shows that buying during these market lows has consistently led to significant profits over the past 5 years. β€œLet data guide you, not emotions,” CryptoCrewU noted.

Trader_XO highlighted that since 2015, one pattern has remained remarkably consistent in Bitcoin’s cycle. Historically, whenever breaks below the 50-week Moving Average (MA), it has often signaled a deeper move toward the 200-week MA, or even the 300-week MA. Meanwhile, BTC tends to treat the 200-week MA as a major cycle support area.Β 

The price has only dipped below the 300-week MA once in history, and anything trading below the 200-week MA has been relatively short-lived, aligning with the best part of the cycle lows. According to Trader_XO, if the price were to revisit those lower moving average levels, and the broader market context aligns, that area would be viewed as a high-probability buying opportunity, unless this time the move is different.

Market Structure Shows Early Signs Of Strength Returning

Bitcoin is finally showing signs of strength again. A Full-time crypto teacher, Sykodelic, has pointed out that for the first time since the drop from $116,000, the price has broken above its previous low-time-frame (LTF) range, with a strong push above the 50 SMA.Β 

Since the $116,000 rejection, every time BTC attempts to move into an upper range, it gets rejected and makes new lows. This time, BTC has finally pushed higher. Currently, this is simply an LTF action, but these subtle shifts are exactly what to watch out for when it comes to understanding the nature of trend reversals.

A daily close above $87,000 will confirm the breakout of the trend. Sykodelic concluded that moving higher after a drop like that is intricate, and it can take time. Therefore, observe the signs and move accordingly to see how the daily close goes.

Bitcoin

❌