❌

Reading view

There are new articles available, click to refresh the page.

Heap_Detective - The Simple Way To Detect Heap Memory Pitfalls In C++ And C

By: Unknown


This tool uses the taint analysis technique for static analysis and aims to identify points of heap memory usage vulnerabilities in C and C++ languages. The tool uses a common approach in the first phase of static analysis, using tokenization to collect information.

The second phase has a different approach to common lessons of the legendary dragon book, yes the tool doesn't use AST or resources like LLVM following parsers' and standard tips. The approach present aims to study other ways to detect vulnerabilities, using custom vector structures and typical recursive traversal with ranking following taint point. So the result of the sum of these techniques is the Heap_detective.

The tool follows the KISS principle "Keep it simple, stupid!". There's more than one way to do a SAST tool, I know that. Yes, I thought to use graph database or AST, but this action cracked the KISS principle in the context of this project.

https://antonio-cooler.gitbook.io/coolervoid-tavern/detecting-heap-memory-pitfalls


Features

  • C and C++ tokenizer
  • List of heap static routes for each source with taint points for analysis
  • Analyser to detect double free vulnerability
  • Analyser to detect use after free vulnerability
  • Analyser to detect memory leak

To test, read the directory samplers to understand the context, so to run look that following:

$ git clone https://github.com/CoolerVoid/heap_detective

$ cd heap_detective

$ make
// to run
$ bin/heap_detective samplers/
note:
So don't try "$ cd bin; ./heap_detective"
first argv is a directory for recursive analysis

Note: tested in GCC 9 and 11

The first argument by command is a directory for recursive analysis. You can study bad practices in directory "samplers".

Future features

  • Analyser to detect off-by-one vulnerability
  • Analyser to detect wild pointer
  • Analyser to detect heap overflow vulnerability

Overview

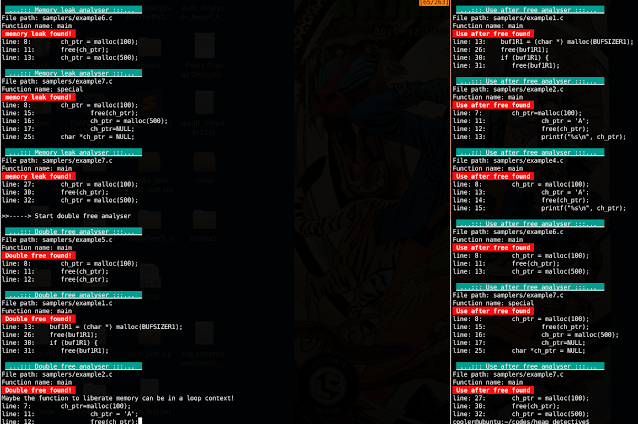
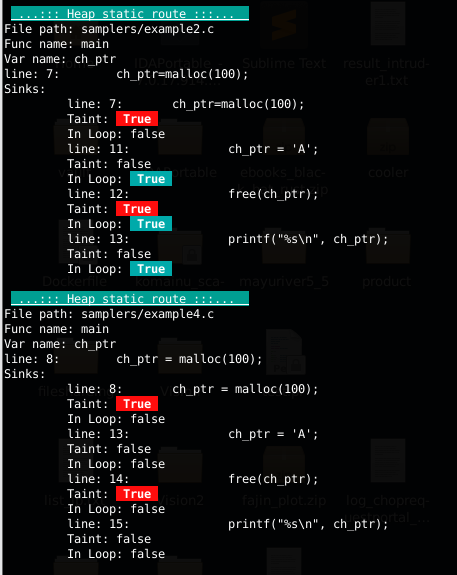
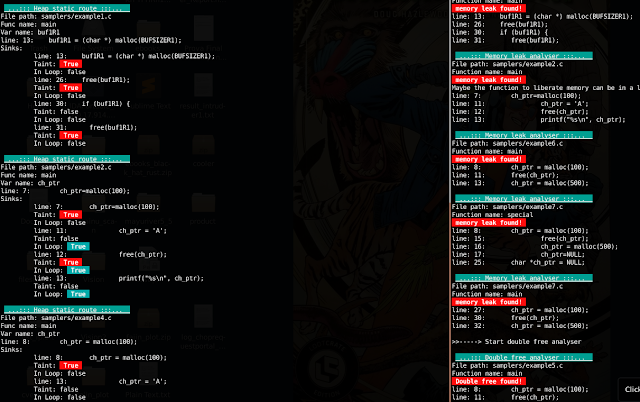
Output example:


Collect action done

...::: Heap static route :::...
File path: samplers/example3.c
Func name: main
Var name: new
line: 10: array = new obj[100];
Sinks:
line: 10: array = new obj[100];
Taint: True
In Loop: false

...::: Heap static route :::...
File path: samplers/example3.c
Func name: while
Var name: array
line: 27: array = malloc(1);
Sinks:
line: 27: array = malloc(1);
Taint: True
In Loop: false
line: 28: array=2;
Taint: false
In Loop: false
line: 30: array = malloc(3);
Taint: True
In Loop: false

...::: Heap static route :::...
File path: samplers/example5.c
Func name: main
Var name: ch_ptr
line: 8: ch_ptr = malloc(100);
Sinks:
line: 8: ch_ptr = malloc(100);
Taint: True
In Loop: false
line: 11: free(ch_ptr);
Taint: True
In Loop: false< br/> line: 12: free(ch_ptr);
Taint: True
In Loop: false

...::: Heap static route :::...
File path: samplers/example1.c
Func name: main
Var name: buf1R1
line: 13: buf1R1 = (char *) malloc(BUFSIZER1);
Sinks:
line: 13: buf1R1 = (char *) malloc(BUFSIZER1);
Taint: True
In Loop: false
line: 26: free(buf1R1);
Taint: True
In Loop: false
line: 30: if (buf1R1) {
Taint: false
In Loop: false
line: 31: free(buf1R1);
Taint: True
In Loop: false

...::: Heap static route :::...
File path: samplers/example2.c
Func name: main
Var name: ch_ptr
line: 7: ch_ptr=malloc(100);
Sinks:
line: 7: ch_ptr=malloc(100);
Taint: True
In Loop: false
line: 11: ch_ptr = 'A';
Taint: false
In Loop: True
line: 12: free(ch_ptr);
Taint: True
In Loop: True
line: 13: printf("%s\n", ch_pt r);
Taint: false
In Loop: True

...::: Heap static route :::...
File path: samplers/example4.c
Func name: main
Var name: ch_ptr
line: 8: ch_ptr = malloc(100);
Sinks:
line: 8: ch_ptr = malloc(100);
Taint: True
In Loop: false
line: 13: ch_ptr = 'A';
Taint: false
In Loop: false
line: 14: free(ch_ptr);
Taint: True
In Loop: false
line: 15: printf("%s\n", ch_ptr);
Taint: false
In Loop: false

...::: Heap static route :::...
File path: samplers/example6.c
Func name: main
Var name: ch_ptr
line: 8: ch_ptr = malloc(100);
Sinks:
line: 8: ch_ptr = malloc(100);
Taint: True
In Loop: false
line: 11: free(ch_ptr);
Taint: True
In Loop: false
line: 13: ch_ptr = malloc(500);
Taint: True
In Loop: false

...::: Heap static route :::...
File path: samplers/example7.c
Fu nc name: special
Var name: ch_ptr
line: 8: ch_ptr = malloc(100);
Sinks:
line: 8: ch_ptr = malloc(100);
Taint: True
In Loop: false
line: 15: free(ch_ptr);
Taint: True
In Loop: false
line: 16: ch_ptr = malloc(500);
Taint: True
In Loop: false
line: 17: ch_ptr=NULL;
Taint: false
In Loop: false
line: 25: char *ch_ptr = NULL;
Taint: false
In Loop: false

...::: Heap static route :::...
File path: samplers/example7.c
Func name: main
Var name: ch_ptr
line: 27: ch_ptr = malloc(100);
Sinks:
line: 27: ch_ptr = malloc(100);
Taint: True
In Loop: false
line: 30: free(ch_ptr);
Taint: True
In Loop: false
line: 32: ch_ptr = malloc(500);
Taint: True
In Loop: false

>>-----> Memory leak analyser

...::: Memory leak analyser :::...
File path: samplers/example3.c
F unction name: main
memory leak found!
line: 10: array = new obj[100];

...::: Memory leak analyser :::...
File path: samplers/example3.c
Function name: while
memory leak found!
line: 27: array = malloc(1);
line: 28: array=2;
line: 30: array = malloc(3);

...::: Memory leak analyser :::...
File path: samplers/example5.c
Function name: main
memory leak found!
line: 8: ch_ptr = malloc(100);
line: 11: free(ch_ptr);
line: 12: free(ch_ptr);

...::: Memory leak analyser :::...
File path: samplers/example1.c
Function name: main
memory leak found!
line: 13: buf1R1 = (char *) malloc(BUFSIZER1);
line: 26: free(buf1R1);
line: 30: if (buf1R1) {
line: 31: free(buf1R1);

...::: Memory leak analyser :::...
File path: samplers/example2.c
Function name: main
memory leak found!
Maybe the function to liberate memory can be in a loo p context!
line: 7: ch_ptr=malloc(100);
line: 11: ch_ptr = 'A';
line: 12: free(ch_ptr);
line: 13: printf("%s\n", ch_ptr);

...::: Memory leak analyser :::...
File path: samplers/example6.c
Function name: main
memory leak found!
line: 8: ch_ptr = malloc(100);
line: 11: free(ch_ptr);
line: 13: ch_ptr = malloc(500);

...::: Memory leak analyser :::...
File path: samplers/example7.c
Function name: special
memory leak found!
line: 8: ch_ptr = malloc(100);
line: 15: free(ch_ptr);
line: 16: ch_ptr = malloc(500);
line: 17: ch_ptr=NULL;
line: 25: char *ch_ptr = NULL;

...::: Memory leak analyser :::...
File path: samplers/example7.c
Function name: main
memory leak found!
line: 27: ch_ptr = malloc(100);
line: 30: free(ch_ptr);
line: 32: ch_ptr = malloc(500);

>>-----> Start double free analyser

...::: Double free analys er :::...
File path: samplers/example5.c
Function name: main
Double free found!
line: 8: ch_ptr = malloc(100);
line: 11: free(ch_ptr);
line: 12: free(ch_ptr);

...::: Double free analyser :::...
File path: samplers/example1.c
Function name: main
Double free found!
line: 13: buf1R1 = (char *) malloc(BUFSIZER1);
line: 26: free(buf1R1);
line: 30: if (buf1R1) {
line: 31: free(buf1R1);

...::: Double free analyser :::...
File path: samplers/example2.c
Function name: main
Double free found!
Maybe the function to liberate memory can be in a loop context!
line: 7: ch_ptr=malloc(100);
line: 11: ch_ptr = 'A';
line: 12: free(ch_ptr);
line: 13: printf("%s\n", ch_ptr);

>>-----> Start use after free analyser

...::: Use after free analyser :::...
File path: samplers/example5.c
Function name: main
Use after free found
l ine: 8: ch_ptr = malloc(100);
line: 11: free(ch_ptr);
line: 12: free(ch_ptr);

...::: Use after free analyser :::...
File path: samplers/example1.c
Function name: main
Use after free found
line: 13: buf1R1 = (char *) malloc(BUFSIZER1);
line: 26: free(buf1R1);
line: 30: if (buf1R1) {
line: 31: free(buf1R1);

...::: Use after free analyser :::...
File path: samplers/example2.c
Function name: main
Use after free found
line: 7: ch_ptr=malloc(100);
line: 11: ch_ptr = 'A';
line: 12: free(ch_ptr);
line: 13: printf("%s\n", ch_ptr);

...::: Use after free analyser :::...
File path: samplers/example4.c
Function name: main
Use after free found
line: 8: ch_ptr = malloc(100);
line: 13: ch_ptr = 'A';
line: 14: free(ch_ptr);
line: 15: printf("%s\n", ch_ptr);

...::: Use after free analyser :::...
File path: samplers/example6.c
Function name: main
Use after free found
line: 8: ch_ptr = malloc(100);
line: 11: free(ch_ptr);
line: 13: ch_ptr = malloc(500);

...::: Use after free analyser :::...
File path: samplers/example7.c
Function name: special
Use after free found
line: 8: ch_ptr = malloc(100);
line: 15: free(ch_ptr);
line: 16: ch_ptr = malloc(500);
line: 17: ch_ptr=NULL;
line: 25: char *ch_ptr = NULL;

...::: Use after free analyser :::...
File path: samplers/example7.c
Function name: main
Use after free found
line: 27: ch_ptr = malloc(100);
line: 30: free(ch_ptr);
line: 32: ch_ptr = malloc(500);


How we tracked down (what seemed like) a memory leak in one of our Go microservices

By: detectify

At Detectify, the backend team is using Go to power microservices. We noticed one of our microservices had a behavior very similar to that of a memory leak.

In this post we will go step-by-step through our investigation of this problem, the thought process behind our decisions and the details needed to understand and fix the problem.

The post How we tracked down (what seemed like) a memory leak in one of our Go microservices appeared first on Detectify Blog.

Five Big Takeaways from Verizon’s 2022 Data Breach Investigations Report

By: Synack

By Kim Crawley

The annual Verizon Data Breach Investigations Report is a wealth of valuable information about the state of cybersecurity today.

Of course, data breaches remain one of the biggest problems in cybersecurity. Many of the worst breaches expose financial data, authentication credentials, and sensitive legal and medical information. In the wrong hands, this data can help cybercriminals access organizations’ and individuals’ most sensitive data and valuable networks.

Ransomware that targets enterprises is also growing. In fact, ransomware incidents are up 13 percent from the previous year, a larger increase than the previous five years combined. Another data breach vulnerability trend is an increase in human exploitation, whether by phishing, stolen credentials or user errors.

The DBIR is a massive report that resulted from Verizon analyzing a large number of data breaches, which they’ve also verified directly for authenticity. Here’s how Verizon determines which breaches to include:

β€œThe incident must have at least seven enumerations (e.g., threat actor variety, threat action category, variety of integrity loss, et al.) across 34 fields or be a DDoS attack. Exceptions are given to confirmed data breaches with less than seven enumerations. The incident must have at least one known VERIS threat action category (hacking, malware, etc.).”

Verizon acknowledges that many data breaches still go undetected. Nonetheless, as organizations improve their systems for detecting indications of compromise (IOCs), there’s a lot of useful data to be analyzed.

Here are five key findings:

  1. Web application β€œhacking” and denial of service attacks are the most common actions that threat actors perform in order to unlawfully access sensitive data in networks. For the sake of the report, hacking is defined as β€œattempts to intentionally access or harm information assets without (or exceeding) authorization by circumventing or thwarting logical security mechanisms.”
  2. Seventy percent of breaches involve web application hacking, 45 percent involve denial of service, 15 percent involve backdoor malware, 15 percent involve ransomware and 10 percent involve email.
  3. Malicious access to credentials led to just under 50 percent of breaches, phishing in a bit under 20 percent and vulnerability exploits about 10 percent.
  4. Data breaches are mainly caused by external threat actors, but internal threat actors are still a significant risk, too. About 80 percent of threat actors are external to the targeted organization, and 20 percent are internalβ€”an organization’s own employees, contractors and other insiders.
  5. Even though internal threat actors conduct fewer attacks, internal attacks expose the most records and therefore lead to more destructive data breaches. External threat actor breaches expose a median of 30,000 records, internal threat actor breaches expose a median of 375,000 records, and threat actors with a partnership relationship (often in the supply chain) expose a median of 187,500 records.

Whenever organizations are testing to see how vulnerable they are to a data breach, it’s important to simulate internal, external and supply chain attacks. Web application pentesting is also more important than ever. As DBIR makes clear, it’s critical that every organization test for unauthorized credential exploitation and phishing attacks, too.

Thank you Verizon for helping our industry better understand data breach threats! For more information about how Synack can help organizations prevent data breaches, get in touch here.

The post Five Big Takeaways from Verizon’s 2022 Data Breach Investigations Report appeared first on Synack.

❌