Reading view

There are new articles available, click to refresh the page.

Network Security: Get Started with QUIC and HTTP/3

Welcome back, aspiring cyberwarriors!

For decades, traditional HTTP traffic over TCP, also known as HTTP/1 and HTTP/2, has been the backbone of the web, and we have tools to analyze, intercept, and exploit it. But nowadays, we have HTTP/3, which is steadily increasing adoption across the web. In 2022, around 22% of all websites used HTTP/3; in 2025, this number increased to ~40%. And as cyberwarriors, we need to stay ahead of these changes.

In the article, we briefly explore what’s under the hood of HTTP/3 and how we can get in touch with it. Let’s get rolling!

What is HTTP/3?

HTTP/3 is the newest evolution of the Hypertext Transfer Protocol—the system that lets browsers, applications, and APIs move data across the Internet. What sets it apart is its break from TCP, the long-standing transport protocol that has powered the web since its earliest days.

TCP (Transmission Control Protocol) is reliable but inflexible. It was built for accuracy, not speed, ensuring that all data arrives in perfect order, even if that slows the entire connection. Each session requires a multi-step handshake, and if one packet gets delayed, everything behind it must wait. That might have been acceptable for email, but it’s a poor fit for modern, high-speed web traffic.

To overcome these limitations, HTTP/3 uses QUIC (Quick UDP Internet Connections), a transport protocol built on UDP and engineered for a fast, mobile, and latency-sensitive Internet. QUIC minimizes handshake overhead, avoids head-of-line blocking, and encrypts nearly the entire connection by default—right from the start.

After years of development, the IETF officially standardized HTTP/3 in 2022. Today, it’s widely implemented across major browsers, cloud platforms, and an ever-growing number of web servers.

What Is QUIC?

Traditional web traffic follows a predictable pattern. A client initiates a TCP three-way handshake, then performs a TLS handshake on top of that connection, and finally begins sending HTTP requests. QUIC collapses this entire process into a single handshake that combines transport and cryptographic negotiation. The first time a client connects to a server, it can establish a secure connection in just one round trip. On subsequent connections, QUIC can achieve zero round-trip time resumption, meaning the client can send encrypted application data in the very first packet.

The protocol encrypts almost everything except a minimal connection identifier. Unlike TLS over TCP, where we can see TCP headers, sequence numbers, and acknowledgments in plaintext, QUIC encrypts packet numbers, acknowledgments, and even connection close frames. This encryption-by-default approach significantly reduces the metadata available for traffic analysis.

QUIC also implements connection migration, which allows a connection to survive network changes. If a user switches from WiFi to cellular, or their IP address changes due to DHCP renewal, the QUIC connection persists using connection IDs rather than the traditional four-tuple of source IP, source port, destination IP, and destination port.

QUIC Handshake

The process begins when the client sends its Initial packet. This first message contains the client’s supported QUIC versions, the available cipher suites, a freshly generated random number, and a Connection ID — a randomly chosen identifier that remains stable even if the client’s IP address changes. Inside this Initial packet, the client embeds the TLS 1.3 ClientHello message along with QUIC transport parameters and the initial cryptographic material required to start key negotiation. If the client has connected to the server before, it may even include early application data, such as an HTTP request, to save an extra round trip.

The server then responds with its own set of information. It chooses one of the client’s QUIC versions and cipher suites, provides its own random number, and supplies a server-side Connection ID along with its QUIC transport parameters. Embedded inside this response is the TLS 1.3 ServerHello, which contains the cryptographic material needed to derive shared keys. The server also sends its full certificate chain — the server certificate as well as the intermediate certificate authorities (CAs) that signed it — and may optionally include early HTTP response data.

Once the client receives the server’s response, it begins the certificate verification process. It extracts the certificate data and the accompanying signature, identifies the issuing CA, and uses the appropriate root certificate from its trust store to verify the intermediate certificates and, ultimately, the server’s certificate. To do this, it hashes the received certificate data using the algorithm specified in the certificate, then checks whether this computed hash matches the one that can be verified using the CA’s public key. If the values match and the certificate is valid for the current time period and the domain name in use, the client can trust that the server is genuine. At this point, using the TLS key schedule, the client derives the QUIC connection keys and sends its TLS Finished message inside another QUIC packet. With this exchange completed, the connection is fully ready for encrypted application data.

From this moment onward, all traffic between the client and server is encrypted using the established session keys. Unlike traditional TCP combined with TLS, QUIC doesn’t require a separate TLS handshake phase. Instead, TLS is tightly integrated into QUIC’s own handshake, allowing the protocol to eliminate extra round-trips. One of the major advantages of this design is that both the server and client can include actual application data — such as HTTP requests and responses — within the handshake itself. As a result, certificate validation and connection establishment occur in parallel with the initial exchange of real data, making QUIC both faster and more efficient than the older TCP+TLS model.

How Does QUIC Network Work?

The image below shows the basic structure of a QUIC-based network. As illustrated, HTTP/3 requests, responses, and other application data all travel through QUIC streams. These streams are encapsulated in several logical layers before being transmitted over the network.

Anatomy of a QUIC stream:

A UDP datagram serves as the outer transport container. It contains a header with the source and destination ports, along with length and checksum information, and carries one or more QUIC packets. This is the fundamental unit transmitted between the client and server across the network.

A QUIC packet is the unit contained within a UDP datagram, and each datagram may carry one or more of them. Every QUIC packet consists of a QUIC header along with one or more QUIC frames.

The QUIC header contains metadata about the packet and comes in two formats. The long header is used during connection setup, while the short header is used once the connection is established. The short header includes the connection ID, packet number, and key phase, which indicates the encryption keys in use and supports key rotation. Packet numbers increase continuously for each connection and key phase.

A frame is the smallest structured unit inside a QUIC packet. It contains the frame type, stream ID, offset, and a segment of the stream’s data. Although the data for a stream is spread across multiple frames, it can be reassembled in the correct order using the connection ID, stream ID, and offset.

A stream is a unidirectional or bidirectional channel of data within a QUIC connection. Each QUIC connection can support multiple independent streams, each identified by its own ID. If a QUIC packet is lost, only the streams carried in that packet are affected, while all other streams continue uninterrupted. This independence is what eliminates the head-of-line blocking seen in HTTP/2. Streams can be created by either endpoint and can operate in both directions.

HTTP/3 vs. HTTP/2 vs. HTTP/1: What Actually Changed?

To understand the significance of HTTP/3, it helps to first consider the limitations of its predecessors.

HTTP/1.1, the original protocol still used by millions of websites, handles only one request per TCP connection. This forces browsers to open and close multiple connections just to load a single page, resulting in inefficiency, slower performance, and high sensitivity to network issues.

HTTP/2 introduced major improvements, including multiplexing, which allows multiple requests to share a single TCP connection, as well as header compression and server push. These changes provided significant gains, but the protocol still relies on TCP, which has a fundamental limitation: if one packet is delayed, the entire connection pipeline stalls. This phenomenon, known as head-of-line blocking, cannot be avoided in HTTP/2.

HTTP/3 addresses this limitation by replacing TCP with a more advanced transport layer. Built on QUIC, HTTP/3 establishes encrypted sessions faster, typically requiring only one round-trip instead of three or more. It eliminates head-of-line blocking by giving each stream independent flow control, allowing other streams to continue even if one packet is lost. It can maintain sessions through IP or network changes, recover more gracefully from packet loss, and even support custom congestion control tailored to different workloads.

In short, HTTP/3 is not merely a refined version of HTTP/2. It is a fundamentally redesigned protocol, created to overcome the limitations of previous generations, particularly for mobile users, latency-sensitive applications, and globally distributed traffic.

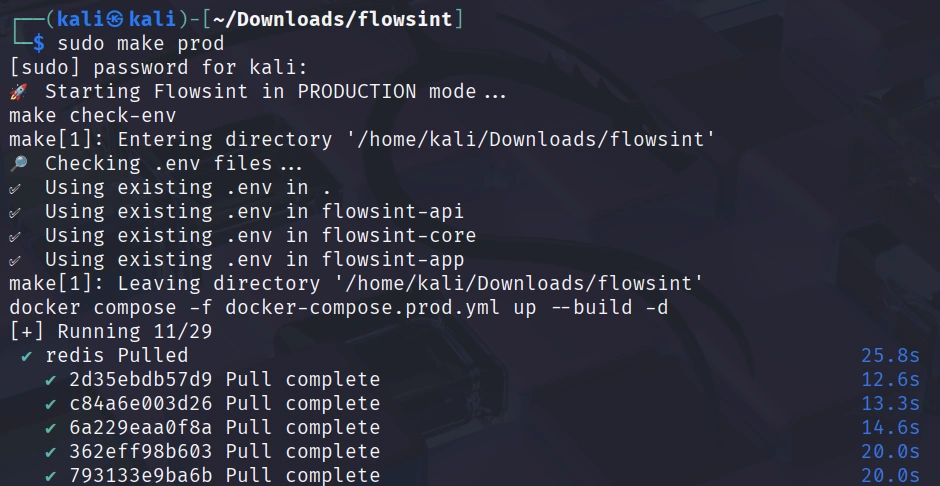
Get Started with HTTP/3

Modern versions of curl (7.66.0 and later with HTTP/3 support compiled in) can test whether a target supports QUIC and HTTP/3. Here’s how to probe a server:

kali> curl –http3 -I https://www.example.com

This command attempts to connect using HTTP/3 over QUIC, but will fall back to HTTP/2 or HTTP/1.1 if QUIC isn’t supported.

Besides that, it’s also useful to see how QUIC traffic looks “in the wild.” One of the easiest ways to do this is by using Wireshark, a popular tool for analyzing network packets. Even though QUIC encrypts most of its payload, Wireshark can still identify QUIC packet types, versions, and some metadata, which helps us understand how a QUIC connection is established.

To start, open Wireshark and visit a website that supports QUIC. Cloudflare is a good example because it widely deploys HTTP/3 and the QUIC protocol. QUIC typically runs over UDP port 443, so the simplest filter to confirm that you are seeing QUIC traffic is:

udp.port == 443

This filter shows all UDP traffic on port 443, which almost always corresponds to QUIC when dealing with modern websites.

QUIC uses different packet types during different stages of the connection. Even though the content is encrypted, Wireshark can still distinguish these packet types.

To show only Initial packets, which are the very first packets exchanged when a client starts a QUIC connection, use:

quic.long.packet_type == 0

Initial packets are part of QUIC’s handshake phase. They are somewhat similar to the “ClientHello” and “ServerHello” messages in TLS, except QUIC embeds the handshake inside the protocol itself.

If you want to view Handshake packets, which continue the cryptographic handshake after the Initial packets, use:

quic.long.packet_type == 2

These packets help complete the secure connection setup before QUIC switches to encrypted “short header” packets for normal data (like HTTP/3 requests and responses).
Also, QUIC has multiple versions, and servers often support more than one. To see packets that use a specific version, try:

quic.version == 0x00000001

This corresponds to QUIC version 1, which is standardized in RFC 9000. By checking which QUIC version appears in the traffic, you can understand what the server supports and whether it is using the standardized version or an older draft version.

Summary

QUIC isn’t just an incremental upgrade — it’s a complete reimagining of how modern internet communication should work. While the traditional stack of TCP + TLS + HTTP/2 served us well for many years, it was never designed for the realities of today’s internet: global-scale latency, constantly changing mobile connections, and the growing demand for both high performance and strong security. QUIC was built from the ground up to address these challenges, making it faster, more resilient, and more secure for the modern web.

Keep coming back, aspiring cyberwarriors, as we continue to explore how fundamental protocols of the internet are being rewritten.

Bug Bounty: Get Started with httpx

Welcome back, aspiring cyberwarriors!

Before we can exploit a target, we need to understand its attack surface completely. This means identifying web servers, discovering hidden endpoints, analyzing response headers, and mapping out the entire web infrastructure. Traditional tools like curl and wget are useful, but they’re slow and cumbersome when you’re dealing with hundreds or thousands of targets. You need something faster and more flexible.

Httpx is a fast and multi-purpose HTTP toolkit developed by ProjectDiscovery that allows running multiple probes using a simple command-line interface. It supports HTTP/1.1, HTTP/2, and can probe for various web technologies, response codes, title extraction, and much more.

In this article, we will explore how to install httpx, how to use it, and how to extract detailed information about a target. We will also cover advanced filtering techniques and discuss how to use this tool effectively. Let’s get rolling!

Step #1 Install Go Programming Language

Httpx is written in Go, so we need to have the Go programming language installed on our system.

To install Go on Kali Linux, use the following command:

kali > sudo apt install golang-go

Once the installation completes, verify it worked by checking the version:

kali > go version

Step #2 Install httpx Using Go

To install httpx, enter the following command:

kali > go install -v github.com/projectdiscovery/httpx/cmd/httpx@latest

The “-v” flag enables verbose output so you can see what’s happening during the installation. The “@latest” tag ensures you’re getting the most recent stable version of httpx. This command will download the source code, compile it, and install the binary in your Go bin directory.

To make sure httpx is accessible from anywhere in your terminal, you need to add the Go bin directory to your PATH if it’s not already there. Check if it’s in your PATH by typing:

kali > echo $PATH

If you don’t see something like “/home/kali/go/bin” in the output, you’ll need to add it. Open your .bashrc or .zshrc file (depending on which shell you use) and add this line:

export PATH=$PATH:~/go/bin

Then reload your shell configuration:

kali > source ~/.bashrc

Now verify that httpx is installed correctly by checking its version:

kali > httpx -version

Step #3 Basic httpx Usage and Probing

Let’s start with some basic httpx usage to understand how the tool works. Httpx is designed to take a list of hosts and probe them to determine if they’re running web servers and extract information about them.

The simplest way to use httpx is to provide a single target directly on the command line. Let’s probe a single domain:

kali> httpx -u “example.com” -probe

This command initiates an HTTP probe on the website. This is useful for quickly checking the availability of the web page.

Now let’s try probing multiple targets at once. Create a file with several domains you want to probe.

Now run httpx against this file:

kali > httpx -l hosts.txt -probe

Step #4 Extracting Detailed Information

One of httpx’s most powerful features is its ability to extract detailed information about web servers in a single pass.

Let’s quickly identify what web server is hosting each target:

kali > httpx -l hosts.txt -server

Now let’s extract even more information using multiple flags:

kali> httpx -l hosts.txt -title -tech-detect -status-code -content-length -response-time

This command will extract the page title, detect web technologies, show the HTTP status code, display the content length, and measure the response time.

The “-tech-detect” flag is particularly valuable because it uses Wappalyzer fingerprints to identify the technologies running on each web server. This can reveal content management systems, web frameworks, and other technologies that might have known vulnerabilities.

Step #5 Advanced Filtering and Matchers

Filters in httpx allow you to exclude unwanted responses based on specific criteria, such as HTTP status codes or text content.

Let’s say you don’t want to see targets that return a 301 status code. For this purpose, the -filter-code or -fc flag exists. To see the results clearly, I’ve added the -status-code or -sc flag as well:

kali > httpx -l hosts.txt -sc -fc 301

Httpx outputs filtered results without status code 301. Besides that, you can filter “dead” or default/error responses with -filter-error-page or -fep flag.

kali> httpx -l hosts.txt -sc -fep

This flag enables “filter response with ML-based error page detection”. In other words, when you use -fep, httpx tries to detect and filter out responses that look like generic or error pages.

In addition to filters, httpx has matchers. While filters exclude unwanted responses, matchers include only the responses that meet specific criteria. Think of filters as removing noise, and matchers as focusing on exactly what you’re looking for.

For example, let’s output only responses with 200 status code using the -match-code or -mc flag:

kali> httpx -l hosts.txt -status-code -match-code 200

For more advanced filtering, you can use regex patterns to match specific content in the response (-match-regex or -mr flag):

kali> httpx -l hosts.txt -match-regex “admin|login|dashboard”

This will only show targets whose response body contains the words “admin,” “login,” or “dashboard,” helping you quickly identify administrative interfaces or login pages.

Step #6 Probing for Specific Vulnerabilities and Misconfigurations

Httpx can be used to quickly identify common vulnerabilities and misconfigurations across large numbers of targets. While it’s not a full vulnerability scanner, it can detect certain issues that indicate potential security problems.

For example, let’s probe for specific paths that might indicate vulnerabilities or interesting endpoints:

kali > httpx -l targets.txt -path “/admin,/login,/.git,/backup,/.env”

The -path flag, as the name suggests, tells httpx to probe specific paths on each target.

Another useful technique is probing for different HTTP methods:

kali > httpx -l targets.txt -sc -method -x all

In the command above, the -method flag is used to display HTTP request method, and -x all to probe all of these methods.

Summary

Traditional HTTP probing tools are too slow and limited for the kind of large-scale reconnaissance that modern bug bounty and pentesting demands. Httpx provides a fast, flexible, and powerful solution that’s specifically designed for security researchers who need to quickly analyze hundreds or thousands of web targets while extracting comprehensive information about each one.

In this article, we covered how to install httpx, basic and advanced usage examples as well as shared ideas on how httpx might be used for vulnerability detections. This tool really fast and can significantly boost your productivity whether you’re conducting bug bounty hunting or web app security testing. Check this out, maybe it will find a place in your cyberwarriors toolbox.

Using Artificial Intelligence (AI) in Cybersecurity: Automate Threat Modeling with STRIDE GPT

Welcome back, aspiring cyberwarriors!

The STRIDE methodology has been the gold standard for systematic threat identification, categorizing threats into Spoofing, Tampering, Repudiation, Information Disclosure, Denial of Service, and Elevation of Privilege. However, applying STRIDE effectively requires not just understanding these categories but also having the experience to identify how they manifest in specific application architectures.

To solve this problem, we have STRIDE GPT. By combining the analytical power of AI with the proven STRIDE methodology, this tool can generate comprehensive threat models, attack trees, and mitigation strategies in minutes rather than hours or days.

In this article, we’ll walk you through how to install STRIDE GPT, check out its features, and get you started using them. Let’s get rolling!

Step #1: Install STRIDE GPT

First, make certain you have Python 3.8 or later installed on your system.

pi> python3 –version

Now, clone the STRIDE GPT repository from GitHub.

pi > git clone https://github.com/mrwadams/stride-gpt.git

pi> cd stride-gpt

Next, install the required Python dependencies.

pi > pip3 install -r requirements.txt –break-system-packages

This installation process may take a few minutes.

Step #2: Configure Your Groq API Key

STRIDE GPT supports multiple AI providers including OpenAI, Anthropic, Google AI, Mistral, and Groq, as well as local hosting options through Ollama and LM Studio Server. In this example, I’ll be using Groq. Groq provides access to models like Llama 3.3 70B, DeepSeek R1, and Qwen3 32B through their Lightning Processing Units, which deliver inference speeds significantly faster than traditional GPU-based solutions. Besides that, Groq’s API is cost-effective compared to proprietary models.

To use STRIDE GPT with Groq, you need to obtain an API key from Groq. The tool supports loading API keys through environment variables, which is the most secure method for managing credentials. In the stride-gpt directory, you’ll find a file named .env.example. Copy this file to create your own .env file:

pi > cp .env.example .env

Now, open the .env file in your preferred text editor and add the API key.

Step #3: Launch STRIDE GPT

Start the application by running:

pi> python3 -m streamlit run main.py

Streamlit will start a local web server.

Once you copy the URL into your browser, you will see a dashboard similar to the one shown below.

In the STRIDE GPT sidebar, you’ll see a dropdown menu labeled “Select Model Provider”. Click on this dropdown and you’ll see options for OpenAI, Azure OpenAI, Google AI, Mistral AI, Anthropic, Groq, Ollama, and LM Studio Server.

Select “Groq” from this list. The interface will update to show Groq-specific configuration options. You’ll see a field for entering your API key. If you configured the .env file correctly in Step 2, this field should already be populated with your key. If not, you can enter it directly in the interface, though this is less secure as the key will only persist for your current session.

Below the API key field, you’ll see a dropdown for selecting the specific Groq model you want to use. For this tutorial, I selected Llama 3.3 70B.

Step #4: Describe Your Application

Now comes the critical part where you provide information about the application you want to threat model. The quality and comprehensiveness of your threat model depends heavily on the detail you provide in this step.

In the main area of the interface, you’ll see a text box labeled “Describe the application to be modelled”. This is where you provide a description of your application’s architecture, functionality, and security-relevant characteristics.

Let’s work through a practical example. Suppose you’re building a web-based project management application. Here’s the kind of description you should provide:

“This is a web-based project management application built with a React frontend and a Node.js backend API. The application uses JWT tokens for authentication, with tokens stored in HTTP-only cookies. Users can create projects, assign tasks to team members, upload file attachments, and generate reports. The application is internet-facing and accessible to both authenticated users and unauthenticated visitors who can view a limited public project showcase. The backend connects to a PostgreSQL database that stores user credentials, project data, task information, and file metadata. Actual file uploads are stored in an AWS S3 bucket. The application processes sensitive data including user email addresses, project details that may contain confidential business information, and file attachments that could contain proprietary documents. The application implements role-based access control with three roles: Admin, Project Manager, and Team Member. Admins can manage users and system settings, Project Managers can create and manage projects, and Team Members can view assigned tasks and update their status.”

The more specific you are, the more targeted and actionable your threat model will be.

Besides that, near the application description field, you’ll see several dropdowns that help STRIDE GPT understand your application’s security context.

Step #5: Generate Your Threat Model

With all the configuration complete and your application described, you’re ready to generate your threat model. Look for a button labeled “Generate Threat Model” and click it.

Once complete, you’ll see a comprehensive threat model organized by the STRIDE categories. For each category, the model will identify specific threats relevant to your application. Let’s look at what you might see for our project management application example:

Each threat includes a detailed description explaining how the attack could be carried out and what the impact would be.

Step #6: Generate an Attack Tree

Beyond the basic threat model, STRIDE GPT can generate attack trees that visualize how an attacker might chain multiple vulnerabilities together to achieve a specific objective.

The tool generates these attack trees in Mermaid diagram format, which renders as an interactive visual diagram directly in your browser.

Step #7: Review DREAD Risk Scores

STRIDE GPT implements the DREAD risk scoring model to help you prioritize which threats to address first.

The tool will analyze each threat and assign scores from 1 to 10 for five factors:

Damage: How severe would the impact be if the threat were exploited?

Reproducibility: How easy is it to reproduce the attack?

Exploitability: How much effort and skill would be required to exploit the vulnerability?

Affected Users: How many users would be impacted?

Discoverability: How easy is it for an attacker to discover the vulnerability?

The DREAD assessment appears in a table format showing each threat, its individual factor scores, and its overall risk score.

Step #8: Generate Mitigation Strategies

Identifying threats is only half the battle. You also need actionable guidance on how to address them. STRIDE GPT includes a feature to generate specific mitigation strategies for each identified threat.

Look for a button labeled “Mitigations” and click it.

These mitigation strategies are specific to your application’s architecture and the threats identified. They’re not generic security advice but targeted recommendations based on the actual risks in your system.

Step #8: Generate Gherkin Test Cases

One of the most innovative features of STRIDE GPT is its ability to generate Gherkin test cases based on the identified threats. Gherkin is a business-readable, domain-specific language used in Behavior-Driven Development to describe software behaviors without detailing how that behavior is implemented. These test cases can be integrated into your automated testing pipeline to ensure that the mitigations you implement actually work.

Look for a button labeled “Generate Test Cases”. When you click it, STRIDE GPT will create Gherkin scenarios for each major threat.

Summary

Traditional threat modeling takes a lot of time and requires experts, which stops many organizations from doing it well. STRIDE GPT makes threat modeling easier for everyone by using AI to automate the analysis while keeping the quality of the proven STRIDE method.

In this article, we checked out STRIDE GPT and went over its main features. No matter if you’re protecting a basic web app or a complicated microservices setup, STRIDE GPT gives you the analytical tools you need to spot and tackle security threats in a straightforward way.

Command and Control (C2): Using Browser Notifications as a Weapon

Welcome back, my aspiring hackers!

Nowadays, we often discuss the importance of protecting our systems from malware and sophisticated attacks. We install antivirus software, configure firewalls, and maintain vigilant security practices. But what happens when the attack vector isn’t a malicious file or a network exploit, but rather a legitimate browser feature you’ve been trusting?

This is precisely the threat posed by a new command-and-control platform called Matrix Push C2. This browser-native, fileless framework leverages push notifications, fake alerts, and link redirects to target victims. The entire attack occurs through your web browser, without first infecting your system through traditional means.

In this article, we will explore the architecture of browser-based attacks and investigate how Matrix Push C2 weaponizes it. Let’s get rolling!

The Anatomy of a Browser-Based Attack

Matrix Push C2 abuses the web push notification system, a legitimate browser feature that websites use to send updates and alerts to users who have opted in. Attackers first trick users into allowing browser notifications through social engineering on malicious or compromised websites.

Once a user subscribes to the attacker’s notifications, the attacker can push out fake error messages or security alerts at will that look scarily real. These messages appear as if they are from the operating system or trusted software, complete with official-sounding titles and icons.

The fake alerts might warn about suspicious logins to your accounts, claim that your browser needs an urgent security update, or suggest that your system has been compromised and requires immediate action. Each notification includes a convenient “Verify” or “Update” button that, when clicked, takes the victim to a bogus site controlled by the attackers. This site might be a phishing page designed to steal credentials, or it might attempt to trick you into downloading actual malware onto your system. Because this whole interaction is happening through the browser’s notification system, no traditional malware file needs to be present on the system initially. It’s a fileless technique that operates entirely within the trusted confines of your web browser.

Inside the Attacker’s Command Center

Matrix Push C2 is offered as a malware-as-a-service kit to other threat actors, sold directly through crimeware channels, typically via Telegram and cybercrime forums. The pricing structure follows a tiered subscription model that makes it accessible to criminals at various levels of sophistication. According to BlackFog company, the Matrix Push C2 costs approximately $150 for one month, $405 for three months, $765 for six months, and $1,500 for a full year. Payments are accepted in cryptocurrency, and buyers communicate directly with the operator for access.

From the attacker’s perspective, the interface is intuitive. The campaign dashboard displays metrics like total clients, delivery success rates, and notification interaction statistics.

Source: BlackFog

As soon as a browser is enlisted by accepting the push notification subscription, it reports data back to the command-and-control server.

Source: BlackFog

Matrix Push C2 can detect the presence of browser extensions, including cryptocurrency wallets like MetaMask, identify the device type and operating system, and track user interactions with notifications. Essentially, as soon as the victim permits the notifications, the attacker gains a telemetry feed from that browser session.

Social Engineering at Scale

The core of the attack is social engineering, and Matrix Push C2 comes loaded with configurable templates to maximize the credibility of its fake messages. Attackers can easily theme their phishing notifications and landing pages to impersonate well-known companies and services. The platform includes pre-built templates for brands such as MetaMask, Netflix, Cloudflare, PayPal, and TikTok, each designed to look like a legitimate notification or security page from those providers.

Source: BlackFog

Because these notifications appear in the official notification area of the device, users may assume their own system or applications generated the alert.

Defending Against Browser-Based Command and Control

As cyberwarriors, we must adapt our defensive strategies to account for this new attack vector. The first line of defense is user education and awareness. Users need to understand that browser notification permission requests should be treated with the same skepticism as requests to download and run executable files. Just because a website asks for notification permissions doesn’t mean you should grant them. In fact, most legitimate websites function perfectly well without push notifications, and the feature is often more of an annoyance than a benefit. If you believe that your team needs to update their skills for current and upcoming threats, consider our recently published Security Awareness and Risk Management training.

Beyond user awareness, technical controls can help mitigate this threat. Browser policies in enterprise environments can be configured to block notification permissions by default or to whitelist only approved sites. Network security tools can monitor for connections to known malicious notification services or suspicious URL shortening domains.

Summary

The fileless, cross-platform nature of this attack makes it particularly dangerous and difficult to detect using traditional security tools. However, by combining user awareness, proper browser configuration, and anti-data exfiltration technology, we can defend against this threat.

In this article, we briefly explored how Matrix Push C2 operates, and it’s a first step in protecting yourself and your organization from this emerging attack vector.

Offensive Security: Get Started with Penelope for Advanced Shell Management

Welcome back, aspiring cyberwarriors!

In the world of penetration testing and red team operations, one of the most critical moments comes after you’ve successfully exploited a target system. You’ve gained initial access, but now you’re stuck with a basic, unstable shell that could drop at any moment. You need to upgrade that shell, manage multiple connections, and maintain persistence without losing your hard-won access.

Traditional methods of shell management are fragmented and inefficient. You might use netcat for catching shells, then manually upgrade them with Python or script commands, manage them in separate terminal windows, and hope you don’t lose track of which shell connects to which target. Or you can use Penelope to handle all those things.

Penelope is a shell handler designed specifically for hackers who demand more from their post-exploitation toolkit. Unlike basic listeners like netcat, Penelope automatically upgrades shells to fully interactive TTYs, manages multiple sessions simultaneously, and provides a centralized interface for controlling all your compromised systems.

In this article, we will install Penelope and explore its core features. Let’s get rolling!

Step #1: Download and Install Penelope

In this tutorial, I will be installing Penelope on my Raspberry Pi 4, but the tool works equally well on any Linux distribution or MacOS system with Python 3.6 or higher installed. The installation process is straightforward since Penelope is a Python script

First, navigate to the GitHub repository and clone the project to your system:
pi> git clone https://github.com/brightio/penelope.git

pi> cd penelope

Once the downloading completes, you can verify that Penelope is ready to use by checking its help menu:

pi> python3 penelope.py -h

You should see a comprehensive help menu displaying all of Penelope’s options and capabilities. This confirms that the tool is properly installed and ready for use.

Step #2: Starting a Basic Listener

The most fundamental use case for Penelope is catching reverse shells from compromised targets. Unlike netcat, which simply listens on a port and displays whatever connects, Penelope manages the incoming connection and prepares it for interactive use.

To start a basic listener on port 4444, execute the following command:

pi> python3 penelope.py

Penelope will start listening on the default port and display a status message indicating it’s ready to receive connections.

Now let’s simulate a compromised target connecting back to your listener.

You should see Penelope display information about the new session, including an assigned session ID, the target’s IP address, and the detected operating system. The shell is automatically upgraded to a fully interactive TTY, meaning you now have tab completion, the ability to use text editors like Vim, and proper handling of special characters.

Step #3: Managing Multiple Sessions

Let’s simulate managing multiple targets. In the current session, click F12 to open a menu. There, you can type help for exploring available options.

We’re interested in adding a new listener, so the command will be:

panelope> listeners add -p <port>

Each time a new target connects, Penelope assigns it a unique session ID and adds it to your session list.

To view all active sessions, use the sessions command within Penelope:

penelope > sessions

This displays a table showing all connected targets with their session IDs, IP addresses and operating systems.

To interact with a specific session, use the session ID. For example, to switch to session 2:

penelope > interact 2

Step #4: Uploading and Downloading Files

File transfer is a constant requirement during penetration testing engagements. You need to upload exploitation tools, download sensitive data, and move files between your attack system and compromised targets. Penelope includes built-in file transfer capabilities that work regardless of what tools are available on the target system.

To upload a file from your attacking system to the target, use the upload command. Let’s say you want to upload a Python script called script.py to the target:

penelope > upload /home/air/Tools/script.py

Downloading files from the target works similarly. Suppose you’ve discovered a sensitive configuration file on the compromised system that you need to exfiltrate:

penelope > download /etc/passwd

Summary

Traditional tools like netcat provide basic listening capabilities but leave you manually managing shell upgrades, juggling terminal windows, and struggling to maintain organized control over your compromised infrastructure. Penelope solves these problems. It provides the control and organization you need to work efficiently and maintain access to your hard-won, compromised systems.

The tool’s automatic upgrade capabilities, multi-session management, built-in file transfer, and session persistence features make it a valuable go-to solution for cyberwarriors. Keep an eye on it—it may find a place in your hacking toolbox.

Open Source Intelligence (OSINT): Strategic Techniques for Finding Info on X (Twitter)

Welcome back, my aspiring digital investigators!

In the rapidly evolving landscape of open source intelligence, Twitter (now rebranded as X) has long been considered one of the most valuable platforms for gathering real-time information, tracking social movements, and conducting digital investigations. However, the platform’s transformation under Elon Musk’s ownership has fundamentally altered the OSINT landscape, creating unprecedented challenges for investigators who previously relied on third-party tools and API access to conduct their research.

The golden age of Twitter OSINT tools has effectively ended. Applications like Twint, GetOldTweets3, and countless browser extensions that once provided investigators with powerful capabilities to search historical tweets, analyze user networks, and extract metadata have been rendered largely useless by the platform’s new API restrictions and authentication requirements. What was once a treasure trove of accessible data has become a walled garden, forcing OSINT practitioners to adapt their methodologies and embrace more sophisticated, indirect approaches to intelligence gathering.

This fundamental shift represents both a challenge and an opportunity for serious digital investigators. While the days of easily scraping massive datasets are behind us, the platform still contains an enormous wealth of information for those who understand how to access it through alternative means. The key lies in understanding that modern Twitter OSINT is no longer about brute-force data collection, but rather about strategic, targeted analysis using techniques that work within the platform’s new constraints.

Understanding the New Twitter Landscape

The platform’s new monetization model has created distinct user classes with different capabilities and visibility levels. Verified subscribers enjoy enhanced reach, longer post limits, and priority placement in replies and search results. This has created a new dynamic where information from paid accounts often receives more visibility than content from free users, regardless of its accuracy or relevance. For OSINT practitioners, this means understanding these algorithmic biases is essential for comprehensive intelligence gathering.

The removal of legacy verification badges and the introduction of paid verification has also complicated the process of source verification. Previously, blue checkmarks provided a reliable indicator of account authenticity for public figures, journalists, and organizations. Now, anyone willing to pay can obtain verification, making it necessary to develop new methods for assessing source credibility and authenticity.

Content moderation policies have also evolved significantly, with changes in enforcement priorities and community guidelines affecting what information remains visible and accessible. Some previously available content has been removed or restricted, while other types of content that were previously moderated are now more readily accessible. Also, the company updated its terms of service to officially say it uses public tweets to train its AI.

Search Operators

The foundation of effective Twitter OSINT lies in knowing how to craft precise search queries using X’s advanced search operators. These operators allow you to filter and target specific information with remarkable precision.

You can access the advanced search interface through the web version of X, but knowing the operators allows you to craft complex queries directly in the search bar.

Here are some of the most valuable search operators for OSINT purposes:

from:username – Shows tweets only from a specific user

to:username – Shows tweets directed at a specific user

since:YYYY-MM-DD – Shows tweets after a specific date

until:YYYY-MM-DD – Shows tweets before a specific date

near:location within:miles – Shows tweets near a location

filter:links – Shows only tweets containing links

filter:media – Shows only tweets containing media

filter:images – Shows only tweets containing images

filter:videos – Shows only tweets containing videos

filter:verified – Shows only tweets from verified accounts

-filter:replies – Excludes replies from search results

#hashtag – Shows tweets containing a specific hashtag

"exact phrase" – Shows tweets containing an exact phrase

For example, to find tweets from a specific user about cybersecurity posted in the first half of 2025, you could use:

from:username cybersecurity since:2024-01-01 until:2024-06-30

The power of these operators becomes apparent when you combine them. For instance, to find tweets containing images posted near a specific location during a particular event:

near:Moscow within:5mi filter:images since:2023-04-15 until:2024-04-16 drone

This would help you find images shared on X during the drone attack on Moscow.

Profile Analysis and Behavioral Intelligence

Every Twitter account leaves digital fingerprints that tell a story far beyond what users intend to reveal.

The Account Creation Time Signature

Account creation patterns often expose coordinated operations with startling precision. During investigation of a corporate disinformation campaign, researchers discovered 23 accounts created within a 48-hour window in March 2023—all targeting the same pharmaceutical company. The accounts had been carefully aged for six months before activation, but their synchronized birth dates revealed centralized creation despite using different IP addresses and varied profile information.

Username Evolution Archaeology: A cybersecurity firm tracking ransomware operators found that a key player had changed usernames 14 times over two years, but each transition left traces. By documenting the evolution @crypto_expert → @blockchain_dev → @security_researcher → @threat_analyst, investigators revealed the account operator’s attempt to build credibility in different communities while maintaining the same underlying network connections.

Visual Identity Intelligence: Profile image analysis has become remarkably sophisticated. When investigating a suspected foreign influence operation, researchers used reverse image searches to discover that 8 different accounts were using professional headshots from the same stock photography session—but cropped differently to appear unrelated. The original stock photo metadata revealed it was purchased from a server in Eastern Europe, contradicting the accounts’ claims of U.S. residence.

Temporal Behavioral Fingerprinting

Human posting patterns are as unique as fingerprints, and investigators have developed techniques to extract extraordinary intelligence from timing data alone.

Geographic Time Zone Contradictions: Researchers tracking international cybercriminal networks identified coordination patterns across supposedly unrelated accounts. Five accounts claiming to operate from different U.S. cities all showed posting patterns consistent with Central European Time, despite using location-appropriate slang and cultural references. Further analysis revealed they were posting during European business hours while American accounts typically show evening and weekend activity.

Automation Detection Through Micro-Timing: A social media manipulation investigation used precise timestamp analysis to identify bot behavior. Suspected accounts were posting with unusual regularity—exactly every 3 hours and 17 minutes for weeks. Human posting shows natural variation, but these accounts demonstrated algorithmic precision that revealed automated management despite otherwise convincing content.

Network Archaeology and Relationship Intelligence

Twitter’s social graph remains one of its most valuable intelligence sources, requiring investigators to become expert relationship analysts.

The Early Follower Principle: When investigating anonymous accounts involved in political manipulation, researchers focus on the first 50 followers. These early connections often reveal real identities or organizational affiliations before operators realize they need operational security. In one case, an anonymous political attack account’s early followers included three employees from the same PR firm, revealing the operation’s true source.

Mutual Connection Pattern Analysis: Intelligence analysts investigating foreign interference discovered sophisticated relationship mapping. Suspected accounts showed carefully constructed following patterns—they followed legitimate journalists, activists, and political figures to appear authentic, but also maintained subtle connections to each other through shared follows of obscure accounts that served as coordination signals.

Reply Chain Forensics: A financial fraud investigation revealed coordination through reply pattern analysis. Seven accounts engaged in artificial conversation chains to boost specific investment content. While the conversations appeared natural, timing analysis showed responses occurred within 30-45 seconds consistently—far faster than natural reading and response times for the complex financial content being discussed.

Systematic Documentation and Intelligence Development

The most successful profile analysis investigations employ systematic documentation techniques that build comprehensive intelligence over time rather than relying on single-point assessments.

Behavioral Baseline Establishment: Investigators spend 2-4 weeks establishing normal behavioral patterns before conducting anomaly analysis. This baseline includes posting frequency, engagement patterns, topic preferences, language usage, and network interaction patterns. Deviations from established baselines indicate potential significant developments.

Multi-Vector Correlation Analysis: Advanced investigations combine temporal, linguistic, network, and content analysis to build confidence levels in conclusions. Single indicators might suggest possibilities, but convergent evidence from multiple analysis vectors provides actionable intelligence confidence levels above 85%.

Summary

Predictive Behavior Modeling: The most sophisticated investigators use historical pattern analysis to predict likely future behaviors and optimal monitoring strategies. Understanding individual behavioral patterns enables investigators to anticipate when targets are most likely to post valuable intelligence or engage in significant activities.

Modern Twitter OSINT now requires investigators to develop cross-platform correlation skills and collaborative intelligence gathering approaches. While the technical barriers have increased significantly, the platform remains valuable for those who understand how to leverage remaining accessible features through creative, systematic investigation techniques.

To improve your OSINT skills, check out our OSINT Investigator Bundle. You’ll explore both fundamental and advanced techniques and receive an OSINT Certified Investigator Voucher.

Automating Your Digital Life with n8n

Welcome back, aspiring cyberwarriors!

As you know, there are plenty of automation tools out there, but most of them are closed-source, cloud-only services that charge you per operation and keep your data on their servers. For those of us who value privacy and transparency, these solutions simply won’t do. That’s where n8n comes into the picture – a free, private workflow automation platform that you can self-host on your own infrastructure while maintaining complete control over your data.

In this article, we explore n8n, set it up on a Raspberry Pi, and create a workflow for monitoring security news and sending it to Matrix. Let’s get rolling!

What is n8n?

n8n is a workflow automation platform that combines AI capabilities with business process automation, giving technical teams the flexibility of code with the speed of no-code. The platform uses a visual node-based interface where each node represents a specific action, for example, reading an RSS feed, sending a message, querying a database, or calling an API. When you connect these nodes, you create a workflow that executes automatically based on triggers you define.

With over 400 integrations, native AI capabilities, and a fair-code license, n8n lets you build powerful automation while maintaining full control over your data and deployments.

The Scenario: RSS Feed Monitoring with Matrix Notifications

For this tutorial, we’re going to build a practical workflow that many security professionals and tech enthusiasts need: automatically monitoring RSS feeds from security news sites and threat intelligence sources, then sending new articles directly to a Matrix chat room. Matrix is an open-source, decentralized communication protocol—essentially a privacy-focused alternative to Slack or Discord that you can self-host.

Step #1: Installing n8n on Raspberry Pi

Let’s get started by setting up n8n on your Raspberry Pi. First, we need to install Docker, which is the easiest way to run n8n on a Raspberry Pi. SSH into your Pi and run these commands:

pi> curl -fsSL https://get.docker.com -o get-docker.sh
pi> sudo sh get-docker.sh
pi> sudo usermod -aG docker pi

Log out and back in for the group changes to take effect. Now we can run n8n with Docker in a dedicated directory:

pi> sudo mkdir -p /opt/n8n/data


pi> sudo chown -R 1000:1000 /opt/n8n/data


pi> sudo docker run -d –restart unless-stopped –name n8n \
-p 5678:5678 \
-v ~/.n8n:/home/node/.n8n \
-e N8N_SECURE_COOKIE=false \
n8nio/n8n

This command runs n8n as a background service that automatically restarts if it crashes or when your Pi reboots. It maps port 5678 so you can access the n8n interface, and it creates a persistent volume at /opt/n8n/data to store your workflows and credentials so they survive container restarts. Also, the service doesn’t require an HTTPS connection; HTTP is enough.

Give it a minute to download and start, then open your web browser and navigate to http://your-raspberry-pi-ip:5678. You should see the n8n welcome screen asking you to create your first account.

Step #2: Understanding the n8n Interface

Once you’re logged in and have created your first workflow, you’ll see the n8n canvas—a blank workspace where you’ll build your workflows. The interface is intuitive, but let me walk you through the key elements.

On the right side, you’ll see a list of available nodes organized by category (Tab key). These are the building blocks of your workflows. There are trigger nodes that start your workflow (like RSS Feed Trigger, Webhook, or Schedule), action nodes that perform specific tasks (like HTTP Request or Function), and logic nodes that control flow (like IF conditions and Switch statements).

The main canvas in the center is where you’ll drag and drop nodes and connect them. Each connection represents data flowing from one node to the next. When a workflow executes, data passes through each node in sequence, getting transformed and processed along the way.

Step #3: Creating Your First Workflow – RSS to Matrix

Now let’s build our RSS monitoring workflow. Click the “Add workflow” button to create a new workflow. Give it a meaningful name like “Security RSS to Matrix”.

We’ll start by adding our trigger node. Click the plus icon on the canvas and search for “RSS Feed Trigger”. Select it and you’ll see the node configuration panel open on the right side.

In the RSS Feed Trigger node configuration, you need to specify the RSS feed URL you want to monitor. For this example, let’s use the Hackers-Arise feed.

The RSS Feed Trigger has several important settings. The Poll Times setting determines how often n8n checks the feed for new items. You can set it to check every hour, every day, or on a custom schedule. For a security news feed, checking every hour makes sense, so you get timely notifications without overwhelming your Matrix room.

Click “Execute Node” to test it. You should see the latest articles from the feed appear in the output panel. Each article contains data like title, link, publication date, and sometimes the author. This data will flow to the next nodes in your workflow.

Step #4: Configuring Matrix Integration

Now we need to add the Matrix node to send these articles to your Matrix room. Click the plus icon to add a new node and search for “Matrix”. Select the Matrix node and “Create a message” as the action.

Before we can use the Matrix node, we need to set up credentials. Click on “Credential to connect with” and select “Create New”. You’ll need to provide your Matrix homeserver URL, your Matrix username, and password or access token.

Now comes the interesting part—composing the message. n8n uses expressions to pull data from previous nodes. In the message field, you can reference data from the RSS Feed Trigger using expressions like {{ $json.title }} and {{ $json.link }}.

Here’s a good message template that formats the RSS articles nicely:

🔔 New Article: {{ $json.title }}

{{ $json.description }}

🔗 Read more: {{ $json.link }}

Step #5: Testing and Activating Your Workflow

Click the “Execute Workflow” button at the top. You should see the workflow execute, data flow through the nodes, and if everything is configured correctly, a message will appear in your Matrix room with the latest RSS article.

Once you’ve confirmed the workflow works correctly, activate it by clicking the toggle switch at the top of the workflow editor.

The workflow is now running automatically! The RSS Feed Trigger will check for new articles according to the schedule you configured, and each new article will be sent to your Matrix room.

Summary

The workflow we built today, monitoring RSS feeds and sending security news to Matrix, demonstrates n8n’s practical value. Whether you’re aggregating threat intelligence, monitoring your infrastructure, managing your home lab, or just staying on top of technology news, n8n can eliminate the tedious manual work that consumes so much of our time.

Open Source Intelligence (OSINT): Using Flowsint for Graph-Based Investigations

Welcome back, aspiring cyberwarriors!

In our industry, we often find ourselves overwhelmed by data from numerous sources. You might be tracking threat actors across social media platforms, mapping domain infrastructure for a penetration test, investigating cryptocurrency transactions tied to ransomware operations, or simply trying to understand how different pieces of intelligence connect to reveal the bigger picture. The challenge is not finding data but making sense of it all. Traditional OSINT tools come and go, scripts break when APIs change, and your investigation notes end up scattered across spreadsheets, text files, and fragile Python scripts that stop working the moment a service updates its interface.

As you know, the real value in intelligence work is not in collecting isolated data points but in understanding the relationships between them. A domain by itself tells you little. But when you can see that a domain connected to an IP address, that IP is tied to an ASN owned by a specific organization, that organization is linked to social media accounts, and those accounts are associated with known threat actors, suddenly you have actionable intelligence. The problem is that most OSINT tools force you to work in silos. You run one tool to enumerate subdomains, another to check WHOIS records, and a third to search for breaches. Then, you manually try to piece it all together in your head or in a makeshift spreadsheet.

To solve these problems, we’re going to explore a tool called Flowsint – an open-source graph-based investigation platform. Let’s get rolling!

Step #1: Install Prerequisites

Before we can run Flowsint, we need to make certain we have the necessary prerequisites installed on our system. Flowsint uses Docker to containerize all its components. You will also need Make, a build automation tool that builds executable programs and libraries from source code.

In this tutorial, I will be installing Flowsint on my Raspberry Pi 4 system, but the instructions are nearly identical for use with other operating systems as long as you have Docker and Make installed.

First, make certain you have Docker installed.
kali> docker –version

Next, make sure you have Make installed.
kali > make –version

Now that we have our prerequisites in place, we are ready to download and install Flowsint.

Step #2: Clone the Flowsint Repository

Flowsint is hosted on GitHub as an open-source project. Clone the repository with the following command:
kali > git clone https://github.com/reconurge/flowsint.git
kali > cd flowsint

To install and start Flowsint in production mode, simply run:
kali > make prod

This command will do several things. It will build the Docker images for all the Flowsint components, start the necessary containers, including the Neo4j graph database, PostgreSQL database for user management, the FastAPI backend server, and the frontend application. It will also configure networking between the containers and set up the initial database schemas.

The first time you run this command, it may take several minutes to complete as Docker downloads base images and builds the Flowsint containers. You should see output in your terminal showing the progress of each build step. Once the installation completes, all the Flowsint services will be running in the background.

You can verify that the containers are running with:
kali > docker ps

Step #3: Create Your Account

With Flowsint now running, we can access the web interface and create our first user account. Open your web browser and navigate to: http://localhost:5173/register

Once you have filled in the registration form and logged in, you will now see the main interface, where you can begin building your investigations.

Step #4 Creating Your First Investigation

Let’s create a simple investigation to see how Flowsint works in practice.

After creating the investigation, we can view analytics about it and, most importantly, create our first sketch using the panel on the left. Sketches allow you to organize and visualize your data as a graph.

After creating the sketch, we need to add our first node to the ‘items’ section. In this case, let’s use a domain name.

Enter a domain name you want to investigate. For this tutorial, I will use a lenta.ru domain.

You should now see a node appear on the graph canvas representing your domain. Click on this node to select it and view the available transforms. You will see a list of operations you can perform on this domain entity.

Step #5 Running Transforms to Discover Relationships

Now that we have a domain entity in our graph, let’s run some transforms to discover related infrastructure and build out our investigation.

With your domain entity selected, look for the transform that will resolve the domain to its IP addresses. Flowsint will query DNS servers to find the IP addresses associated with your domain and create new IP entities in your graph connected to the domain with a relationship indicating the DNS resolution.

Let’s run another transform. Select your domain entity again, and this time run the WHOIS Lookup transform. This transform will query WHOIS databases to get domain registration information, including the registrar, registration date, expiration date, and sometimes contact information for the domain owner.

Now select one of the IP address entities that was discovered. You should see a different set of available transforms specific to IP addresses. Run the IP Information transform. This transform will get geolocation and network details for the IP address, including the country, city, ISP, and other relevant information.

Step #6 Chaining Transforms for Deeper Investigation

One of the powerful features of Flowsint is the ability to chain transforms together to automate complex investigation workflows. Instead of manually running each transform one at a time, you can set up sequences of transforms that execute automatically.

Let’s say you want to investigate not just a single domain but all the subdomains associated with it. Select your original domain entity and run the Domain to Subdomains transform. This transform will enumerate subdomains using various techniques, including DNS brute forcing, certificate transparency logs, and other sources.

Each discovered subdomain will appear as a new domain entity in your graph, connected to the parent domain.

Step #7 Investigating Social Media and Email Connections

Flowsint is not limited to technical infrastructure investigation. It also includes transforms for investigating individuals, organizations, social media accounts, and email addresses.

Let’s add an email address entity to our graph. In the sidebar, select the email entity type and enter an email address associated with your investigation target.

Once you have created the email entity, select it and look at the available transforms. You will see several options, including Email to Gravatar, Email to Breaches, and Email to Domains.

Summary

In many cases, cyberwarriors must make sense of vast amounts of interconnected data from diverse sources. A platform such as Flowsint provides the durable foundation we need to conduct comprehensive investigations that remain stable even as tools and data sources evolve around it.

Whether you are investigating threat actors, mapping infrastructure, tracking cryptocurrency flows, or uncovering human connections, Flowsint gives you the power to connect the dots and see the truth.

Hacking with the Raspberry Pi: Network Enumeration

Welcome back, my aspiring cyberwarriors!

We continue exploring the Raspberry Pi’s potential for hacking. In this article, we’ll dive into network enumeration.

Enumeration is the foundational step of any penetration test—it involves systematically gathering detailed information about the hosts, services, and topology of the network you’re targeting. For the purposes of this guide, we’ll assume that you already have a foothold within the network—whether through physical proximity, compromised credentials, or another form of access—allowing you to apply a range of enumeration techniques.

Let’s get started!

Step #1: Fping

To get started, we’ll examine a lightweight utility called fping. It leverages the Internet Control Message Protocol (ICMP) echo request to determine whether a target host is responding. Unlike the traditional ping command, fping lets you specify any number of targets directly on the command line—or supply a file containing a list of targets to probe. This allows us to do a basic network discovery.

Fping comes preinstalled on Kali Linux. To confirm that it’s available and view its options, you can display the help page.

kali> fping -h

To run a quiet scan, we can use the following command:

kali> sudo fping -I wlan0 -q -a -g 192.168.0.0/24

This command runs fping with root privileges to quietly scan all IP addresses in the 192.168.0.0/24 network via the wlan0 interface, showing only the IPs that respond (i.e., hosts that are alive). At this point, we can see which systems are live on the network and are ready to be exploited. At its core, fping is very lightweight; when I ran htop and fping simultaneously, I observed the following output:

As you can see, CPU usage is around 2% and less than 1% of memory usage in my case (my Pi board has 4 cores and 2GB of RAM).

Step #2: Nmap

At this point, we have identified our target and can move on to the next step — network mapping with Nmap to see which ports are open. Nmap is one of the best-known tools in the cybersecurity field, and Hackers-Arise offers a dedicated training course for mastering Nmap; you can find it after the link.

I assume you already have a basic understanding of Nmap, so we can proceed to network enumeration.

Let’s run a simple Nmap scan to check for open ports:

kali> sudo nmap -p- --open –min-rate 5000 -n -Pn 192.168.0.150 -oG open_ports

This command checks all 65,535 TCP ports and only shows the ones that are open. It uses a high scan rate for speed (5000 packets per second) and skips DNS resolution, assuming the host is up, without pinging it. Also, the results are saved in a grepable format to a file called open_ports, so we can analyze them later.

At its peak, CPU usage was around 33% and around 2% of memory usage.

As a result, we found twelve open ports and can now move on to gathering a bit more information.

kali> sudo nmap -sC -sV -p135,139,445,5040,8080,49664,49665,49666,49667,49668,49668,49669,49670

This executes Nmap’s default script set (-sC) to identify commonly known vulnerabilities in services listening on the scanned ports. Additionally, -sV was used for service version detection.

This scan revealed some important information for further exploitation. The Raspberry Pi handled it quite well. I saw a brief spike in resource usage at the start, but it remained very low afterward.

Step #3: Exploitation

Let’s assume our reconnaissance is complete and we’ve discovered that the Tomcat application may be using weak credentials. We can now launch Metasploit and attempt a brute-force login.

msf6> use scanner/http/tomcat_mgr_login
msf6> set RHOSTS 192.168.0.150
msf6> run

The Raspberry Pi struggles somewhat to start Metasploit, although running it typically causes no issues.

Summary

The Raspberry Pi is a very powerful tool for every hacker. Our tools are generally lightweight, and the resources of this small board are enough to handle most tasks. So, if your budget is limited, buy a Raspberry Pi, connect it to your TV, and start learning cybersecurity.

If you want to grow in the pentesting field, check out our CWA Preparation Course — get certified, get hired, and start your journey!

SDR (Signals Intelligence) for Hackers: Getting Started with Anti-Drone Warfare

Welcome back, aspiring cyberwarriors!

In modern warfare, we’re dealing with a whole new battlefield—one that’s invisible to the naked eye but just as deadly as kinetic warfare. Drones, or unmanned aerial vehicles (UAVs), have completely changed the game. From small commercial quadra-copters rigged with grenades to sophisticated military platforms conducting precision strikes, these aerial threats are everywhere on today’s battlefield.

But here’s the thing: they all depend on the electromagnetic spectrum to communicate, navigate, and operate. And that’s where Electronic Warfare (EW) comes in. Specifically, we’re talking about Electronic Countermeasures (ECM) designed to jam, disrupt, or even hijack these flying threats.

In this article, we’ll dive into how this invisible war is being fought. Let’s get rolling!

Understanding Radio-Electronic Warfare

Jamming UAVs falls under what’s called Radio-Electronic Warfare. The mission is simple in concept but complex in execution: disorganize the enemy’s command and control, wreck their reconnaissance efforts, and keep our own systems running smoothly.

Within this framework, we have COMJAM (suppression of radio communication channels). This is the bread and butter of counter-drone operations—disrupting the channels that control equipment and weapons, including those UAVs.

How Jamming Actually Works

Let’s get real about how this stuff actually works. It’s really just exploiting basic radio physics and the limitations of receiver systems.

Basic Jamming Principle

The Signal-to-Noise Game

All radio communication depends on what we call the signal-to-noise ratio (SNR). For a drone to receive its control commands or GPS signals, the legitimate signal must be stronger than the background electromagnetic noise.

This follows what’s known as the “jamming equation.” Here’s what matters:

Power output. A 30-watt personal jammer might protect just you and a small group of people, while a 200-watt system can throw up an electronic dome over a much bigger area. More watts equals more range and effectiveness.

Distance relationships. Think about it—the drone operator’s control signal has to travel several kilometers to reach the drone. But if we position our jammer between them or near the drone, we’ve got a much shorter transmission path.

Antenna gain. Directional antennas focus our jamming energy like a spotlight instead of a light bulb.

Frequency selectivity means we can target specific frequency bands used by drones while leaving other communications alone.

Types of Jamming Signals

Types of Jamming Techniques


Different situations call for different jamming techniques:

Noise jamming. We just sent random radio frequency energy across the target frequencies, creating a “wall” of interference.

Tone jamming transmits continuous wave signals at specific frequencies. It’s more power-efficient for targeting narrow-band communications, but modern systems can filter this out more easily.

Pulse jamming uses intermittent bursts of energy. This can be devastating against receivers that use time-based processing, and it conserves our jammer’s power for longer operations.

Swept jamming rapidly changes frequencies across a band. If the enemy drone is frequency-hopping to avoid us, swept jamming ensures we’re hitting them somewhere, though with less power at any single frequency at any moment.

Barrage jamming simultaneously broadcasts across wide frequency ranges. It’s comprehensive coverage, but it requires serious power output.

Smart Jamming and Spoofing

The most basic jamming just drowns out signals with noise. But the most advanced systems go way beyond that, using what we call “smart jamming” or spoofing.

Smart jamming means analyzing the source signal in real-time, understanding how it works, and then replacing it with a more powerful, false signal that the target system will actually accept as legitimate.

In the context of UAV operations, this gets really sophisticated. Systems can manipulate GPS signals to provide false positioning data, making drones think they’re somewhere they’re not—that’s spoofing. Even more advanced are systems like the Shipovnik-АЕРО complex, which can actually penetrate the UAV’s onboard systems and potentially take control.

Shipovnik-АЕРО Complex

What Actually Happens When We Jam a Drone

When we successfully jam a drone, what happens depends on what we’re targeting and how the drone is programmed to respond:

Control link jamming cuts the command channel between the operator and the drone. Depending on its fail-safe programming, the drone might hover in place, automatically return to its launch point, attempt to land immediately, or continue its last programmed mission autonomously.

GPS/GNSS jamming denies the drone accurate position information. Without GPS, most commercial drones and many military ones can’t maintain stable flight or navigate to targets. Some will fall back on inertial navigation systems, but those accumulate errors over time. Others become completely disoriented and crash.

Video link jamming blinds FPV operators, forcing them to fly without visual reference. This is particularly effective against FPV kamikaze drones, which require continuous video feedback for precision targeting.

Combined jamming hits multiple systems simultaneously—control, navigation, and video—creating a comprehensive denial effect that overwhelms even drones with redundant systems.

The Arsenal of Counter-Drone Electronic Warfare Systems

The modern battlefield has an array of EW systems designed specifically for detecting and suppressing drones. These range from massive, brigade-level complexes that can throw up electronic domes over vast areas to small, portable units that individual soldiers can carry for personal protection.

Dedicated Counter-UAS (C-UAS) Systems

The AUDS (Anti-UAV Defence System) is an example of dedicated C-UAS tech. It suppresses communication channels between UAVs and their operators with suppression distances of 2-4 kilometers for small UAVs and up to 8 kilometers for medium-sized platforms. The variation in range reflects the different power levels and signal characteristics of various drone types.

AUDS

The M-LIDS (Mobile-Low, Slow, Small Unmanned Aircraft System Integrated Defeat System) takes a more comprehensive approach. This system doesn’t just jam—it combines an EW suite with a 30mm counter-drone cannon for kinetic kills and even deploys Coyote kamikaze UAVs. It’s literally using drones to fight drones.

M-LIDS

Russian Federation EW Complexes

Russian forces have invested heavily in electronic warfare, including numerous systems specifically designed for drone suppression.

The Leer-2 system offers suppression of UAV communication channels at 4 kilometers for small UAVs and up to 8 kilometers for medium platforms. The Silok system is basically a mobile variant mounted on a Kamaz chassis, with a suppression distance of 3-4 kilometers, giving tactical units mobile EW capabilities.

Leer-2

The Repellent-1 system specifically targets UAV communication channels and satellite navigation, operating in the 200-600 MHz frequency range with a suppression distance of up to 30 kilometers.

Repellent-1

Personal and Tactical-Level Counter-Drone Protection

Big systems are great for area defense, but the ubiquity of small drones has created massive demand for personal and small-unit protection. These portable devices focus on the most commonly used frequencies for commercial and modified commercial drones, providing immediate, localized protection.

The UNWAVE SHATRO represents cutting-edge personal counter-drone protection. Available in portable, wearable, and mobile versions, this system creates a protective bubble with a radius of 50-100 meters, specifically targeting guided munitions and UAVs operating in the 850-930 MHz range.

UNWAVE SHATRO

The UNWAVE BOOMBOX offers both directed protection (up to 500 meters) and omnidirectional coverage (100 meters), targeting multiple frequency bands critical to drone operations. By suppressing frequencies including 850-930 MHz, 1550-1620 MHz (GPS), 2400-2480 MHz (Wi-Fi/Control), and 5725-5850 MHz (Wi-Fi/Video), this system addresses the full spectrum of commercial drone communication and navigation systems.

UNWAVE BOOMBOX

Summary

This article examines the role of Electronic Warfare (EW) in combating unmanned aerial vehicles (UAVs), which rely on electromagnetic signals for operation. It discusses jamming techniques like noise, tone, and pulse jamming, along with advanced methods such as smart jamming and spoofing.

The invisible war for control of the electromagnetic spectrum may not capture headlines like kinetic combat, but make no mistake—it’s every bit as crucial to the outcome of modern conflicts.

Look for our Anti-Drone Warfare training in 2026!

Hacking with the Raspberry Pi: Getting Started with Port Knocking

Welcome back, aspiring cyberwarriors!

As you are aware, traditional security approaches typically involve firewalls that either allow or deny traffic to specific ports. The problem is that allowed ports are visible to anyone running a port scan, making them targets for exploitation. Port knocking takes a different approach: all ports appear filtered (no response) to the outside world until you send a specific sequence of connection attempts to predetermined ports in the correct order. Only then does your firewall open the desired port for your IP address.

Let’s explore how this technique works!

What is Port Knocking?

Port knocking is a method of externally opening ports on a firewall by generating a connection attempt sequence to closed ports. When the correct sequence of port “knocks” is received, the firewall dynamically opens the requested port for the source IP address that sent the correct knock sequence.

The beauty of this technique is its simplicity. A daemon (typically called knockd) runs on your server and monitors firewall logs or packet captures for specific connection patterns. When it detects the correct sequence, it executes a command to modify your firewall rules, usually opening a specific port for a limited time or for your specific IP address only.

The knock sequence can be as simple as attempting connections to three ports in order, like 7000, 8000, 9000, or as complex as a lengthy sequence with timing requirements. The more complex your sequence, the harder it is for an attacker to guess or discover through brute force.

The Scenario: Securing SSH Access to Your Raspberry Pi

For this tutorial, I’ll demonstrate port knocking between a Kali Linux machine and a Raspberry Pi. This is a close to real-world scenario that many of you might use in your home lab or for remote management of IoT devices. The Raspberry Pi will run the knockd daemon and have SSH access hidden behind port knocking, while our Kali machine will perform the knocking sequence to gain access.

Step #1: Setting Up the Raspberry Pi (The Server)

Let’s start by configuring our Raspberry Pi to respond to port knocking. First, we need to install the knockd daemon:

pi> sudo apt install knockd

The configuration file for knockd is located at /etc/knockd.conf. Let’s open it.

Here’s a default configuration that is recommended for beginners. The only thing I changed -A flag to -I to insert the rule at position 1 (top) so it will be evaluated before any DROP rules.

The [openSSH] section defines our knock sequence: connections must be attempted to ports 7000, 8000, and 9000 in that exact order. The seq_timeout of 5 seconds means all three knocks must occur within 5 seconds of each other. When the correct sequence is detected, knockd executes the iptables command to allow SSH connections from your IP address.

The [closeSSH] section does the reverse: it uses the knock sequence in reverse order (9000, 8000, 7000) to close the SSH port again.

Now we need to enable knockd to start on boot:

pi> sudo vim /etc/default/knockd

Change the line START_KNOCKD=0 to START_KNOCKD=1 and make sure the network interface is set correctly.

Step #2: Configuring the Firewall

Before we start knockd, we need to configure our firewall to block SSH by default. This is critical because port knocking only works if the port is actually closed initially.

First, let’s set up basic iptables rules:

pi> sudo apt install iptables

pi> sudo iptables -A INPUT -m conntrack –ctstate ESTABLISHED,RELATED -j ACCEPT

pi> sudo iptables -A INPUT -p tcp –dport 22 -j DROP

pi> sudo iptables -A INPUT -j DROP

These rules allow established connections to continue (so your current SSH session won’t be dropped), block new SSH connections, and drop all other incoming traffic by default.

Now start the knockd daemon:

pi> sudo systemctl start knockd
pi> sudo systemctl enable knockd

Your Raspberry Pi is now configured and waiting for the secret knock! From the outside world, SSH appears with filtered access.

Step #3: Installing Knock Client on Kali Linux

Now let’s switch to our Kali Linux machine. We need to install the knock client, which is the tool we’ll use to send our port knocking sequence.

kali> sudo apt-get install knockd

The knock client is actually part of the same package as the knockd daemon, but we’ll only use the client portion on our Kali machine.

Step #4: Performing the Port Knock

Before we try to SSH to our Raspberry Pi, we need to perform our secret knock sequence. From your Kali Linux terminal, run:

kali> knock -v 192.168.0.113 7000 8000 9000

The knock client is sending TCP SYN packets to each port in sequence. These packets are being logged by the knockd daemon on your Raspberry Pi, which recognizes the pattern and opens SSH for your IP address.

Now, immediately after knocking, try to SSH to your Raspberry Pi:

If everything is configured correctly, you should connect successfully! The knockd daemon recognized your knock sequence and added a temporary iptables rule allowing your IP address to access SSH.

When you’re done with your SSH session, you can close the port again by sending the reverse knock sequence:

kali> knock -v 192.168.1.100 9000 8000 7000

Step #5: Verifying Port Knocking is Working

Let’s verify that our port knocking is actually providing security. Without performing the knock sequence first, try to SSH directly to your Raspberry Pi:

The connection should hang and eventually timeout. If you run nmap against your Raspberry Pi without knocking first, you’ll see that port 22 appears filtered:

Now perform your knock sequence and immediately scan again:

This demonstrates how port knocking makes services filtered until the correct sequence is provided.

Summary

Port knocking is a powerful technique for adding an extra layer of security to remote access services. By requiring a specific sequence of connection attempts before opening a port, it makes your services harder to detect to attackers and reduces your attack surface. But remember that port knocking should be part of a defense-in-depth strategy, not a standalone security solution.

Web App Hacking:Tearing Back the Cloudflare Veil to Reveal IP’s

Welcome back, aspiring cyberwarriors!

Cloudflare has built an $80 billion business protecting websites. This protection includes DDoS attacks and protecting IP addresses from disclosure. Now, we have a tool that can disclose those sites IP addresses despite Cloudflare’s protection.

As you know, many organizations deploy Cloudflare to protect their main web presence, but they often forget about subdomains. Development servers, staging environments, admin panels, and other subdomains frequently sit outside of Cloudflare’s protection, exposing the real origin IP addresses. CloudRip is a tool that is specifically designed to find these overlooked entry points by scanning subdomains and filtering out Cloudflare IPs to show you only the real server addresses.

In this article, we’ll install CloudRip, test it, and then summarize its benefits and potential drawbacks. Let’s get rolling!

Step #1: Download and Install CloudRip

First, let’s clone the repository from GitHub:

kali> git clone https://github.com/staxsum/CloudRip.git

kali> cd CloudRip

Now we need to install the dependencies. CloudRip requires only two Python libraries: colorama for colored terminal output and pyfiglet for the banner display.

kali> pip3 install colorama pyfiglet –break-system-packages

You’re ready to start finding real IP addresses behind Cloudflare protection. The tool comes with a default wordlist (dom.txt) so you can begin scanning immediately.

Step #2: Basic Usage of CloudRip

Let’s start with the simplest command to see CloudRip in action. For this example, I’ll use some Russian websites with CloudFlare provided by BuildWith.

Before scanning, let’s confirm the website is registered in Russia with the whois command:

kali> whois esetnod32.ru

NS servers are from CloudFlare, and the registrar is Russian. Use dig to check if CloudFlare proxying hides the real IP in the A record.

kali> dig esetnod32.ru

IPs belong to CloudFlare. We’re ready to test out the CloudRip on it.

kali> python3 cloudrip.py esetnod32.ru

The tool tests common subdomains (www, mail, dev, etc.) from its wordlist, resolves their IPs, and checks if they belong to Cloudflare.

In this case, we can see that the main website is hiding its IP via CloudFlare, but the subdomains’ IPs don’t belong to CloudFlare.

Step #3: Advanced Usage with Custom Options

CloudRip provides several command-line options that give you greater control over your reconnaissance.

Here’s the full syntax with all available options:

kali> python3 cloudrip.py example.com -w custom_wordlist.txt -t 20 -o results.txt

Let me break down what each option does:

-w (wordlist): This allows you to specify your own subdomain wordlist. While the default dom.txt is quite good, experienced hackers often maintain their own customized wordlists tailored to specific industries or target types.

-t (threads): This controls how many threads CloudRip uses for scanning. The default is 10, which works well for most situations. However, if you’re working with a large wordlist and need faster results, you can increase this to 20 or even higher. Just be mindful that too many threads might trigger rate limiting or appear suspicious.

-o (output file): This saves all discovered non-Cloudflare IP addresses to a text file.

Step #4: Practical Examples

Let me walk you through a scenario to show you how CloudRip fits into a real engagement.

Scenario 1: Custom Wordlist for Specific Target

After running subfinder, some unique subdomains were discovered:

kali> subfinder -d rp-wow.ru -o rp-wow.ru.txt

Let’s filter them for subdomains only.

kali> grep -v “^rp-wow.ru$” rp-wow.ru.txt | sed ‘s/.rp-wow.ru$//’ > subdomains_only.txt

Now, you run CloudRip with your custom wordlist:

kali> python3 cloudrip.py rp-wow.ru -w subdomains_only.txt -t 20 -o findings.txt

Benefits of CloudRip

CloudRip excels at its specific task. Rather than trying to be a Swiss Army knife, it focuses on one aspect of reconnaissance and does it well.

The multi-threaded architecture provides a good balance between speed and resource consumption. You can adjust the thread count based on your needs, but the defaults work well for most situations without requiring constant tweaking.

Potential Drawbacks

Like any tool, CloudRip has limitations that you should understand before relying on it heavily.

First, the tool’s effectiveness depends entirely on your wordlist. If the target organization uses unusual naming conventions for its subdomains, even the best wordlist might miss them.

Second, security-conscious organizations that properly configure Cloudflare for ALL their subdomains will leave little for CloudRip to discover.

Finally, CloudRip only checks DNS resolution. It doesn’t employ more sophisticated techniques like analyzing historical DNS records or examining SSL certificates for additional domains. It should be one tool in your reconnaissance toolkit, not your only tool.

Summary

CloudRip is a simple and effective tool that helps you find real origin servers hidden behind Cloudflare protection. It works by scanning many possible subdomains and checking which ones use Cloudflare’s IP addresses. Any IPs that do not belong to Cloudflare are shown as possible real server locations.

The tool is easy to use, requires very little setup, and automatically filters results to save you time. Both beginners and experienced cyberwarriors can benefit from it.

Test it out—it may become another tool in your hacker’s toolbox.

Using Artificial Intelligence (AI) in Cybersecurity: Accelerate Your Python Development with Terminal‑Integrated AI

Welcome back, aspiring cyberwarriors and AI users!

If you’re communicating with AI assistants via browsers, you’re doing it in a slow way. Any content, for example, such as code, must first be added to the chatbot and then copied back to the working environment. If you are working on several projects, you have a whole bunch of chats created, and gradually, the AI loses context in them. To solve all these problems, we have AI in the terminal.

In this article, we’ll explore how to leverage the Gemini CLI for cybersecurity tasks—specifically, how it can accelerate Python scripting. Let’s get rolling!

Step #1: Get Ready

Our test harness centers on the MCP server we built for log‑analysis, covered in detail in a previous article. While it shines with logs, the setup is completely generic and can be repurposed for any data‑processing workload.

At this point, experienced users might ask why we need to use the MCP server if Gemini can already do the same thing by default. The answer is simple: we have more control over it. We don’t want to give the AI access to the whole system, so we limit it to a specific environment. Moreover, this setup gives us the opportunity for customization—we can add new functions, restrict existing ones according to our needs, or integrate additional tools.

Here is a demonstration of the restriction:

Step #2: Get Started With The Code

If you don’t write code frequently, you’ll forget how your scripts work. When the moment finally arrives, you can ask an AI to explain them to you.

We simply specified the script and got an explanation, without any copying, pasting, or uploading to a browser. Everything was done in the terminal in seconds.
Now, let’s say we want to improve the code’s style according to PEP 8—the official Style Guide for Python.


The AI asks for approval for every edit and visually represents the changes. If you agree, summarize the updates at the end.


Interestingly, the AI changed spaces in the code and broke the script because the network range was specified incorrectly.


So, in this case, the AI didn’t understand the context, but after fixing it, everything worked as intended.

Let’s see how we can use Gemini CLI to improve our workflow. First, let’s ask for any recommendations for improvements to the script.

And, immediately after suggesting the changes, the AI begins implementing the improvements. Let’s follow that.

A few lines of code were added, and it looks pretty clean. Now, let’s shift our focus to improving error handling rather than the scanning functionality.

Let’s run the script.

Errors are caught reliably, and the script executes flawlessly. Once it finishes, it outputs the list of discovered live hosts.

Step #3: Gemini CLI Tools

By typing /tools, we can see what the Gemini CLI allows us to do by default.

But one of the most powerful tools is /init. It analyzes the project and creates a tailored Markdown file.

Basically, the Gemini CLI creates a file with instructions for itself, allowing it to understand the context of what we’re working on.

Each time we run the Gemini CLI, it loads this file and understands the context.

We can close the app, reopen it later, and it will pick up exactly where we left off—without any extra explanation. Everything remains neatly organized.

Summary

By bringing the assistant straight into your command line, you keep the workflow tight, the context local to the files you’re editing, and the interaction essentially instantaneous.

In this article, we examined how the Gemini CLI can boost the effectiveness of writing Python code for cybersecurity, and we highlighted the advantages of using the MCP server along with the built-in tools that Gemini provides by default.

Keep returning, aspiring hackers, as we continue to explore MCP and the application of artificial intelligence in cybersecurity.

The post Using Artificial Intelligence (AI) in Cybersecurity: Accelerate Your Python Development with Terminal‑Integrated AI first appeared on Hackers Arise.

Using Artificial Intelligence (AI) in Cybersecurity: Creating a Custom MCP Server For Log Analysis

Welcome back, aspiring cyberwarriors!

In our previous article, we examined the architecture of MCP and explained how to get started with it. Hundreds of MCP servers have been built for different services and tasks—some are dedicated to cybersecurity activities such as reverse engineering or reconnaissance. Those servers are impressive, and we’ll explore several of them in depth here at Hackers‑Arise.

However, before we start “playing” with other people’s MCP servers, I believe we should first develop our own. Building a server ourselves lets us see exactly what’s happening under the hood.

For that reason, in this article, we’ll develop an MCP server for analyzing security logs. Let’s get rolling!

Step #1: Fire Up Your Kali

In this tutorial, I will be using the Gemini CLI with MCP on Kali Linux. You can install Gemini using the following command:

kali> sudo npm install -g @google/gemini-cli

Now, we should have a working AI assistant, but it doesn’t yet have access to any of our security tools.

Step #2: Create a Security Operations Directory Structure

Before we start configuring MCP servers, let’s set up a proper directory structure for our security operations. This keeps everything organized and makes it easier to manage permissions and access controls.

Create a dedicated directory for security analysis work in your home directory.

kali> mkdir -p ~/security-ops/{logs,reports,malware-samples,artifacts}

This creates a security-ops directory with subdirectories for logs, analysis reports, malware samples, and other security artifacts.

Let’s also create a directory to store any custom MCP server configurations we build.

kali> mkdir -p ~/security-ops/mcp-servers

For testing purposes, let’s create some sample log files we can analyze. In a real environment, you’d be analyzing actual security logs from your infrastructure.

Firstly, let’s create a sample web application firewall log.

kali> vim ~/security-ops/logs/waf-access.log

This sample log contains various types of suspicious activity, including SQL injection attempts, directory traversal, authentication failures, and XSS attempts. We’ll use this to demonstrate MCP’s log analysis capabilities.

Let’s also create a sample authentication log.

kali> vim ~/security-ops/logs/auth.log

Now we have some realistic security data to work with. Let’s configure MCP to give Gemini controlled access to these files.

Step #3: Configure MCP Server for Filesystem Access

The MCP configuration file lives at ~/.gemini/settings.json. This JSON file tells Gemini CLI which MCP servers are available and how to connect to them. Let’s create our first MCP server configuration for secure filesystem access.

Check if the .gemini directory exists, and create it if it doesn’t.

kali> mkdir ~/.gemini

Now edit the settings.json file. We’ll start with a basic filesystem MCP server configuration.

{
  "mcpServers": {
    "security-filesystem": {
      "command": "npx",
      "args": [
        "-y",
        "@modelcontextprotocol/server-filesystem",
        "/home/YOURUSERNAME/security-ops"
      ],
      "env": {}
    }
  }
}

This sets up a filesystem MCP server with restricted access to only our security-ops directory. First, it uses npx to run the MCP server, which means it will automatically download and execute the official filesystem server from the Model Context Protocol project. The -y flag tells npx to proceed without prompting. The server-filesystem package is the official MCP server for file operations. Second, and most critically, we’re explicitly restricting access to only the /home/kali/security-ops directory. The filesystem server will refuse to access any files outside this directory tree, even if Gemini tries to. This is defense in depth, ensuring the AI cannot accidentally or maliciously access sensitive system files.

Now, let’s verify that the MCP configuration is valid and the server can connect. Start Gemini CLI again.

kali> gemini

After running, we can see that 1 MCP server is in use and Gemini is running in the required directory.

Now, use the /mcp command to list configured MCP servers.

/mcp list

You should see output showing the security-filesystem server with a “ready” status. If you see “disconnected” or an error, double-check your settings.json file for typos and check if you have nodejs, npm, and npx installed.

Now let’s test the filesystem access by asking Gemini to read one of our security logs. This demonstrates that MCP is working and Gemini can access files through the configured server.

> Read the file ~/security-ops/logs/waf-access.log and tell me what security events are present

Pretty clear summary. The key thing to understand here is that Gemini itself doesn’t have direct filesystem access. It’s asking the MCP server to read the file on its behalf, and the MCP server enforces the security policy we configured.

Step #4: Analyzing Security Logs with Gemini and MCP

Now that we have MCP configured for filesystem access, let’s do some real security analysis. Let’s start by asking Gemini to perform a comprehensive analysis of the web application firewall log we created earlier.

> Analyze ~/security-ops/logs/waf-access.log for attack patterns. For each suspicious event, identify the attack type, the source IP, and assess the severity. Then provide recommendations for defensive measures.

The analysis might take a few seconds as Gemini processes the entire log file. When it completes, you’ll get a detailed breakdown of the security events along with recommendations like implementing rate limiting for the attacking IPs, ensuring your WAF rules are properly configured to block these attack patterns, and investigating whether any of these attacks succeeded.

Now let’s analyze the authentication log to identify potential brute force attacks.

> Read ~/security-ops/logs/auth.log and identify any brute force authentication attempts. Report the attacking IP, number of attempts, timing patterns, and whether the attack was successful.

Let’s do something more advanced. We can ask Gemini to correlate events across multiple log files to identify coordinated attack patterns.

> Compare the events in ~/security-ops/logs/waf-access.log and ~/security-ops/logs/auth.log. Do any IP addresses appear in both logs? If so, describe the attack campaign and create a timeline of events.

The AI generated a formatted timeline of the attack showing the progression from SSH attacks to web application attacks, demonstrating how the attacker switched tactics after the initial approach failed.

Summary

MCP, combined with Gemini’s AI capabilities, serves as a powerful force multiplier. It enables us to automate routine analysis tasks, instantly correlate data from multiple sources, leverage AI for pattern recognition and threat hunting, and retain full transparency and control over the entire process.

In this tutorial, we configured an MCP server for file system access and tested it using sample logs.

Keep returning, aspiring hackers, as we continue to explore MCP and the application of artificial intelligence in cybersecurity.

The post Using Artificial Intelligence (AI) in Cybersecurity: Creating a Custom MCP Server For Log Analysis first appeared on Hackers Arise.

Security Operations Center (SOC):Getting Started with SOC

Welcome back, aspiring cyberwarriors!

In today’s highly targeted environment, a well-designed Security Operations Center (SOC) isn’t just an advantage – it’s essential for a business’s survival. In addition to that, the job market has far more jobs on the blue team than the red team. Getting into a SOC is often touted as one of the more accessible entry points into cybersecurity.

This article will delve into some of the key concepts of SOC.

Step #1: Purpose and Components

The core purpose of a Security Operations Center is to detect, analyze, and respond to cyber threats in real time, thereby protecting an organization’s assets, data, and reputation. To achieve this, a SOC continuously monitors logs, alerts, and telemetry from networks, endpoints, and applications, maintaining constant situational awareness.

Detection involves identifying four key security concerns.

Vulnerabilities are weaknesses in software or operating systems that attackers can exploit beyond their authorized permissions. For example, the SOC might find Windows computers needing patches for published vulnerabilities. While not strictly the SOC’s responsibility, unfixed vulnerabilities impact company-wide security.

Unauthorized activity occurs when attackers use compromised credentials to access company systems. Quick detection is important before damage occurs, using clues like geographic location to identify suspicious logins.

Policy violations happen when users break security rules designed to protect the company and ensure compliance. These violations vary by organization but might include downloading pirated media or transmitting confidential files insecurely.

Intrusions involve unauthorized access to systems and networks, such as attackers exploiting web applications or users getting infected through malicious websites.
Once incidents are detected, the SOC supports the incident response process by minimizing impact and conducting root cause analysis alongside the incident response team.

Step #2: Building a Baseline

Before you can detect threats, you must first understand what “normal” looks like in your environment. This is the foundation upon which all SOC operations are built.

Your baseline should include detailed documentation of:

Network Architecture: Map out all network segments, VLANs, DMZs, and trust boundaries. Understanding how data flows through your network is critical for detecting lateral movement and unauthorized access attempts. Document which systems communicate with each other, what protocols they use, and what ports are typically open.

Normal Traffic Patterns: Establish what typical network traffic looks like during different times of day, days of the week, and during special events like month-end processing or quarterly reporting. This includes bandwidth utilization, connection counts, DNS queries, and external communications.

User Behavior Baselines: Document normal user activities, including login times, typical applications accessed, data transfer volumes, and geographic locations. For example, if your accounting department typically logs in between 8 AM and 6 PM local time, a login at 3 AM should trigger an investigation. Similarly, if a user who normally accesses 5-10 files per day suddenly downloads 5,000 files, that’s a deviation worth investigating.

System Performance Metrics: Establish normal CPU usage, memory consumption, disk I/O, and process execution patterns for critical systems. Cryptocurrency miners, rootkits, and other malware often create performance anomalies that stand out when compared against baselines.

Step #3: The Role of People

Despite increasing automation, human oversight remains essential in SOC operations. Security solutions generate numerous alerts that create significant noise. Without human intervention, teams waste time and resources investigating irrelevant issues.

The SOC team operates through a tiered analyst structure with supporting roles.

Level 1 Analysts serve as first responders, performing basic alert triage to determine if detections are genuinely harmful and reporting findings through proper channels. When detections require deeper investigation, Level 2 Analysts correlate data from multiple sources to conduct thorough analysis. Level 3 Analysts are experienced professionals who proactively hunt for threat indicators and lead incident response activities, including containment, eradication, and recovery of critical severity incidents escalated from lower tiers.

Supporting these analysts are Security Engineers who deploy and configure the security solutions the team relies on. Detection Engineers develop the security rules and logic that enable these solutions to identify harmful activities, though Level 2 and 3 Analysts sometimes handle this responsibility. The SOC Manager oversees team processes, provides operational support, and maintains communication with the organization’s CISO regarding security posture and team efforts.

Step # 4: The Detection-to-Response Pipeline

When a potential security incident is detected, every second counts. Your SOC needs clearly defined processes for triaging, investigating, and responding to alerts.

This pipeline typically follows these stages:

Alert Triage: Not all alerts are created equal. Your SOC analysts must quickly determine which alerts represent genuine threats versus false positives. Implement alert enrichment that automatically adds context—such as asset criticality, user risk scores, and threat intelligence—to help analysts prioritize their work. Use a tiered priority system (P1-Critical, P2-High, P3-Medium, P4-Low) based on potential business impact.

Elastic Security Priority List

Investigation and Analysis: Once an alert is prioritized, analysts must investigate to determine the scope and nature of the incident. This requires access to multiple data sources, forensic tools, and the ability to correlate events across time and systems. Document your investigation procedures for common scenarios (phishing, malware infection, unauthorized access) to ensure consistent and thorough analysis. Every investigation should answer the five Ws: what happened? where it occurred? When did it take place? Why did it happen? And how did it unfold?

Containment and Eradication: When you confirm a security incident, your first priority is containment to prevent further damage. This might involve isolating infected systems, disabling compromised accounts, or blocking malicious network traffic.

Recovery and Remediation: After eradicating the threat, safely restore affected systems to normal operation. This may involve rebuilding compromised systems from clean backups, rotating credentials, patching vulnerabilities, and implementing additional security controls.

Post-Incident Review: Every significant incident should conclude with a lessons-learned session. What went well? What could be improved? Were our playbooks accurate? Did we have the right tools and access? Use these insights to update your procedures, improve your detection capabilities, and refine your security controls.

Step #5: Technology

At a minimum, a functional SOC needs several essential technologies working together:

SIEM Platform: The central nervous system of your SOC that aggregates, correlates, and analyzes security events from across your environment. Popular options include Splunk, for which we offer a dedicated course.

Splunk

Endpoint Detection and Response (EDR): Provides deep visibility into endpoint activities, detects suspicious behavior, and enables remote investigation and response.

Firewall: A firewall functions purely for network security and acts as a barrier between your internal and external networks (such as the Internet). It monitors incoming and outgoing network traffic and filters any unauthorized traffic.

Besides those core platforms, other security solutions such as antivirus, SOAR, and various niche tools each play distinct roles. Each organization selects technology that matches its specific requirements, so no two SOCs are exactly alike.

Summary

A Security Operations Center (SOC) protects organizations from cyber threats. It watches networks, computers, and applications to find problems like security weaknesses, unauthorized access, rule violations, and intrusions.

A good SOC needs three things: understanding what normal activity looks like, having a skilled team with clear roles, and following a structured process to handle threats. The team works in levels – starting with basic alert checking, then deeper investigation, and finally threat response and recovery.

If you want to get a deep understanding of SIEM and SOC workflow, consider our SOC Analyst Lvl 1 course.

The post Security Operations Center (SOC):Getting Started with SOC first appeared on Hackers Arise.

Hacking Artificial Intelligence (AI): Hijacking AI Trust to Spread C2 Instructions

Welcome back, aspiring cyberwarriors!

We’ve come to treat AI assistants like ChatGPT and Copilot as knowledgeable partners. We ask questions, and they provide answers, often with a reassuring sense of authority. We trust them. But what if that very trust is a backdoor for attackers?

This isn’t a theoretical threat. At the DEF CON security conference, offensive security engineer Tobias Diehl delivered a startling presentation revealing how he could “poison the wells” of AI. He demonstrated that attackers don’t need to hack complex systems to spread malicious code and misinformation; they just need to exploit the AI’s blind trust in the internet.

Let’s break down Tobias Diehl’s work and see what lessons we can learn from it.

Step #1: AI’s Foundational Flaw

The core of the vulnerability Tobias discovered is really simple. When a user asks Microsoft Copilot a question about a topic outside its original training data, it doesn’t just guess. It performs a Bing search and treats the top-ranked result as its “source of truth.” It then processes that content and presents it to the user as a definitive answer.


This is a critical flaw. While Bing’s search ranking algorithm has been refined for over a decade, it’s not infallible and can be manipulated. An attacker who can control the top search result for a specific query can effectively control what Copilot tells its users. This simple, direct pipeline from a search engine to an AI’s brain is the foundation of the attack.

Step #2: Proof Of Concept

Tobias leveraged a concept he calls a “data void,” which he describes as a “search‑engine vacuum.” A data void occurs when a search term exists but there is little or no relevant, up‑to‑date content available for it. In such a vacuum, an attacker can more easily create and rank their own content. Moreover, data voids can be deliberately engineered.

Using the proof‑of‑concept from Microsoft’s Zero Day Quest event, we can see how readily our trust can be manipulated. Zero Day Quest invites security researchers to discover and report high‑impact vulnerabilities in Microsoft products. Anticipating a common user query—“Where can I stream Zero Day Quest?”—Tobias began preparing the attack surface. He created a website, https://www.watchzerodayquest.com, containing the following content:

As you can see, the page resembles a typical FAQ, but it includes a malicious PowerShell command. After four weeks, Tobias managed to get the site ranked for this event.

Consequently, a user could receive the following response about Zero Day Quest from Copilot:

At the time of writing, Copilot does not respond that way.

But there are other AI assistants.

And as you can see, some of them easily provide dangerous installation instructions for command‑and‑control (C2) beacons.

Summary

This research shows that AI assistants that trust real‑time search results have a big weakness. Because they automatically trust what a search engine says, attackers can easily exploit them, causing serious damage.

The post Hacking Artificial Intelligence (AI): Hijacking AI Trust to Spread C2 Instructions first appeared on Hackers Arise.

Open Source Intelligence (OSINT): Infrastructure Reconnaissance and Threat Intelligence in Cyberwar with Overpass Turbo

Welcome back, aspiring cyberwarriors!

In previous tutorials, you’ve learned the basics of Overpass Turbo and how to find standard infrastructure like surveillance cameras and WiFi hotspots. Today, we’re diving deep into the advanced features that transform this web platform from a simple mapping tool into a sophisticated intelligence-gathering system.

Let’s explore the unique capabilities of Overpass Turbo!

Step 1: Advanced Query Construction with Regular Expressions

The Query Wizard is great for beginners, but experienced users can take advantage of regular expressions to match multiple tag variations in a single search, eliminating the need for dozens of separate queries.

Consider this scenario: You’re investigating telecommunications infrastructure, but different mappers have tagged cellular towers inconsistently. Some use tower:type=cellular, others use tower:type=communication, and still others use variations with different capitalization or spelling.

Here’s how to catch them all:

[out:json][timeout:60];
{{geocodeArea:Moscow}}->.searchArea;
(
  node[~"^tower:.*"~"cell|communication|telecom",i](area.searchArea);
  way[~"^tower:.*"~"cell|communication|telecom",i](area.searchArea);
  node["man_made"~"mast|tower|antenna",i](area.searchArea);
);
out body;
>;
out skel qt;

What makes this powerful is the [~”^tower:.*”~”cell|communication|telecom”,i] syntax. The first tilde searches for any key starting with “tower:”, while the second searches for values matching our pattern. The i flag makes it case-insensitive. You’ve combined over 10 queries into a single intelligence sweep.

Step 2: Proximity Analysis with the Around Filter

The around filter is perhaps one of Overpass Turbo’s most overlooked advanced features. It lets you spot spatial relationships that reveal operational patterns—like locating every wireless access point within a certain range of sensitive facilities.

Let’s find all WiFi hotspots within 500 meters of government buildings:

[out:json][timeout:60];
{{geocodeArea:Moscow}}->.searchArea;
(
  node["amenity"="public_building"](area.searchArea);
  way["amenity"="public_building"](area.searchArea);
)->.government;
(
  node["amenity"="internet_cafe"](around.government:500);
  node["internet_access"="wlan"](around.government:500);
  node["internet_access:fee"="no"](around.government:500);
)->.targets;
.targets out body;
>;
out skel qt;

This query first collects all government buildings into a set called .government, then searches for WiFi-related infrastructure within 500 meters of any member of that set. The results reveal potential surveillance positions or network infiltration opportunities that traditional searches would never correlate. Besides that, you can chain multiple proximity searches together to create complex spatial intelligence maps.

Step 3: Anomaly Detection

Let’s try to find surveillance cameras with unusual or non-standard operator tags.

[out:json][timeout:60];
{{geocodeArea:Moscow}}->.searchArea;
(
  node["surveillance"="outdoor"](area.searchArea);
  way["surveillance"="outdoor"](area.searchArea);
);
out body;


Legitimate cameras typically have consistent operator naming (e.g., “Gas station”). Cameras with generic operators like “Private” or no operator tag at all may indicate covert surveillance or improperly documented systems.

Step 4: Bulk Data Exfiltration with Custom Export Formats

While the interface displays results on a map, serious intelligence work requires data you can process programmatically. Overpass Turbo supports multiple export formats, like GeoJSON, GPX, KMX, and others.

Let’s search for industrial buildings in Ufa:

[out:json][timeout:120];
{{geocodeArea:Ufa}}->.searchArea;
(
  node["building"="industrial"](area.searchArea);
);
out body;
>;
out skel qt;

After running this query, click Export > Data > Download as GeoJSON. Now you have machine-readable data.

For truly large datasets, you can use the raw Overpass API.

Step 5: Advanced Filtering with Conditional Logic

Overpass QL includes conditional evaluators that let you filter results based on computed properties. For example, find ways (roads, buildings) that are suspiciously small or large:

[out:json][timeout:60];
way["building"]({{bbox}})(if:length()>500)(if:count_tags()>5);
out geom;

This finds buildings whose perimeter exceeds 500 meters AND have more than 5 tags. Such structures are typically industrial complexes, schools, or shopping centers.

Summary

A powerful weapon is often hiding in plain sight, disguised as a simple web application, in this case. By leveraging regular expressions, proximity analysis, condition logic, and data export techniques, you can extract intelligence that remains invisible to most users. Combined with external data sources and proper operational security, these techniques enable passive reconnaissance at a scale previously only available to nation-state actors.

The post Open Source Intelligence (OSINT): Infrastructure Reconnaissance and Threat Intelligence in Cyberwar with Overpass Turbo first appeared on Hackers Arise.

Artificial Intelligence (AI) in Cybersecurity: Getting Started with Model Context Protocol (MCP)

Welcome back, aspiring cyberwarriors!

In the past few years, large language models have moved from isolated research curiosities to practical assistants that answer questions, draft code, and even automate routine tasks. Yet those models remain fundamentally starved for live, organization-specific data because they operate on static training datasets.

The Model Context Protocol (MCP) was created to bridge that gap. By establishing a universal, standards-based interface between an AI model and the myriad external resources a modern enterprise maintains, like filesystems, databases, web services, and tools, MCP turns a text generator into a “context-aware” agent.

Let’s explore what MCP is and how we can start using it for hacking and cybersecurity!

Step #1: What is Model Context Protocol?

Model Context Protocol is an open standard introduced by Anthropic that enables AI assistants to connect to systems where data lives, including content repositories, business tools, and development environments. The protocol functions like a universal port for AI applications, providing a standardized way to connect AI systems to external data sources, tools, and workflows.

Before MCP existed, developers faced what’s known as the “N×M integration problem.” If you wanted to connect five different AI assistants to ten different data sources, you’d theoretically need fifty different custom integrations. Each connection required its own implementation, its own authentication mechanism, and its own maintenance overhead. For cybersecurity teams trying to integrate AI into their workflows, this created an impossible maintenance burden.


MCP replaces these fragmented integrations with a single protocol that works across any AI system and any data source. Instead of writing custom code for each connection, security professionals can now use pre-built MCP servers or create their own following a standard specification.

Step #2: How MCP Actually Works

The MCP architecture consists of three main components working together: hosts, clients, and servers.

The host is the application you interact with directly, such as Claude Desktop, an integrated development environment, or a security operations platform. The host manages the overall user experience and coordinates communication between different components.

Within each host lives one or more clients. These clients establish one-to-one connections with MCP servers, handling the actual protocol communication and managing data flow. The client is responsible for sending requests to servers and processing their responses. For security applications, this means the client handles tool invocations, resource requests, and security context.

The servers are where the real action happens. MCP servers are specialized programs that expose specific functionality through the protocol framework. A server might provide access to vulnerability scanning tools, network reconnaissance capabilities, or forensic analysis functions.

MCP supports multiple transport mechanisms, including standard input/output for local processes and HTTP with Server-Sent Events for remote communication.

The protocol defines several message types that flow between clients and servers.

Requests expect a response and might ask a server to perform a network scan or retrieve vulnerability data. Results are successful responses containing the requested information. Errors indicate when something went wrong, which is critical for security operations where failed scans or timeouts need to be handled gracefully. Notifications are one-way messages that don’t expect responses, useful for logging events or updating status.

Step #3: Setting Up Docker Desktop

To get started, we need to install Docker Desktop. But if you’re looking for a bit more privacy and have powerful hardware, you can download LM Studio and run local LLMs.

To install Docker Desktop in Kali Linux, run the following command:

kali> sudo apt install docker-desktop -y

But if you’re running Kali in a virtualization app like VirtualBox, you might see the following error:

To fix that, you need to turn on “Nested VT-x/AMD-V”.

After restarting VM and Docker Desktop, you should see the following window.

After accepting, you’ll be ready to explore MCP features.

Now, we just need to choose the MCP server to run.

At the time of writing, there are 266 different MCP servers. Let’s explore one of them, for example, the DuckDuckGo MCP server that provides web search capabilities.

Clicking Tools reveals the utilities the MCP server offers and explains each purpose in plain language. In this case, there are just two tools:

Step #4: Setting Up Gemini-CLI

By clicking on Clients in Docker Desktop, we can see which LLMs can interact with Docker Desktop.

For this example, I’ll be using Gemini CLI. But let’s install it first:

kali> sudo apt install gemini-cli

Let’s start it:

kali> gemini-cli

To get started, we need to authenticate. If you’d like to change the login option, click the up‑ or down‑arrow buttons. After authorization, you’ll be able to communicate with the general Gemini AI.

Now, we’re ready to connect the client.

After restarting, we can see a message about the connection to MCP.

By clicking Ctrl+T, we can see the MCP settings:

Let’s try to search by DuckDuckGo MCP in Gemini-CLI.

After accepting the execution, we got the response.

By scrolling through the results, we can see in the end a summary from Gemini AI from a search done by the DuckDuckGo search engine.

Summary

I hope this brief article introduced you to this fundamentally innovative technique. In this piece, we covered the basics of MCP architecture, set up our own environment, and ran an MCP server. I used a very simple example, but as you saw, there are more than 250 MCP servers in the catalog, and even more on platforms like GitHub, so the potential for cybersecurity and IT in general is huge.

Keep returning as we continue to explore MCP and eventually develop our own MCP server for hacking purposes.

The post Artificial Intelligence (AI) in Cybersecurity: Getting Started with Model Context Protocol (MCP) first appeared on Hackers Arise.

Open Source Intelligence (OSINT): Using Overpass Turbo for Strategic CyberWar Intelligence Gathering

Welcome back, aspiring cyberwarriors!

In the first article, we explored how to use Overpass Turbo reveals some valuable assets. In this article, we’ll explore how this web-based OpenStreetMap mining tool can be weaponized for reconnaissance operations, infrastructure mapping, and target identification in cyber warfare scenarios.

Let’s get rolling!

Why Overpass Turbo Matters in Cyber Warfare

In modern cyber operations, the traditional boundaries between digital and physical security have dissolved. What makes Overpass Turbo particularly valuable for offensive opperations is that all this data is crowdsourced and publicly available, making your reconnaissance activities completely legal and untraceable. You’re simply querying public databases—no network scanning, no unauthorized access, no digital footprint on your target’s systems.

Step #1: Critical Infrastructure Mapping

Critical infrastructure can act both as a target and as a weapon in a cyber‑war. Let’s see how we can identify assets such as power towers, transmission lines, and similar facilities.

To accomplish this, we can run the following query:

[out:json][timeout:90];
(
  nwr[power~"^(line|cable|tower|pole|substation|transformer|generator|plant)$"]({{bbox}});
  node[man_made=street_cabinet][street_cabinet=power]({{bbox}});
  way[building][power~"^(substation|transformer|plant)$"]({{bbox}});
);
out tags geom;


This query fetches power infrastructure elements from OpenStreetMap in a given area ({{bbox}}), including related street cabinets and buildings.

The results can reveal single points of failure and interconnected dependencies within the power infrastructure.

Step #2: Cloud/Hosting Provider Facilities

Another key component of today’s internet ecosystem is hosting and cloud providers. This time, let’s locate those providers in Moscow by defining a precise bounding box using the southwest corner at 55.4899 ° N, 37.3193 ° E and the northeast corner at 56.0097 ° N, 37.9457 ° E.

[out:json][timeout:25];
(
  nw["operator"~"Yandex|Selectel"](55.4899,37.3193,56.0097,37.9457);
);
out body;
>;
out skel qt;

Where,

out body – returns the primary data along with all associated tags.

>; – fetches every node referenced by the selected ways, giving you the complete geometry.

out skel qt; – outputs only the skeletal structure (node IDs and coordinates), which speeds up processing and reduces the response size.

Offensive value of this data lies in pinpointing cloud regions to launch geographically tailored attacks, extracting location‑specific customer data, orchestrating physical‑access missions, or compromising supply‑chain deliveries.

Step #3: Cellular Network Infrastructure

Mobile networks are essential for civilian communications and are increasingly embedded in IoT and industrial control systems. Yet, identifying IMSI catchers and cell towers is straightforward using the query below.

[out:json][timeout:25];
{{geocodeArea:Moscow}}->.searchArea;

(
  node["man_made"="mast"]["tower:type"="communication"](area.searchArea);
  node["man_made"="antenna"]["communication:mobile_phone"="yes"](area.searchArea);
  node["tower:type"="cellular"](area.searchArea);
  way["tower:type"="cellular"](area.searchArea);
  node["man_made"="base_station"](area.searchArea);
);
out body;
out geom;

Step #4: Microwave & Satellite Communication

With just a few lines of Overpass QL queries, you can retrieve data on microwave and satellite communication structures anywhere in the world.

[out:json][timeout:25];
{{geocodeArea:Moscow}}->.searchArea;

(
  node["man_made"="mast"]["tower:type"="microwave"](area.searchArea);
  node["communication:microwave"="yes"](area.searchArea);
  
  node["man_made"="satellite_dish"](area.searchArea);
  node["man_made"="dish"](area.searchArea);
  way["man_made"="dish"](area.searchArea);
  
  node["communication:satellite"="yes"](area.searchArea);
);
out body;
out geom;

Summary

The strength of Overpass Turbo isn’t its modest interface—it’s the depth and breadth of intelligence you can extract from OpenStreetMap’s crowdsourced data. Whenever OSM holds the information you need, Overpass turns it into clean, visual, and structured results. Equally important, the tool is completely free, legal, and requires no prior registration.

Given the massive amount of crowd‑contributed data in OSM, Overpass Turbo is an invaluable resource for any OSINT investigator.

The post Open Source Intelligence (OSINT): Using Overpass Turbo for Strategic CyberWar Intelligence Gathering first appeared on Hackers Arise.

Google Dorks for Reconnaissance: How to Find Exposed Obsidian Vaults

Welcome back, aspiring cyberwarriors!

In the world of OSINT Google dorking remains one of the most popular reconnaissance techniques. While many hackers focus on finding vulnerable web applications or exposed directories, there’s a goldmine of sensitive information hiding in plain sight: personal knowledge bases and note-taking systems that users inadvertently expose to the internet.

Today, I’m going to share a particularly interesting Google dork I discovered: inurl:publish-01.obsidian.md. This simple query get access to published Obsidian vaults—personal wikis, research notes, project documentation, and sometimes, highly sensitive information that users never intended to be publicly accessible.

What is Obsidian and Obsidian Publish?


Obsidian is a knowledge management and note-taking application that stores data in plain Markdown files. It’s become incredibly popular among researchers, developers, writers, and professionals who want to build interconnected “second brains” of information.


Obsidian Publish is the official hosting service that allows users to publish their personal notes online as wikis, knowledge bases, or digital gardens. It’s designed to make sharing knowledge easy—perhaps too easy for users who don’t fully understand the implications.

The Architecture

When you publish your Obsidian vault using Obsidian Publish, your notes are hosted on Obsidian’s infrastructure at domains like:

  • publish.obsidian.md/[vault-name]
  • publish-01.obsidian.md/[path]

The publish-01, etc., subdomains are part of Obsidian’s CDN infrastructure for load balancing. The critical security issue is that many users don’t realize that published notes are publicly accessible by default and indexed by search engines.

Performing Reconnaissance

Let’s get started with a basic Google dork: inurl:publish.obsidian.md


Most of the URLs will lead to intentional Wiki pages. So, let’s try to be more specific and search for source code and configuration: inurl:publish-01.obsidian.md ("config" | "configuration" | "settings")

As a result, we found a note from an aspiring hacker.


Now, let’s search for some login data: inurl:publish-01.obsidian.md ("username" | "login" | "authentication")

Here we can see relatively up‑to‑date property data. No login credentials are found; the result appears simply because the word “login” is displayed in the top‑right corner of the page.

By experimenting with different search queries, you can retrieve various types of sensitive information—for example, browser‑history data.

Summary

To succeed in cybersecurity, you need to think outside the box; otherwise, you’ll only get crumbs. But before you can truly think outside the box, you must first master what’s inside it. Feel free to check out the Hackers‑Arise Cybersecurity Starter Bundle.

The post Google Dorks for Reconnaissance: How to Find Exposed Obsidian Vaults first appeared on Hackers Arise.

❌