Digital Forensics: Investigating Conti Ransomware with Splunk
Welcome back, aspiring digital forensic investigators!
The world of cybercrime continues to grow every year, and attackers constantly discover new opportunities and techniques to break into systems. One of the most dangerous and well-organized ransomware groups in recent years was Conti. Conti operated almost like a real company, with dedicated teams for developing malware, gaining network access, negotiating with victims, and even providing “customer support” for payments. The group targeted governments, hospitals, corporations, and many other high-value organizations. Their attacks included encrypting systems, stealing data, and demanding extremely high ransom payments.
For investigators, Conti became an important case study because their operations left behind a wide range of forensic evidence from custom malware samples to fast lateral movement and large-scale data theft. Even though the group officially shut down after their internal chats were leaked, many of their operators, tools, and techniques continued to appear in later attacks. This means Conti’s methods still influence modern ransomware operations which makes it a valid topic for forensic investigators.
Today, we are going to look at a ransomware incident involving Conti malware and analyze it with Splunk to understand how an Exchange server was compromised and what actions the attackers performed once inside.
Splunk
Splunk is a platform that collects and analyzes large amounts of machine data, such as logs from servers, applications, and security tools. It turns this raw information into searchable events, graphs, and alerts that help teams understand what is happening across their systems in real time. Companies mainly use Splunk for monitoring, security operations, and troubleshooting issues. Digital forensics teams also use Splunk because it can quickly pull together evidence from many sources and show patterns that would take much longer to find manually.
Time Filter
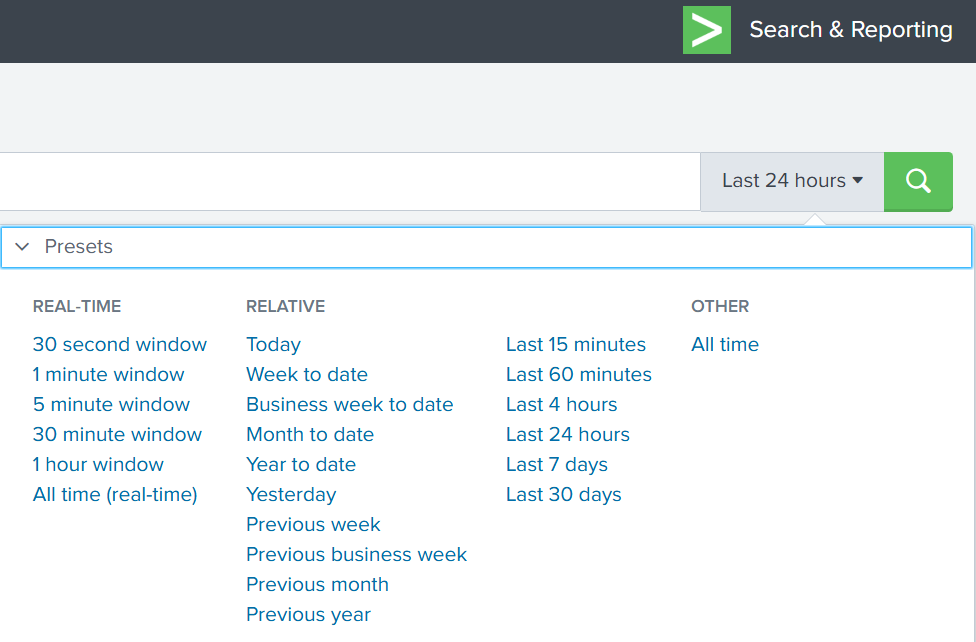
Splunk’s default time range is the last 24 hours. However, when investigating incidents, especially ransomware, you often need a much wider view. Changing the filter to “All time” helps reveal older activity that may be connected to the attack. Many ransomware operations begin weeks or even months before the final encryption stage. Keep in mind that searching all logs can be heavy on large environments, but in our case this wider view is necessary.
Index
An index in Splunk is like a storage folder where logs of a particular type are placed. For example, Windows Event Logs may go into one index, firewall logs into another, and antivirus logs into a third. When you specify an index in your search, you tell Splunk exactly where to look. But since we are investigating a ransomware incident, we want to search through every available index:
index=*
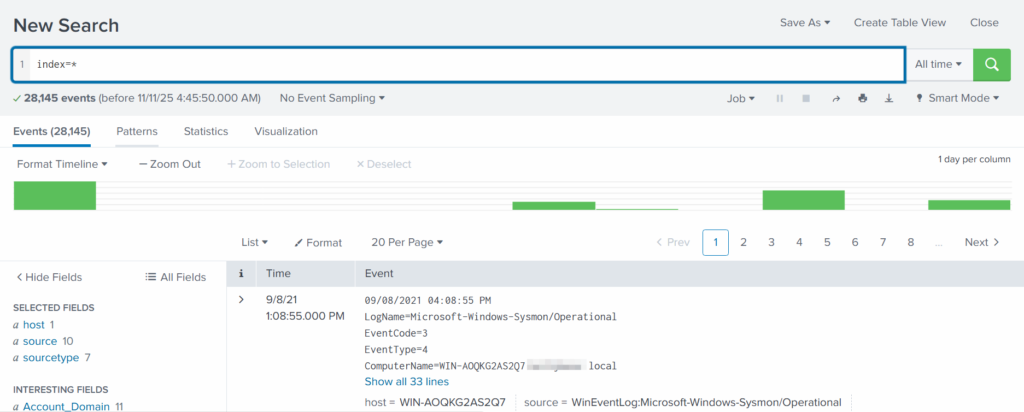
This ensures that nothing is missed and all logs across the environment are visible to us.
Fields
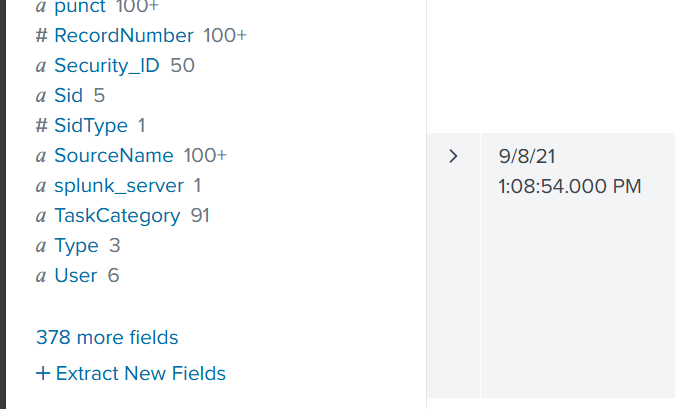
Fields are pieces of information extracted from each log entry, such as usernames, IP addresses, timestamps, file paths, and event IDs. They make your searches much more precise, allowing you to filter events with expressions like src_ip=10.0.0.5 or user=Administrator. In our case, we want to focus on executable files and that is the “Image”. If you don’t see it in the left pane, click “More fields” and add it.
Once you’ve added it, click Image in the left pane to see the top 10 results.
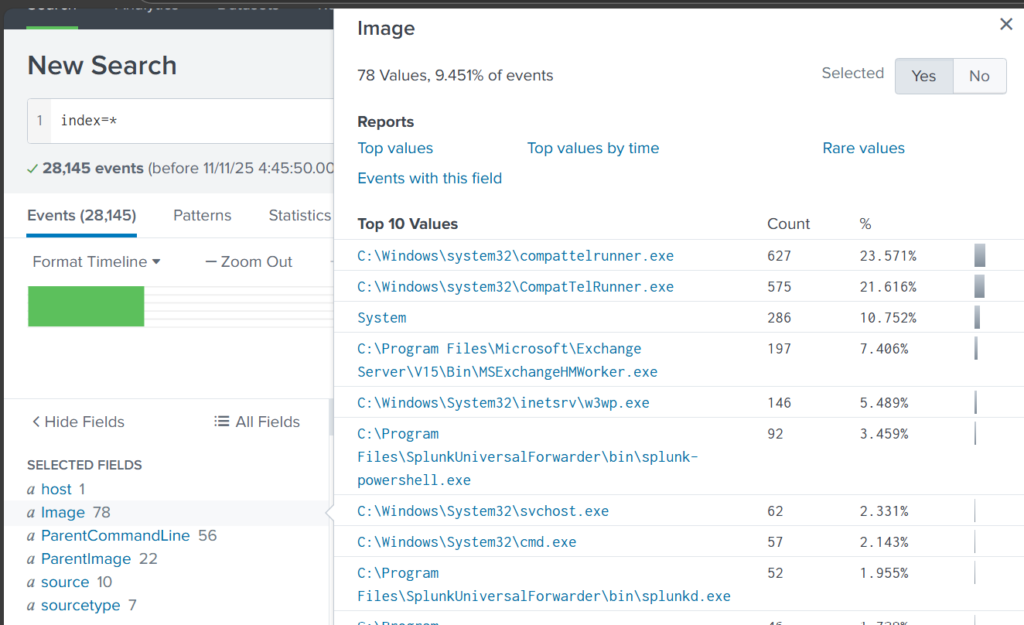
These results are definitely not enough to begin our analysis. We can expand the list using top:
index=* | top limit=100 Image
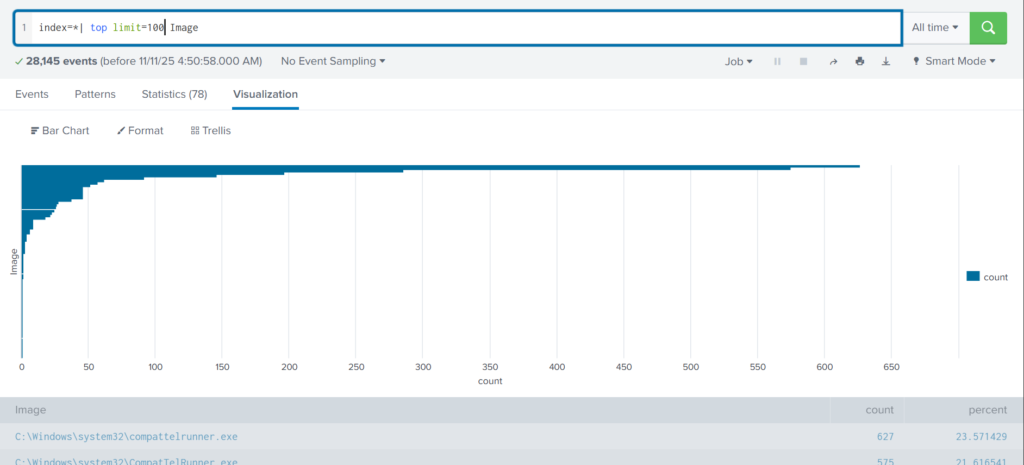
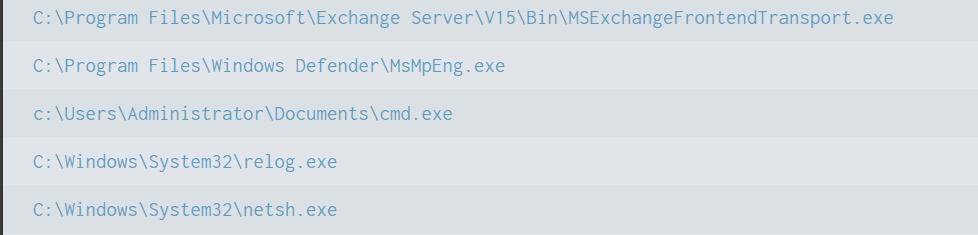
Here the cmd.exe process running in the Administrator’s user folder looks very suspicious. This is unusual, so we should check it closely. We also see commands like net1, net, whoami, and rundll32.

In one of our articles, we learned that net1 works like net and can be used to avoid detection in PowerShell if the security rules only look for net.exe. The rundll32 command is often used to run DLL files and is commonly misused by attackers. It seems the attacker is using normal system tools to explore the system. It also might be that the hackers used rundll32 to stay in the system longer.
At this point, we can already say the attacker performed reconnaissance and could have used rundll32 for persistence or further execution.
Hashes
Next, let’s investigate the suspicious cmd.exe more closely. Its location alone is a red flag, but checking its hashes will confirm whether it is malicious.
index=* Image="C:\\Users\\Administrator\\Documents\\cmd.exe" | table Image, Hashes
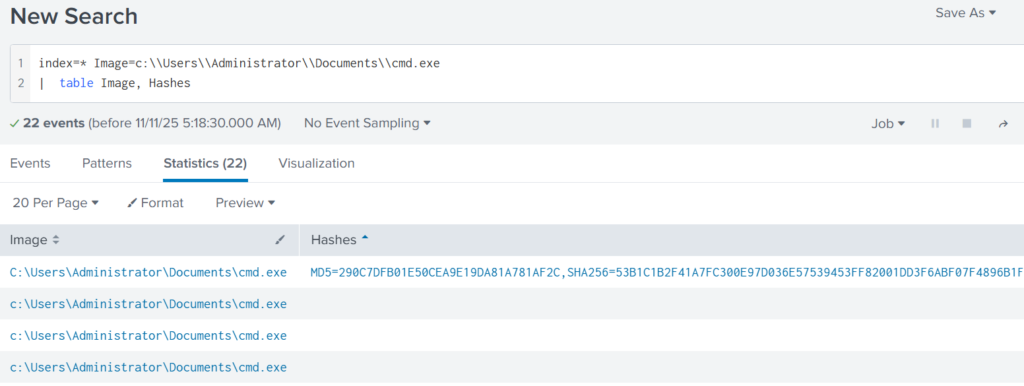
Copy one of the hashes and search for it on VirusTotal.
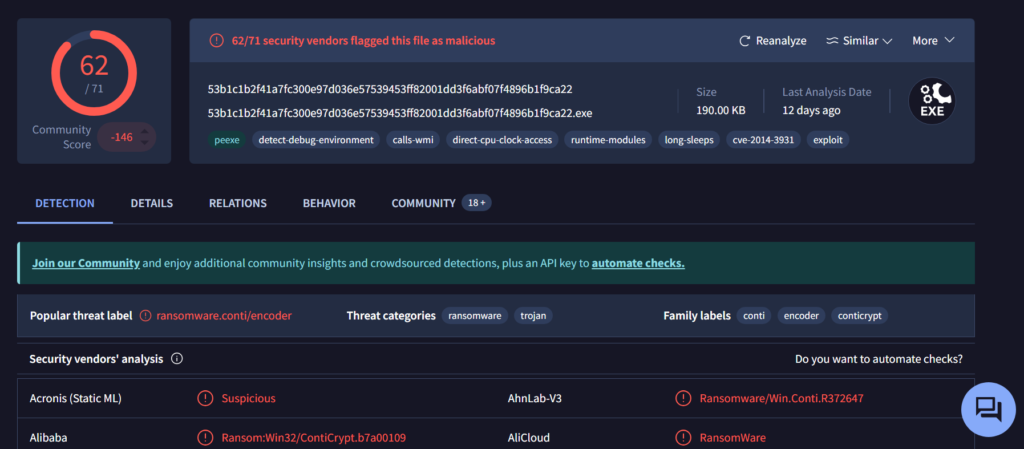
The results confirm that this file belongs to a Conti ransomware sample. VirusTotal provides helpful behavior analysis and detection labels that support our findings. When investigating, give it a closer look to understand exactly what happened to your system.
Net1
Now let’s see what the attacker did using the net1 command:
index=* Image=*net1.exe
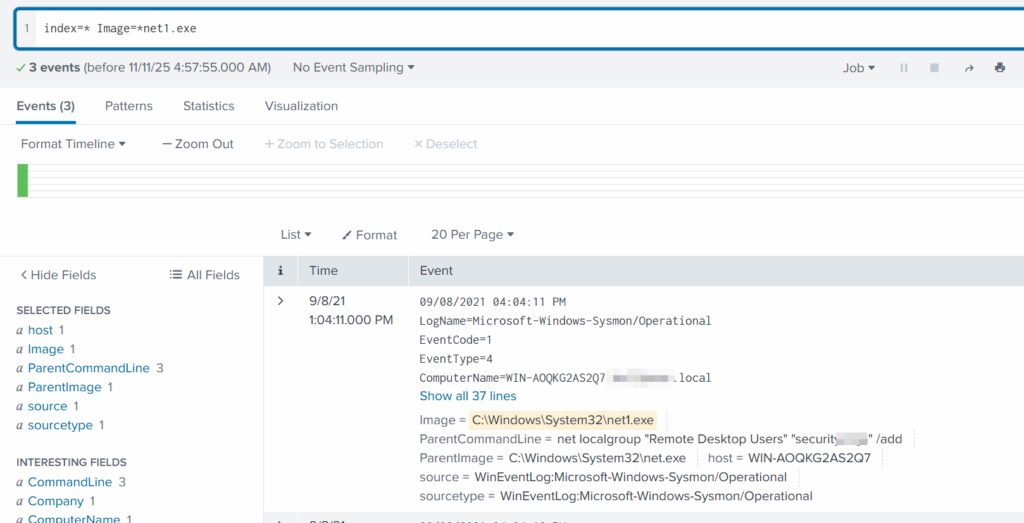
The logs show that a new user was added to the Remote Desktop Users local group. This allows the attacker to log in through RDP on that specific machine. Since this is a local group modification, it affects only that workstation.
In MITRE ATT&CK, this action falls under Persistence. The hackers made sure they could connect to the host even if other credentials were lost. Also, they may have wanted to log in via GUI to explore the system more comfortably.
TargetFilename
This field usually appears in file-related logs, especially Windows Security Logs, Sysmon events, or EDR data. It tells you the exact file path and file name that a process interacted with. This can include files being created, modified, deleted, or accessed. That means we can find files that malware interacted with. If you can’t find the TargetFilename field in the left pane, just add it.
Run:
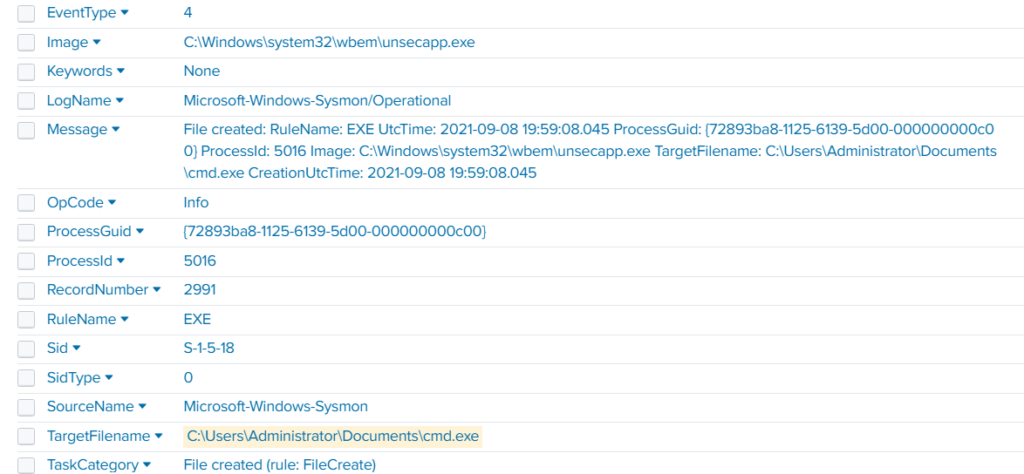
index=* Image="C:\\Users\\Administrator\\Documents\\cmd.exe"
Then select TargetFilename
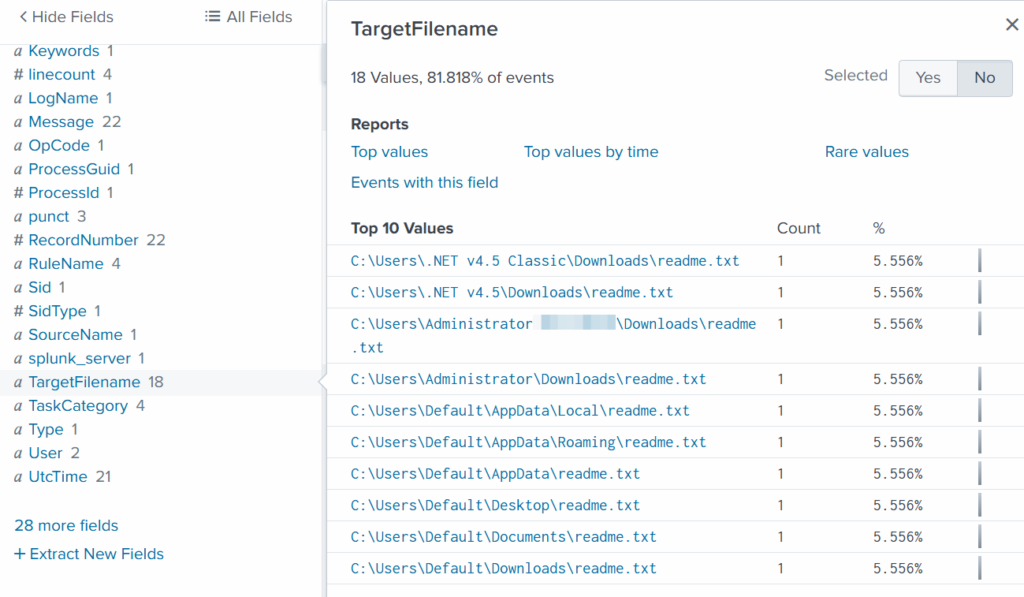
We see that the ransomware created many “readme” files with a ransom note. This is common behavior for ransomware to spread notes everywhere. Encrypting data is the last step in attacks like this. We need to figure out how the attacker got into the system and gained high privileges.
Before we do that, let’s see how the ransomware was propagated across the domain:
index=* TargetFileName=*cmd.exe
While unsecapp.exe is a legitimate Microsoft binary. When it appears, it usually means something triggered WMI activity, because Windows launches unsecapp.exe only when a program needs to receive asynchronous WMI callbacks. In our case the ransomware was spread using WMI and infected other hosts where the port was open. This is a very common approach.
Sysmon Events
Sysmon Event ID 8 indicates a CreateRemoteThread event, meaning one process created a thread inside another. This is a strong sign of malicious activity because attackers use it for process injection, privilege escalation, or credential theft.
List these events:
index=* EventCode=8
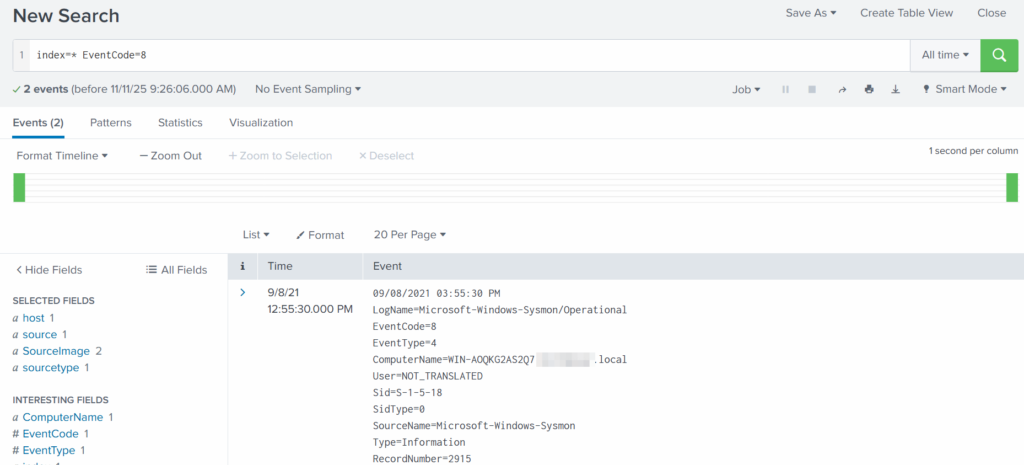
Expanding the log reveals another executable interacting with lsass.exe. This is extremely suspicious because lsass.exe stores credentials. Attacking LSASS is a common step for harvesting passwords or hashes.
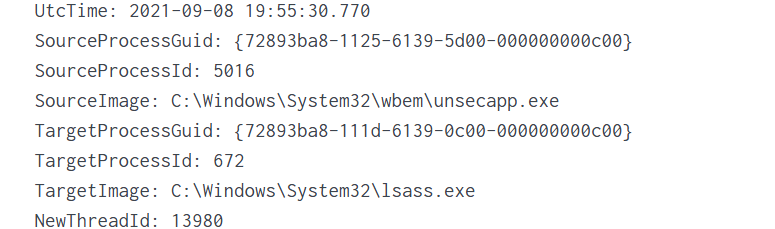
Another instance of unsecapp.exe being used. It’s not normal to see it accessing lsass.exe. Our best guess here would be that something used WMI, and that WMI activity triggered code running inside unsecapp.exe that ended up touching LSASS. The goal behind it could be to dump LSASS every now and then until the domain admin credentials are found. If the domain admins are not in the Protected Users group, their credentials are stored in the memory of the machine they access. If that machine is compromised, the whole domain is compromised as well.
Exchange Server Compromise
Exchange servers are a popular target for attackers. Over the years, they have suffered from multiple critical vulnerabilities. They also hold high privileges in the domain, making them valuable entry points. In this case, the hackers used the ProxyShell vulnerability chain. The exploit abused the mailbox export function to write a malicious .aspx file (a web shell) to any folder that Exchange can access. Instead of a harmless mailbox export, Exchange unknowingly writes a web shell directly into the FrontEnd web directory. From there, the attacker can execute system commands, upload tools, and create accounts with high privileges.
To find the malicious .aspx file in our logs we should query this:
index=* source=*sysmon* *aspx
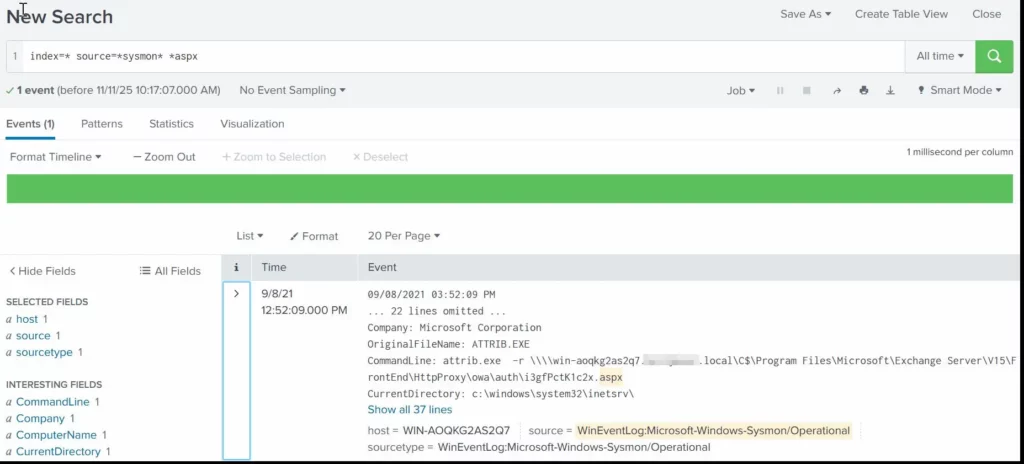
We can clearly see that the web shell was placed where Exchange has web-accessible permissions. This webshell was the access point.
Timeline
The attack began when the intruder exploited the ProxyShell vulnerabilities on the Exchange server. By abusing the mailbox export feature, they forced Exchange to write a malicious .aspx web shell into a web-accessible directory. This web shell became their entry point and allowed them to run commands directly on the server with high privileges. After gaining access, the attacker carried out quiet reconnaissance using built-in tools such as cmd.exe, net1, whoami and rundll32. Using net1, the attacker added a new user to the Remote Desktop Users group to maintain persistence and guarantee a backup login method. The attacker then spread the ransomware across the network using WMI. The appearance of unsecapp.exe showed that WMI activity was being used to launch the malware on other hosts. Sysmon Event ID 8 logged remote thread creation where the system binary attempts to access lsass.exe. This suggests the attacker tried to dump credentials from memory. This activity points to a mix of WMI abuse and process injection aimed at obtaining higher privileges, especially domain-level credentials.
Finally, once the attacker had moved laterally and prepared the environment, the ransomware (cmd.exe) encrypted systems and began creating ransom note files throughout these systems. This marked the last stage of the operation.
Summary
Ransomware is more than just a virus, it’s a carefully planned attack where attackers move through a network quietly before causing damage. In digital forensics we often face these attacks and investigating them means piecing together how it entered the system, what tools it used, which accounts it compromised, and how it spread. Logs, processes, file changes tell part of the story. By following these traces, we understand the attacker’s methods, see where defenses failed, and learn how to prevent future attacks. It’s like reconstructing a crime scene. Sometimes, we might be lucky enough to shut down their entire infrastructure before they can cause more damage.
If you need forensic assistance, you can hire our team to investigate and mitigate incidents. Additionally, we provide classes on digital forensics for those looking to expand their skills and understanding in this field.