Bitmain Technologies Ltd., the Chinese manufacturer behind most of the world’s Bitcoin mining machines, has been the focus of a federal investigation assessing whether its products pose national security risks, according to Bloomberg reporting.
The inquiry, dubbed “Operation Red Sunset,” led by the Department of Homeland Security, reportedly examined whether the company’s machines could be remotely manipulated for espionage or sabotage of critical US infrastructure.
Bitmain denies these capabilities, but investigators have reportedly tested its equipment at ports and dissected chips and code to assess potential threats.
The company’s hardware has long attracted scrutiny.
A 2017 Bitcoin Magazine report suggested Antminer devices contained code allowing remote shutdown, which Bitmain said was a theft-prevention feature later patched. Similar concerns resurfaced in 2019.
In May 2024, then-President Joe Biden blocked a crypto mining facility near a Wyoming nuclear missile base, citing national security risks linked to foreign-sourced mining equipment. The Committee on Foreign Investment in the United States (CFIUS) said the presence of foreign mining devices near sensitive facilities could facilitate surveillance and espionage.
Bitmain has repeatedly stated it complies with US law and has no ties to the Chinese government. It also denied awareness of “Operation Red Sunset” or any import-related investigations.
The Commerce Department blacklisted Bitmain’s AI affiliate, Sophgo Technologies, in January 2025 over alleged dealings with Huawei, further raising concerns about the company’s ties to Beijing.
Bitmain ties with the Trump family
The investigation intersects with the Trump family’s crypto ventures. Eric and Donald Trump Jr. invested in American Bitcoin, a company that recently acquired 16,000 Bitmain devices for $314 million, paid in Bitcoin, per Bloomberg.
The startup plans to operate 76,000 mining machines across the US and Canada. American Bitcoin insists its operations follow strict security standards and that Bitmain hardware poses no credible risk to the US power grid or national security.
The issue has drawn bipartisan attention. A July 2025 Senate Intelligence Committee report highlighted “disturbing vulnerabilities” in Bitmain devices and warned that facilities using them near power plants or military installations present “an unacceptable risk.”
GOP Representative Zach Nunn also requested CFIUS review specialized chips in foreign mining hardware to assess broader policy implications.
As the US continues to monitor foreign crypto technology, the case underscores the tension between rapidly expanding digital asset industries and national security concerns, especially when high-profile political figures are involved.
15% of all ransomware victims whose data was published on threat actors’ data leak sites (DLSs) were victims of Qilin.
More than 254,000 users were targeted by miners.
Ransomware
Quarterly trends and highlights
Law enforcement success
The UK’s National Crime Agency (NCA) arrested the first suspect in connection with a ransomware attack that caused disruptions at numerous European airports in September 2025. Details of the arrest have not been published as the investigation remains ongoing. According to security researcher Kevin Beaumont, the attack employed the HardBit ransomware, which he described as primitive and lacking its own data leak site.
The U.S. Department of Justice filed charges against the administrator of the LockerGoga, MegaCortex and Nefilim ransomware gangs. His attacks caused millions of dollars in damage, putting him on wanted lists for both the FBI and the European Union.
U.S. authorities seized over $2.8 million in cryptocurrency, $70,000 in cash, and a luxury vehicle from a suspect allegedly involved in distributing the Zeppelin ransomware. The criminal scheme involved data theft, file encryption, and extortion, with numerous organizations worldwide falling victim.
A coordinated international operation conducted by the FBI, Homeland Security Investigations (HSI), the U.S. Internal Revenue Service (IRS), and law enforcement agencies from several other countries successfully dismantled the infrastructure of the BlackSuit ransomware. The operation resulted in the seizure of four servers, nine domains, and $1.09 million in cryptocurrency. The objective of the operation was to destabilize the malware ecosystem and protect critical U.S. infrastructure.
Vulnerabilities and attacks
SSL VPN attacks on SonicWall
Since late July, researchers have recorded a rise in attacks by the Akira threat actor targeting SonicWall firewalls supporting SSL VPN. SonicWall has linked these incidents to the already-patched vulnerability CVE-2024-40766, which allows unauthorized users to gain access to system resources. Attackers exploited the vulnerability to steal credentials, subsequently using them to access devices, even those that had been patched. Furthermore, the attackers were able to bypass multi-factor authentication enabled on the devices. SonicWall urges customers to reset all passwords and update their SonicOS firmware.
Scattered Spider uses social engineering to breach VMware ESXi
The Scattered Spider (UNC3944) group is attacking VMware virtual environments. The attackers contact IT support posing as company employees and request to reset their Active Directory password. Once access to vCenter is obtained, the threat actors enable SSH on the ESXi servers, extract the NTDS.dit database, and, in the final phase of the attack, deploy ransomware to encrypt all virtual machines.
Exploitation of a Microsoft SharePoint vulnerability
In late July, researchers uncovered attacks on SharePoint servers that exploited the ToolShell vulnerability chain. In the course of investigating this campaign, which affected over 140 organizations globally, researchers discovered the 4L4MD4R ransomware based on Mauri870 code. The malware is written in Go and packed using the UPX compressor. It demands a ransom of 0.005 BTC.
The application of AI in ransomware development
A UK-based threat actor used Claude to create and launch a ransomware-as-a-service (RaaS) platform. The AI was responsible for writing the code, which included advanced features such as anti-EDR techniques, encryption using ChaCha20 and RSA algorithms, shadow copy deletion, and network file encryption.
Anthropic noted that the attacker was almost entirely dependent on Claude, as they lacked the necessary technical knowledge to provide technical support to their own clients. The threat actor sold the completed malware kits on the dark web for $400–$1,200.
Researchers also discovered a new ransomware strain, dubbed PromptLock, that utilizes an LLM directly during attacks. The malware is written in Go. It uses hardcoded prompts to dynamically generate Lua scripts for data theft and encryption across Windows, macOS and Linux systems. For encryption, it employs the SPECK-128 algorithm, which is rarely used by ransomware groups.
Subsequently, scientists from the NYU Tandon School of Engineering traced back the likely origins of PromptLock to their own educational project, Ransomware 3.0, which they detailed in a prior publication.
The most prolific groups
This section highlights the most prolific ransomware gangs by number of victims added to each group’s DLS. As in the previous quarter, Qilin leads by this metric. Its share grew by 1.89 percentage points (p.p.) to reach 14.96%. The Clop ransomware showed reduced activity, while the share of Akira (10.02%) slightly increased. The INC Ransom group, active since 2023, rose to third place with 8.15%.
Number of each group’s victims according to its DLS as a percentage of all groups’ victims published on all the DLSs under review during the reporting period (download)
Number of new variants
In the third quarter, Kaspersky solutions detected four new families and 2,259 new ransomware modifications, nearly one-third more than in Q2 2025 and slightly more than in Q3 2024.
Number of new ransomware modifications, Q3 2024 — Q3 2025 (download)
Number of users attacked by ransomware Trojans
During the reporting period, our solutions protected 84,903 unique users from ransomware. Ransomware activity was highest in July, while August proved to be the quietest month.
Number of unique users attacked by ransomware Trojans, Q3 2025 (download)
Attack geography
TOP 10 countries attacked by ransomware Trojans
In the third quarter, Israel had the highest share (1.42%) of attacked users. Most of the ransomware in that country was detected in August via behavioral analysis.
Country/territory*
%**
1
Israel
1.42
2
Libya
0.64
3
Rwanda
0.59
4
South Korea
0.58
5
China
0.51
6
Pakistan
0.47
7
Bangladesh
0.45
8
Iraq
0.44
9
Tajikistan
0.39
10
Ethiopia
0.36
* Excluded are countries and territories with relatively few (under 50,000) Kaspersky users.
** Unique users whose computers were attacked by ransomware Trojans as a percentage of all unique users of Kaspersky products in the country/territory.
* Unique Kaspersky users attacked by the specific ransomware Trojan family as a percentage of all unique users attacked by this type of threat.
Miners
Number of new variants
In Q3 2025, Kaspersky solutions detected 2,863 new modifications of miners.
Number of new miner modifications, Q3 2025 (download)
Number of users attacked by miners
During the third quarter, we detected attacks using miner programs on the computers of 254,414 unique Kaspersky users worldwide.
Number of unique users attacked by miners, Q3 2025 (download)
Attack geography
TOP 10 countries and territories attacked by miners
Country/territory*
%**
1
Senegal
3.52
2
Mali
1.50
3
Afghanistan
1.17
4
Algeria
0.95
5
Kazakhstan
0.93
6
Tanzania
0.92
7
Dominican Republic
0.86
8
Ethiopia
0.77
9
Portugal
0.75
10
Belarus
0.75
* Excluded are countries and territories with relatively few (under 50,000) Kaspersky users.
** Unique users whose computers were attacked by miners as a percentage of all unique users of Kaspersky products in the country/territory.
Attacks on macOS
In April, researchers at Iru (formerly Kandji) reported the discovery of a new spyware family, PasivRobber. We observed the development of this family throughout the third quarter. Its new modifications introduced additional executable modules that were absent in previous versions. Furthermore, the attackers began employing obfuscation techniques in an attempt to hinder sample detection.
In July, we reported on a cryptostealer distributed through fake extensions for the Cursor AI development environment, which is based on Visual Studio Code. At that time, the malicious JavaScript (JS) script downloaded a payload in the form of the ScreenConnect remote access utility. This utility was then used to download cryptocurrency-stealing VBS scripts onto the victim’s device. Later, researcher Michael Bocanegra reported on new fake VS Code extensions that also executed malicious JS code. This time, the code downloaded a malicious macOS payload: a Rust-based loader. This loader then delivered a backdoor to the victim’s device, presumably also aimed at cryptocurrency theft. The backdoor supported the loading of additional modules to collect data about the victim’s machine. The Rust downloader was analyzed in detail by researchers at Iru.
In September, researchers at Jamf reported the discovery of a previously unknown version of the modular backdoor ChillyHell, first described in 2023. Notably, the Trojan’s executable files were signed with a valid developer certificate at the time of discovery.
The new sample had been available on Dropbox since 2021. In addition to its backdoor functionality, it also contains a module responsible for bruteforcing passwords of existing system users.
By the end of the third quarter, researchers at Microsoft reported new versions of the XCSSET spyware, which targets developers and spreads through infected Xcode projects. These new versions incorporated additional modules for data theft and system persistence.
TOP 20 threats to macOS
Unique users* who encountered this malware as a percentage of all attacked users of Kaspersky security solutions for macOS (download)
* Data for the previous quarter may differ slightly from previously published data due to some verdicts being retrospectively revised.
The PasivRobber spyware continues to increase its activity, with its modifications occupying the top spots in the list of the most widespread macOS malware varieties. Other highly active threats include Amos Trojans, which steal passwords and cryptocurrency wallet data, and various adware. The Backdoor.OSX.Agent.l family, which took thirteenth place, represents a variation on the well-known open-source malware, Mettle.
Geography of threats to macOS
TOP 10 countries and territories by share of attacked users
Country/territory
%* Q2 2025
%* Q3 2025
Mainland China
2.50
1.70
Italy
0.74
0.85
France
1.08
0.83
Spain
0.86
0.81
Brazil
0.70
0.68
The Netherlands
0.41
0.68
Mexico
0.76
0.65
Hong Kong
0.84
0.62
United Kingdom
0.71
0.58
India
0.76
0.56
IoT threat statistics
This section presents statistics on attacks targeting Kaspersky IoT honeypots. The geographic data on attack sources is based on the IP addresses of attacking devices.
In Q3 2025, there was a slight increase in the share of devices attacking Kaspersky honeypots via the SSH protocol.
Distribution of attacked services by number of unique IP addresses of attacking devices (download)
Conversely, the share of attacks using the SSH protocol slightly decreased.
Distribution of attackers’ sessions in Kaspersky honeypots (download)
TOP 10 threats delivered to IoT devices
Share of each threat delivered to an infected device as a result of a successful attack, out of the total number of threats delivered (download)
In the third quarter, the shares of the NyaDrop and Mirai.b botnets significantly decreased in the overall volume of IoT threats. Conversely, the activity of several other members of the Mirai family, as well as the Gafgyt botnet, increased. As is typical, various Mirai variants occupy the majority of the list of the most widespread malware strains.
Attacks on IoT honeypots
Germany and the United States continue to lead in the distribution of attacks via the SSH protocol. The share of attacks originating from Panama and Iran also saw a slight increase.
Country/territory
Q2 2025
Q3 2025
Germany
24.58%
13.72%
United States
10.81%
13.57%
Panama
1.05%
7.81%
Iran
1.50%
7.04%
Seychelles
6.54%
6.69%
South Africa
2.28%
5.50%
The Netherlands
3.53%
3.94%
Vietnam
3.00%
3.52%
India
2.89%
3.47%
Russian Federation
8.45%
3.29%
The largest number of attacks via the Telnet protocol were carried out from China, as is typically the case. Devices located in India reduced their activity, whereas the share of attacks from Indonesia increased.
Country/territory
Q2 2025
Q3 2025
China
47.02%
57.10%
Indonesia
5.54%
9.48%
India
28.08%
8.66%
Russian Federation
4.85%
7.44%
Pakistan
3.58%
6.66%
Nigeria
1.66%
3.25%
Vietnam
0.55%
1.32%
Seychelles
0.58%
0.93%
Ukraine
0.51%
0.73%
Sweden
0.39%
0.72%
Attacks via web resources
The statistics in this section are based on detection verdicts by Web Anti-Virus, which protects users when suspicious objects are downloaded from malicious or infected web pages. These malicious pages are purposefully created by cybercriminals. Websites that host user-generated content, such as message boards, as well as compromised legitimate sites, can become infected.
TOP 10 countries that served as sources of web-based attacks
This section gives the geographical distribution of sources of online attacks (such as web pages redirecting to exploits, sites hosting exploits and other malware, and botnet C2 centers) blocked by Kaspersky products. One or more web-based attacks could originate from each unique host.
To determine the geographic source of web attacks, we matched the domain name with the real IP address where the domain is hosted, then identified the geographic location of that IP address (GeoIP).
In the third quarter of 2025, Kaspersky solutions blocked 389,755,481 attacks from internet resources worldwide. Web Anti-Virus was triggered by 51,886,619 unique URLs.
Countries and territories where users faced the greatest risk of online infection
To assess the risk of malware infection via the internet for users’ computers in different countries and territories, we calculated the share of Kaspersky users in each location on whose computers Web Anti-Virus was triggered during the reporting period. The resulting data provides an indication of the aggressiveness of the environment in which computers operate in different countries and territories.
This ranked list includes only attacks by malicious objects classified as Malware. Our calculations leave out Web Anti-Virus detections of potentially dangerous or unwanted programs, such as RiskTool or adware.
Country/territory*
%**
1
Panama
11.24
2
Bangladesh
8.40
3
Tajikistan
7.96
4
Venezuela
7.83
5
Serbia
7.74
6
Sri Lanka
7.57
7
North Macedonia
7.39
8
Nepal
7.23
9
Albania
7.04
10
Qatar
6.91
11
Malawi
6.90
12
Algeria
6.74
13
Egypt
6.73
14
Bosnia and Herzegovina
6.59
15
Tunisia
6.54
16
Belgium
6.51
17
Kuwait
6.49
18
Turkey
6.41
19
Belarus
6.40
20
Bulgaria
6.36
* Excluded are countries and territories with relatively few (under 10,000) Kaspersky users.
** Unique users targeted by web-based Malware attacks as a percentage of all unique users of Kaspersky products in the country/territory.
On average, over the course of the quarter, 4.88% of devices globally were subjected to at least one web-based Malware attack.
Local threats
Statistics on local infections of user computers are an important indicator. They include objects that penetrated the target computer by infecting files or removable media, or initially made their way onto the computer in non-open form. Examples of the latter are programs in complex installers and encrypted files.
Data in this section is based on analyzing statistics produced by anti-virus scans of files on the hard drive at the moment they were created or accessed, and the results of scanning removable storage media: flash drives, camera memory cards, phones, and external drives. The statistics are based on detection verdicts from the on-access scan (OAS) and on-demand scan (ODS) modules of File Anti-Virus.
In the third quarter of 2025, our File Anti-Virus recorded 21,356,075 malicious and potentially unwanted objects.
Countries and territories where users faced the highest risk of local infection
For each country and territory, we calculated the percentage of Kaspersky users on whose computers File Anti-Virus was triggered during the reporting period. This statistic reflects the level of personal computer infection in different countries and territories around the world.
Note that this ranked list includes only attacks by malicious objects classified as Malware. Our calculations leave out File Anti-Virus detections of potentially dangerous or unwanted programs, such as RiskTool or adware.
Country/territory*
%**
1
Turkmenistan
45.69
2
Yemen
33.19
3
Afghanistan
32.56
4
Tajikistan
31.06
5
Cuba
30.13
6
Uzbekistan
29.08
7
Syria
25.61
8
Bangladesh
24.69
9
China
22.77
10
Vietnam
22.63
11
Cameroon
22.53
12
Belarus
21.98
13
Tanzania
21.80
14
Niger
21.70
15
Mali
21.29
16
Iraq
20.77
17
Nicaragua
20.75
18
Algeria
20.51
19
Congo
20.50
20
Venezuela
20.48
* Excluded are countries and territories with relatively few (under 10,000) Kaspersky users.
** Unique users on whose computers local Malware threats were blocked, as a percentage of all unique users of Kaspersky products in the country/territory.
On average worldwide, local Malware threats were detected at least once on 12.36% of computers during the third quarter.
Shares of TeraWulf (NASDAQ: WULF) jumped more than 25% Tuesday morning after the company announced a pivot to AI.
TeraWulf, one of the largest publicly traded bitcoin miners, is accelerating its shift into artificial intelligence infrastructure through a new joint venture with AI cloud provider Fluidstack.
The companies plan to build 168 megawatts (MW) of high-performance computing capacity at TeraWulf’s Abernathy, Texas, campus under a 25-year hosting agreement valued at roughly $9.5 billion in contracted revenue.
TeraWulf will hold a 51% stake in the venture and retain exclusive rights to participate in Fluidstack’s next ~168 MW project on similar terms. Construction is expected to be completed in the second half of 2026, with the total project costing $8 million to $10 million per MW, the company announced.
To support project financing, Google has committed to back about $1.3 billion of Fluidstack’s long-term lease obligations, improving the credit profile of the joint venture’s debt structure.
No equity issuance or warrants were included as part of the deal.
The announcement expands TeraWulf’s contracted high-performance compute pipeline to more than 510 MW and supports an updated growth strategy targeting 250 MW to 500 MW of new contracted capacity annually.
The company, best known for its bitcoin mining operations, has increasingly leaned into AI-focused data center development amid a market shift toward GPU-based compute demand.
“Securing more than 510 MW of critical IT load in the past 10 months provides a direct proof-point of our growth strategy,” CEO Paul Prager said.
Alongside the expansion, TeraWulf reported preliminary third-quarter revenue of $48 million to $52 million — up roughly 84% from a year earlier — and adjusted EBITDA of $15 million to $19 million.
Bitcoin miners are pivoting to AI
Leading Bitcoin mining companies are switching over to AI on top of their mining efforts. Firms like Marathon Digital, Riot Platforms, and CleanSpark are seeing strong stock gains but are also pivoting toward Artificial Intelligence and High-Performance Computing (HPC), leveraging their large-scale energy and data infrastructure.
This transition positions miners as emerging technology players beyond cryptocurrency, attracting investor interest.
Other companies, including Core Scientific, Bitdeer, and Hut 8, are following suit — Bitcoin miners are becoming key contributors to the AI-driven digital economy while maintaining exposure to Bitcoin.
According to their website, TeraWulf is a U.S.-based digital asset technology company that owns and operates sustainable data centers for high-performance computing (HPC) and bitcoin mining.
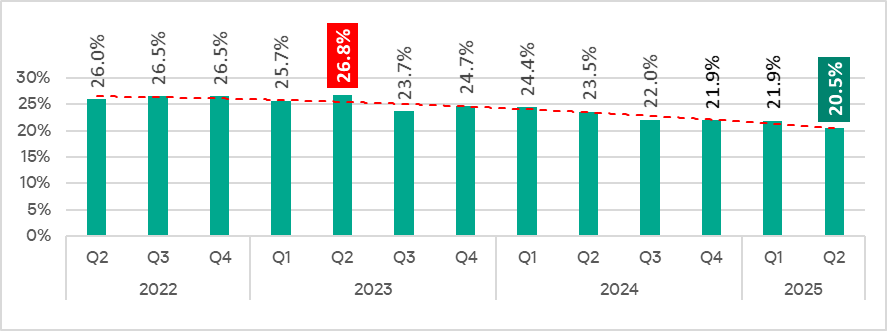
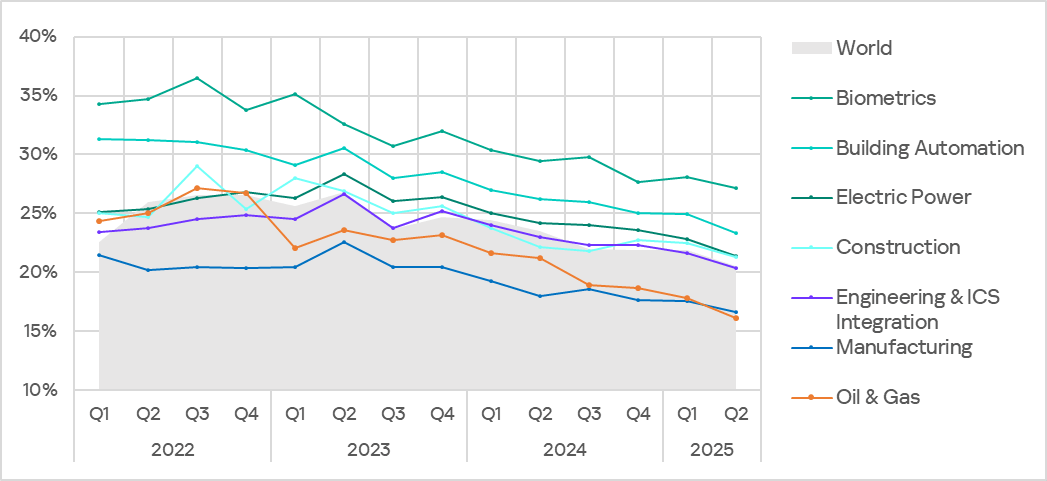
In Q2 2025, the percentage of ICS computers on which malicious objects were blocked decreased by 1.4 pp from the previous quarter to 20.5%.
Percentage of ICS computers on which malicious objects were blocked, Q2 2022–Q2 2025
Compared to Q2 2024, the rate decreased by 3.0 pp.
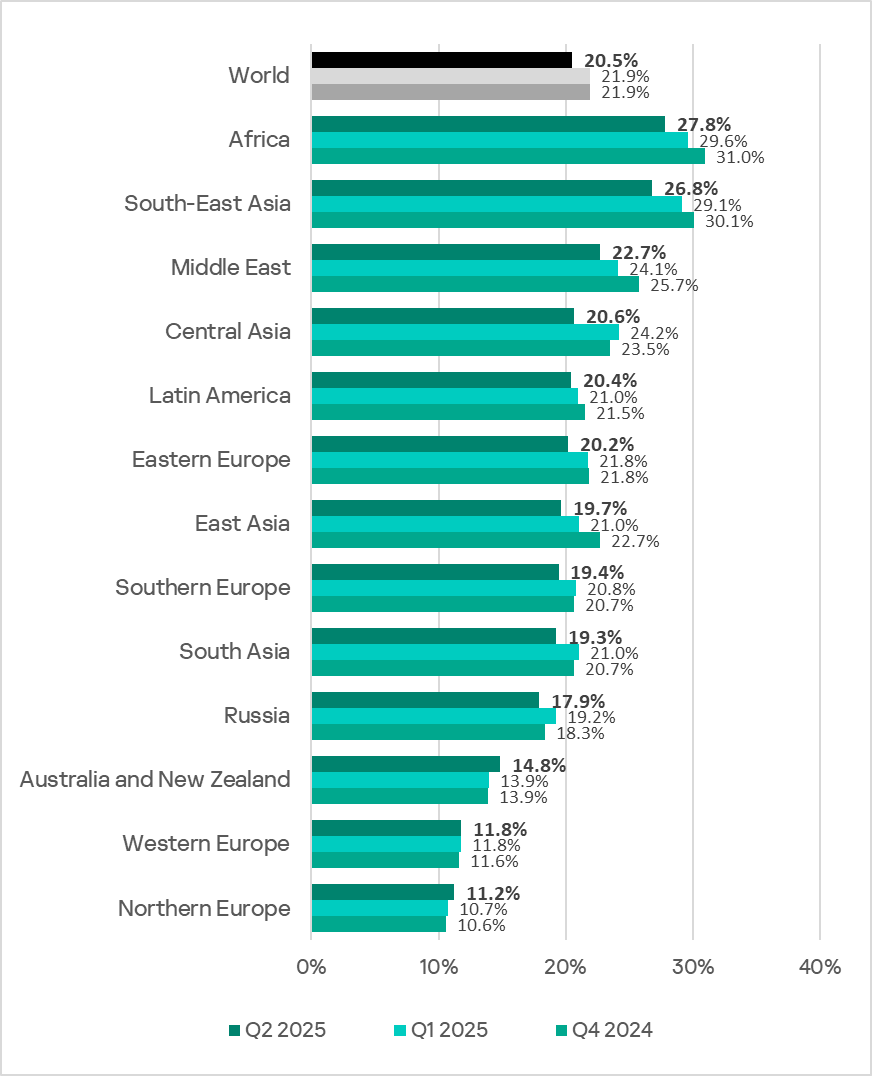
Regionally, the percentage of ICS computers on which malicious objects were blocked ranged from 11.2% in Northern Europe to 27.8% in Africa.
Regions ranked by percentage of ICS computers on which malicious objects were blocked
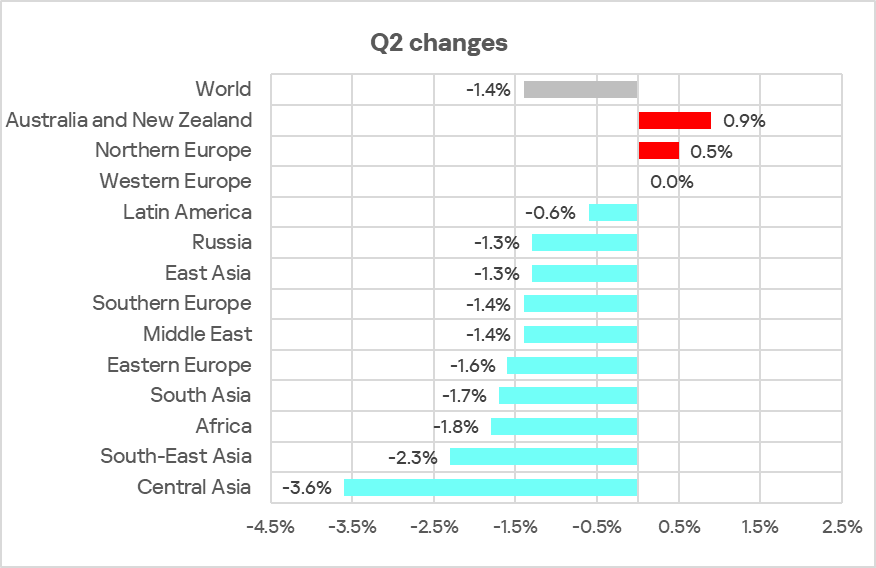
In most of the regions surveyed in this report, the figures decreased from the previous quarter. They increased only in Australia and New Zealand, as well as Northern Europe.
Changes in percentage of ICS computers on which malicious objects were blocked, Q2 2025
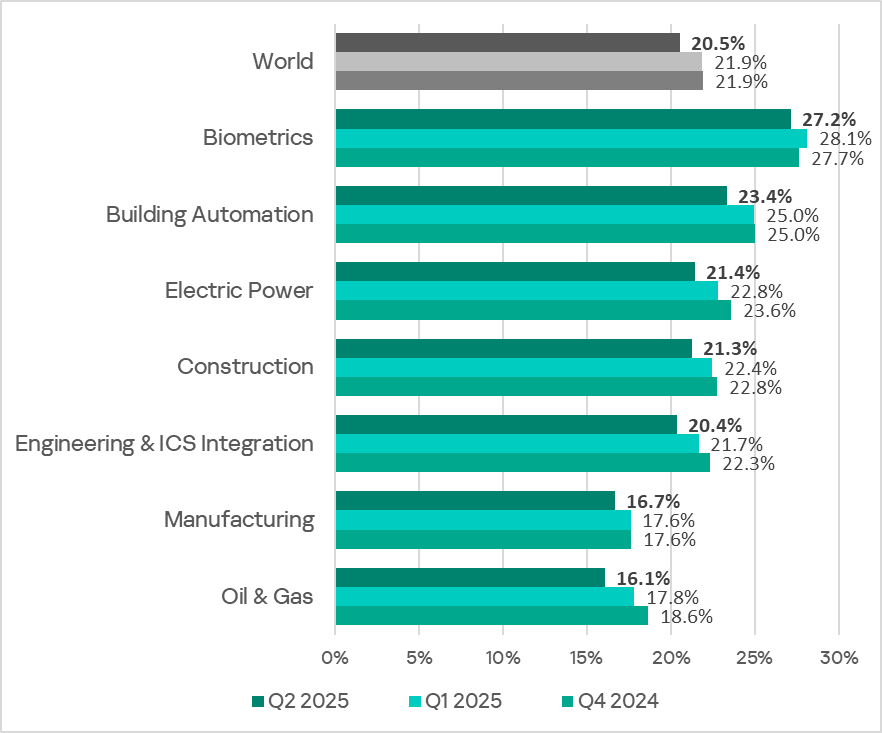
Selected industries
The biometrics sector led the ranking of the industries and OT infrastructures surveyed in this report in terms of the percentage of ICS computers on which malicious objects were blocked.
Ranking of industries and OT infrastructures by percentage of ICS computers on which malicious objects were blocked
In Q2 2025, the percentage of ICS computers on which malicious objects were blocked decreased across all industries.
Percentage of ICS computers on which malicious objects were blocked in selected industries
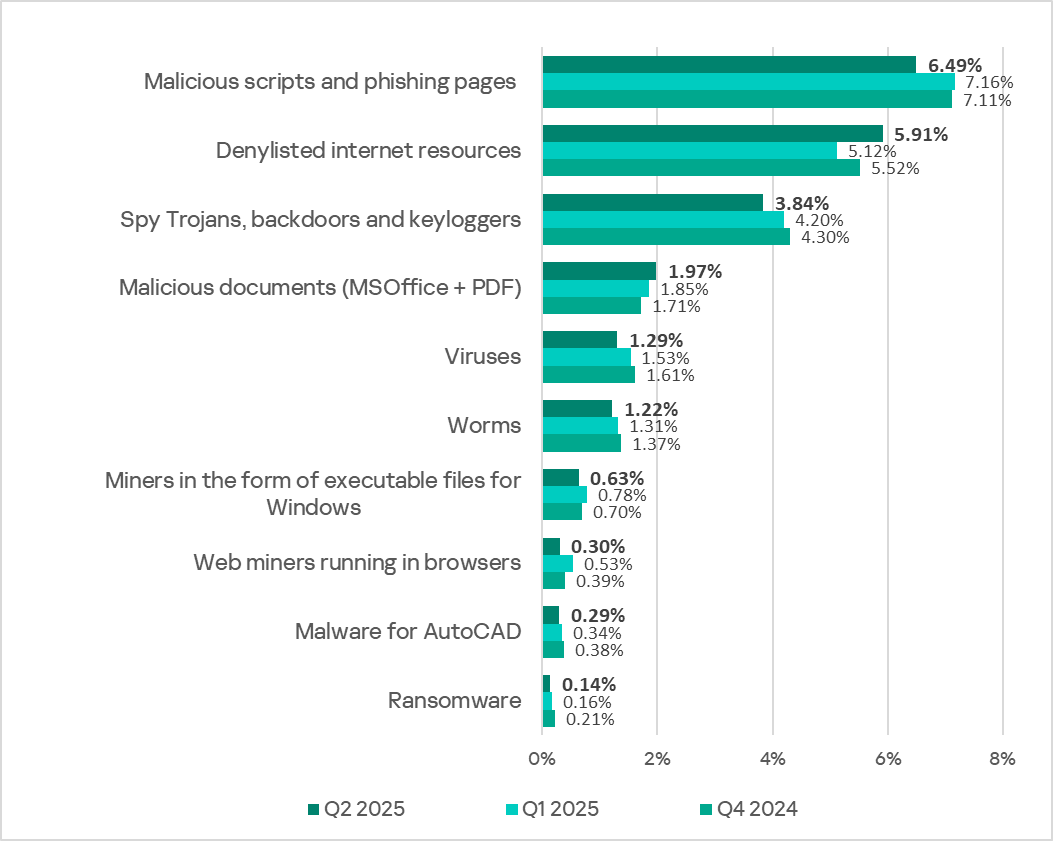
Diversity of detected malicious objects
In Q2 2025, Kaspersky security solutions blocked malware from 10,408 different malware families from various categories on industrial automation systems.
Percentage of ICS computers on which the activity of malicious objects from various categories was blocked
The only increases were in the percentages of ICS computers on which denylisted internet resources (1.2 times more than in the previous quarter) and malicious documents (1.1 times more) were blocked.
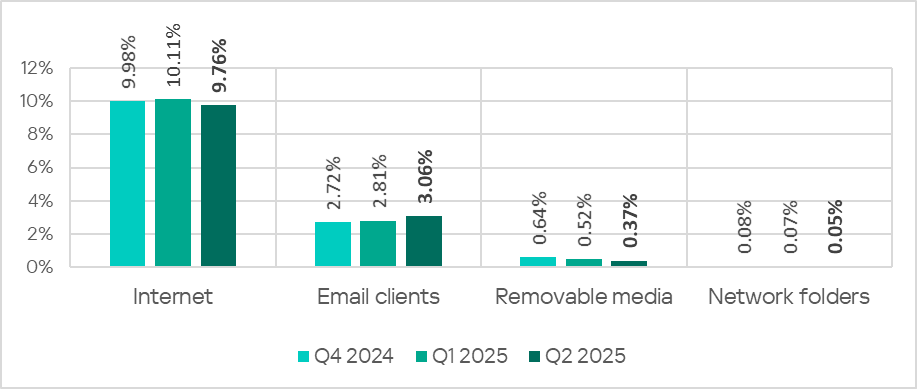
Main threat sources
Depending on the threat detection and blocking scenario, it is not always possible to reliably identify the source. The circumstantial evidence for a specific source can be the blocked threat’s type (category).
The internet (visiting malicious or compromised internet resources; malicious content distributed via messengers; cloud data storage and processing services and CDNs), email clients (phishing emails), and removable storage devices remain the primary sources of threats to computers in an organization’s technology infrastructure.
In Q2 2025, the percentage of ICS computers on which threats from email clients were blocked continued to increase. The main categories of threats from email clients blocked on ICS computers are malicious documents, spyware, malicious scripts and phishing pages. The indicator increased in all regions except Russia. By contrast, the global average for other threat sources decreased. Moreover, the rates reached their lowest levels since Q2 2022.
Percentage of ICS computers on which malicious objects from various sources were blocked
The same computer can be attacked by several categories of malware from the same source during a quarter. That computer is counted when calculating the percentage of attacked computers for each threat category, but is only counted once for the threat source (we count unique attacked computers). In addition, it is not always possible to accurately determine the initial infection attempt. Therefore, the total percentage of ICS computers on which various categories of threats from a certain source were blocked exceeds the percentage of threats from the source itself.
The rates for all threat sources varied across the monitored regions.
The percentage of ICS computers on which threats from the internet were blocked ranged from 6.35% in East Asia to 11.88% in Africa
The percentage of ICS computers on which threats from email clients were blocked ranged from 0.80% in Russia to 7.23% in Southern Europe
The percentage of ICS computers on which threats from removable media were blocked ranged from 0.04% in Australia and New Zealand to 1.77% in Africa
The percentage of ICS computers on which threats from network folders were blocked ranged from 0.01% in Northern Europe to 0.25% in East Asia
Threat categories
A typical attack blocked within an OT network is a multi-stage process, where each subsequent step by the attackers is aimed at increasing privileges and gaining access to other systems by exploiting the security problems of industrial enterprises, including technological infrastructures.
It is worth noting that during the attack, intruders often repeat the same steps (TTPs), especially when they use malicious scripts and established communication channels with the management and control infrastructure (C2) to move laterally within the network and advance the attack.
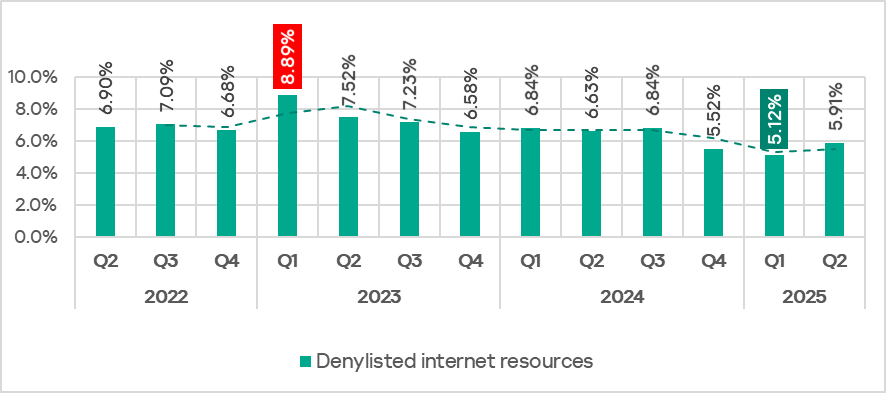
Malicious objects used for initial infection
In Q2 2025, the percentage of ICS computers on which denylisted internet resources were blocked increased to 5.91%.
Percentage of ICS computers on which denylisted internet resources were blocked, Q2 2022–Q2 2025
The percentage of ICS computers on which denylisted internet resources were blocked ranged from 3.28% in East Asia to 6.98% in Africa. Russia and Eastern Europe were also among the top three regions for this indicator. It increased in all regions and this growth is associated with the addition of direct links to malicious code hosted on popular public websites and file-sharing services.
The percentage of ICS computers on which malicious documents were blocked has grown for two consecutive quarters. The rate reached 1.97% (up 0.12 pp) and returned to the level seen in Q3 2024. The percentage increased in all regions except Latin America.
The percentage of ICS computers on which malicious scripts and phishing pages were blocked decreased to 6.49% (down 0.67 pp).
Next-stage malware
Malicious objects used to initially infect computers deliver next-stage malware (spyware, ransomware, and miners) to victims’ computers. As a rule, the higher the percentage of ICS computers on which the initial infection malware is blocked, the higher the percentage for next-stage malware.
In Q2 2025, the percentage of ICS computers on which malicious objects from all categories were blocked decreased. The rates are:
Spyware: 3.84% (down 0.36 pp);
Ransomware: 0.14% (down 0.02 pp);
Miners in the form of executable files for Windows: 0.63% (down 0.15 pp);
Web miners: 0.30% (down 0.23 pp), its lowest level since Q2 2022.
Self-propagating malware
Self-propagating malware (worms and viruses) is a category unto itself. Worms and virus-infected files were originally used for initial infection, but as botnet functionality evolved, they took on next-stage characteristics.
To spread across ICS networks, viruses and worms rely on removable media, network folders, infected files including backups, and network attacks on outdated software such as Radmin2.
In Q2 2025, the percentage of ICS computers on which worms and viruses were blocked decreased to 1.22% (down 0.09 pp) and 1.29% (down 0.24 pp). Both are the lowest values since Q2 2022.
AutoCAD malware
This category of malware can spread in a variety of ways, so it does not belong to a specific group.
In Q2 2025, the percentage of ICS computers on which AutoCAD malware was blocked continued to decrease to 0.29% (down 0.05 pp) and reached its lowest level since Q2 2022.
The statistics in this report are based on detection verdicts returned by Kaspersky products unless otherwise stated. The information was provided by Kaspersky users who consented to sharing statistical data.
The quarter in numbers
In Q2 2025:
Kaspersky solutions blocked more than 471 million attacks originating from various online resources.
Web Anti-Virus detected 77 million unique links.
File Anti-Virus blocked nearly 23 million malicious and potentially unwanted objects.
There were 1,702 new ransomware modifications discovered.
Just under 86,000 users were targeted by ransomware attacks.
Of all ransomware victims whose data was published on threat actors’ data leak sites (DLS), 12% were victims of Qilin.
Almost 280,000 users were targeted by miners.
Ransomware
Quarterly trends and highlights
Law enforcement success
The alleged malicious actor behind the Black Kingdom ransomware attacks was indicted in the U.S. The Yemeni national is accused of infecting about 1,500 computers in the U.S. and other countries through vulnerabilities in Microsoft Exchange. He also stands accused of demanding a ransom of $10,000 in bitcoin, which is the amount victims saw in the ransom note. He is also alleged to be the developer of the Black Kingdom ransomware.
A Ukrainian national was extradited to the U.S. in the Nefilim case. He was arrested in Spain in June 2024 on charges of distributing ransomware and extorting victims. According to the investigation, he had been part of the Nefilim Ransomware-as-a-Service (RaaS) operation since 2021, targeting high-revenue organizations. Nefilim uses the classic double extortion scheme: cybercriminals steal the victim’s data, encrypt it, then threaten to publish it online.
Also arrested was a member of the Ryuk gang, charged with organizing initial access to victims’ networks. The accused was apprehended in Kyiv in April 2025 at the request of the FBI and extradited to the U.S. in June.
A man suspected of being involved in attacks by the DoppelPaymer gang was arrested. In a joint operation by law enforcement in the Netherlands and Moldova, the 45-year-old was arrested in May. He is accused of carrying out attacks against Dutch organizations in 2021. Authorities seized around €84,800 and several devices.
A 39-year-old Iranian national pleaded guilty to participating in RobbinHood ransomware attacks. Among the targets of the attacks, which took place from 2019 to 2024, were U.S. local government agencies, healthcare providers, and non-profit organizations.
Vulnerabilities and attacks
Mass exploitation of a vulnerability in SAP NetWeaver
In May, it was revealed that several ransomware gangs, including BianLian and RansomExx, had been exploiting CVE-2025-31324 in SAP NetWeaver software. Successful exploitation of this vulnerability allows attackers to upload malicious files without authentication, which can lead to a complete system compromise.
Attacks via the SimpleHelp remote administration tool
The DragonForce group compromised an MSP provider, attacking its clients with the help of the SimpleHelp remote administration tool. According to researchers, the attackers exploited a set of vulnerabilities (CVE-2024-57727, CVE-2024-57728, CVE-2024-57726) in the software to launch the DragonForce ransomware on victims’ hosts.
Qilin exploits vulnerabilities in Fortinet
In June, news broke that the Qilin gang (also known as Agenda) was actively exploiting critical vulnerabilities in Fortinet devices to infiltrate corporate networks. The attackers allegedly exploited the vulnerabilities CVE-2024-21762 and CVE-2024-55591 in FortiGate software, which allowed them to bypass authentication and execute malicious code remotely. After gaining access, the cybercriminals encrypted data on systems within the corporate network and demanded a ransom.
Exploitation of a Windows CLFS vulnerability
April saw the detection of attacks that leveraged CVE-2025-29824, a zero-day vulnerability in the Windows Common Log File System (CLFS) driver, a core component of the Windows OS. This vulnerability allows an attacker to elevate privileges on a compromised system. Researchers have linked these incidents to the RansomExx and Play gangs. The attackers targeted companies in North and South America, Europe, and the Middle East.
The most prolific groups
This section highlights the most prolific ransomware gangs by number of victims added to each group’s DLS during the reporting period. In the second quarter, Qilin (12.07%) proved to be the most prolific group. RansomHub, the leader of 2024 and the first quarter of 2025, seems to have gone dormant since April. Clop (10.83%) and Akira (8.53%) swapped places compared to the previous reporting period.
Number of each group’s victims according to its DLS as a percentage of all groups’ victims published on all the DLSs under review during the reporting period (download)
Number of new variants
In the second quarter, Kaspersky solutions detected three new families and 1,702 new ransomware variants. This is significantly fewer than in the previous reporting period. The decrease is linked to the renewed decline in the count of the Trojan-Ransom.Win32.Gen verdicts, following a spike last quarter.
Number of new ransomware modifications, Q2 2024 — Q2 2025 (download)
Number of users attacked by ransomware Trojans
Our solutions protected a total of 85,702 unique users from ransomware during the second quarter.
Number of unique users attacked by ransomware Trojans, Q2 2025 (download)
Geography of attacked users
TOP 10 countries and territories attacked by ransomware Trojans
Country/territory*
%**
1
Libya
0.66
2
China
0.58
3
Rwanda
0.57
4
South Korea
0.51
5
Tajikistan
0.49
6
Bangladesh
0.45
7
Iraq
0.45
8
Pakistan
0.38
9
Brazil
0.38
10
Tanzania
0.35
* Excluded are countries and territories with relatively few (under 50,000) Kaspersky users. ** Unique users whose computers were attacked by ransomware Trojans as a percentage of all unique users of Kaspersky products in the country/territory.
* Unique Kaspersky users attacked by the specific ransomware Trojan family as a percentage of all unique users attacked by this type of threat.
Miners
Number of new variants
In the second quarter of 2025, Kaspersky solutions detected 2,245 new modifications of miners.
Number of new miner modifications, Q2 2025 (download)
Number of users attacked by miners
During the second quarter, we detected attacks using miner programs on the computers of 279,630 unique Kaspersky users worldwide.
Number of unique users attacked by miners, Q2 2025 (download)
Geography of attacked users
TOP 10 countries and territories attacked by miners
Country/territory*
%**
1
Senegal
3.49
2
Panama
1.31
3
Kazakhstan
1.11
4
Ethiopia
1.02
5
Belarus
1.01
6
Mali
0.96
7
Tajikistan
0.88
8
Tanzania
0.80
9
Moldova
0.80
10
Dominican Republic
0.80
* Excluded are countries and territories with relatively few (under 50,000) Kaspersky users. ** Unique users whose computers were attacked by miners as a percentage of all unique users of Kaspersky products in the country/territory.
Attacks on macOS
Among the threats to macOS, one of the biggest discoveries of the second quarter was the PasivRobber family. This spyware consists of a huge number of modules designed to steal data from QQ, WeChat, and other messaging apps and applications that are popular mainly among Chinese users. Its distinctive feature is that the spyware modules get embedded into the target process when the device goes into sleep mode.
Closer to the middle of the quarter, several reports (1, 2, 3) emerged about attackers stepping up their activity, posing as victims’ trusted contacts on Telegram and convincing them to join a Zoom call. During or before the call, the user was persuaded to run a seemingly Zoom-related utility, but which was actually malware. The infection chain led to the download of a backdoor written in the Nim language and bash scripts that stole data from browsers.
TOP 20 threats to macOS
* Unique users who encountered this malware as a percentage of all attacked users of Kaspersky security solutions for macOS (download)
* Data for the previous quarter may differ slightly from previously published data due to some verdicts being retrospectively revised.
A new piece of spyware named PasivRobber, discovered in the second quarter, immediately became the most widespread threat, attacking more users than the fake cleaners and adware typically seen on macOS. Also among the most common threats were the password- and crypto wallet-stealing Trojan Amos and the general detection Trojan.OSX.Agent.gen, which we described in our previous report.
Geography of threats to macOS
TOP 10 countries and territories by share of attacked users
Country/territory
%* Q1 2025
%* Q2 2025
Mainland China
0.73%
2.50%
France
1.52%
1.08%
Hong Kong
1.21%
0.84%
India
0.84%
0.76%
Mexico
0.85%
0.76%
Brazil
0.66%
0.70%
Germany
0.96%
0.69%
Singapore
0.32%
0.63%
Russian Federation
0.50%
0.41%
South Korea
0.10%
0.32%
* Unique users who encountered threats to macOS as a percentage of all unique Kaspersky users in the country/territory.
IoT threat statistics
This section presents statistics on attacks targeting Kaspersky IoT honeypots. The geographic data on attack sources is based on the IP addresses of attacking devices.
In the second quarter of 2025, there was another increase in both the share of attacks using the Telnet protocol and the share of devices connecting to Kaspersky honeypots via this protocol.
Distribution of attacked services by number of unique IP addresses of attacking devices (download)
Distribution of attackers’ sessions in Kaspersky honeypots (download)
TOP 10 threats delivered to IoT devices
Share of each threat delivered to an infected device as a result of a successful attack, out of the total number of threats delivered (download)
In the second quarter, the share of the NyaDrop botnet among threats delivered to our honeypots grew significantly to 30.27%. Conversely, the number of Mirai variants on the list of most common malware decreased, as did the share of most of them. Additionally, after a spike in the first quarter, the share of BitCoinMiner miners dropped to 1.57%.
During the reporting period, the list of most common IoT threats expanded with new families. The activity of the Agent.nx backdoor (4.48%), controlled via P2P through the BitTorrent DHT distributed hash table, grew markedly. Another newcomer to the list, Prometei, is a Linux version of a Windows botnet that was first discovered in December 2020.
Attacks on IoT honeypots
Geographically speaking, the percentage of SSH attacks originating from Germany and the U.S. increased sharply.
Country/territory
Q1 2025
Q2 2025
Germany
1.60%
24.58%
United States
5.52%
10.81%
Russian Federation
9.16%
8.45%
Australia
2.75%
8.01%
Seychelles
1.32%
6.54%
Bulgaria
1.25%
3.66%
The Netherlands
0.63%
3.53%
Vietnam
2.27%
3.00%
Romania
1.34%
2.92%
India
19.16%
2.89%
The share of Telnet attacks originating from China and India remained high, with more than half of all attacks on Kaspersky honeypots coming from these two countries combined.
Country/territory
Q1 2025
Q2 2025
China
39.82%
47.02%
India
30.07%
28.08%
Indonesia
2.25%
5.54%
Russian Federation
5.14%
4.85%
Pakistan
3.99%
3.58%
Brazil
12.03%
2.35%
Nigeria
3.01%
1.66%
Germany
0.09%
1.47%
United States
0.68%
0.75%
Argentina
0.01%
0.70%
Attacks via web resources
The statistics in this section are based on detection verdicts by Web Anti-Virus, which protects users when suspicious objects are downloaded from malicious or infected web pages. Cybercriminals create malicious pages with a goal in mind. Websites that host user-generated content, such as message boards, as well as compromised legitimate sites, can become infected.
Countries that served as sources of web-based attacks: TOP 10
This section gives the geographical distribution of sources of online attacks blocked by Kaspersky products: web pages that redirect to exploits; sites that host exploits and other malware; botnet C2 centers, and the like. Any unique host could be the source of one or more web-based attacks.
To determine the geographic source of web attacks, we matched the domain name with the real IP address where the domain is hosted, then identified the geographic location of that IP address (GeoIP).
In the second quarter of 2025, Kaspersky solutions blocked 471,066,028 attacks from internet resources worldwide. Web Anti-Virus responded to 77,371,384 unique URLs.
Countries and territories where users faced the greatest risk of online infection
To assess the risk of malware infection via the internet for users’ computers in different countries and territories, we calculated the share of Kaspersky users in each location who experienced a Web Anti-Virus alert during the reporting period. The resulting data provides an indication of the aggressiveness of the environment in which computers operate in different countries and territories.
This ranked list includes only attacks by malicious objects classified as Malware. Our calculations leave out Web Anti-Virus detections of potentially dangerous or unwanted programs, such as RiskTool or adware.
Country/territory*
%**
1
Bangladesh
10.85
2
Tajikistan
10.70
3
Belarus
8.96
4
Nepal
8.45
5
Algeria
8.21
6
Moldova
8.16
7
Turkey
8.08
8
Qatar
8.07
9
Albania
8.03
10
Hungary
7.96
11
Tunisia
7.95
12
Portugal
7.93
13
Greece
7.90
14
Serbia
7.84
15
Bulgaria
7.79
16
Sri Lanka
7.72
17
Morocco
7.70
18
Georgia
7.68
19
Peru
7.63
20
North Macedonia
7.58
* Excluded are countries and territories with relatively few (under 10,000) Kaspersky users.
** Unique users targeted by Malware attacks as a percentage of all unique users of Kaspersky products in the country.
On average during the quarter, 6.36% of internet users’ computers worldwide were subjected to at least one Malware web-based attack.
Local threats
Statistics on local infections of user computers are an important indicator. They include objects that penetrated the target computer by infecting files or removable media, or initially made their way onto the computer in non-open form. Examples of the latter are programs in complex installers and encrypted files.
Data in this section is based on analyzing statistics produced by anti-virus scans of files on the hard drive at the moment they were created or accessed, and the results of scanning removable storage media. The statistics are based on detection verdicts from the On-Access Scan (OAS) and On-Demand Scan (ODS) modules of File Anti-Virus. This includes malware found directly on user computers or on connected removable media: flash drives, camera memory cards, phones, and external hard drives.
In the second quarter of 2025, our File Anti-Virus recorded 23,260,596 malicious and potentially unwanted objects.
Countries and territories where users faced the highest risk of local infection
For each country and territory, we calculated the percentage of Kaspersky users whose devices experienced a File Anti-Virus triggering at least once during the reporting period. This statistic reflects the level of personal computer infection in different countries and territories around the world.
Note that this ranked list includes only attacks by malicious objects classified as Malware. Our calculations leave out File Anti-Virus detections of potentially dangerous or unwanted programs, such as RiskTool or adware.
Country/territory*
%**
1
Turkmenistan
45.26
2
Afghanistan
34.95
3
Tajikistan
34.43
4
Yemen
31.95
5
Cuba
30.85
6
Uzbekistan
28.53
7
Syria
26.63
8
Vietnam
24.75
9
South Sudan
24.56
10
Algeria
24.21
11
Bangladesh
23.79
12
Belarus
23.67
13
Gabon
23.37
14
Niger
23.35
15
Cameroon
23.10
16
Tanzania
22.77
17
China
22.74
18
Iraq
22.47
19
Burundi
22.30
20
Congo
21.84
* Excluded are countries and territories with relatively few (under 10,000) Kaspersky users.
** Unique users on whose computers Malware local threats were blocked, as a percentage of all unique users of Kaspersky products in the country/territory.
Overall, 12.94% of user computers globally faced at least one Malware local threat during the second quarter.
The figure for Russia was 14.27%.