Reading view

There are new articles available, click to refresh the page.

The API vulnerabilities nobody talks about: excessive data exposure

TLDR: Excessive Data Exposure (leaking internal data via API responses) is the silent, pervasive threat that is more dangerous than single dramatic flaws like SQL Injection. It amplifies every other API vulnerability (like BOLA) and happens everywhere because developers prioritize speed over explicit data filtering. Fixing it means systematically checking hundreds of endpoints for unneeded PII and sensitive internal data.

After writing about how API security is different from web app security – one thing that sticks is the idea that APIs can have hundreds of small issues that add up over time, rather than one big dramatic vulnerability.

Let me give you a concrete example of what I mean.

SQL injection is serious. Everyone knows that. But what about APIs that just… hand over sensitive data by design?
I’m not saying it’s worse than SQL injection. But it might be more insidious, because it amplifies every other vulnerability you have.

Excessive data exposure: the silent problem

The patterns even encourage this and you can see it everywhere. You have an endpoint like GET /api/users/123 and it returns something like:

{
    user_id: 42,
    name: "Joviane",
    email: "myemail@gmail.com",
    role: "student"
}
… but also returns
{
   internal_user_id: 64, 
   full_address: "Secure Street, 403", 
   ssn_last_4: 1234, 
   phone_number: "73737-7373"  
}

and a lot of stuff that you weren’t planning to expose. The frontend only displays name and email, but the API is returning EVERYTHING from the database.
You might think, “but only authenticated users can call this endpoint, so it’s fine!”. And yeah, that’s true. But what happens when an attacker compromises ANY user account? When a developer accidentally logs the full response? When a browser extension scrapes the data? When the response gets cached somewhere it shouldn’t be? All of that sensitive data is just sitting there, waiting.

The worst part? This compounded with other vulnerabilities. Say you have a BOLA vulnerability where users can access other users’ data by changing an ID. If your API only returned public fields, the impact would be limited. But if it’s leaking PII, internal IDs, or sensitive business data, now that BOLA just became a massive data breach waiting to happen.

Why this happens everywhere

Here’s the thing: this isn’t malicious. Usually, it’s convenient. Returning the whole object is faster than filtering fields. ORMs don’t help either, they return everything by default unless you explicitly use projection or select specific fields. Sometimes teams are trying to be clever and “future-proof” their APIs with fields they might need later. And sometimes? It’s just copy-paste. One endpoint did it this way, so all the others followed.
It makes sense from a development velocity perspective. I’ve done this myself when shipping features under pressure. You write a quick endpoint, test that the frontend displays correctly, and ship it. The API is returning 20 fields but the UI only uses 3? Nobody notices because it works.

The real-world impact

Let me give you a concrete example I’ve seen play out in a code review. An e-learning platform had an endpoint GET /api/courses/{courseId}/students that returned student enrollment data. Makes sense for instructors to see their students, right? But it wasn’t just returning names and progress percentages. It was also returning full email addresses, enrollment dates, payment status, quiz attempt histories with timestamps, discussion forum activity metrics, and even device information from where students were accessing the course.

The frontend displayed student names and their course completion percentage. That’s it. And if you were a student? You could only see your own status in the UI. But any enrolled student could hit that endpoint directly, change the course ID, and pull data from other courses. Someone could iterate through course IDs and build a complete database of who’s taking what courses, payment patterns, learning behaviors, and personal contact information. They didn’t need to break anything or find some clever exploit. The API was just handing it all over.
Luckily, this got caught before production, but as the feature was working fine in the UI and the API, this could’ve easily slipped through and reached production.

And let’s talk about the PII implications here. That leaked student data? We’re talking full names, email addresses, phone numbers, physical addresses, potentially payment information. In a lot of jurisdictions, that’s a GDPR violation or equivalent waiting to happen. Even if the attacker never uses the data maliciously, you’ve just exposed yourself to regulatory fines, mandatory breach notifications, and a PR nightmare. All because the API returned 15 extra fields that nobody actually needed. The business intelligence leak is bad for competitive reasons, sure. But the PII exposure? That’s the kind of thing that gets you on the front page of technical channels for all the wrong reasons.

Another common pattern: pagination endpoints that leak way too much. You call GET /api/students?page=1&limit=100 expecting a list of students, and you get back not just the students, but also their hashed passwords, API keys, internal permissions, last login times, IP addresses… all stuff that should never leave the backend.

The scale problem

SQL injection is one vulnerability. You can find it, fix it and you are done. Excessive data exposure? That’s hundreds of endpoints, each leaking a little data, compounding over time.

Which one is easier for an attacker to exploit at scale? The one that exists in every single endpoint. They don’t need to find a clever injection payload. They just need to iterate through your API and collect everything you’re giving them for free. And because it’s “technically working as designed,” it might not even trigger your security monitoring. No failed requests, no suspicious payloads, just normal API calls returning way too much information.

Other “boring” vulnerabilities that actually matter

There’s Mass Assignment – where a user sends {"name": "Deckan", "isAdmin": true} and the API just… accepts both fields. No validation on what should be updatable. Suddenly, regular users are admins. Or Improper Rate Limiting. No limits on password reset? Account takeover via brute force. No limits on OTP verification? Bye-bye 2FA. No limits on search? Congrats, someone just scraped your entire database.
And the classic: Predictable Resource IDs. /api/invoices/1001, /api/invoices/1002… you see where this is going. An attacker just iterates and collects everything. Classic BOLA.

What makes this hard

These aren’t the sexy zero-day exploits that make headlines. They’re architectural problems baked into dozens or hundreds of endpoints. Finding them means actually understanding what each endpoint does. You need to know what each endpoint returns, what it needs to return, and what’s just extra baggage. Then multiply that by every endpoint in your API. It’s tedious, but it matters.

This is why API security testing is tricky. You’re not hunting for one big vulnerability. You’re checking every single endpoint for these patterns. Data leaking where it shouldn’t, auth checks that are missing, rate limits that don’t exist. All these problems are everywhere and they add on top of each other. At Detectify, our API scanning handles the tedious part, systematically checking every endpoint for vulnerabilities. That way your team can spend time on the stuff that actually needs human judgment, like business logic vulnerabilities and understanding your specific app’s security context.

How does your team handle this?

And here’s the hard question that we’d love to hear about: when you’re building a new endpoint, how do you make sure developers only return the necessary fields? Code review? Automated checks? Response DTOs that force explicit field selection?

The post The API vulnerabilities nobody talks about: excessive data exposure appeared first on Blog Detectify.

Migrating Critical Messaging from Self-Hosted RabbitMQ to Amazon MQ

TLDR: We successfully migrated our core RabbitMQ messaging infrastructure from a self-hosted cluster on EKS to managed Amazon MQ to eliminate the significant operational burden of being accidental RabbitMQ experts. The complexity stemmed from over 50 interconnected services and a zero-downtime, zero-loss requirement. Our strategy involved meticulous auditing, mirroring the setup, and a “downstream-first” live cutover using Shovel plugins as a critical failsafe. The result is a much more stable, predictable platform, freeing up engineering cycles to focus 100% on building security features for our customers instead of debugging infrastructure failures.

Picture this: it’s 3 AM, and your message broker is acting up. Queue depths are climbing, consumers are dropping off, and your on-call engineer is frantically restarting pods in a Kubernetes cluster they barely understand. Sound familiar?

For years, we lived this reality with our self-hosted RabbitMQ running on EKS. Sure, we had “complete control” over our messaging infrastructure, but that control came with a hidden cost: becoming accidental RabbitMQ experts, a costly operational distraction from our core mission: accelerating the release of features that directly benefit our customers and help them keep their assets secure. 

The breaking point came when we realized our message broker had become a single point of failure—not just technically, but organizationally. Only a handful of people could troubleshoot it, and with a mandatory Kubernetes upgrade looming, we knew it was time for a change.

Enter Amazon MQ: AWS’s managed RabbitMQ service that promised to abstract away the operational headaches.

But here’s the challenge: we couldn’t just flip a switch. We had over 50 services pumping business-critical messages through our queues 24/7. Payment processing, user notifications, data sync—the works. Losing a single message was unacceptable. One wrong move and we’d risk impacting our security platform’s reliability.

This is the story of how we carefully migrated our entire messaging infrastructure while maintaining zero downtime and absolute data integrity. It wasn’t simple, but the process yielded significant lessons in operational maturity.

Background: The Old vs. The New

The Old Setup (RabbitMQ on EKS)

Running your own RabbitMQ cluster feels empowering at first. You have complete control, can tweak every setting, and it’s “just another container” in your Kubernetes cluster. But that control comes with a price. When RabbitMQ starts acting up, someone on your team needs to know enough about clustering, memory management, and disk usage patterns to fix it. We found ourselves becoming accidental RabbitMQ experts when we really just wanted to send messages between services.

The bus factor was real. Only a handful of people felt comfortable diving into RabbitMQ issues. When those people were on vacation or busy with other projects, incidents would sit longer than they should. Every security patch meant carefully planning downtime windows. Every Kubernetes upgrade meant worrying about how it would affect our message broker. It was technical debt disguised as infrastructure.

The warning signs were there. Staging would occasionally have weird behavior—messages getting stuck, consumers dropping off, memory spikes that didn’t make sense. We’d restart the services and things would go back to normal, but you can only kick the can down the road for so long. When similar issues started appearing in production, even briefly, we knew we were on borrowed time.

Kubernetes doesn’t stand still, and neither should your clusters. But major version upgrades can be nerve-wracking when you have critical infrastructure running on top. The thought of our message broker potentially breaking during a Kubernetes upgrade—taking down half our platform in the process—was the final push we needed to look for alternatives.

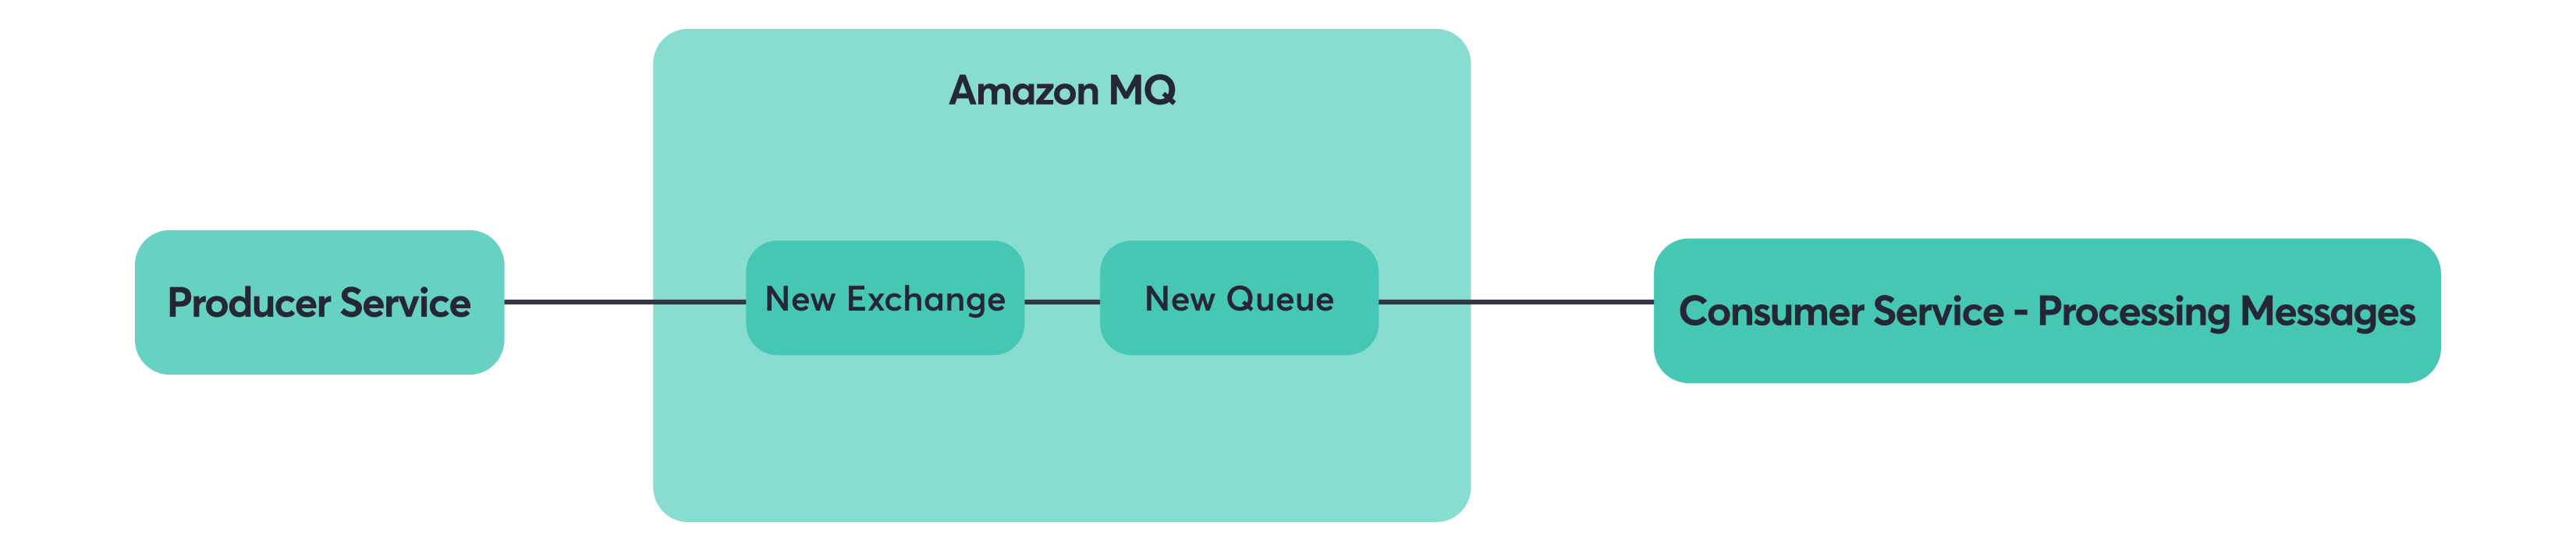
The New Setup (Amazon MQ)

With Amazon MQ, someone else worries about keeping RabbitMQ running. AWS handles the clustering, the backups, the failover scenarios you hope never happen but probably will. It’s still RabbitMQ under the hood, but wrapped in the kind of operational expertise that comes from running thousands of message brokers across the globe.

AWS takes care of many of the routine operational tasks, though you still need to plan maintenance windows for major upgrades. The difference is that these are less frequent and more predictable than the constant patching and troubleshooting we dealt with before. The monitoring becomes simpler too—you may still use Grafana panels, but now they pull from CloudWatch instead of requiring Prometheus exporters and custom metrics collection.

Amazon MQ isn’t serverless though, so you still need to choose the right instance size and monitor both CPU, RAM, and disk usage carefully. Since disk space is tied to your instance type, running out of space is still a real concern that requires monitoring and planning. The key difference is that you’re monitoring well-defined resources rather than debugging mysterious cluster behavior.

Security by default is always better than security by choice. Amazon MQ doesn’t give you the option to run insecure connections, which means you can’t accidentally deploy something with plaintext message traffic. It’s one less thing to worry about during security audits and one less way for sensitive data to leak.

When your message broker just works, developers can focus on the business logic that actually matters. You still get Slack alerts when things go wrong and queue configuration is still something you need to think about, but you’re no longer troubleshooting clustering issues or debugging why nodes can’t talk to each other at 2 AM. The platform shifts from something that breaks unexpectedly to something that fails predictably with proper monitoring.

The Migration Challenge

Complex Service Dependencies

Over 50 services depended on RabbitMQ:

  • Some only consumed messages.
  • Some only produced messages.
  • Some did both.

Like many companies that have grown organically, our RabbitMQ usage had evolved into a complex web of dependencies. Fifty-plus services might not sound like a massive number in some contexts, but when each service potentially talks to multiple queues and many services interact with each other through messaging, the dependency graph becomes surprisingly intricate. Services that started simple had grown tentacles reaching into multiple queues. New features had been built on top of existing message flows. What looked like a straightforward “change the connection string” problem on paper turned into a careful choreography of moving pieces.

Zero Downtime Requirement

Messages were business-critical – downtime was not an option.

These weren’t just debug logs or nice-to-have notifications flowing through our queues. Payment processing, user notifications, data synchronization between systems—the kind of stuff that immediately breaks the user experience if it stops working. The pressure was real: migrate everything successfully or risk significant business impact.

Migration Risks

Risks included:

  • Dropped or duplicated messages.
  • Consumers/producers falling out of sync.
  • Unexpected latency or queue build-up.

Message systems have this nasty property where small problems can cascade quickly. A consumer that falls behind can cause queues to back up. A producer that starts sending to the wrong place can create ghost traffic that’s hard to trace. During a migration, you’re essentially rewiring the nervous system of your platform while it’s still running—there’s no room for “oops, let me try that again.”

We needed a plan to untangle dependencies and migrate traffic safely.

Our Migration Approach

1. Audit and Preparation

Service Mapping and Analysis

Before touching anything, we needed to understand what we were working with. This meant going through every service, every queue, every exchange, and drawing out the connections. Some were obvious—the email service clearly produces to the email queue. Others were surprising—why was the user service consuming from the analytics queue? Documentation helped, but sometimes the only way to be sure was reading code and checking configurations.

The RabbitMQ management API proved invaluable during this phase. We used it to query all the queues, exchanges, bindings, and connection details—basically everything we needed to get a complete picture of our messaging topology. This automated approach was much more reliable than trying to piece together information from scattered documentation and service configs.

Interactive topology chart showing service dependencies and message flows

With all this data, we created visual representations using go-echarts to generate interactive charts showing message flows and dependencies. We even fed the information to Figma AI to create clean visual maps of all the connections and queue relationships. Having these visual representations made it much easier to spot unexpected dependencies and plan our migration order.

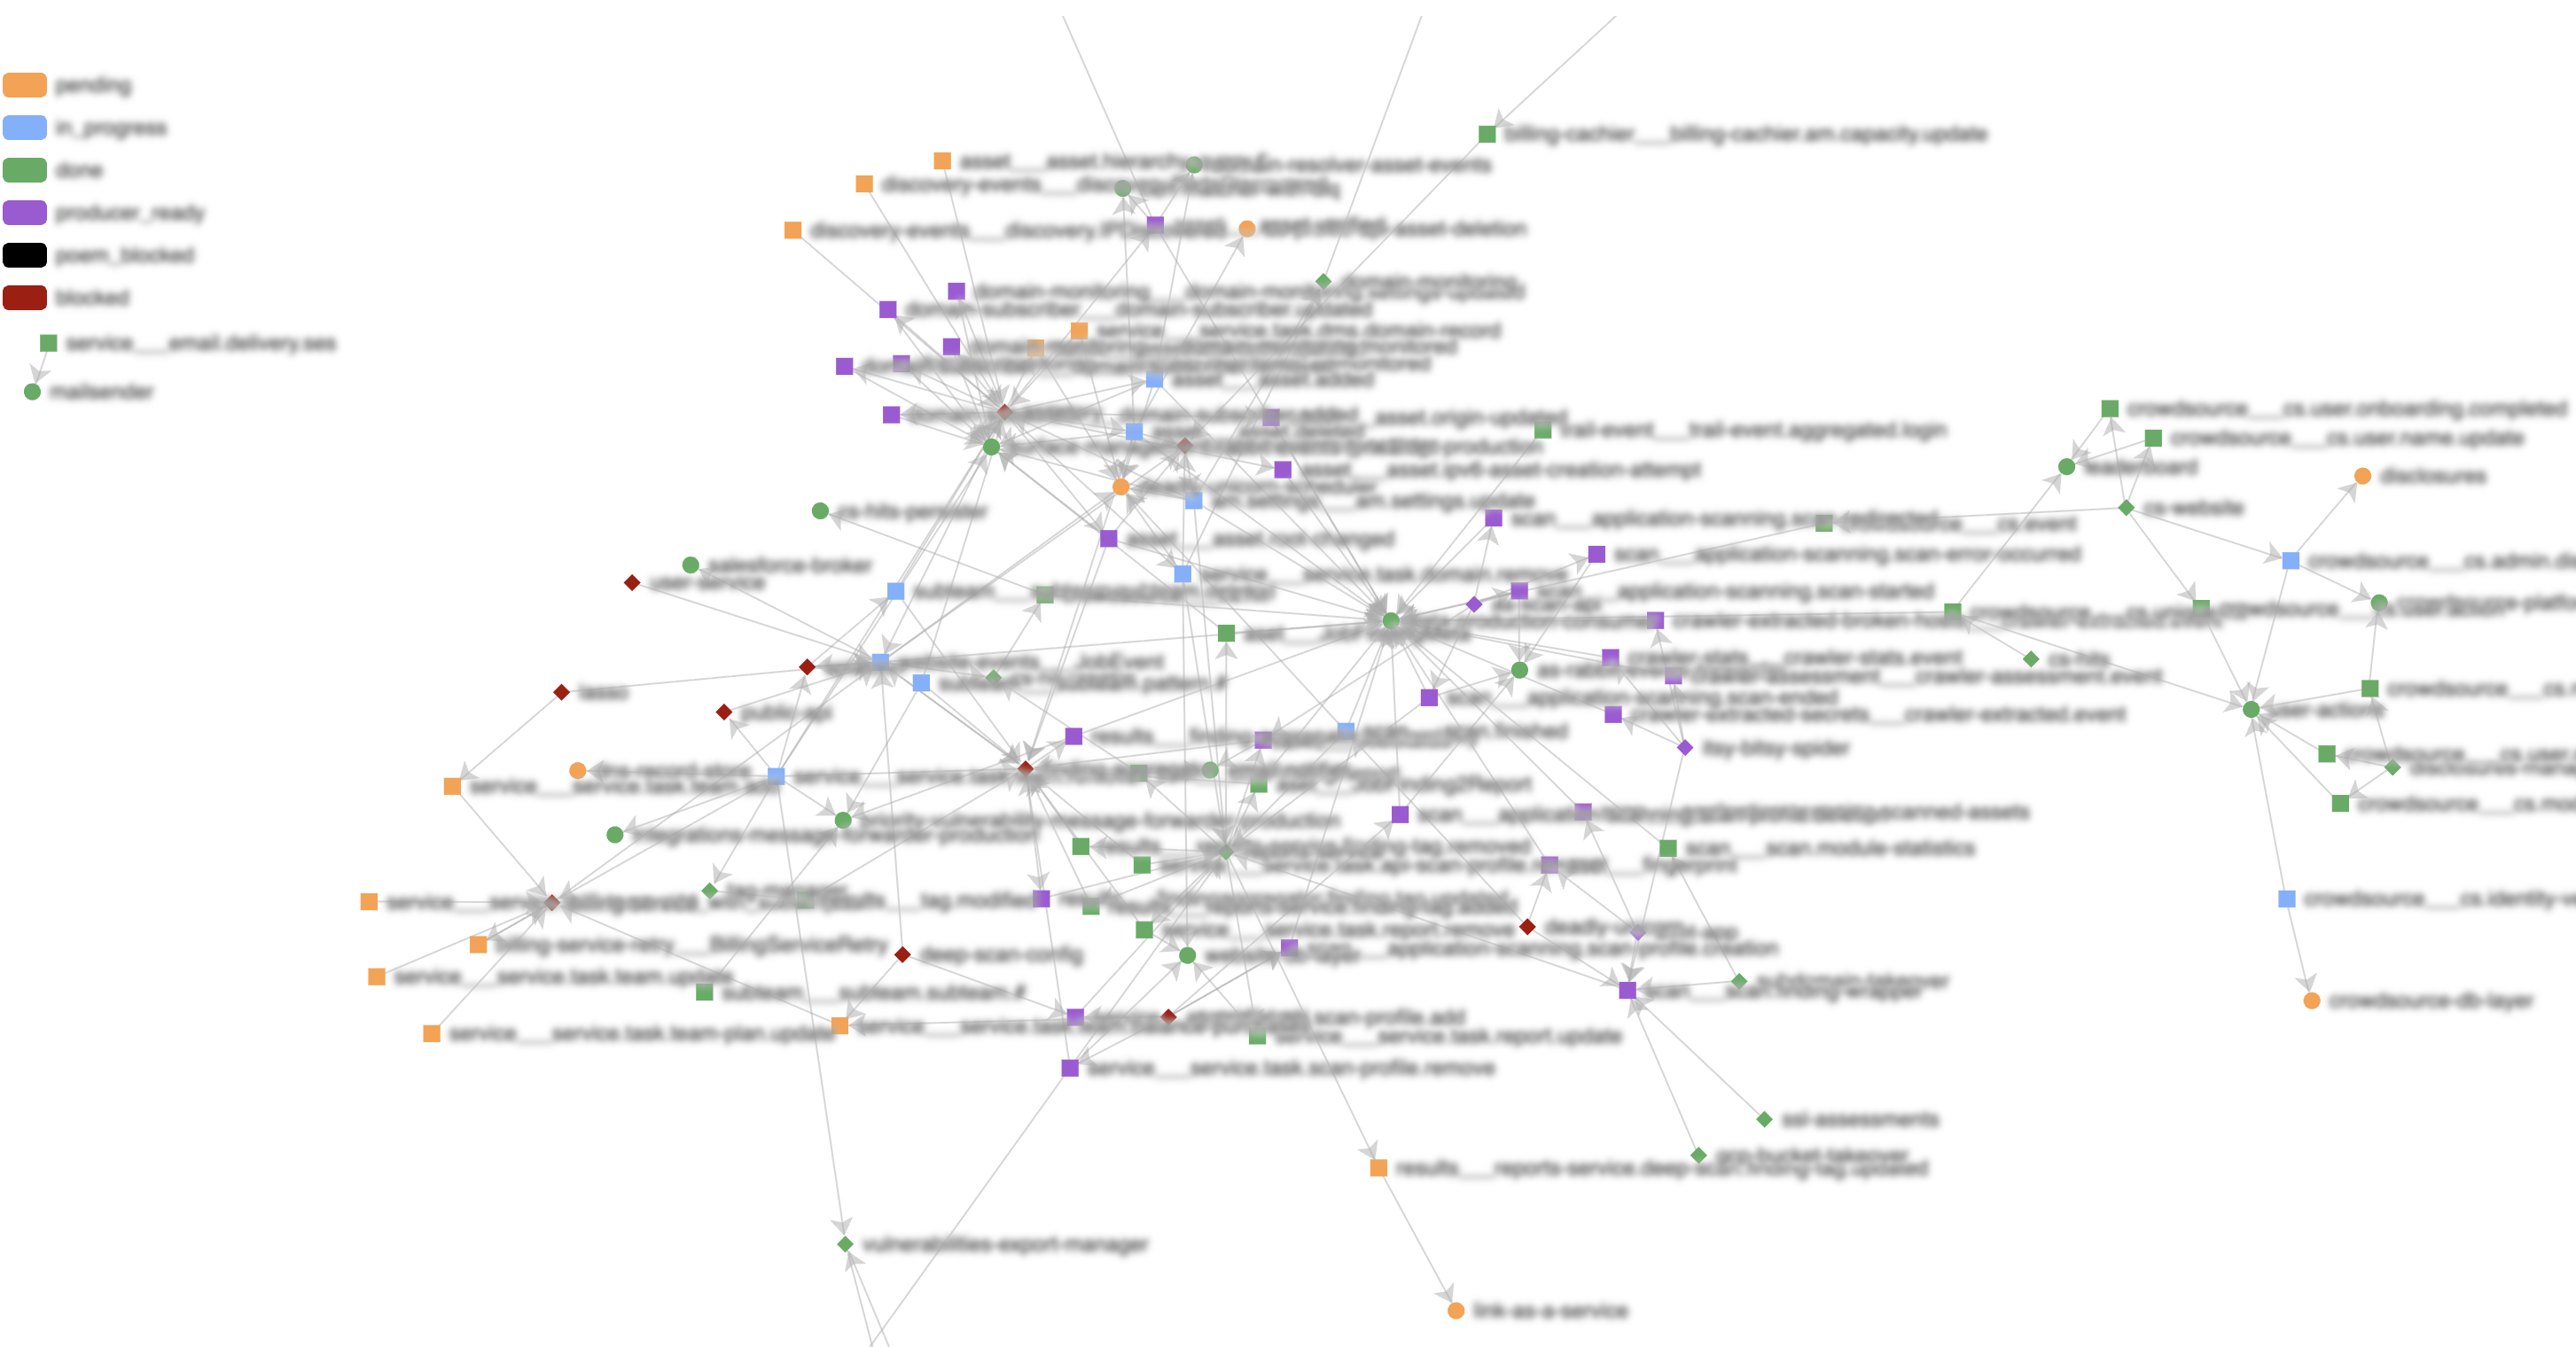
Visual map of RabbitMQ connections and dependencies

The visualizations helped us identify both hotspots where many services converged, and “low hanging fruits”—services that weren’t dependent on many other components. By targeting these first, we could remove nodes from the dependency graph, which gradually un-nested the complexity and unlocked safer migration paths for upstream services. Each successful migration simplified the overall picture and reduced the risk for subsequent moves.

Service Categorization

  • Consumer-only
  • Producer-only
  • Consumer + Producer

This categorization became our migration strategy. Consumer-only services were the easiest—we could point them at the new broker without affecting upstream systems. Producer-only services were next—as long as consumers were already moved, producers could follow safely. The Consumer+Producer services were the trickiest and needed special handling.

Migration Roadmap

Having a plan beats winging it every time. We could see which services to migrate first, which ones to save for last, and where the potential problem areas were. It also helped with communication—instead of “we’re migrating RabbitMQ sometime soon,” we could say “we’re starting with the logging services this week, then the notification system the week after.”
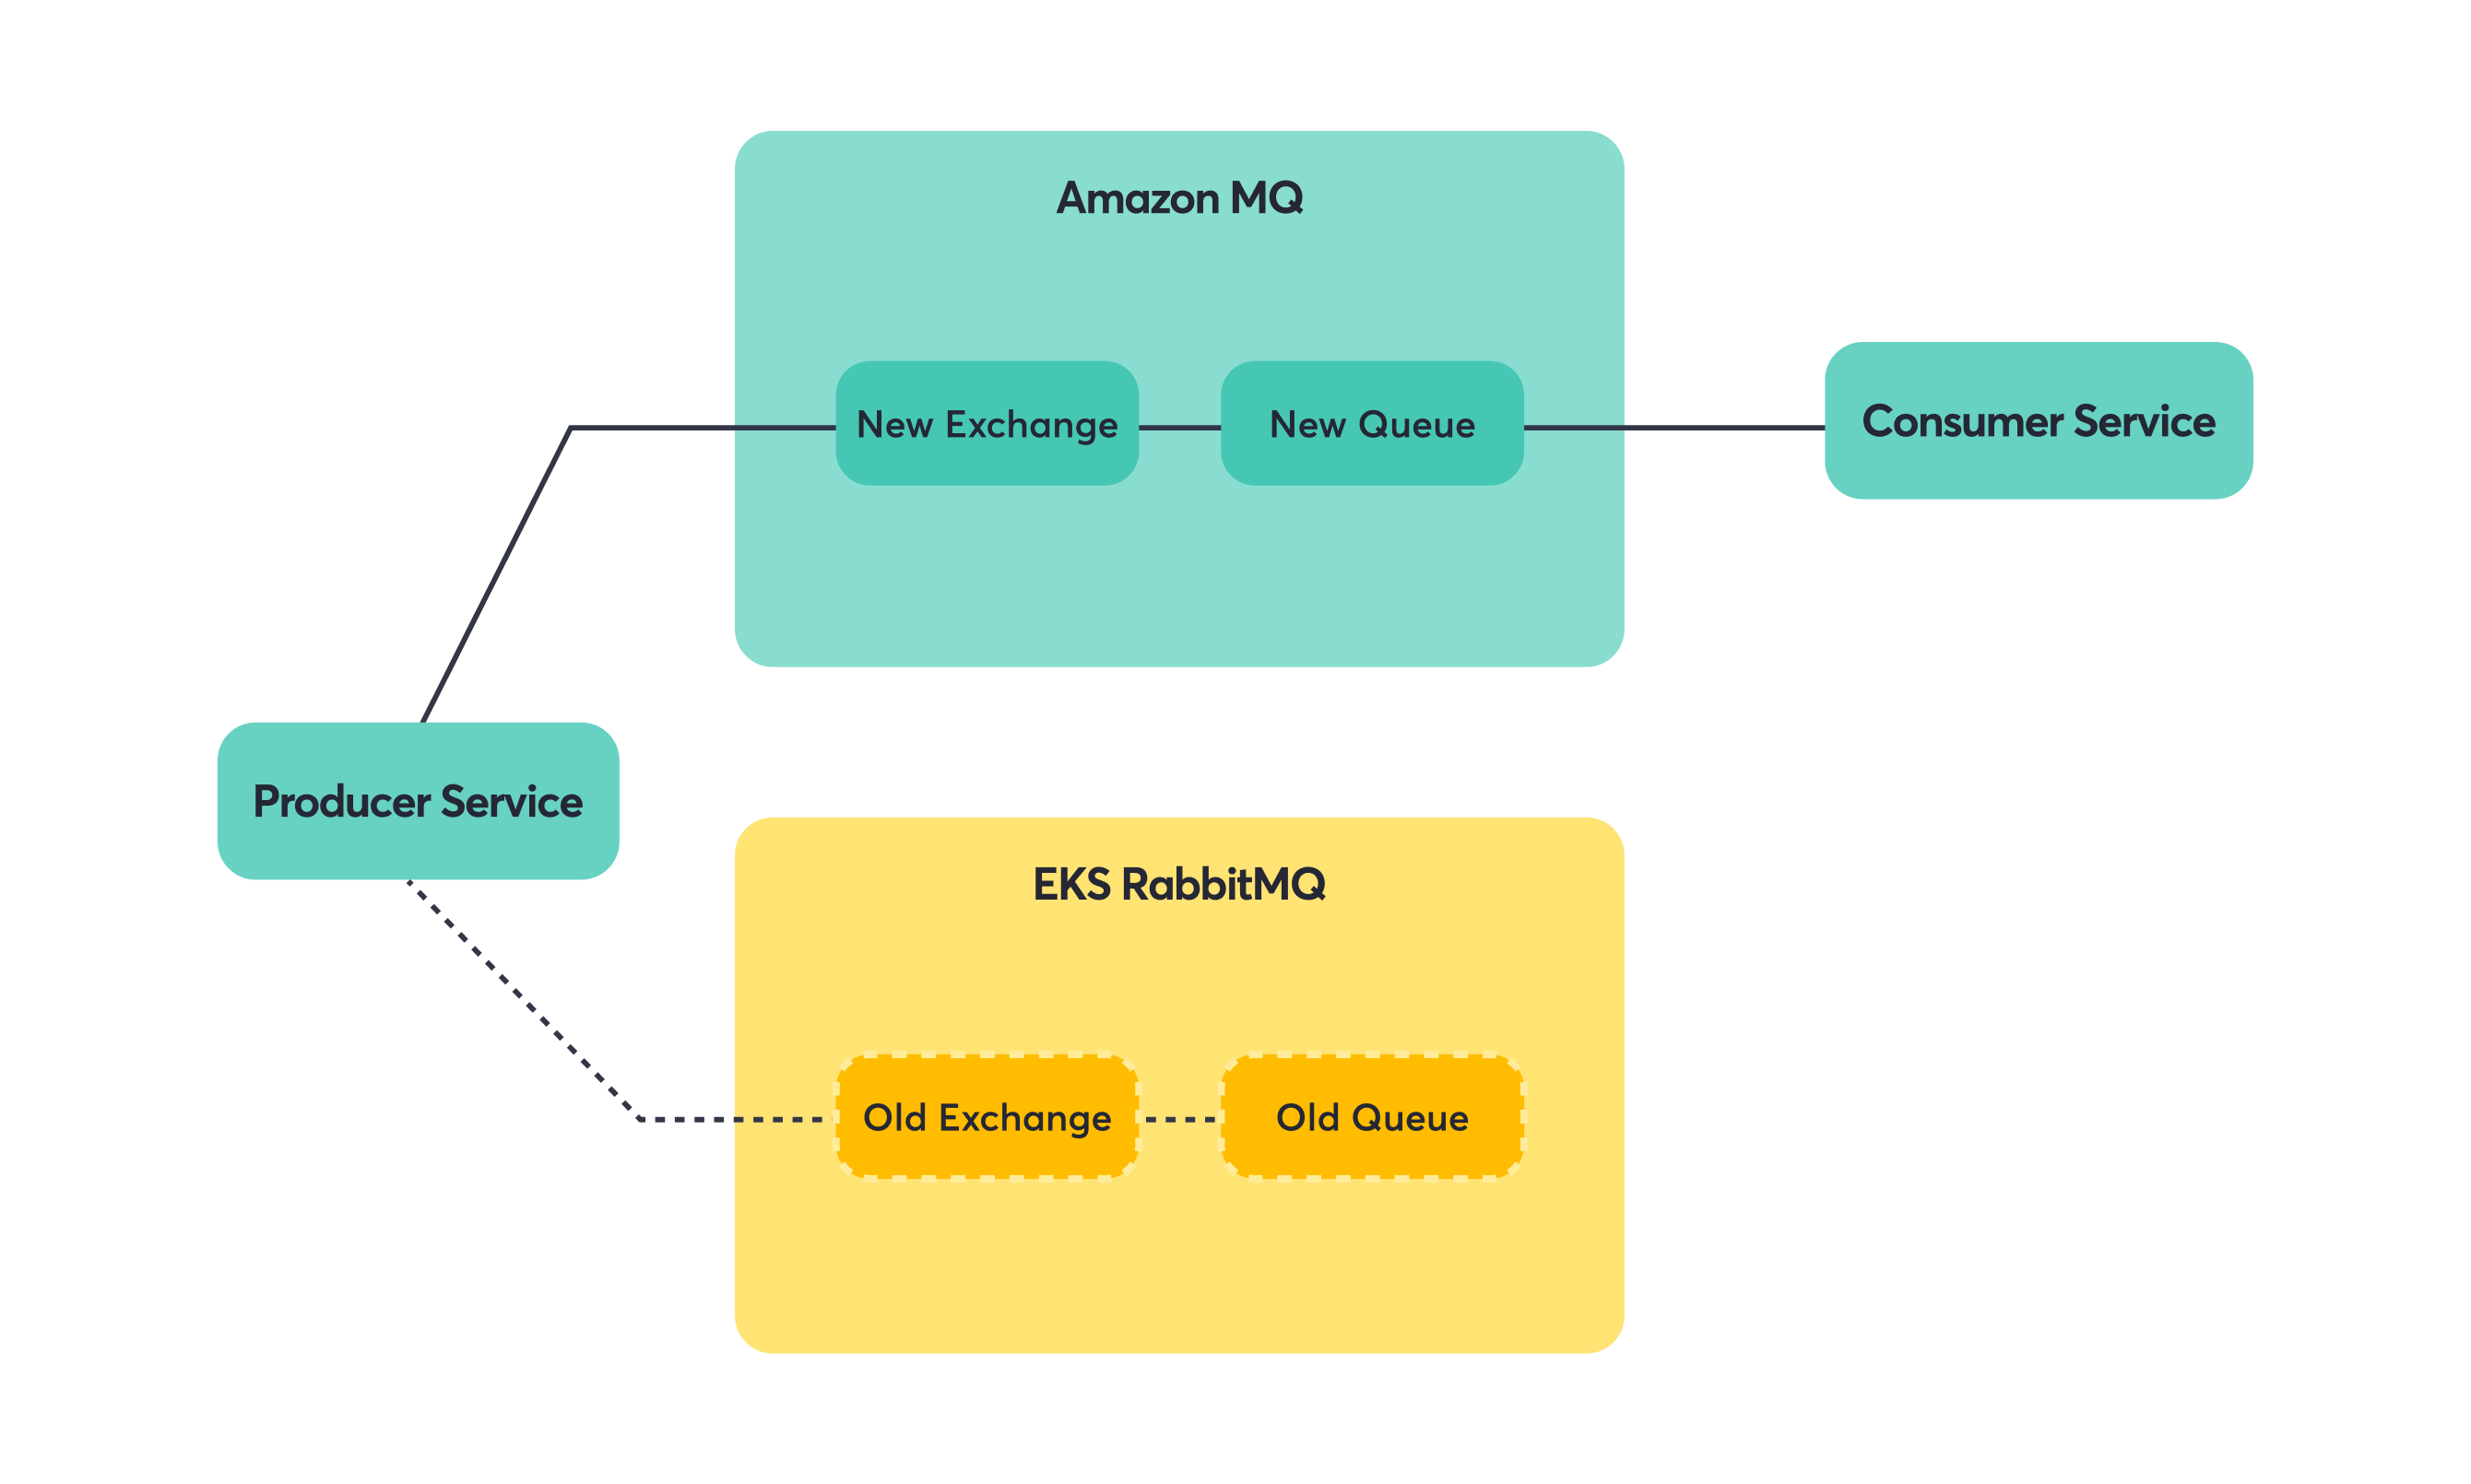
Safety Net Strategy

Shovels became a critical part of our strategy from day one. These plugins can copy messages from one queue to another, even across different brokers, which meant we could ensure message continuity during the migration. Instead of trying to coordinate perfect timing between when producers stop sending to the old broker and consumers start reading from the new one, shovels would bridge that gap and guarantee no messages were lost in transit.

2. Build a Mirror Setup

Export Configuration

We exported the complete configuration from our old RabbitMQ cluster, including:

  • Queues
  • Exchanges
  • Users & permissions

RabbitMQ’s export feature became our best friend. Instead of manually recreating dozens of queues and exchanges, we could dump the entire configuration from the old cluster. This wasn’t just about saving time—it was about avoiding the subtle differences that could cause weird bugs later. Queue durability settings, exchange types, binding patterns—all the little details that are easy to get wrong when doing things by hand.

Mirror the Setup

We then imported everything into Amazon MQ to create an identical setup:

  • Same queue names and exchanges.
  • Same credentials.

The goal was to make the new broker as close to a drop-in replacement as possible. Services shouldn’t need to know they’re talking to a different broker—same queue names, same exchange routing, same user accounts. This consistency was crucial for a smooth migration and made it easier to roll back if something went wrong.

Queue Type Optimization

We made one strategic change: most queues were upgraded to quorum queues for better durability, except for one high-traffic queue where quorum caused performance issues.

Quorum queues are RabbitMQ’s answer to the classic “what happens if the broker crashes mid-message” problem. They’re more durable but use more resources. For most of our queues, the trade-off made sense. But we had one queue that handled hundreds of messages per second, and the overhead of quorum consensus was too much. Sometimes the best technical solution isn’t the right solution for your specific constraints.

3. Live Cutover

Once the new broker was ready, we began moving services live. But we didn’t start with production—we had the same setup mirrored in staging, which became our testing ground. For every service migration, we’d first execute the switch in staging to validate the process, then repeat the same steps in production once we were confident everything worked smoothly.

Consumer-Only Services

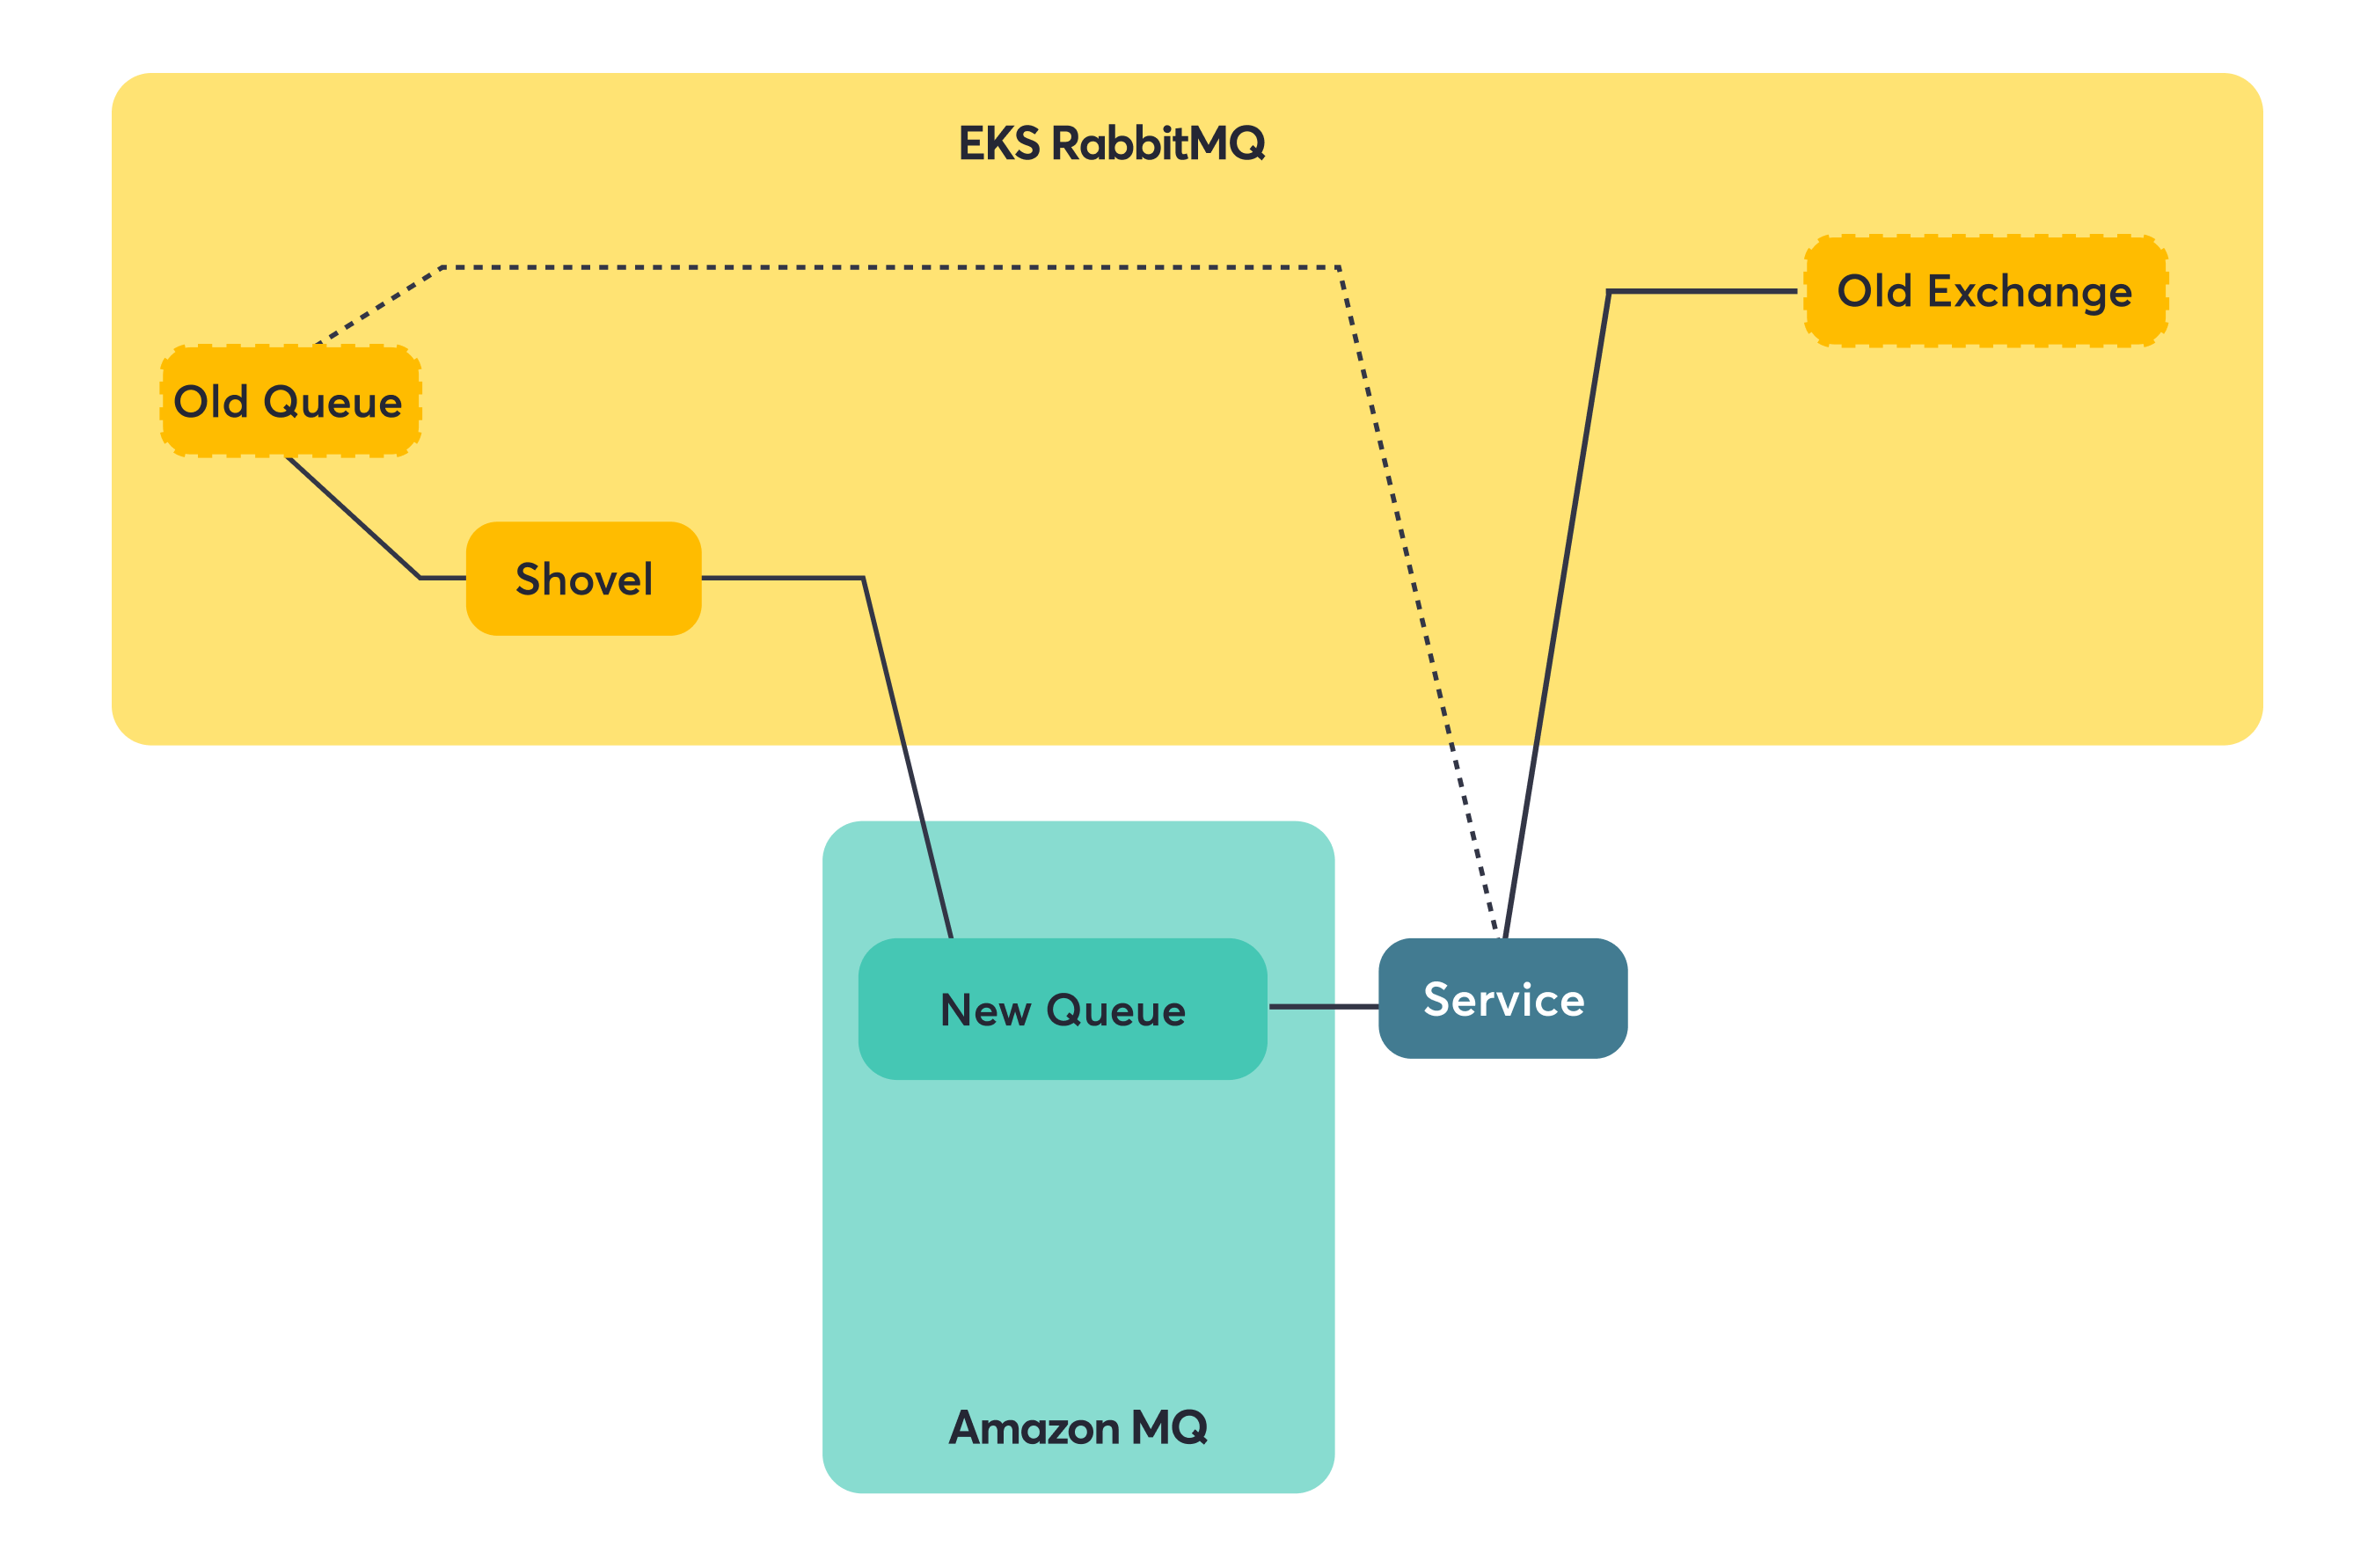
Consumer-only services were our practice round. We could move them over and if something went wrong, the blast radius was limited. The shovel plugin became our safety net—it copies messages from one queue to another, even across different brokers. This meant messages sent to the old queue while we were migrating would still reach consumers on the new broker. No lost messages, no service interruption.

Step 1: Switch consumer to Amazon MQ.

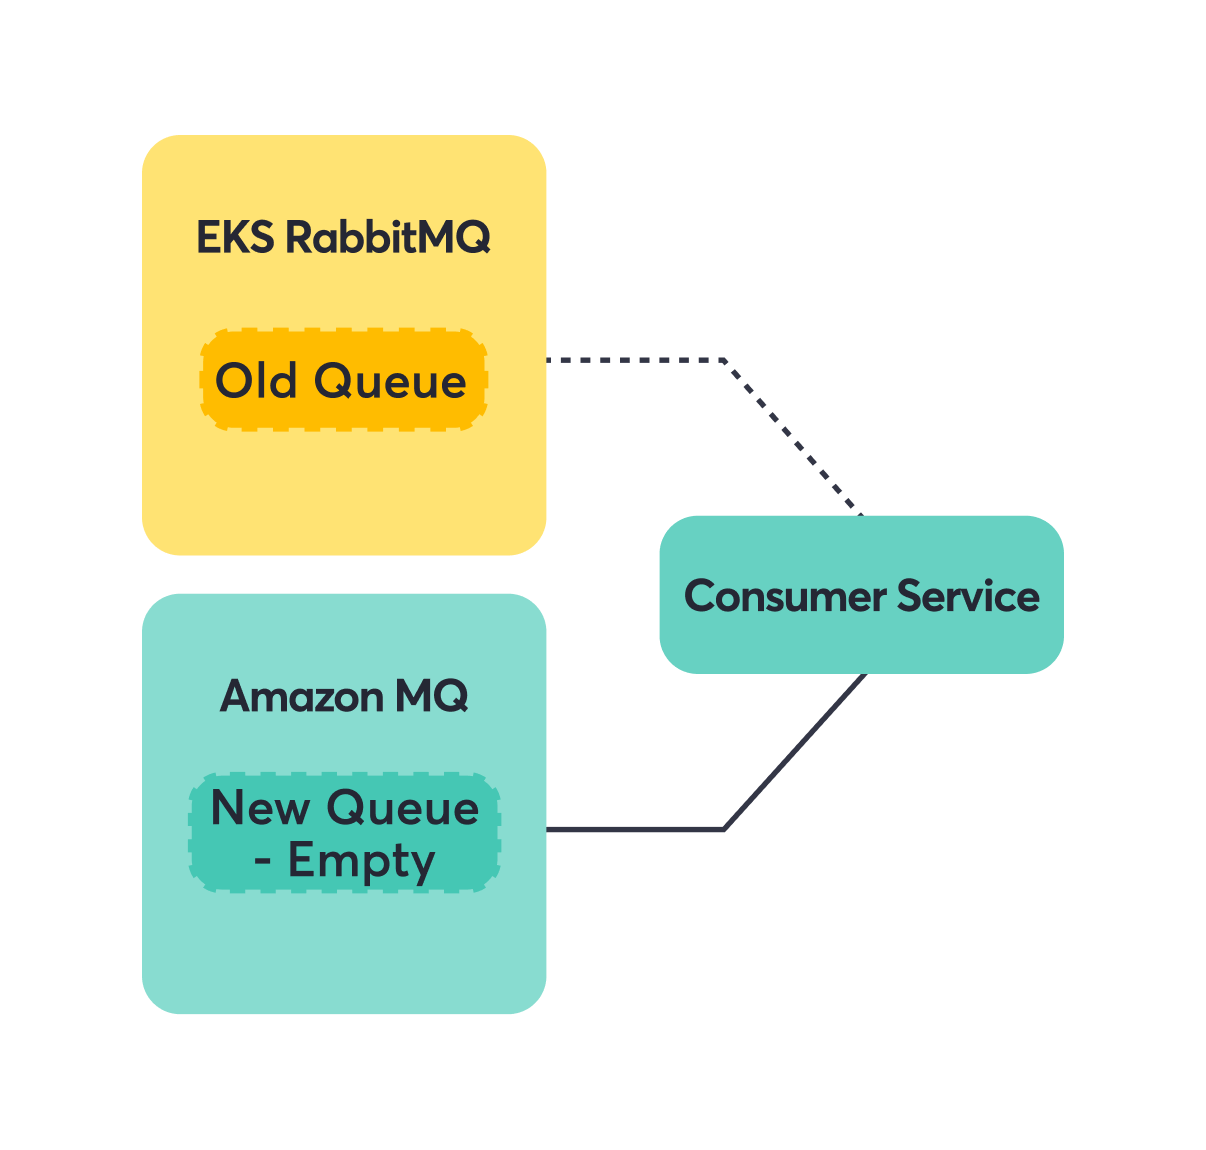
Step 2: Add shovel to forward messages from the EKS RabbitMQ Old Queue to the Amazon MQ New Queue.

Step 3: Consumers seamlessly read from Amazon MQ.

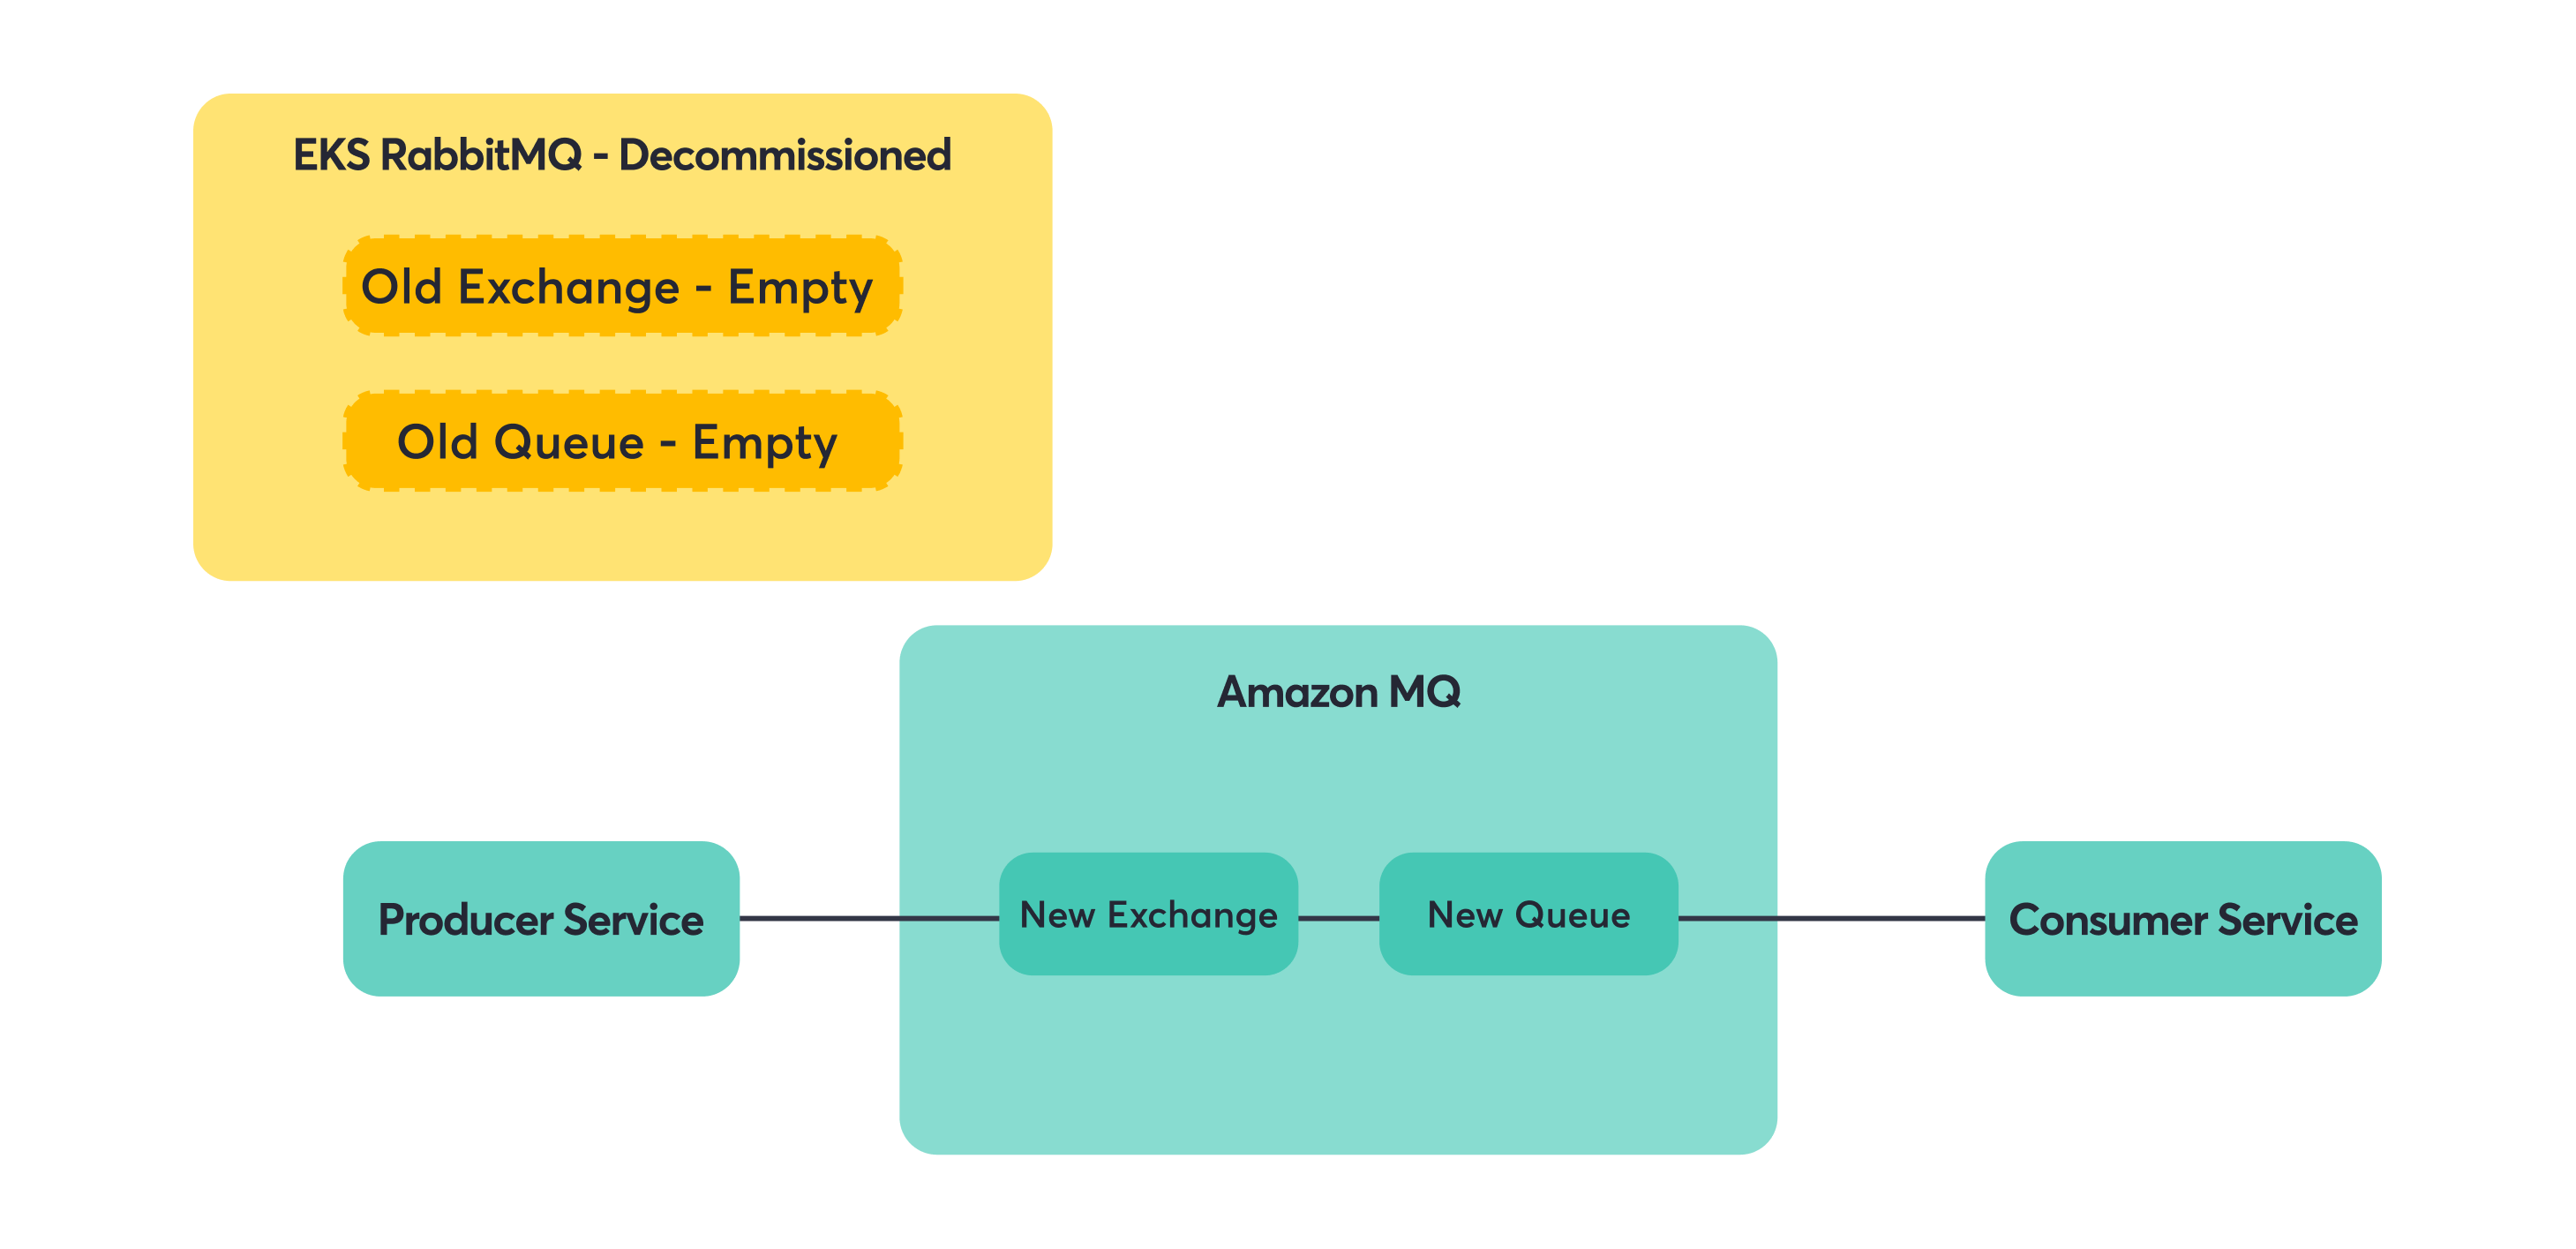
Producer-Only Services

Once consumers were happily reading from Amazon MQ, we could focus on the producers. Since the queue and exchange names were identical, producers just needed a new connection string. Messages would flow into the same logical destinations, just hosted on different infrastructure.

Note: For a producer to be eligible for migration, you want all the downstream consumers to be migrated first.

Step 1: Switch producer to Amazon MQ.

Step 2: Messages flow to the same queues via the new exchange/broker.

Step 3: Remove shovel (cleanup).


Key principle: migrate downstream consumers first, then producers to avoid lost messages.

This principle saved us from a lot of potential headaches. If you move producers first, you risk having messages sent to a new broker that doesn’t have consumers yet. Move consumers first, and you can always use shovels or other mechanisms to ensure messages reach them, regardless of where producers are sending.

Consumer + Producer Services

These services were the final boss of our migration. They couldn’t be treated as simple consumer-only or producer-only cases because they did both. Switching them all at once meant they’d start consuming from Amazon MQ before all the upstream producers had migrated, potentially missing messages. They’d also start producing to Amazon MQ before all the downstream consumers were ready.

The solution required a bit of code surgery. Instead of one RabbitMQ connection doing everything, these services needed separate connections for consuming and producing. This let us migrate the consumer and producer sides independently.

Step 1: Migrate consumer side to Amazon MQ (producer stays on old broker). The service now consumes from the new queue (via the shovel) but still produces to the old exchange.

Step 2: Switch producer side to Amazon MQ (full migration complete). Now both consuming and producing happen on Amazon MQ.

This gave us full control to migrate complex services step by step without downtime.

Post-Migration Monitoring

Old habits die hard, and one of those habits is checking dashboards when something feels off. We rebuilt our monitoring setup for Amazon MQ using Grafana panels that pull from CloudWatch instead of Prometheus. This simplified our metrics collection—no more custom exporters or scraping configurations. The metrics come directly from AWS, and we still get the same visual dashboards we’re used to, just with a cleaner data pipeline.

Essential Metrics

We focused on four key metrics that give us complete visibility into our message broker:

  • Queue Depth – Shows if consumers are keeping up with producers. A steadily increasing queue depth indicates a backlog building up.
  • Connection Counts – Helps spot services having trouble connecting to the broker. Sudden drops often indicate network or authentication issues.
  • Broker Health – Gives the big picture view of whether the infrastructure itself is working correctly. AWS provides comprehensive health checks.
  • CPU and Memory Usage – Critical since Amazon MQ runs on specific instance types, not serverless infrastructure. You need to size instances correctly and watch for resource exhaustion.

Alerting Strategy

We set up a layered alerting approach focusing on the infrastructure level and service-specific monitoring:

  • Resource Usage Alerts – CPU and memory alerts are crucial since you’re still responsible for choosing the right instance size. We set up both Slack notifications for warnings and PagerDuty alerts for critical thresholds.
  • Service-Level Monitoring – Each service has its own alerts on queue length and consumer counts. This gives teams ownership of their specific queues and helps them spot issues with their particular message flows before they become broker-wide problems.

Lessons Learned

Migration is Doable, But Plan Carefully

Live migration is possible, but it’s not trivial and definitely requires careful planning.

We managed to avoid downtime during our migration, but it took some preparation and a lot of small, careful steps. The temptation is always to move fast and get it over with, but with message systems, you really can’t afford to break things. We had a few close calls where our planning saved us from potential issues.

Patterns That Worked for Us

Some approaches that made our migration smoother:

  • Downstream-first approach: move consumers before producers.
  • Mirror everything: identical exchanges, queues, credentials.
  • Dual broker strategy: run old and new in parallel with shovels.
  • Flexible service design: separate configs for consumers and producers.

These aren’t revolutionary ideas, but they worked well in practice. The downstream-first approach felt scary at first but ended up reducing risk significantly. Having identical setups meant fewer surprises. Running both brokers in parallel gave us confidence and fallback options.

What We Got Out of It

The migration went better than we expected:

  • No outages during the process.
  • Didn’t lose any messages (that we know of).
  • Day-to-day operations are definitely easier now.

The new system has been more stable, though we still get alerts and have to monitor things carefully. The main difference is that when something goes wrong, it’s usually clearer what the problem is and how to fix it. Less time spent digging through Kubernetes logs trying to figure out why rabbit are unhappy.

Conclusion

Moving from RabbitMQ on EKS to Amazon MQ turned out to be worth the effort, though it wasn’t a simple flip-the-switch operation.

The main win was reducing the operational burden on our team. We still have to monitor and maintain things, but the day-to-day firefighting around clustering issues and mysterious failures has mostly gone away.

If you’re thinking about a similar migration:

  • Take time to really understand your current setup first.
  • Test everything in staging multiple times.
  • Plan for it to take longer than you think.

The migration itself was stressful, but the end result has been more time to focus on building features instead of babysitting infrastructure.

Looking back, the hardest part wasn’t the technical complexity—it was building confidence that we wouldn’t break anything important. But with good planning, visual dependency mapping, and a healthy respect for Murphy’s Law, it’s definitely doable.

Now when someone mentions “migrating critical infrastructure with zero downtime,” we don’t immediately think “impossible.” We think “challenging, but we’ve done it before.”

The post Migrating Critical Messaging from Self-Hosted RabbitMQ to Amazon MQ appeared first on Blog Detectify.

Why API security is different (and why it matters)

Two months since I joined Detectify and I’ve realized something: API security is a completely different game from web application security. And honestly? I think a lot of teams don’t see this yet.

APIs are everywhere (but you might not know where)

Let’s look at the modern application. Your mobile app? APIs. Your crucial SaaS integrations? APIs. That complex checkout flow? Probably five or more API calls talking with each other. Modern applications are, fundamentally, just APIs talking to other APIs with a fancy UI layered on top.

But here’s what’s been catching me off guard: many companies don’t even have a complete inventory of their APIs. You’re trying to secure a perimeter you can’t even see the edges of. I have seen:

  • Shadow APIs: Old endpoints no one remembers deploying.
  • Zombie APIs: Test/staging endpoints that never got turned off.
  • Partner APIs: Third-party integrations that extend your attack surface.

How can you secure what you can’t see?

The attack vectors are different

When we talk about web vulnerabilities, usually we’re dealing with XSS, CSRF, clickjacking – stuff that messes with what users see or tricks them into clicking something they shouldn’t. API vulnerabilities are a different beast. We’re talking broken authentication, APIs exposing way too much data, weak rate limiting, injection attacks. 

These attacks skip the UI entirely. An attacker doesn’t need to trick a user into clicking something malicious. They just need to understand your API contract and find the weak spots. That’s it. The scary part? They can automate all of this.

Authentication is… well… complicated

Web apps usually use session-based authentication with cookies. It’s pretty standard, most frameworks handle it well, and there are well-known patterns to follow. APIs? That’s where things get messy. OAuth, JWT, API keys, mutual TLS, custom bearer tokens… There are so many different approaches, and each one has its own vulnerability patterns. I’ve been diving deep into the OWASP API Security Top 10, and honestly, the auth issues are wild. Broken Object Level Authorization, Broken Function Level Authorization… these things have scary-long names, but they’re everywhere. Even though everyone knows about them, they still pop up in production all the time.

Why does it matter?

API attacks are growing at an alarming rate for several reasons:

  1. Automation is Easy: APIs return structured data that is easier to parse than HTML, making it suitable for automation. This is great for developers, but even more perfect for attackers. 
  2. Weak Rate Limiting: Since APIs need to handle high-volume traffic, rate limiting is often weaker.
  3. Documentation as Blueprints: API documentation, while great for developers, also serves as a perfect attack blueprint, showing adversaries exactly where to poke.

This is exactly why we’re constantly enhancing our API Scanning capabilities at Detectify, because understanding these blind spots is the first step to fixing them.

How does your team handle this?

We’d love to hear how other teams are tackling this complex problem.

  • How do you maintain a complete, up-to-date inventory of ALL your endpoints, including the “zombie” ones?
  • What’s your strategy for testing authorization at scale when you have hundreds of different endpoints and authentication methods?
  • How do you approach API versioning and deprecation without accidentally leaving critical security holes in old versions?
  • What API security challenges keep you up at night?

FAQ

Q: What is the primary difference between web application security and API security?

A: Web application security often focuses on user-facing vulnerabilities like XSS, while API security is concerned with flaws like broken authentication and weak access control that attackers can exploit by directly interacting with the API endpoints, bypassing the UI.

Q: What are Shadow and Zombie APIs?

A: Shadow APIs are old endpoints that are forgotten but still deployed, while Zombie APIs are test or staging endpoints that were never turned off, and both extend the attack surface without the organization’s knowledge.

Q: Why are API attacks easily automated?

A: API attacks are easily automated because APIs return structured data (like JSON or XML) that is much easier for a script or bot to parse and manipulate than the more complex and varied structure of HTML pages.

The post Why API security is different (and why it matters) appeared first on Blog Detectify.

PCI DSS 4.0 Readiness Roadmap: A Complete Audit Strategy for 2025

4.5/5 - (2 votes)

Last Updated on December 2, 2025 by Narendra Sahoo

Getting PCI DSS compliant is like preparing for a big exam. You cannot just walk into it blind, you first need to prepare, check your weak areas, next fix them, and then only face the audit. If you are here today for the roadmap, I assume you are preparing for an audit now or sometime in the future, and I hope this PCI DSS 4.0 Readiness Roadmap helps you as your preparation guide. So, let’s get started!

Step 1: List down everything in scope

The first mistake many companies make is they don’t know what is really in the PCI scope. So, start with an inventory.

This is one area where many organizations rely on pci dss compliance consultants to help them correctly identify what truly falls under cardholder data scope.

  • Applications: Your payment gateway (Stripe, Razorpay, PayPal, Adyen), POS software, billing apps like Zoho Billing, CRMs like Salesforce that store customer details, in-house payment apps.
  • Databases: MySQL, Oracle, SQL Server, MongoDB that store PAN or related card data.
  • Servers: Web servers (Apache, Nginx, IIS), application servers (Tomcat, Node.js), DB servers.
  • Hardware: POS terminals, card readers, firewalls (Fortinet, Palo Alto, Checkpoint), routers, load balancers (F5).
  • Cloud platforms: AWS (S3 buckets, RDS, EC2), Azure, GCP, SaaS apps that store or process card data.
  • Third parties: Payment processors, outsourced call centers handling cards, hosting providers.

Write all this down in a spreadsheet. Mark which ones store, process, or transmit card data. This becomes your “scope map.”

Step 2: Do a gap check (compare with PCI DSS 4.0 requirements)

Now take the PCI DSS 4.0 standard and see what applies to you. Some basics:

  • Firewalls – Do you have them configured properly or are they still at default rules?
  • Passwords – Are your systems still using “welcome123” or weak defaults? PCI needs strong auth.
  • Encryption – Is card data encrypted at rest (DB, disk) and in transit (TLS 1.2+)? If not, you may fail your PCI DSS compliance audit.
  • Logging – Are you logging access to sensitive systems, and storing logs securely (like in Splunk, ELK, AWS CloudTrail)?
  • Access control – Who has access to DB with card data? Is it limited on a need-to-know basis?

Example: If you’re running an e-commerce store on Magento and it connects to MySQL, check if your DB is encrypted and whether DB access logs are kept.

Step 3: Fix the weak spots (prioritize risks)

  • If your POS terminals are outdated (like old Verifone models), replace or upgrade.
  • If your AWS S3 buckets storing logs are public, fix them immediately.
  • If employees are using personal laptops to process payments, enforce company-managed devices with endpoint security (like CrowdStrike, Microsoft Defender ATP).
  • If your database with card data is open to all developers, restrict it to just DB admins.

Real story: A retailer I advised had their POS terminals still running Windows XP. They were shocked when I said PCI won’t even allow XP as it’s unsupported.

Step 4: Train your people

PCI DSS is not just about tech. If your staff doesn’t know, they’ll break controls.

  • Train call center staff not to write card numbers on paper.
  • Train IT admins to never copy card DBs to their laptops for “testing.”
  • Train developers to follow secure coding (OWASP Top 10, no hard-coded keys). This not only helps with PCI but also complements SOC 2 compliance.

Example: A company using Zendesk for support had to train agents not to ask customers for card details over chat or email.

Step 5: Set up continuous monitoring

Auditors don’t just look for controls, they look for evidence.

  • Centralize your logs in SIEM (Splunk, QRadar, ELK, Azure Sentinel).
  • Set up alerts for failed logins, privilege escalations, or DB exports.
  • Schedule vulnerability scans (Nessus, Qualys) monthly.
  • Do penetration testing on your payment apps (internal and external).

Example: If you are using AWS, enable CloudTrail + GuardDuty to continuously monitor activity.

pci dss Readiness

Step 6: Do a mock audit (internal readiness check)

Before the official audit, test yourself.

  • Pick a PCI DSS requirement (like Requirement 8: Identify users and authenticate access). Check if you can prove strong passwords, MFA, and unique IDs.
  • Review if your network diagrams, data flow diagrams, and inventories are up to date.
  • Run a mock interview: ask your DB admin how they control access to the DB. If they can’t answer, it means you are not ready.

Example: I’ve seen companies that have everything in place but fail because their staff can’t explain what’s implemented.

Step 7: Engage your QSA (when you’re confident)

Finally, once you have covered all major gaps, bring in a QSA (like us at VISTA InfoSec). A QSA will validate and certify your compliance. But if you follow the above steps, the audit becomes smooth and you can avoid surprises.

We recently helped Vodafone Idea achieve PCI DSS 4.0 certification for their retail stores and payment channels. This was a large-scale environment, yet with the right PCI DSS 4.0 Readiness Roadmap (like the one above), compliance was achieved smoothly.

Remember, even the largest organizations can achieve PCI DSS 4.0 compliance if they start early, follow the roadmap step by step, and keep it practical.

PCI DSS 4.0 Penalties Guide

Final Words for PCI DSS 4.0 Readiness Roadmap 

Most businesses panic only when the audit date gets close. But PCI DSS doesn’t work that way. If you wait till then, it’s already too late.

So, start now. Even small steps today (like training your staff or fixing one gap) move you closer to compliance.

Having trouble choosing a QSA? VISTA InfoSec is here for you!

For more than 20 years, we at VISTA InfoSec have been helping businesses across fintech, telecom, cloud service providers, retail, and payment gateways achieve and maintain PCI DSS compliance. Our team of Qualified Security Assessors (QSAs) and technical experts works with companies of every size, whether it’s a start-up launching its first payment app or a large enterprise.

So, don’t wait! Book a free PCI DSS strategy call today to discuss your roadmap. You may also book a free one-time consultation with our qualified QSA.


The post PCI DSS 4.0 Readiness Roadmap: A Complete Audit Strategy for 2025 appeared first on Information Security Consulting Company - VISTA InfoSec.

EU Regulating InfoSec: How Detectify helps achieving NIS 2 and DORA compliance

By: Detectify

**Disclaimer: The content of this blog post is for general information purposes only and is not legal advice. We are very passionate about cybersecurity rules and regulations and can provide insights into how Detectify’s tool can help fit legal requirements. However, Detectify is not a law firm and, as such, does not offer legal advice.**

Navigating the complex and ever-changing compliance landscape is difficult for many companies and organizations. With many regulations, selecting the appropriate security tooling that aligns with the compliance needs of your business becomes a significant challenge.

This article provides insights into how businesses across the EU can effectively navigate compliance hurdles and make informed decisions when choosing security tools, particularly emphasizing the role Detectify can play in these crucial processes.

The EU Directive on Security of Network and Information Systems (The NIS 2 Directive), and the EU Digital Operational Resilience Act (The DORA Regulation) are some of the latest requirements that may be causing concern for companies. DORA is in force since January 2025, while the deadline for EU Member States to implement the NIS 2 Directive passed in October 2024.

At Detectify, we aim to support our customers by offering insight into these specific requirements and, notably, how our offerings can support organizations in achieving DORA and NIS 2 compliance.

The NIS 2 Directive – (EU) 2022/2555

The NIS 2 Directive is an EU-wide cybersecurity legislation, intended to widen the number of organizations actively making cybersecurity efforts in the EU, and to increase the magnitude of those efforts, by putting requirements on the security of networks and information systems. As it is an EU Directive (and not a Regulation), it must be transposed through national legislation in order to apply in the Member States. The deadline for such transposition was October 18, 2024, however the majority of Member States are lagging behind.

On 7 May 2025 the EU Commission reminded 19 Member States to transpose the Directive into national legislation. This includes Sweden. In Sweden, the government released their proposal for a new cybersecurity law to implement NIS 2 on June 12th 2025. The proposed legislation is going to enter into force on January 15th 2026.NIS 2 replaces and modernizes the previous NIS 1 directive in an attempt to keep up with the evolving cybersecurity threat landscape, covering many new sectors and introducing stricter requirements. A quick comparison of the NIS 1 and NIS 2 directives shows that the latter covers 18 sectors, while the former covers 7. The NIS 1 directive is 30 pages long, while NIS 2 is 73 pages long, which is an indicator for the increased complexity of requirements. Many companies in Sweden and across the EU will need to acquaint themselves with NIS 2 and adopt a risk-based approach to their system’s security.

Non-compliance fines will be higher than previously, and similar to the levels in the GDPR, as they will be calculated based on global annual revenue.

Who does it apply to? 

The requirements in the NIS 2 Directive apply to entities in sectors which are vital for the economy, society, and which rely heavily on ICT, such as energy, transport, banking, financial market infrastructures, drinking water, healthcare and digital infrastructure, and certain digital service providers (“essential and important entities”). Both private and governmental entities in the above-mentioned sectors are covered by NIS 2. Public administration entities are in scope as well.

At Detectify, we know we can make a difference

At Detectify, we’ve noticed significant parallels between specific industries, like the public sector, technology and digital services, which are the main focus of the NIS 2 Directive, and areas where Detectify’s tool excels. Our solution is specifically designed for sectors like these, which face issues like rapid digital innovation, leading to an increasingly large attack surface, and where there is need for secure cloud hosting while maintaining full visibility over the entire attack surface.

The Detectify advanced application security testing (AST) platform comprises two products: Surface Monitoring and Application Scanning. Surface Monitoring is key in discovering and mapping the customer attack surface by giving them a comprehensive view through continuous discovery and monitoring of all hosted Internet-facing assets. At the same time, Application Scanning provides deeper insights into custom-built applications and actual business-critical vulnerabilities with advanced crawling and fuzzing, delivering customized intelligent recommendations on what discovered assets warrant deep testing.

With Detectify’s platform, customers can apply appropriate technical measures to manage external risks from both known and unknown vulnerabilities that threaten their systems and digital services by mapping, identifying, and proactively managing risks before they materialize. Mapping your attack surface is the first step to understanding what is there from a risk management perspective.

In addition, the detailed vulnerability information and attack surface context provided by Detectify can be invaluable for understanding the scope, nature, and potential root causes of a security incident. This facilitates more accurate and timely reporting to authorities, as mandated by NIS 2’s stringent notification deadlines.

In today’s landscape, where cyber threats and attacks are part of day-to-day business and where many malicious players exist (small-scale players, professional black hats, and governmental players), the cyber security requirements posed on critical businesses and providers are a must.

– Cecilia Wik, Head of Legal, Detectify

To the point: Which NIS 2 requirements can Detectify help to fulfil? 

In short, the NIS 2 directive poses requirements on the security of networks and information systems through incident reporting and risk management and, of course, a responsibility for Member States to oversee and coordinate actions under the Directive.

Member States can adopt stricter cybersecurity requirements in their national legislations, as the NIS 2 Directive is a minimum harmonization directive. As the Directive is still not fully adopted in most Member States, we may see territorial differences within the EU. They will most likely, however, be minor, and most national implementations will be very similar to the Directive.

NIS 2 Article 21.1 outlines that essential and important entities must take appropriate and proportionate technical, operational, and organizational measures to manage the risks posed to the security of network and information systems which those entities use for their operations or for the provision of their services, and to prevent or minimize the impact of incidents on recipients of their services and on other services.

Furthermore, Article 21.2 sets out 10 different minimum requirements of such measures. Detectify can play a key role in the compliance work concerning several of these requirements:

Art. 21.2.a) Policies on risk analysis and information system security

The Policies on risk analysis mentioned in NIS 2 are meant to be put in practice. Effective risk analysis begins with a complete understanding of the assets one needs to protect. Detectify Surface Monitoring provides comprehensive asset discovery, offering visibility into “what you’re exposing online,” including potentially unknown or forgotten assets (shadow IT) and the technologies they run.17 This continuous discovery and inventory process is the foundational first step for any robust risk analysis.

Article 21.2.d) Supply Chain Security

While Detectify primarily focuses on scanning the customer’s own external attack surface, our scanning capabilities are vital for managing the customer’s side of supply chain interactions. It can identify vulnerabilities or misconfigurations on externally facing assets that, while owned by the customer, may interact with or be managed by third-party suppliers (e.g., a misconfigured cloud service provided by a vendor but exposed under the customer’s domain).

Article 21.2 e) Security in network and information systems acquisition, development, and maintenance, including vulnerability handling and disclosures

Detectify’s Surface Monitoring can scan the entire external infrastructure for a wide range of vulnerabilities, including misconfigurations, exposed sensitive files, known CVEs, and, critically, risks like subdomain takeovers. Our Application Scanning conducts in-depth vulnerability assessments of web applications. It supports authenticated testing (to find vulnerabilities behind login screens) and employs advanced fuzzing techniques to identify vulnerabilities.

The implementation in my Member State is lagging behind. What should I do in the meantime?

As many Member States are behind with the implementation, organizations may think it’s best to sit back and relax, and await the final implementation in their respective Member States. Depending on the business and structure of the organization, that may, however, not be the best approach. The EU Commission can issue fines to Member States that are delayed with implementing Directives, which means the 19 governments of the Member States that have not yet implemented the NIS 2 directive, have incentives to make sure national legislation is put in place fast. For organizations, this may mean that implementation can go faster than expected, and the time to get everything in place can suddenly be short. Especially if your organization is big and complex, with long lead times for important decisions and transformations, it’s better to get started now (if you haven’t already). As stated above, there can be some national deviations in the form of stricter requirements, but generally speaking, most national legislation will be very similar to the NIS 2 Directive. As such, most organisations can start their compliance work by looking at the requirements described in the Directive, while awaiting national legislation.

An additional aspect to keep in mind is that, while 19 Member States do not have national legislation in place yet, there are Member States that made the deadline. If you aren’t situated in any one of those Member States, but your business means that you supply products or services to organisations in those Member States, you may risk losing business if you can’t keep up with the NIS 2 requirements. Your customers are to some part required to push forward the requirements on their suppliers (explicitly through article 21.2.d – supply chain security), most likely including your company. On the other hand, if you already have robust information security efforts compliant with NIS 2 in place, even though you – formally – yet don’t have to, you may be able to gain

The Swedish Protective Security Act (2018:585)

While networks and information systems for a wide range of organizations are within the scope of NIS 2, EU Member States have their own national legislation concerning measures needed to protect national security. In Sweden, the Protective Security Act (Swedish: Säkerhetsskyddslagen) aims to protect the operations of entities of significance for Sweden’s national security. Such entities may hold sensitive information or carry out security-sensitive activities needing robust protection against terrorism, espionage, and sabotage

The Protective Security Act specifically requires entities to adopt preventive measures to protect the confidentiality, integrity, and accessibility of classified information, and to protect systems used to carry out security-sensitive activities from harmful impact.

NIS 2 and the Protective Security Act may overlap and be applied simultaneously in organizations that are covered by both, but the Protective Security Act has precedence based on the lex specialis principle.

Where Detectify comes in

Just as is the case with NIS 2 entities, entities covered by the Protective Security Act need to take action to make sure they can withstand threats, including cyber attacks. Continuous monitoring of attack surfaces can help entities covered by the Protective Security Act in those efforts. The same goes for similar national legislation in other EU Member States.

DORA – The Digital Operational Resilience Act (DORA) – EU Regulation 2022/2554

The aim of the DORA Regulation is to create a regulatory framework whereby financial firms, and –  importantly – also certain ICT providers, such as cloud service providers, will have to make sure they can withstand, respond to, mitigate and recover from all types of ICT-related disruptions and cyber threats. The focus for financial firms is, in other words, shifting from not only traditional financial resilience, to resilience in a wider sense, including digital resilience.

DORA is a Regulation, which, as opposed to NIS 2 which is a Directive, came into direct effect in EU Member States on January 17, 2025. Member States may adopt additional legislation on the same matter, but national implementation is not required for DORA to come into effect. This means that financial sector entities has had to be compliant with the DORA Regulation for almost half a year.  The rules have been further elaborated by the EU Commission, in the form of Regulatory Technical Standards (RTS), Implementing Technical Standards (ITS) and guidelines.

Who does it apply to? 

The DORA Regulation has a significant impact across the EU Member States.  It covers over 22 000 companies within the Union, harmonizing the financial sector’s operational resilience. It does not only affect financial institutions but also third-party service providers providing critical services to such institutions, such as cloud service providers.

What are the requirements? 

The DORA Regulation covers 5 central areas:

1) Governance and Risk Management
2) Incident Reporting
3) Testing of Digital Operational Resilience
4) Management of ICT Third-Party Risks
5) Information Sharing

Where Detectify comes in 

Detectify can help strengthen the resilience of financial institutions and ICT service providers by:

  1. Setting up protection and prevention measures within risk and governance by:
  • Firstly, mapping an organization’s external attack surface, where even unknown assets can be identified;
  • Secondly, setting up Surface Monitoring, which will keep such assets under continuous surveillance;
  • Lastly, applying Application Scanning, whereby customers can identify risks (vulnerabilities) and the actual scope of the threat landscape.
  1. Detectify users can promptly detect anomalous activities by using Application Scanning and by setting up specific monitoring rules under Detectify’s Attack Surface Custom Policies.
  2. Getting insights into identified vulnerabilities, their severity, and actional remediation tips to help teams prioritize and remediate threats more effectively.
  3. Enabling responsible disclosure of major vulnerabilitiesto authorities when needed, through the help of the vulnerability information provided by Detectify.

Closing remarks

We will continue to add updates to this post as we receive more information about regulations and their implications. As in the regulations above, Detectify emphasizes proactive cyber security and is passionate about helping its customers become more secure. In this article, we have covered only a handful of topical regulations that apply in the EU, and we know there are many more specific standards and regulations that may apply.

With Detectify’s Attack Surface Custom Policies, users can monitor for policy breaches as they occur in production. If a policy breach is detected, an alert is produced with helpful insights to help accelerate remediation.

Attack Surface Custom Policies leverage the complete coverage capabilities of Surface Monitoring to continuously monitor your external attack surface, ensuring your clearly-defined security policies are enforced, no matter the size of your attack surface. Many of our customers have built their own personalized compliance rules on their exposed web assets.

Are you interested in learning more about Detectify? Start a 2-week free trial or talk to our experts.

Q&A

Q: What is the main difference between the NIS 2 Directive and DORA?
A: The NIS 2 Directive sets a broad cybersecurity baseline for many critical sectors across the EU. DORA, in contrast, is focusing specifically on the digital operational resilience of the financial sector and its key technology suppliers.

Q: My organization is not in the financial sector. Do I still need to worry about DORA?
A: Not directly. However, if you are an ICT provider (e.g., a cloud service) for a financial institution, you will fall under the scope of DORA and must comply with its requirements.

Q: What is the first step to take for NIS 2 compliance?
A: A foundational first step is to conduct a thorough risk analysis, which begins with understanding your complete external attack surface. This involves discovering all internet-facing assets, including forgotten or unknown ones (shadow IT), to identify potential vulnerabilities.

This article was originally published in March 2024 and updated in June 2025

The post EU Regulating InfoSec: How Detectify helps achieving NIS 2 and DORA compliance appeared first on Blog Detectify.

A practitioner’s guide to classifying every asset in your attack surface

By: Detectify

TLDR: This article details methods and tools (from DNS records and IP addresses to HTTP analysis and HTML content) that practitioners can use to classify every web app and asset in their attack surface. You’ll learn to view your assets from an attacker’s perspective, enabling you to understand not only that an asset exists but also its exact nature. 

“You can’t secure what you don’t know exists.” It’s a common refrain in cybersecurity (and for good reason!). But the reality is a bit more complex: it’s not enough to just know that something exists. To effectively secure your assets, you need to understand what each of them is. Without proper classification, applying the right security processes or tools becomes a guessing game.

There’s a discrepancy between what you think you’re exposing and what you actually are exposing. Critically, an attacker only cares about what is actually accessible to them, not what you think it is. Research from Detectify indicates that the average organization is missing testing 9 out of 10 of its complex web apps that are potential attack targets. 

Imagine you’ve identified a few thousand assets exposed to the internet. The crucial next step is to determine what you are actually exposing. Different tools can help depending on what’s on your attack surface, but instead of focusing on specific tools right away, let’s concentrate on the methods and data points used to understand what each asset is. 

Data points for an outside-in perspective

Numerous data points can be used for classification. Let’s examine them in the order of a typical connection flow, assuming an outside-in, black-box analysis perspective. Internal network data or based on source code would require a different approach. 

Asset classification methods covered in this guide

Handshake

  1. DNS: Where is the DNS hosted? What types of pointers (A, CNAME, MX, etc.) are used? Where are they pointing? Are there informative TXT records (e.g., SPF, DKIM, DMARC)?
  2. IPs: Where is the IP address geographically located? What Autonomous System Number (ASN) does it belong to? Is it an individual IP or part of a larger range?
  3. Ports: Which ports are open or closed? How does the firewall behave (e.g., treatment of TCP vs. UDP, dropped vs. rejected packets)?
  4. Protocol/Schema: What protocol responds on an open port (e.g., HTTP, FTP, SSH)? Are there nested protocols (e.g., HTTP over TLS, WebSocket over HTTP)?
  5. SSL/TLS: Which Certificate Authority (CA) issued the certificate? What does JARM fingerprinting and handshake data reveal? What Subject Alternative Names (SANs) are listed?

Deep dive into HTTP

The data available for deeper classification heavily depends on the protocol encountered. For this blog post, we’ll focus primarily on HTTP, the backbone of web applications.

Key HTTP data points include:

  1. Response Codes: Is it a 200 OK, a 30X redirect (and where to?), or a 50X server error?
  2. Headers: Response headers are particularly rich, including custom X-headers, Cookies and security headers.
  3. File Signatures: These are unique identifiers forming part of a file’s binary data, often found in the first few bytes of a response body.
  4. Content-Type and Length: Is the response JSON, XML, HTML? What’s the size of the response?

Further down into HTML 

If the response is HTML, we can delve even deeper:

  1. Favicon: Many applications use default favicons. Hashing these icons can quickly identify known software.
  2. URL Patterns: Are there detectable patterns in URLs (e.g., /wp-admin/, /api/v1/, specific query parameter structures)?
  3. Meta-tags: name attributes (e.g., for description, keywords, generator) or http-equiv attributes (simulating response headers) can reveal underlying technologies or CMS.
  4. Form-tags: The structure, input field names, and action URLs within forms (especially login forms) can indicate specific systems.
  5. Links in Code: Are there hardcoded links to known sources, documentation, or license agreements?
  6. Code Patterns: Detectable patterns in JavaScript, HTML structure, or CSS can point to specific frameworks or libraries.
  7. Third-Party Resources: What external resources (scripts, images, APIs, tracking pixels) are being loaded, and from where?

Other Protocols

If we haven’t gone down the HTTP and HTML path (e.g., we’ve encountered an SSH or SMTP server), we would then look further into the binary response or protocol-specific handshake data to understand what software components are running. However, that’s a topic for another article.

Data Points Unpacked

When we examine each data point individually, significant opportunities for fingerprinting and understanding exposed assets emerge. Combining them provides even richer insights:

DNS

  • NS records and CNAMEs: Can be used to understand hosting providers (e.g., AWS, Azure, GCP), third-party SaaS applications, and CDNs/WAFs. Analyzing the domain name itself often yields this information.
  • DNS security records (e.g., SPF, DMARC): Can reveal third-party services used for functions like marketing automation or invoicing, which can be relevant for supply chain risk assessment or social engineering attack vectors.

Tools and Techniques: Manual inspection can be done with the dig command and basic human pattern recognition for small-scale analysis. For larger-scale testing, open-source tools like MassDNS can be highly effective.

IPs

  • ASN (Autonomous System Number): Helps determine organizational ownership, network size and scope, and geographical footprint. ASN data can also indicate underlying technology providers, as vendors often allocate IP blocks to different products or services.

Tools and Techniques: Nmap is a widely used tool for IP and port scanning. Alternatives for large-scale scanning include Zmap and MASSCAN. Whois lookups (command-line or web-based) are essential for ASN information.

Ports

Understanding which ports are open can help determine the firewall in place and the underlying systems running.

  • Single Ports: While specific ports are commonly associated with certain services (e.g., port 80 for HTTP), this isn’t guaranteed. Misconfigurations can lead to odd combinations of ports and services. Port status is an indication, not proof; probing the service is necessary for confirmation.
  • Combination of Ports: Certain combinations of open ports can strongly indicate an underlying system. For example, Cloudflare often presents a standard set of 13 open ports, while Imperva Incapsula might show all TCP ports as open.
  • Port “Spoofing”/Firewall Behavior: If a firewall detects a port scan, it might respond by showing no open ports, dropping packets, or indicating all ports are open. Analyzing this behavior in detail can provide clues about the edge device (firewall/WAF) in use.
  • Malformed Requests: Sending malformed requests that don’t adhere to RFCs can sometimes elicit responses that reveal more information than standard requests.

Tools and Techniques: For scanning at scale, masscan is fast, though it may produce a higher number of false positives. You’ll need to decide between speed and accuracy, as they often involve trade-offs. Nmap offers more accuracy and service detection features.

Protocol/Schema

The identified protocol/schema is connected to the combination of hostname (e.g., the Host header for domain fronting, or TLS-based routing using SNI), IP address, and port in the request.

  • Nested Communications: Communications can be nested. Many basic tools might not capture these nested communications, whether they result from intentional design or misconfiguration. This can lead to an incomplete understanding of what’s truly exposed.

Tools and Techniques: Nmap is the most known service. Other tools like JA4T (for TLS client/server fingerprinting) and fingerprintx can also help identify protocols and services.

SSL/TLS

  • Certificate Authority: Are certificates updated manually or automatically (e.g., Let’s Encrypt certificates are short-lived and usually automated)? Are different certificate authorities used in different parts of the infrastructure? This can hint at internal processes or even supply chain elements.
  • Subject Alternative Names (SANs): Is the certificate used for other domains? What can be learned from them? For example, google.com’s certificate lists over 50 domains under SAN.
  • JARM: Passively analyzing JARM hashes (an active TLS fingerprinting technique) can group disparate servers by configuration, identify default applications or infrastructure, and even fingerprint malware command and control servers.
  • Handshake Details: Different TLS server implementations respond differently when actively probed. Analyzing supported ciphers and TLS versions provides insights into the server’s configuration and potential vulnerabilities.

Tools and Techniques: JARM fingerprinting tools actively probe servers. Certificate Transparency (CT) logs are valuable public data sources for discovering issued certificates for domains, like crt.sh.

Deep Dive into HTTP Responses

Response Codes

A simple 200 OK status code might offer limited information in isolation. However, observing an application’s status codes in response to crafted payloads can be far more revealing. Different payloads will trigger different behaviors, and a WAF may interfere. Additionally, response codes can vary based on the user-agent and accept-header.

  • 10X (Informational): Commonly seen when upgrading to WebSockets or when Expect headers are used.
  • 20X (Successful): Limited use in isolation for system identification without further context.
  • 30X (Redirection): Redirect headers can give hints about underlying systems, authentication flows, or application structure. An example:
$ curl -v http://whitehouse.gov
* Trying 192.0.66.51:80...
* Connected to whitehouse.gov (192.0.66.51) port 80 (#0)
> GET / HTTP/1.1
> Host: whitehouse.gov
> User-Agent: curl/7.81.0
> Accept: /
>
* Mark bundle as not supporting multiuse
< HTTP/1.1 301 Moved Permanently
< Server: nginx
< Date: Wed, 16 Apr 2025 12:15:21 GMT
< Content-Type: text/html
< Content-Length: 162
< Connection: keep-alive
< Location: https://whitehouse.gov/
<
<html>
<head><title>301 Moved Permanently</title></head>
<body>
<center><h1>301 Moved Permanently</h1></center>
<hr><center>nginx</center>
</body>
</html>


The response body of the redirect clearly states that nginx is used.

  • 40X (Client Error): These are often very interesting, as they can be triggered with specially crafted payloads tailored to specific type of systems. Different systems have unique 404 pages or error messages.
  • 50X (Server Error): It’s not uncommon for 50X errors to present custom error pages or verbose error messages that can be connected to a specific system type, framework, or even programming language. If a 50X error can be triggered, you might be able to detect more. 


Tools and Techniques: Common web scanning tools like Burp Suite, combined with human ingenuity, can help us understand more. 

For example, sometimes triggering a non 200 status code might expose more information about a system or an underlying technology. As an example, if you’re looking to identify assets running IBM Notes/IBM Domino it can be helpful to request an nsf-file that does not exist.

Sending a GET request to example.com/foo.nsf can trigger a 404 response containing strings such as <h1>Error 404</h1>HTTP Web Server: IBM Notes Exception - File does not exist</body>.However, simply sending a request to a non-existing path such as example.com/foo will not trigger the same descriptive error.

Response Headers

This category is vast, so we’ll focus on key areas:

  • X- Headers: Custom headers can explicitly state technologies used by the target (e.g., X-Powered-By: Express, X-Generator: Drupal). Some X- headers are unique to specific technologies or intermediary devices.
  • Server Header: Often specifies the web server software (e.g., Server: Apache/2.4.58, Server: nginx).
  • Security Headers:
    • Content-Security-Policy (CSP): Can help understand the underlying resources being loaded, such as CDNs, cloud storage buckets for static assets, or types of tracking pixels/marketing systems used. (This can be invaluable for sales teams building prospect lists too!)
    • Example: Checking the CSP of paypal.com can reveal reliance on Salesforce:
$ curl -Iks https://www.paypal.com/se/home | grep -Eo '.{16}salesforce.{16}'
e.com https://.salesforce.com https://.f
l.com https://*.salesforce.com https://sec
  • Tools and Techniques: Command-line tools like concurl or HTTPie. Web fuzzers like ffuf, dirsearch, or gobuster (often used for content discovery) can also be used to observe header variations based on different paths or inputs.

File Signatures 

Many file types can be identified by the first few bytes of the file.

Tools and Techniques: The file command and other command like xxd or hexdump can be used to inspect these bytes.

Content-Type and Length

The combination of the Content-Type header and Content-Length can indicate application types:

  • Traditional web apps: Typically respond with HTML and longer Content-Length for full pages.
  • APIs: Respond with JSON, XML, and usually with shorter Content-Length for unauthenticated requests.
  • Single-Page Applications (SPAs): Typically respond with HTML, often containing at least one <script> tag, but generally with a much shorter Content-Length than traditional web apps.

Tools and Techniques: curl is useful here.

Further Down in HTML

Favicon Fingerprinting

With libraries of known favicons (or their hashes), this can be a very fast way to scan a large number of assets. Running favicon fingerprinting across broad domain sets can yield significant insights into the technologies used.

Tools and Techniques: Tools like httpx -favicon or platforms like Shodan (which has a favicon hash search) can automate this.

URL Patterns

The structure of URLs can be very revealing. The most basic example is the existence of an admin page at a specific path (e.g., /wp-admin for WordPress). Other examples are how product categories or user profiles are represented (e.g., /product/{id}, /user/{username}), the encoding used in parameters and the presence of directory listings.

Tools and Techniques: Wordlists of common paths can be sent with tools like Burp Intruder, ffuf, or dirsearch. Regex patterns can then be applied to the response data to identify interesting results.

Meta-Tags

  • name attribute: Default descriptions, keywords, or generator tags often indicate a specific CMS or framework.
    <meta name="generator" content="WordPress 6.2.2" />
    <meta id="shopify-digital-wallet" ...>
    <meta name="shopify-checkout-api-token" ...>
  • http-equiv attribute: Can be used in the same way as HTTP response headers and can therefore carry similar identifying information.

Tools and Techniques: These tricks are often hidden within tools and are typically opaque. Any DAST tool would fit into this category; Nuclei, for example, has open-source signatures for these purposes. Tools like Wappalyzer and WhatWeb could also be included, as they utilize similar techniques.

Form-Tags

The structure and patterns in form tags, especially for logins, along with their action URLs, can provide strong clues about the underlying CMS. 

Tools and Techniques: Some tools that can be used are Wappalyzer, WhatWeb, curl+grep. 

Code Patterns 

Looking at code patterns involves identifying characteristic snippets, function names, variable naming conventions, CSS class structures, or HTML element arrangements typical of certain frameworks or libraries.

When analyzing code patterns, we are increasingly using statistical and linguistic models to match identified applications with known examples. One approach is to examine the linguistic structure of the code and remove all plain text content. However, this process becomes more challenging when the code is obfuscated or compressed.

Tools and Techniques: BishopFox has utilized bindings for Tree-sitter to parse the abstract syntax tree (AST) of JavaScript. Detectify co-founder and security researcher Fredrik Almroth has explored ANTLR for similar purposes, specifically aiming to parse GraphQL. Some useful links are https://tree-sitter.github.io/tree-sitter/ and https://www.antlr.org/. Comparing tree structures after obtaining an AST involves a relatively advanced field of mathematics. 

Links in Code 

It’s not uncommon for CMSs, themes, or plugins to include default links to their documentation or license agreement. For example:

<a href="https://www.espocrm.com" title="Powered by EspoCRM"
Powered by <a href="http://ofbiz.apache.org"
href="https://about.gitea.com">Powered by Gitea 

Third-Party Resources

Applications frequently load third-party resources, and both the type and location of these resources can provide insights about the application itself. This information can reveal details about any supply chain dependencies or technical components being utilized. For instance, the presence of an analytics platform (such as Amplitude) typically suggests that the application is of significant importance and is actively being developed. 

Tools and Techniques: Wappalyzer provides this information, highlighting unique properties that may exist in external JavaScript, such as those hosted on CloudFront, which is a great source for links, domains, API operations, and more. Occasionally, these JavaScript files might contain sensitive information. Some interesting links to bookmark are TruffleHog and KeyHags.

Combining all methods 

While individual data points are helpful, their true power is unlocked when combined. Only then can we answer more elaborate and critical questions about our attack surface. One might envision an AI agent piecing this together, but a more standard approach involves defining the question and then selecting the appropriate data points and tools needed.

Some questions might require only a single data point, while others necessitate combining many to achieve an acceptable confidence level in the classification. Consider these:

  • Do we have stale DNS endpoints?
  • Are we adhering to internal policies for approved Certificate Authorities?
  • Are our redirects configured correctly, and are their targets appropriate?
  • Are we following our internal security policies regarding the desired tech stack?
  • Are all applications covered with appropriate protection?
  • Where are all our APIs?
  • Is our Configuration Management Database (CMDB) accurate and up-to-date with what’s actually exposed?
  • How comprehensively are we assessing our attack surface?

Systematically collecting and analyzing these diverse data points can help security teams move beyond simple asset discovery to a much deeper understanding, classification, and potentially testing of their web applications. Some tools can automate asset classification and deliver intelligent recommendations on what assets are potential attack targets and warrant deep testing. 

Are you interested in learning more about Detectify? Start a 2-week free trial or talk to our experts.
If you are a Detectify customer already, don’t miss the What’s New page for the latest product updates, improvements, and new vulnerability tests. 

The post A practitioner’s guide to classifying every asset in your attack surface appeared first on Blog Detectify.

DNS is the center of the modern attack surface – are you protecting all levels?

By: Detectify

If you are a mature organization, you might manage an external IP block of 65,000 IP addresses (equivalent to a /16 network). In contrast, very large organizations like Apple may handle an astonishing 16.7 million IP addresses or more (about a /8 network). However, this isn’t the case for many of us. IP addresses are fixed assets and can be costly, so most modern organizations do not have a large number of directly assigned IP addresses for every service they expose to the internet. 

Instead, it’s common to configure exposure through the Domain Name System (DNS). It’s not uncommon for an organization to have over 100,000 DNS records. While changes to firewall rules are often tightly regulated through Information Security Management System (ISMS) processes, modifications to DNS records are usually made with much less oversight. For instance, development teams might update DNS records directly using infrastructure as code via Terraform or similar It’s important to manage your DNS carefully, as numerous risks can arise from inadequate control.

Even if you believe you have full control over your DNS, there are still many risks that can crop up along the path from the DNS Root to the actual software lookup.

DNS levels

A basic DNS lookup involves several key components that work together to complete the final query:

  1. Root Servers: There are 13 root servers worldwide, which serve as the authoritative source for DNS information. (Fun fact: the majority of these servers are located in NATO countries.)
  2. Top-Level Domain (TLD): These manage the different domain extensions, such as .com, .io, and others.
  3. Registrars: This is where you go to purchase your domain name.
  4. DNS Providers: Often associated with hosting services, content delivery networks (CDNs), or registrars, these providers facilitate DNS management.
  5. Zones: This refers to the configuration settings for the domain you have purchased.
  6. Your software sends DNS queries: This is the implementation of DNS that enables communication between machines that wish to connect with each other.

DNS can break at many levels – and it can be hard to detect

DNS was originally built for a different time, when only a small number of computers were connected over a network built on trust. The same applies to many other protocols still in use today, including SMTP and BGP. 

Since its original implementation, there have been several enhancements, such as DNSSEC, which help improve technical security. DNSSEC adds cryptographic signatures to existing DNS records to ensure their authenticity.

However, DNS management often remains a manual process, leading to issues that can arise from simple typos. Compounding the problem is the fact that many types of DNS-related vulnerabilities cannot be detected from within the network or tested in a staging environment.

DNS lookup 

Establishing communication begins with a DNS lookup. While information may be cached locally, if not, the following steps will be involved.

  • Step 1: Check your local DNS cache/stub-resolver. If the information is present, proceed to Step 9. If not, continue to Step 2.
  • Step 2: The resolver queries the root server for information about the Top-Level Domain (TLD).
  • Step 3: Retrieve information about the TLD and then proceed to Step 4.
  • Step 4: The resolver requests information from the TLD server about the specific domain.
  • Step 5: Obtain information about the domain and move on to Step 6.
  • Step 6: The resolver queries the domain for information regarding detectify.com.
  • Step 7: Retrieve information about detectify.com and then proceed to Step 8.
  • Step 8: The DNS resolver responds with the record information related to the domain.
  • Step 9: Connect to the server that operates the application for detectify.com.
  • Step 10: Enjoy state-of-the-art security testing!

DNS issues at each level

Root

  • Implications: 
    • At the root server level, the security implications for applications are limited – the 13 root servers have very few publicly reported security incidents. 
    • However, the query process listed above can be vulnerable to hijacking through Border Gateway Protocol (BGP) manipulation, with several countries attempting to control information access in this way.
  • Real-world example: Facebook once published incorrect BGP information that resulted in them effectively locking themselves out of their own service
  • Actions: While these issues may seem less relevant for organizations other than major tech giants like Facebook, Google, or Microsoft, it’s crucial for those operating critical infrastructure to consider how access to that infrastructure could be manipulated or disrupted, as evidenced by the Facebook incident.

Top-level domains (TLDs)

Registrars

  • Implications: When it comes to managing registrars for your app, there are significant security implications, particularly since some top-level domains (TLDs) have only one registrar while .com has thousands. It’s essential to evaluate your trust and relationships with your registrar, as issues can arise from domains expiring or not being renewed, misspellings in domain names, or employees registering rogue domains.
  • A real-world example is the Swedish Transport Administration, which faced downtime for not paying an invoice to their registrar
  • Actions: 
    • To mitigate risks, it is crucial to monitor expiration dates for domains diligently and ensure that payment information remains current.
    • Implement a strict process for managing domains to avoid potential threats and disruptions.

DNS providers

  • Implications: DNS providers play a crucial role in the security of applications, and misspelled name server (NS) pointers can have significant implications.
  • Real-world example: For instance, Mastercard had a misspelled pointer to an Akamai domain for years
  • Actions: Considering the potential risks associated with misconfigured DNS settings, automation could be a valuable tool in preventing these types of errors and protecting applications.

Zones and subdomains

  • Implications: Understanding the implications of zones and subdomains is critical for the security of your application. 
    • Misspelled zones and expired underlying cloud resources (potentially leading to subdomain takeovers) pose a significant risk. 
    • Email security mechanisms like MX, DKIM, DMARC, and SPF are controlled within zone information, proving the importance of proper zone management.
  • Actions
    • Given that a compromised zone can lead to the unauthorized issuance of certificates, It’s highly advisable to implement automated controls for larger zones due to the rapid changes in both DNS and cloud resource statuses. 
    • Adopt a four-eyes principle for changes to help ensure that all configurations going live are thoroughly evaluated and accurate, reducing potential vulnerabilities.
    • Keep an eye on SSL transparency logs for certificate issues related to domains you own, even if they are not directly issued to you.

Software DNS Queries

  • Implications:  It is not only the configuration of your own domains that matters. In most cases, a modern application loads a significant amount of external resources. The security of this process is then dependent on the domain from which the resource is being loaded. This significantly increases the practical attack surface of your applications. 
  • Actions: Monitor the status domains for the underlying resources. Leverage SRI features to validate what is being loaded.

Let’s recap

Many components within the DNS chain can break and are difficult to detect. When dealing with more than a few hundred DNS entries, automation becomes a need. The severity of DNS-related vulnerabilities can vary significantly, ranging from merely informational to highly critical. Traditional vulnerability management systems often overlook these types of misconfiguration vulnerabilities.

Subdomain takeovers are highly contextual; if you cannot compromise other systems or directly access user data (such as cookies) through your takeover, they are typically not considered severe. However, if you control one out of many Name Server (NS) delegations for the root (apex) zone, the situation is arguably worse than the most severe form of SQL injection. Over time, this could give you access to all traffic destined for the vulnerable domain, including its subdomains.

Automation is crucial for managing these risks as your attack surface expands. Learn how Detectify can help. Start a 2-week free trial or talk to our experts.

If you are a Detectify customer already, don’t miss the What’s New page for the latest product updates, improvements, and new vulnerability tests. 

The post DNS is the center of the modern attack surface – are you protecting all levels? appeared first on Blog Detectify.

Making security a business value enabler, not a gatekeeper 

By: Detectify

The traditional perception of security within an organization is as a barrier rather than a facilitator, imposing approval processes and regulations that inevitably slow down operations. In this blog post, along with our friends at Knowit Experience, we explore how a new mindset keeps growing. One that embraces security as an enabler and a business value contributor. 

No more eye-rolls

Organizations’ security departments have traditionally operated as a barrier rather than a facilitator, imposing lengthy processes and controls that required other teams to navigate complex approval systems. This would often lead to inevitable sighs and eye-rollings when someone mentioned the word “security”. Times have changed – we’re now in a climate where agility is crucial and the slightest bureaucracy can significantly hinder innovation and efficiency. Employees know this, and to avoid being faced with red tape they might find workarounds, ultimately undermining the whole original purpose of security.

There’s a focus on delivering customer value faster and more efficiently than ever before. Consequently, the vast majority of organizations have adopted frequent code releases to production, with SaaS companies leading the pack by pushing new releases at least weekly. Where does this leave security? If not properly integrated, organizations will either fail to move at the required pace or have to sacrifice their security posture. 

Shifting the narrative 

To shift the narrative, it is essential for security teams to adopt the role of enablers rather than gatekeepers. But what does that exactly mean?

It’s a reality that each organization has its own security workflows and criteria for what is an acceptable risk in its business context. Not everything is an outright vulnerability. The challenge for many security teams is how to ensure that every team adheres to these internal policies. This is a daunting task, especially as the organization’s attack surface gets bigger and more complex.

Security in action

Let’s picture a realistic scenario in which an organization’s security teams act as enablers rather than gatekeepers: teams across the organization are constantly adding new assets and technologies without the security team being aware. Despite this, the security team is still accountable for ensuring these assets are secured.

This lack of visibility would create many internal policy breaches that can go unnoticed for months, or even years. However, today, these teams have the option of proactively monitoring their attack surface and setting up their own custom policies to be alerted as soon as an asset does not comply. 

In a world where security is focused on proactive monitoring rather than requiring upfront approvals for every action, organizations can monitor potential risks in real-time without interrupting workflows. Security becomes a protective force that supports operational efficiency.  

Own security together

With that said, we know that security teams should act as enablers. But it doesn’t end there. This mindset should extend throughout the entire organization. Everyone should adopt a security-first approach. When security teams work to support rather than hinder progress, and when developers and other teams are empowered to build securely from the outset, organizations can operate at the necessary pace while maintaining safety.

Security should not be an afterthought but rather a core component of the development cycle. By embedding good practices within developers’ daily routines, organizations can create seamless flows that protect assets without causing disruption. 

The payoff

A security-as-enabler approach allows for faster and safer operations and provides organizations with added business value, including increased customer trust, enhanced brand reputation, continuous business operations, and easier navigation of the current compliance landscape

Expert take

To gain a clearer understanding of how organizations are evolving to the notion of security as an enabler, we have the opportunity to consult with Dennis Adolfi – Head of Tech at Knowit Experience, a global IT agency that assists organizations in succeeding with their digital transformation efforts.

What’s your take on the meaning of being an enabler?

Being an “enabler” means creating conditions that empower an organization to explore new solutions—such as AI—without being paralyzed by fear of unknown threats. By establishing strong security processes and strategies, teams can manage risks continuously instead of shutting down innovative initiatives prematurely. In other words, a solid security posture can actually foster a culture of innovation rather than hindering it.

What common mistakes do companies make that prevent security from acting as an enabler for their organization? What should they be doing?

One major mistake is treating security solely as an IT issue. When security is labeled to a specific department, organizations lose the holistic perspective needed to protect their entire business. The most successful organizations we work with view security as a shared responsibility, where different teams collaborate and integrate security considerations from the earliest stage in the development cycle (“shift left”).

What trends will likely have an impact on organizations’ security strategy and operations?

AI and other non-deterministic systems are becoming increasingly central, making it harder to anticipate and circle the attack surface. This calls for a more structured approach to threat analysis—such as Threat Modeling and frameworks like the NIST AI RMF—and for tools capable of identifying unexpected vulnerabilities in real time, such as Detectify. By combining a broad, inclusive approach to security, a collective sense of responsibility, and systematic methods for threat analysis, organizations can both increase their capacity for innovation and maintain a strong security posture.

Security that works

It is no wonder that the key to effective security in the modern organization is to shift its perception from a blocker to an enabler. Only when security is seen as a facilitator of progress, rather than an impediment, will it truly be embraced and effective.

“Security needs to be pragmatic, it needs to be seen as a business enabler not as a blocker to be taken seriously. However, pragmatism does not mean undermining the importance of security.” Photobox case study, the story of a company that succeeded at transforming security as an enabler for faster product development.

Are you interested in learning more about Detectify? Start a 2-week free trial or talk to our experts.

If you are a Detectify customer already, don’t miss the What’s New page for the latest product updates, improvements, and new vulnerability tests. 


The post Making security a business value enabler, not a gatekeeper  appeared first on Blog Detectify.

How to Prevent a Subdomain Takeover in Your Organization

By: Detectify

When was the last time you checked DNS configurations for subdomains pointing at services not in use? According to Crowdsource ethical hacker Thomas Chauchefoin, while expired and forgotten subdomains can easily become an entry point for an attacker to steal sensitive data and launch phishing campaigns, having the right tool in place can keep them at bay

It’s no secret that with increasing third-party services and more subdomains, comes a larger attack surface, therefore a higher risk of potential cyber threats. The basic premise of a subdomain takeover is a host that points to a particular service (e.g. GitHub pages, Heroku, Desk, etc) not currently in use, which an adversary can use to serve content on the vulnerable subdomain by setting up an account on the third-party service. As a hacker and a security analyst, Chauchefoin who has dealt with this type of issue, reveals how it can be risky for your business. 

How subdomain takeover was discovered 

Subdomain takeover was pioneered by ethical hacker Frans Rosén and popularized by Detectify in a blog post back in 2014. Many years on, it has continued to build on the technology. However, it remains an overlooked and widespread vulnerability. Even companies that claim to prioritize security, such as Sony, Slack, Snapchat, and Uber, have been victims of subdomain takeovers. 

Moreover, Microsoft, too, struggled with managing its thousands of subdomains, many of which were hijacked and used against users, its employees, or for showing spam content. Its subdomains are vulnerable to basic misconfigurations in their respective DNS entries. Chauchefoin adds that these issues remain either unfixed or unknown as subdomain takeovers might not be part of the company’s bug bounty program. The main reason is, he says, that most companies have poor DNS hygiene, which then opens the door to all kinds of abuse that can then be part of larger and more dangerous attack campaigns on your organization and its stakeholders. 

Subdomains – gateway into the inner workings of an organization

Subdomains are not limited to the attack surface an organization has direct control – such as internal domains and apps you build – but also external attackable points. A subdomain takeover can be particularly problematic because subdomains aren’t always closely guarded assets, which means they can go undetected for some time. 

If left unmonitored for vulnerabilities and misconfigurations, you can run into the risk of being unaware of what’s happening to your company’s subdomains resulting in a malicious actor taking control. Once attackers have access to the subdomain’s name servers or registrar account credentials, they can get another entity with access to modify delegation records so the subdomains point toward their own nameservers rather than the originals. It’s already too late to recover. 

These breaches ultimately lead to data loss, brand reputation damage, and stolen customer data for the enterprise. 

Many companies have subdomains pointing to applications hosted by third parties that lack proper security practices. Don’t be one of them

Danger Danger: Dangling CNAME records

There are many ways cybercriminals could exploit unmonitored subdomains to steal information or deface sites. Malicious hackers are finding it easier to take over or exploit the vulnerabilities in the third-party assets within the enterprise’s ecosystem to carry out attacks such as malicious code injection, DNS hijacks or abusing the branded assets of an enterprise. In many instances, password managers automatically fill out login forms on subdomains belonging to the main application. As Chauchefoin recalls, “I still remember that the password manager LastPass used to auto-fill passwords even on subdomains, which could be dangerous in the case of targeted attacks.”

A subdomain takeover attack is a type of attack in which an attacker successfully seizes control over the subdomain in a hijacked DNS. When a DNS record points to a resource that isn’t available, the record itself should be removed from your DNS zone. If it hasn’t been deleted, it’s a “dangling DNS” record and creates the possibility for subdomain takeover. An attacker can leverage that subdomain to perform attacks like setting up phishing forms. 

How a hacker takes over a subdomain 

The most common situation is when a dangling record points to an expired online asset. By creating an account on this platform and claiming this subdomain, the attacker can deploy arbitrary content on it. It could help them to perform further attacks such as having an impact on primary domains pointing to resources on the one that was just taken over. “It’s also common to point to IP ranges like EC2 or OVH, where attackers could try to rent multiple servers and get the same IP as the previously used if they are lucky enough,” Chauchefoin says. 

Detailing on the process, Chauchefoin proclaims that a subdomain takeover is rather easy to accomplish. It simply entails creating an account on a platform and claiming the subdomain.

Let’s assume that domain.com – a site owned by you – is the target and has a subdomain helpdesk.domain.com linked to a Support Ticketing-service. While enumerating all of the subdomains belonging to domain.com, the attacker who stumbles across helpdesk.domain.com, can find out where it belongs by reviewing the subdomain’s DNS records and could potentially take it over if it was abandoned. If an attacker were to take ownership of helpdesk.domain.com, they could build a convincing clone of an official support website, or even of domain.com. Then, by using spear phishing techniques or waiting for victims to fall in the trap via search engines, they could steal sensitive information from them. It would be practically impossible for users to know that they just arrived on a fake, attacker-controller website as the domain name is legit.

Attackers could then push malware, host static resources under this subdomain or expose services, which could then establish a proxy making helpdesk look like domain.com while intercepting the traffic when anyone visits helpdesk.domain.com.

Takeover method #1

Chauchefoin points out that when trying to take over a subdomain, the most common workflow for a hacker is to start with extensive “reconnaissance” to discover existing DNS records. “After the reconnaissance phase, hackers will try to look for any anomaly in the DNS records and probe the exposed services to look for errors which indicate that it is a dangling domain,” he says. Hunters often rely on services that were not originally intended for that use. For instance, Certificate Transparency databases – the open framework for monitoring SSL Certificates – contain millions of entries and are a gold mine, he adds. In many cases, attackers may be able to obtain and install a valid TLS certificate for the vulnerable subdomain to serve their phishing site over HTTPS. Other active techniques involve brute-forcing subdomains based on lists of most common values, naming conventions and permutations. This is where the hacker iterates through a wordlist and based on the response can determine whether or not the host is valid.

Takeover method #2

Another way to do it would be to compromise the target’s DNS servers or even the registrar to change the DNS records associated with the targeted domain. While this method is less common, Detectify co-founder and security researcher Fredrik Nordberg Almroth did it with the .cd ccTLD where he claimed the expiring name server for the Democratic Republic of Congo’s top-level domain before it was going to enter into deletion status.

Takeover method #3

Hackers can also execute second-order subdomain takeovers where vulnerable subdomains which do not necessarily belong to the target are used to serve content on the target’s website. This means that a resource gets imported on the target page, for example, via JavaScript and the hacker can claim the subdomain from which the resource is being imported. More on this, soon to follow. 

Three ways you can fail if you overlook the risk

An attacker can make use of stale DNS records to own the AWS S3 bucket or point to your subdomain, there is no longer a use by your organization. Therefore, it can be used to target your users, leak their account details via XSS and phish pages hosted on your companies’ domains. In many cases, an attacker can easily steal a victim user’s cookies and credentials via XSS if they are allowed on the subdomain.

In addition to serving malicious content to users, attackers can potentially intercept internal emails, mount clickjacking attacks, hijack users’ sessions by abusing OAuth whitelisting and abuse cross-origin resource sharing (CORS) to harvest sensitive information from authenticated users.

Seemingly a subdomain takeover can be dangerous, Chauchefoin says that a subdomain takeover may pose a relatively minor threat in itself and is generally part of a bigger picture or attack. However, when combined with other seemingly minor security misconfigurations, it may allow an attacker to cause greater damage. 

…larger enterprises face a bigger risk as they can have thousands of subdomains

Why Blue Teams need to care

The impact of a subdomain takeover depends on the nature of the third-party service that the vulnerable subdomain points to. The need to keep a track of all subdomains are not limited to companies transitioning to the cloud. 

Chauchefoin says that company executives forgetting about created subdomains is increasingly common. Consequently, it is vital for any Blue Team to be able to identify any change or vulnerability on external assets. “An up-to-date map of public-facing services helps in taking accurate decisions when it comes to removing the legacy ones to reduce the overall attack surface,” he continues. 

Of course, subdomain takeover is a risk for any company irrespective of the industry, however, Chauchefoin believes that larger enterprises face a bigger risk as they can have thousands of subdomains. For instance,some time ago The Register reported that subdomains of Chevron, 3M, Warner Brothers, Honeywell, and many other large organizations were hijacked by hackers who redirected visitors to sites featuring porn, malware and online gambling. 

Keeping track of your subdomains

Many companies have subdomains pointing to applications hosted by third parties that lack proper security practices. Don’t be one of them. When determining plausible attack scenarios with a misconfigured subdomain – more so after an attacker controls it – it is crucial to understand how the subdomain interacts with the base name and the target’s core service and how these subdomains are used in applications within your infrastructure. 

Detecting that a subdomain takeover is being actively exploited is difficult; you may realize it too late. Once a bad actor claims your subdomain, you might not know in time as it will not show up in a scan. The attacker might even put a cat meme on the page and by then, the damage is already done. Remember the hacker ‘Pro_Mast3r’ who took over Donald Trump’s fundraising website due to a DNS misconfiguration issue? The hacker replaced secure2.donaldjtrump.com with an image of a man wearing a fedora with the message:

“Hacked By Pro_Mast3r ~
Attacker Gov’
Nothing Is Impossible
Peace From Iraq.”

What can you do? 

Given the urgency to tackle the risk of expired or forgotten subdomains, bringing in external attack surface monitoring can be beneficial. It identifies subdomains that have been misconfigured or unauthorized, so you can find and fix them before a subdomain takeover happens. External subdomain monitoring can help you do a subdomain takeover risk analysis and map out your external attack surface by looking at all expired subdomains. Chauchefoin says, “Going forward, tools like Detectify will become part of the essential toolkit of any Blue Team, as they provide a considerable value for a fraction of the cost of what it would have been to perform it using non-automated means.”

Where Detectify comes in

Chauchefoin explains, It is hard to keep up with the constant feed of new public vulnerabilities and update vital services in a timely manner. Assuring service continuity is a very costly process, and not all vulnerabilities have the same level of criticality.” As a result, tools like Detectify can help your team prioritize this task by notifying them of the presence of actual exploitable vulnerabilities on the perimeter. In fact, Detectify has over 600+ unique techniques to discover subdomain takeovers. Identifying subdomain takeovers is tricky business as they rely on signature-based tests which are prone to false positives due to outdated signatures.

It is impossible for a single person to stay updated with new vulnerabilities and possible misconfigurations. Integrating a team of hackers in this process allows companies to get actionable proof-of-concepts for virtually every new public research, and even zero-days. Detectify leverages a Crowdsource community of over 400 handpicked ethical hackers, who monitor your subdomain inventory and dispatch alerts as soon as an asset is vulnerable to a potential takeover. Its community of bug bounty hunters constantly monitors targets for changes and continuously has an eye on every single subdomain that they can find.

See what Detectify will find in your online attack surface. Start a 2-week free trial or talk to our experts.

If you are a Detectify customer already, don’t miss the What’s New page for the latest product updates, improvements, and new security tests.

Go hack yourself!

The post How to Prevent a Subdomain Takeover in Your Organization appeared first on Blog Detectify.

Enhancing Network Security: Best Practices for Effective Protection

By: Dr-Hack

In an era of escalating cyber threats, enhancing network security is paramount.

This article explores a comprehensive approach to network protection, encompassing network scanning, vulnerability and patch management, user access controls, network segmentation, and employee training.

Highlighting best practices and their importance, it provides critical insights for organizations aiming to bolster their defenses and safeguard their data effectively.

Dive in to understand the intricacies of implementing robust security measures in today’s digital landscape.

Key Takeaways

  • Regular network scans and vulnerability management are crucial for identifying and addressing vulnerabilities.
  • Patch management policies should be established to ensure timely updates and prioritize critical patches.
  • User access controls, such as strong authentication mechanisms and regular access reviews, help prevent unauthorized access.
  • Network segmentation limits the spread of attacks and allows for different security controls based on data sensitivity.

Network Scanning Techniques

Continually, organizations should employ a variety of network scanning techniques to identify potential vulnerabilities and strengthen their overall security posture. Utilizing robust network scanning tools, IT teams can probe their networks for open ports, weak configurations, and other potential weak points. These tools automate the often tedious task of scanning, enabling faster and more accurate detection.

However, identifying vulnerabilities is just the first step. Equally important is vulnerability prioritization, which involves analysing scan results to identify the most critical issues that need immediate attention. This process helps ensure that resources are allocated effectively, addressing high-risk vulnerabilities first.

This combined approach of network scanning and vulnerability prioritization is a fundamental component of a robust cybersecurity strategy.

Here are some of the most popular network scanning tools for :

  • Burp Suite: Best for comprehensive web vulnerability scanning 
  • Detectify: Best for ease of use and automation
  • Intruder: Best for cloud-based network security
  • ManageEngine OpManager: Best for real-time network monitoring
  • Tenable Nessus: Best for vulnerability analysis
  • Pentest Tools: Best for penetration testing
  • Qualys VMDR: Best for cloud security compliance
  • SolarWinds ipMonitor: Best for large-scale enterprise networks

Effective Vulnerability Management

A comprehensive vulnerability management process is an essential aspect of network security, encompassing the identification, analysis, prioritization, and remediation of potential network vulnerabilities.

Utilizing advanced vulnerability scanning tools, organizations can automate the identification of security loopholes in their network infrastructure. The process doesn’t end at identification; the data gleaned from these scans require careful analysis.

Vulnerability prioritization becomes a critical step here, enabling teams to focus their efforts on the most critical threats first, ensuring optimal use of resources. Once prioritized, vulnerabilities must be remediated promptly, necessitating a robust patch management program.

The continuous cycle of identification, analysis, prioritization, and remediation forms the backbone of an effective vulnerability management strategy, providing a proactive approach towards enhancing network security.

Implementing Patch Management

Building on the concept of vulnerability management, an equally significant aspect of network security is the implementation of a robust patch management policy. This involves identifying, acquiring, installing, and verifying patches for systems and applications.

  • Patch deployment strategies: An effective strategy ensures that patches are deployed promptly and efficiently. It may involve automated systems for large networks, or manual patching for smaller, more sensitive systems.
  • Patch testing methodologies: Before deploying a patch, it should be thoroughly tested in a controlled environment to check for compatibility issues or other potential problems.
  • Continuous monitoring: Post-deployment, it’s crucial to ensure patches are working effectively and haven’t introduced new vulnerabilities.

With these steps, organizations can fortify their defenses, keeping their network secure and resilient to potential attacks.

User Access Control Measures

Implementing robust user access control measures is a crucial step in bolstering network security and minimizing potential threats. The bedrock of these controls is enforcing password complexity requirements, ensuring that all users have unique, hard-to-crack passwords.

This involves mandating a mix of uppercase and lowercase letters, numbers, and special characters. While ensuring the set conditions are not so stringent that users start making sequential passwords which are even easier to brute-force.

Coupled with this, periodic password changes can further deter unauthorized access. Yet, password measures alone may not suffice. Hence, implementing multi-factor authentication (MFA) is advised. MFA enhances security by requiring users to provide two or more verification factors to gain access.

This could be a combination of something they know (password), something they have (security token), or something they are (biometric verification).

These stringent measures, when applied correctly, greatly enhance network security. User awareness about limiting their cyber foot print is critical aswell.

Importance of Network Segmentation

In the organization’s pursuit for enhanced security, network segmentation emerges as a vital component. It essentially divides a network into several smaller parts, each acting as a separate entity. This approach yields significant benefits, especially in terms of bolstering the overall security posture.

  • Containment of threats: Segmentation restricts the lateral movement of threats, thereby limiting the spread of attacks.
  • Improved performance: By reducing network traffic, segmentation enhances the operational efficiency.
  • Tailored security policies: Different segments can have unique security policies based on their specific requirements.

Implementation of network segmentation, however, necessitates careful planning, along with regular monitoring and updates, to ensure its effectiveness in providing a robust defence against evolving cyber threats.

Firewalls and Access Control Lists

With the implementation of network segmentation, the utilization of firewalls and access control lists becomes an integral part of securing an organization’s network infrastructure.

Firewalls, when correctly configured, serve as a robust line of defense against unauthorized external access. They scrutinize inbound and outbound traffic based on predefined rules, blocking those which don’t comply.

Access control lists, on the other hand, enforce access control policies, defining who or what is allowed or denied access to a network resource. Both these tools, when used in conjunction, provide a formidable barrier against cyber threats.

However, their effectiveness is largely contingent on the accuracy of their configuration and the appropriateness of the applied access control policies. Regular reviews and updates are essential to maintain a robust defense.

Here are some of the most popular enterprise-scale firewalls:

  • Cisco ASA
  • Fortinet FortiGate
  • Palo Alto Networks Next-Generation
  • Cisco Meraki MX
  • Zscaler Internet Access

Employee Awareness Programs

Beyond the technical measures such as firewalls and access control lists, a crucial component in enhancing network security lies in the establishment of robust employee awareness programs. These programs aim to equip employees with the knowledge and skills necessary to detect, prevent, and respond to potential security threats. They play a pivotal role in phishing prevention and incident reporting, as employees are often the first line of defense against such attacks.

Regular training sessions on phishing prevention and safe online practices.
Hands-on workshops for recognizing and reporting suspicious activities.
Simulation exercises to test employees’ understanding and response to potential threats.

Cybersecurity Training Best Practices

A considerable part of an organization’s defense strategy should be dedicated to the implementation of effective cybersecurity training practices.

The cybersecurity training benefits are manifold and directly contribute to enhancing an organization’s overall security posture.

Training modules should be designed to address the most pertinent threats, including but not limited to, phishing, ransomware, and social engineering attacks.

To make the training more effective and practical, organizations can conduct phishing simulation exercises. These exercises allow employees to experience first-hand how these attacks occur, which in turn enhances their ability to identify and respond to real-life situations.

Additionally, regular updates to the training curriculum are necessary to keep pace with evolving cyber threats.

Plenty of online platforms, like Lumify Learn and Skillshare, provide online cybersecurity training, so it shouldn’t be hard to find one that addresses your company’s needs. Ultimately, a well-trained workforce is a fundamental layer of any robust cybersecurity strategy.

Conclusion

In conclusion, robust network security necessitates a multifaceted approach incorporating:

  • Regular network scanning
  • Efficient vulnerability and patch management
  • Rigorous user access controls
  • Strategic network segmentation
  • Consistent cybersecurity awareness training

These practices, when meticulously implemented, offer a formidable defense against cyber threats, thereby securing an organization’s data and systems.

Thus, enhancing network security is a paramount concern, requiring ongoing commitment and strategic planning to ensure effective protection.

The post Enhancing Network Security: Best Practices for Effective Protection first appeared on Internet Security Blog - Hackology.

YATAS - A Simple Tool To Audit Your AWS Infrastructure For Misconfiguration Or Potential Security Issues With Plugins Integration

By: Unknown


Yet Another Testing & Auditing Solution

The goal of YATAS is to help you create a secure AWS environment without too much hassle. It won't check for all best practices but only for the ones that are important for you based on my experience. Please feel free to tell me if you find something that is not covered.


Features

YATAS is a simple and easy to use tool to audit your infrastructure for misconfiguration or potential security issues.

No details Details

Installation

brew tap padok-team/tap
brew install yatas
yatas --init

Modify .yatas.yml to your needs.

yatas --install

Installs the plugins you need.

Usage

yatas -h

Flags:

  • --details: Show details of the issues found.
  • --compare: Compare the results of the previous run with the current run and show the differences.
  • --ci: Exit code 1 if there are issues found, 0 otherwise.
  • --resume: Only shows the number of tests passing and failing.
  • --time: Shows the time each test took to run in order to help you find bottlenecks.
  • --init: Creates a .yatas.yml file in the current directory.
  • --install: Installs the plugins you need.
  • --only-failure: Only show the tests that failed.

Plugins

Plugins Description Checks
AWS Audit AWS checks Good practices and security checks
Markdown Reports Reporting Generates a markdown report

Checks

Ignore results for known issues

You can ignore results of checks by adding the following to your .yatas.yml file:

ignore:
- id: "AWS_VPC_004"
regex: true
values:
- "VPC Flow Logs are not enabled on vpc-.*"
- id: "AWS_VPC_003"
regex: false
values:
- "VPC has only one gateway on vpc-08ffec87e034a8953"

Exclude a test

You can exclude a test by adding the following to your .yatas.yml file:

plugins:
- name: "aws"
enabled: true
description: "Check for AWS good practices"
exclude:
- AWS_S3_001

Specify which tests to run

To only run a specific test, add the following to your .yatas.yml file:

plugins:
- name: "aws"
enabled: true
description: "Check for AWS good practices"
include:
- "AWS_VPC_003"
- "AWS_VPC_004"

Get error logs

You can get the error logs by adding the following to your env variables:

export YATAS_LOG_LEVEL=debug

The available log levels are: debug, info, warn, error, fatal, panic and off by default

AWS - 63 Checks

AWS Certificate Manager

  • AWS_ACM_001 ACM certificates are valid
  • AWS_ACM_002 ACM certificate expires in more than 90 days
  • AWS_ACM_003 ACM certificates are used

APIGateway

  • AWS_APG_001 ApiGateways logs are sent to Cloudwatch
  • AWS_APG_002 ApiGateways are protected by an ACL
  • AWS_APG_003 ApiGateways have tracing enabled

AutoScaling

  • AWS_ASG_001 Autoscaling maximum capacity is below 80%
  • AWS_ASG_002 Autoscaling group are in two availability zones

Backup

  • AWS_BAK_001 EC2's Snapshots are encrypted
  • AWS_BAK_002 EC2's snapshots are younger than a day old

Cloudfront

  • AWS_CFT_001 Cloudfronts enforce TLS 1.2 at least
  • AWS_CFT_002 Cloudfronts only allow HTTPS or redirect to HTTPS
  • AWS_CFT_003 Cloudfronts queries are logged
  • AWS_CFT_004 Cloudfronts are logging Cookies
  • AWS_CFT_005 Cloudfronts are protected by an ACL

CloudTrail

  • AWS_CLD_001 Cloudtrails are encrypted
  • AWS_CLD_002 Cloudtrails have Global Service Events Activated
  • AWS_CLD_003 Cloudtrails are in multiple regions

COG

  • AWS_COG_001 Cognito allows unauthenticated users

DynamoDB

  • AWS_DYN_001 Dynamodbs are encrypted
  • AWS_DYN_002 Dynamodb have continuous backup enabled with PITR

EC2

  • AWS_EC2_001 EC2s don't have a public IP
  • AWS_EC2_002 EC2s have the monitoring option enabled

ECR

  • AWS_ECR_001 ECRs image are scanned on push
  • AWS_ECR_002 ECRs are encrypted
  • AWS_ECR_003 ECRs tags are immutable

EKS

  • AWS_EKS_001 EKS clusters have logging enabled
  • AWS_EKS_002 EKS clusters have private endpoint or strict public access

LoadBalancer

  • AWS_ELB_001 ELB have access logs enabled

GuardDuty

  • AWS_GDT_001 GuardDuty is enabled in the account

IAM

  • AWS_IAM_001 IAM Users have 2FA activated
  • AWS_IAM_002 IAM access key younger than 90 days
  • AWS_IAM_003 IAM User can't elevate rights
  • AWS_IAM_004 IAM Users have not used their password for 120 days

Lambda

  • AWS_LMD_001 Lambdas are private
  • AWS_LMD_002 Lambdas are in a security group
  • AWS_LMD_003 Lambdas are not with errors

RDS

  • AWS_RDS_001 RDS are encrypted
  • AWS_RDS_002 RDS are backedup automatically with PITR
  • AWS_RDS_003 RDS have minor versions automatically updated
  • AWS_RDS_004 RDS aren't publicly accessible
  • AWS_RDS_005 RDS logs are exported to cloudwatch
  • AWS_RDS_006 RDS have the deletion protection enabled
  • AWS_RDS_007 Aurora Clusters have minor versions automatically updated
  • AWS_RDS_008 Aurora RDS are backedup automatically with PITR
  • AWS_RDS_009 Aurora RDS have the deletion protection enabled
  • AWS_RDS_010 Aurora RDS are encrypted
  • AWS_RDS_011 Aurora RDS logs are exported to cloudwatch
  • AWS_RDS_012 Aurora RDS aren't publicly accessible

S3 Bucket

  • AWS_S3_001 S3 are encrypted
  • AWS_S3_002 S3 buckets are not global but in one zone
  • AWS_S3_003 S3 buckets are versioned
  • AWS_S3_004 S3 buckets have a retention policy
  • AWS_S3_005 S3 bucket have public access block enabled

Volume

  • AWS_VOL_001 EC2's volumes are encrypted
  • AWS_VOL_002 EC2 are using GP3
  • AWS_VOL_003 EC2 have snapshots
  • AWS_VOL_004 EC2's volumes are unused

VPC

  • AWS_VPC_001 VPC CIDRs are bigger than /20
  • AWS_VPC_002 VPC can't be in the same account
  • AWS_VPC_003 VPC only have one Gateway
  • AWS_VPC_004 VPC Flow Logs are activated
  • AWS_VPC_005 VPC have at least 2 subnets

How to create a new plugin ?

You'd like to add a new plugin ? Then simply visit yatas-plugin and follow the instructions.


How we tracked down (what seemed like) a memory leak in one of our Go microservices

By: detectify

At Detectify, the backend team is using Go to power microservices. We noticed one of our microservices had a behavior very similar to that of a memory leak.

In this post we will go step-by-step through our investigation of this problem, the thought process behind our decisions and the details needed to understand and fix the problem.

The post How we tracked down (what seemed like) a memory leak in one of our Go microservices appeared first on Detectify Blog.

❌