Reading view

There are new articles available, click to refresh the page.

Large-Scale Bitcoin Outflow: Matrixport Removes $352.5M From Binance

Bitcoin is holding firmly above the $92,000 level after several days of relief and a stronger-than-expected rebound across the market. Yet despite the positive price action, analysts remain deeply divided. Some interpret this move as a classic relief rally within a broader downtrend, warning that the macro structure still favors a deeper correction.

Others see the recent recovery as the first sign that Bitcoin may be stabilizing and preparing for another bullish phase. The uncertainty reflects the conflicting signals coming from both derivatives and spot markets.

Adding fuel to the discussion, new on-chain data from Arkham shows that Matrixport withdrew 3,805 BTC—worth approximately $352.5 million—from Binance within the last 24 hours. This is a significant development, as Matrixport is one of Asia’s largest crypto financial service platforms, founded by Jihan Wu, the co-founder of Bitmain. The firm provides institutional-grade investment products, lending, trading, and asset management solutions to high-net-worth clients and funds across the region.

Maxiport Bitcoin Withdrawals | Source: Arkham

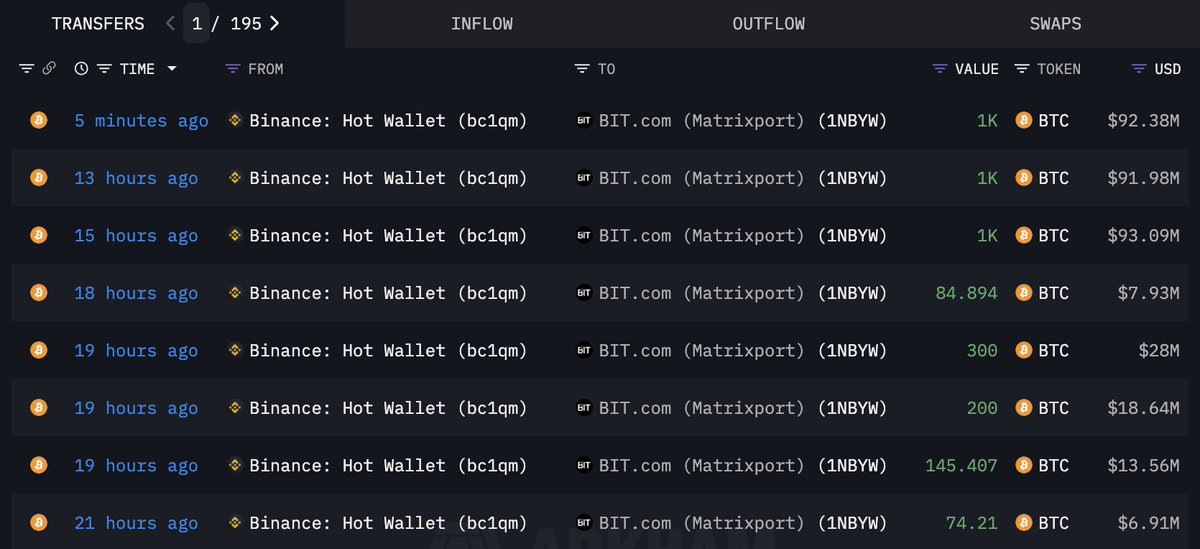
Large withdrawals from exchanges by institutions like Matrixport often signal accumulation, reduced selling pressure, or repositioning for custody and long-term holding. Combined with Bitcoin’s stabilization above $92K, this data adds an important layer of complexity to the current market outlook.

Institutional Positioning and a Changing Macro Landscape

Matrixport’s withdrawal of 3,805 BTC from Binance signals a potentially meaningful shift in institutional positioning. Large entities rarely move this size of capital without intention. Such withdrawals typically imply reduced selling pressure and a preference for custody over exchange liquidity, often interpreted as quiet accumulation.

For a firm managing billions in client assets, reallocating Bitcoin off exchanges suggests growing confidence in medium-term price stability or an expectation of improving market conditions.

This move arrives at a pivotal moment in the global macro environment. The Federal Reserve has ended Quantitative Tightening (QT), marking a major transition from liquidity withdrawal to a more accommodative stance. Historically, the end of QT has preceded periods of asset reflation, as systemic liquidity begins to stabilize.

At the same time, Japanese bond yields have surged, signaling stress in one of the world’s most influential funding markets. A spike in Japanese yields often triggers global liquidity adjustments, particularly through the carry trade, which can ultimately redirect capital toward risk assets—including Bitcoin.

Additionally, markets expect the Federal Reserve to cut interest rates soon, further easing financial conditions. Lower rates weaken the dollar, reduce funding costs, and typically stimulate inflows into alternative and high-beta assets.

In this environment of softening monetary policy and rising liquidity, Matrixport’s aggressive Bitcoin accumulation could reflect growing institutional conviction that the worst of the downturn is behind us—and that Bitcoin may be entering a more favorable macro phase.

BTC Price Analysis: Testing Recovery Momentum

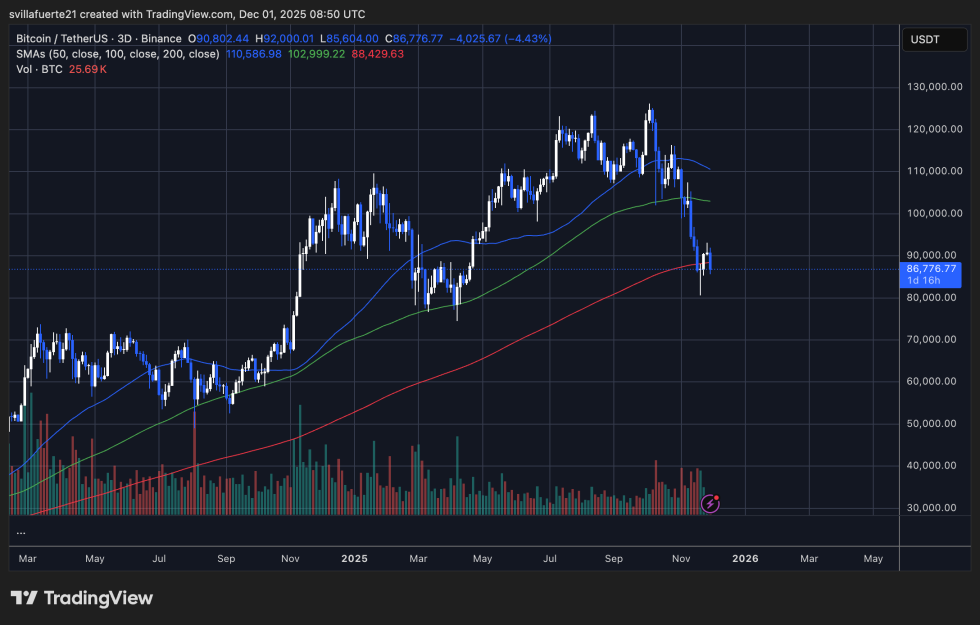
Bitcoin’s daily chart shows the market attempting to stabilize after the sharp decline that pushed price toward the mid-$80,000s. The rebound into the $91K–$93K zone marks the first meaningful recovery attempt, but the structure still reflects caution.

BTC testing critical demand level | Source: BTCUSDT chart on TradingView

BTC remains below the 50-day and 100-day SMAs, which have both started to slope downward, signaling that the broader trend has not yet shifted back in favor of the bulls. Until Bitcoin reclaims these moving averages with strong volume, the market will likely see this move as a relief rally rather than a confirmed reversal.

Price is currently consolidating above the 200-day SMA, a level that often acts as a long-term trend gauge. Holding this region is essential; losing it would risk a deeper drop toward earlier support zones near $82K–$84K. Volume activity during the bounce shows some improvement, yet it remains far below the levels seen during the late-October peak, suggesting that buyers are cautious and large players are not fully engaged.

The chart also shows a clear lower-high structure forming since September, confirming the bearish pressure that has dominated the last several weeks. For sentiment to shift decisively, BTC must break above $95K and rebuild momentum toward the psychological $100K mark. Until then, volatility and hesitation remain the defining features of this recovery.

Featured image from ChatGPT, chart from TradingView.com

Bitcoin Whales Go Defensive While Retail Remains Passive: A Tale of Two Markets

Bitcoin has fallen below the $90,000 level, intensifying speculation that the market may be entering the early stages of a broader bearish cycle. The drop comes as on-chain and derivatives data reveal a notable shift in investor behavior, especially among large holders.

According to a recent CryptoQuant report by Darkfost, whales have become significantly more active on Binance, driving a marked increase in BTC inflows to the exchange. This rise in transfers exceeding 100 BTC suggests that the market’s largest players have begun adjusting their positioning, often a sign of evolving risk attitudes and strategic repositioning.

Meanwhile, Bitcoin has been in a corrective phase for nearly two months, consolidating after its prior rally. This pause has been accompanied by a sharp contraction in Open Interest, which has fallen from $47.5 billion to roughly $29 billion today.

The decline reflects substantial disengagement from speculative positions, whether triggered by cautious profit-taking or by liquidations cascading through the derivatives market.

Whale Defense Intensifies as Retail Investors Remain Passive

Darkfost highlights that the rise in whale inflows—measured using a 90-day average—offers a deeper understanding of the current market mood. This metric shows that major holders are prioritizing protection in an increasingly uncertain environment.

Since Bitcoin’s last all-time high, the average whale inflow to Binance has effectively doubled, now approaching 4,000 BTC. Such an increase is rarely insignificant; it typically reflects hedging, de-risking, or preparing liquidity for active repositioning.

In contrast, inflows from retail investors have remained relatively stable and far less volatile. Their exchange activity has not experienced the same directional surge, suggesting that smaller market participants have not meaningfully adjusted their exposure. This divergence creates a striking behavioral split between investor classes.

Binance Whales/Retail Bitcoin Inflows | Source: CryptoQuant

While whales shift into a defensive posture—moving coins, reassessing exposure, and potentially preparing for further downside—retail participants appear more passive. This may indicate slower reaction times to macro and on-chain signals or simply lower capital at risk.

Historically, such patterns emerge during transitional phases in the market, when sophisticated holders take early precautionary measures before broader sentiment shifts. The growing contrast reinforces the idea that Bitcoin is navigating a phase where caution dominates among its biggest players.

Bitcoin Tests 200 SMA as Market Searches for Direction

Bitcoin’s 3-day chart shows a decisive shift in momentum, with price breaking below the 50 SMA and 100 SMA after weeks of persistent selling pressure. The failure to hold the $90,000 level pushed BTC into its sharpest correction since mid-2024, and the structure now reflects a market struggling to stabilize. The current candle cluster is forming directly on top of the 200 SMA, a historically significant long-term support zone that often separates cyclical uptrends from deeper bearish phases.

BTC consolidates around key level | Source: BTCUSDT chart on TradingView

The reaction so far has been mixed. BTC briefly dipped below the 200 SMA before recovering back above it, signaling that buyers are attempting to defend the trend boundary. However, the bounce lacks conviction, and volume remains elevated on down candles—an indication that sellers are still aggressive. As long as BTC trades below the 50 and 100 SMAs, the market structure remains vulnerable.

The downtrend also shows a clear sequence of lower highs and lower lows, confirming that momentum favors continuation unless $92,000–$95,000 is reclaimed. Losing the 200 SMA on a closing basis would open the door to deeper retracements toward $78,000 and $72,000, where prior consolidation zones sit.

Featured image from ChatGPT, chart from TradingView.com

Coinbase Wallet Rebalancing Creates False $68B LTH Distribution Signal – Details

The crypto market is facing a wave of misinterpretation as Coinbase’s large-scale wallet rebalancing, which began on November 22, 2025, continues to distort major on-chain indicators. Many dashboards now display what appears to be an unprecedented $68 billion Long-Term Holder (LTH) “sell” spike — but according to analysts, this is not real distribution. Instead, it’s the direct result of Coinbase transferring coins internally as part of its routine wallet restructuring process.

This distinction is critical. Several prominent analysts and market commentators have highlighted massive outflows, huge shifts in LTH supply, and unusual wallet movements, yet many have failed to mention the underlying cause: Coinbase’s internal reshuffling. Without this context, market participants might wrongly conclude that long-term holders are panic-selling at scale, reinforcing fear during an already fragile market environment.

These rebalancing events have happened before, but the size of Coinbase’s holdings means even normal internal operations can trigger dramatic spikes in on-chain metrics such as LTH Net Position Change, Exchange Netflow, and Spent Output Age Bands.

Coinbase Internal Transfers Distorted Key On-Chain Metrics

According to detailed analysis by Axel Adler, Coinbase’s internal migration of approximately 800,000 BTC created one of the largest distortions in on-chain data ever recorded — without a single coin being sold.

The exchange executed 286 transactions totaling 798,636 BTC, moving funds from legacy P2PKH (Pay-to-Public-Key-Hash) addresses to modern P2WPKH (SegWit) addresses. This technical reorganization produced an artificial $68 billion “realized profit” spike, misleading many market observers into interpreting it as massive long-term holder distribution.

LTH Cash Extraction Chart | Source: Axel Adler

This large UTXO migration disrupted several major on-chain indicators. LTH and STH Supply metrics were temporarily skewed, showing a sharp drop in Long-Term Holder supply and a rise in Short-Term Holder supply — a pattern typically associated with heavy “smart money” selling. In reality, no distribution occurred; Coinbase simply restructured its internal wallets.

The distortion also affected LTH Realized Profit/Loss models, which reflected tens of billions in phantom gains, and HODL Waves, where UTXO ages were “reset,” suggesting long-term holders had suddenly spent old coins. Even Coin Days Destroyed (CDD) showed a significant spike, mimicking an “old coin awakening,” though the activity was entirely internal.

These disruptions highlight how exchange operations can temporarily break the reliability of on-chain metrics, requiring careful interpretation from analysts and investors.

Total Market Rebounds but Remains Under Critical Pressure

The Total Crypto Market Cap chart shows a sharp rebound after tagging the $2.88T zone, a level that aligns closely with the 100-week moving average (green), acting as a key structural support in previous cycles. This bounce has pushed total valuation back above the $3T mark, but the broader trend remains fragile after weeks of heavy selling across majors like BTC and ETH.

Total Crypto Market Cap | Source: TOTAL chart on TradingView

Price structure highlights a clear breakdown from the $3.6T–$3.8T consolidation zone, followed by a fast, impulsive decline—mirroring the speed of corrections seen during 2021 and mid-2022. Despite the latest recovery candle, the market remains below the 50-week moving average (blue), signaling that buyers must regain momentum quickly to avoid deeper downside toward the 200-week moving average near $2T.

Volume has surged on recent sell-offs, showing widespread forced selling and capitulation behavior—a pattern consistent with cycle mid-reset phases. The rebound, however, shows reduced sell volume, suggesting exhaustion from bearish participants. To confirm strength, total market cap must reclaim the $3.25T–$3.3T area, which currently acts as the first major resistance.

Failure to break above this zone risks further consolidation or a retest of the $2.8T support. For now, the market shows early signs of stabilization, but broader recovery depends on Bitcoin’s ability to sustain its own rebound and restore confidence across altcoins.

Featured image from ChatGPT, chart from TradingView.com

❌