Reading view

There are new articles available, click to refresh the page.

Strategy’s Bitcoin Appetite Dries Up In 2025 — What Happened?

Strategy, the Michael Saylor-led corporate Bitcoin buyer long watched by investors, has sharply cut back purchases this year, according to CryptoQuant. Once a steady force of demand, its monthly buys have fallen dramatically, changing the way market watchers view institutional support for Bitcoin.

Sharp Drop In Monthly Purchases

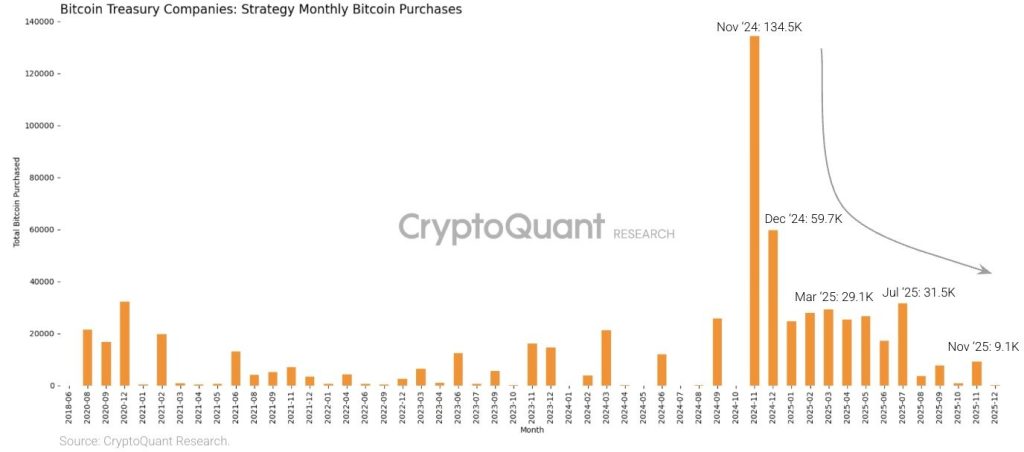
Based on reports, Strategy’s monthly accumulation peaked around 134,000 BTC in late 2024. By November 2025 that figure had dropped to roughly 9,100 BTC. That move amounts to about a 93% decline from the high-water mark. Buying this month was almost nil, with only 135 BTC recorded early in December. Those numbers show how quickly a major buyer can thin out.

Strategy’s Bitcoin buying has collapsed through 2025.

Monthly purchases fell from 134K BTC at the 2024 peak to just 9.1K BTC in November 2025, only 135 BTC so far this month.

A 24-month buffer makes one thing clear: they’re bracing for the bear market. pic.twitter.com/qEwXR3JQ82

— CryptoQuant.com (@cryptoquant_com) December 3, 2025

A Big Buy Amid The Pullback

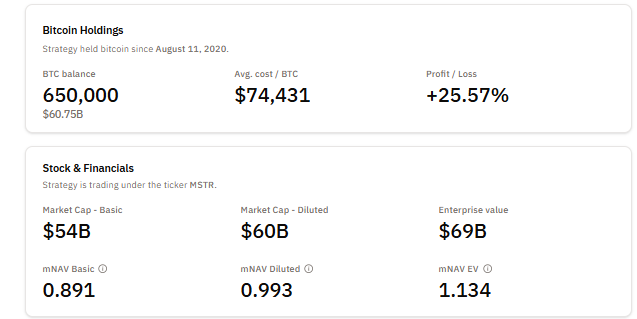
Reports have disclosed that on November 17, 2025, Strategy made a sizeable purchase of roughly 8,178 BTC, a buy worth near $835 million at the time. The purchase was the largest for the firm since July and pushed its total holdings to about 649,870 BTC. But while that single entry was large, it did not reverse the broader trend: overall monthly activity is far lower than it was a year earlier.

Big Holdings But More Cash On Hand?

According to CryptoQuant, Strategy has also piled up cash — about $1.4 billion has been set aside. That reserve is being held to cover dividend payments, debt servicing and other company needs. Observers say this signals a shift toward preserving liquidity rather than steady accumulation of Bitcoin. In other words, the company appears to be prioritizing cash stability over more buys for now.

What CryptoQuant And Others Are Watching

Market analysts are taking the slowdown as a warning sign that corporate appetite for Bitcoin treasuries may be cooling. If other big holders act the same, the structural demand that helped support prices could weaken.

Some traders will read the figures as a move to brace for a possible bear market. Others point out that Strategy’s enormous stash — nearly 650,000 BTC — still gives it room to ride out a downturn without having to sell immediately.

Key signals to monitor include the monthly purchase totals going forward and any change in Strategy’s cash holdings. Observers will be watching to see if the company returns to regular Bitcoin purchases or if the reduced buying becomes the standard.

It’s also important to monitor other corporate treasuries, because if several slowdowns occur together, the market for newly issued and available Bitcoin could tighten significantly.

Featured image from JRU, chart from TradingView

Bitcoin Signals Bear Market: One Thing Could Flip It, Says CryptoQuant CEO

Bitcoin may be sliding into a new bear phase unless fresh macro liquidity – particularly through spot ETFs – returns to the market, according to CryptoQuant CEO Ki Young Ju.

Bitcoin Bear Market Incoming?

Sharing a composite on-chain dashboard overlaid on the BTC price, Ju wrote on X: “Most Bitcoin on-chain indicators are bearish. Without macro liquidity, we enter a bear cycle.” The chart stacks ten CryptoQuant metrics behind the price in a red-to-green heatmap from 2021 to 2025, highlighting how regime shifts in prior cycles coincided with clusters of bearish readings.

The indicators in the panel include the MVRV Z-score, CryptoQuant P&L Index, the Bull-Bear Cycle Indicator, Inter-Exchange Flow Pulse, Network Activity Index, Stablecoin Liquidity, Bitcoin Demand Growth, Trader On-chain Profit Margin, Trader Realized Price and a Technical Signal metric. When the majority are bullish, the backdrop turns light green; when they flip bearish, it shifts to red. In the latest section of the chart, as BTC has pulled back from its highs, red once again dominates – the visual basis for Ju’s warning.

Bitcoin Bull Score Modell

For the next major move, Ju argues that on-chain data is now subordinate to macro conditions and ETF flows. Quoting his own post, he wrote: “It is simple. If you think macro gets better next year, you buy. Otherwise, you sell. I’m not a macro expert, so find macro bros. New ETF inflows are the key.”

That line pinpoints what he believes can “save” Bitcoin from a deeper drawdown: renewed demand from spot ETFs as a conduit for institutional capital. In earlier stages of the cycle, rising ETF inflows coincided with strong price appreciation; more recently, slowing or negative flows have mirrored the loss of upward momentum.

Ju frames the current environment as one that demands flexible scenario management rather than rigid forecasts. “At this stage, it is more about being reactive than predictive. Set your scenarios and trade accordingly,” he told followers. The composite chart is designed for exactly that purpose, showing how past bull tops and bear markets aligned with persistent stretches of red across profit, valuation and liquidity metrics.

Despite the bearish tilt, Ju does not foresee a repeat of the 2022 collapse, when Bitcoin fell roughly 65% from peak to trough. He cites the behaviour of Michael Saylor led Strategy as a stabilizing factor. “If Strategy holds its 650K BTC this cycle (or sells only a little), we would not see another -65% drawdown like in 2022,” he wrote. In his view, that supply remaining largely off the market reduces the probability of a violent deleveraging event.

Ju characterizes the current pullback as substantial but not extreme in historical context. “We are about -25% from ATH now, and even if a bear cycle comes, the downside would likely be smaller and look more like a broad sideways range,” he argued, suggesting that prolonged consolidation is more likely than a single dramatic crash.

His message to long-term investors is explicitly calming. “Long-term holders should avoid panic selling,” he advised. While cyclical on-chain indicators flash red, he insists the structural backdrop has improved: “Bitcoin has more liquidity channels now, so the long-term outlook is obviously strong, imo.” Those channels include ETFs and a deeper institutional market structure than in prior cycles.

At press time, Bitcoin traded at $92,494.

Bitcoin price

Bitcoin Market Signals A Pivotal Turning Point – Here Are The Main Drivers Behind It

Several key Bitcoin metrics are beginning to exhibit bullish action once again alongside the renewed upward traction in the asset’s price. With this kind of trend that points to growing momentum, the crypto king appears to be gearing up for a pivotal shift driven by newfound appetite from investors.

A Key Market Shift Unfolding For Bitcoin

Bitcoin has experienced a rebound as the crypto landscape turns bullish again, sending its price back above the $90,000 mark. Following the bounce on Wednesday, the BTC market appears to have reached a critical junction as it hints at an impending shift in the current trend.

Delving into the market performance, Darkfost, an author at CryptoQuant and market expert, has outlined the key driver behind the unfolding shift. In the research shared on the X platform, the expert revealed that the market today is heavily driven by derivatives. In addition to the derivatives-driven market, 2025 has been the most speculative year Bitcoin has ever seen in its existence.

Bitcoin

Another key driver highlighted by the market expert is the actions of investors in the United States and the renewed demand at the institutional level. Darkfost’s research hinges on a critical Bitcoin metric, one that shows the average evolution of the Coinbase Premium Gap in the monthly timeframe and the Spot Bitcoin Exchange-Traded Funds (ETFs) netflows.

Specifically, this metric is the Bitcoin ETF – Netflow USD Vs. Coinbase Premium. It is worth noting that the Coinbase Premium Gap calculates the pricing difference between Coinbase Pro and Binance. This helps illustrate the behavior of different groups of investors. While Coinbase Pro is typically used by institutions and whales, Binance, which has the largest volume, is available to everyone.

The Coinbase Premium Gap decreased from +$109 to -$40 since October 16, when Bitcoin was valued at almost $113,000. Such a drop suggests that institutional investors sharply decreased their positions. 

BTC ETFs Netflows Impact On The Market

Interestingly, the trend was also observed in ETF netflows, which also flipped negative. During the period, BTC fell from $113,000 to $80,000, reflecting how much the US and institutional demand influence the market

As seen in the past, large negative swings have frequently indicated market bottoms, provided that the trend thereafter begins to turn. A trend of this kind is what is playing out in the market today.

However, current data reveals that the Coinbase Premium Gap has bounced back to -$13 while the average ETF netflow is valued at around -$100 million. This comeback in both sectors indicates that in the near term, the situation seems to be improving, and BTC’s price is reacting appropriately to the crucial shift. 

As a result, Darkfost predicts that a new all-time high for BTC may happen quickly if this pattern continues in the long run. The ongoing shift may be subtle, but it is noticeable as the market appears to be preparing for a phase that might largely change the course of Bitcoin.

Bitcoin

Analyst Compares Buying XRP Now To Buying NVIDIA Shares In 2000 At $0.35

A crypto market analyst has compared XRP to NVIDIA, an American technology company with one of the biggest tech success stories in history. The analyst implied that buying XRP today could mirror the opportunity investors had when purchasing NVIDIA shares in 2000 at just $0.35. The comparison emphasizes the long-term potential of the XRP price and highlights the importance of HODLing. 

XRP Today Shows Growth Potential Like NVIDIA In 2000

A leading market expert, Egrag Crypto, has drawn a striking parallel between the current XRP price and the early days of NVIDIA. He suggested that buying XRP now could be akin to purchasing NVIDIA shares at just $0.35, as recorded in 2000. At the time of writing, the shares are priced around $180, representing a staggering 51,329% increase from over two decades ago. 

Egrag Crypto points out that a $10,000 investment in NVIDIA at $0.35 per share in 2000 would have secured roughly 28,571 shares. At today’s prices, those shares would be worth over $5,142,780, demonstrating an investment strategy focused more on maintaining conviction and patience than timing or predicting the market perfectly. Beyond this, the analyst’s comparison illustrates the power of investing long-term in disruptive technologies, showing how early adoption and willingness to hold through volatility can result in life-changing gains. 

Applying this perspective to XRP, Egrag Crypto highlighted that the cryptocurrency has surged from $0.006 to $3.65 over the past 10 years. By comparing the altcoin to NVIDIA shares, he suggests the cryptocurrency could have similar potential for transformative, explosive growth. As a result, he implied that the current XRP price of $2.2 may present a potential entry point for investors willing to commit to a disciplined long-term strategy. 

Much like NVIDIA in its early days around 2000, XRP is still in the initial stages of its growth trajectory. The cryptocurrency recently emerged from a prolonged legal battle with the US SEC that had constrained its development and price appreciation for nearly 7 years. With increasing utility and ongoing ecosystem developments, XRP is well-positioned to grow over time. While its price has declined roughly 20% this year, according to CoinMarketCap, analysts remain optimistic about its long-term outlook. 

XRP On-Chain Activity Hits Record Levels 

On the technical front, XRP has experienced a remarkable surge in on-chain activity, signaling heightened engagement across the network. Data from CryptoQuant shows that on December 2, the velocity metric for the XRP Ledger (XRPL) spiked to a yearly high of $0.0324.

Analysts from CryptoQuant have revealed that the rise in circulation velocity suggests that XRP is being actively traded rather than sitting idle in cold wallets. The increase points to high liquidity and significant participation from whales who appear to be moving large amounts of tokens.

XRP

Additionally, such activity indicates that the XRP network is experiencing unprecedented levels of engagement, with more coins changing hands in a short time than the market has seen so far in 2025. 

XRP

Strategy Sets $1.44B Buffer for Bitcoin Bear Market Risk: CryptoQuant

Strategy, the world’s largest corporate holder of Bitcoin, has set aside a $1.44 billion U.S. dollar reserve as a liquidity buffer against a prolonged market downturn, a move that analysts at CryptoQuant say signals preparation for a potential bear market phase.

The company, the world’s largest corporate holder of Bitcoin, raised the funds through ongoing at-the-market equity sales.

Strategy’s Bitcoin buying has collapsed through 2025.

Monthly purchases fell from 134K BTC at the 2024 peak to just 9.1K BTC in November 2025, only 135 BTC so far this month.

A 24-month buffer makes one thing clear: they’re bracing for the bear market. pic.twitter.com/qEwXR3JQ82

— CryptoQuant.com (@cryptoquant_com) December 3, 2025

The reserve is designed to cover dividend payments on preferred stock and service interest obligations for at least 12 months, with the stated goal of extending coverage to 24 months or more.

Strategy also disclosed that it may sell Bitcoin or Bitcoin derivatives as part of its risk-management toolkit if market conditions deteriorate.

Strategy Pivots to Dual-Reserve Treasury as Bitcoin Buying Slows

CryptoQuant described the move as a structural change from Strategy’s long-standing playbook of issuing equity and convertibles primarily to buy more Bitcoin.

Instead, the company is now operating a dual-reserve treasury model that pairs long-term Bitcoin exposure with short-term dollar liquidity aimed at reducing the risk of forced BTC sales during market stress.

The shift comes as Strategy’s pace of Bitcoin accumulation has slowed sharply through 2025. Monthly purchases fell from 134,000 BTC at the 2024 peak to 9,100 BTC in November 2025, with just 135 BTC added so far this month, according to CryptoQuant.

Source: CryptoQuant

The analytics firm said the scale and timing of the dollar buffer signal preparation for a sustained bear market.

Despite the slowdown, Strategy remains deeply exposed to Bitcoin. On Nov. 17, the firm bought 8,178 BTC for roughly $835.5 million in its largest purchase since July, bringing total holdings to about 650,000 BTC.

Strategy’s stock trades under the ticker MSTR, with a basic market capitalization of about $54 billion and an enterprise value near $69 billion.

Source: BitcoinTreasuries.NET

Market net asset value metrics show the stock trading close to the value of its Bitcoin holdings. Basic mNAV stands at 0.892, diluted mNAV at 0.994, and enterprise-value mNAV at 1.136, reflecting the effect of debt and preferred obligations.

Falling Shares Put Strategy’s Bitcoin Treasury Model Under the Microscope

CEO Phong Le has said the company would only consider selling Bitcoin if its shares fall below net asset value and access to new financing dries up.

He described such sales as a last resort to protect what he calls “Bitcoin yield per share,” stressing that selling would occur only if issuing new equity became more dilutive than reducing holdings.

Strategy’s annual fixed obligations tied to preferred shares are estimated at $750 million to $800 million. Le said the new dollar reserve currently covers about 21 months of dividends.

Founder and Executive Chairman Michael Saylor described the reserve as the next stage in Strategy’s evolution as a Bitcoin-focused treasury company, positioning it to navigate market volatility while maintaining its long-term digital-asset strategy.

To reassure investors, the company recently launched a “BTC Credit” dashboard, stating that it has sufficient dividend coverage even if Bitcoin prices remain flat for extended periods.

Strategy also said its debt remains well-covered if Bitcoin falls to its average cost of roughly $74,000 and remains manageable even at $25,000.

The reserve strategy has drawn mixed reactions from the market. Bitcoin critic Peter Schiff argued that the shift shows the company is being forced to sell stock to buy dollars rather than Bitcoin in order to meet its obligations.

Today is the beginning of the end of $MSTR. Saylor was forced to sell stock not to buy Bitcoin, but to buy U.S. dollars merely to fund MSTR's interest and dividend obligations. The stock is broken. The business model is a fraud, and @Saylor is the biggest con man on Wall Street.

— Peter Schiff (@PeterSchiff) December 1, 2025

Strategy’s share price has fallen more than 60% from recent highs even as Bitcoin has traded between $95,000 and $110,000 in late 2025, adding to investor scrutiny of the model.

Strategy’s stance is also being watched by index providers. MSCI is currently reviewing how companies with large digital-asset treasuries should be treated in major equity indexes.

Any change in classification could force benchmark-tracking funds to rebalance, adding another layer of volatility to a stock that already trades with a high Bitcoin beta.

The post Strategy Sets $1.44B Buffer for Bitcoin Bear Market Risk: CryptoQuant appeared first on Cryptonews.

Are Bitcoin Traders Pulling Back? Open Interest Plummets By 50% In A Sudden Market Reset

With the crypto market turning increasingly bearish, Bitcoin’s price has experienced another pullback, bringing it closer to the $80,000 mark once again. Along with the current drop in price, BTC’s derivatives market is showcasing bearish performance, suffering one of its steepest declines of the ongoing cycle.

Mass Derivative Unwind For Bitcoin

In a volatile landscape, Bitcoin’s Open Interest (OI) has contracted sharply as though the speculative framework supporting the market were suddenly removed. This steep drop in open interest comes after a sudden pullback in the price of BTC, causing it to lose the previously reclaimed $91,000 mark.

A report from Darkfost, a market expert and author at CryptoQuant, shows that the open interest has been sliced in half, indicating a drastic shift in investors’ sentiment and behavior. With a massive portion of leverage being evaporated, the market now stands unusually silent, while it prepares for its next decisive trigger.

Darkfost highlighted that Bitcoin leveraged positions continue to get liquidated or are being intentionally closed. Despite the recent drop in BTC’s price, this period of uncertainty is not bolstering traders’ enthusiasm to increase their exposure to risk.

Bitcoin

Currently, the market is exhibiting a risk-off attitude, a trend that is understandable given the current state of the crypto environment. As a result, the open interest of BTC has cleared a whopping $20 billion. Data shared by the expert shows that the key metric fell from 47.5 billion BTC to 28.35 billion BTC between October 6 and December, indicating a drop of half during the period. 

According to the expert, this is the worst flush in both the current cycle and the history of Bitcoin since the availability of the derivatives market. “I continue to say that the derivatives market has a major impact on Bitcoin and is the number one driver,” Darkfost stated.

BTC Percentage Loss Hits Historic Level

As the Bitcoin price continues to pull back, short-term BTC holders are feeling the weight of the waning action. These holders, also referred to as retail investors, have realized substantial losses from their positions. 

Darkfost’s research is based solely on the spot market. His objective is to identify a very particular group of investors who speculate over the short term. With a realized price of $113,692, BTC holders between 1 month and 3 months are now experiencing the largest percentage loss in the ongoing market cycle. 

For the past two weeks, this group of investors has been holding average unrealized losses between 20% and 25%. During his cycle, these phases have been linked with the creation of a bottom. This is because the cohort often has to decide between two behaviors: selling or holding.

In the event that a large portion of these traders are capitulating, this is typically the moment when the opportunity to accumulate BTC becomes more interesting, as observed in recent weeks. However, this setup becomes valid if the bullish trend remains intact in the long term, which Darkfost expresses trust in for the meantime.

Bitcoin

Bitcoin Miner Behavior Confirms Local Bottom Formation At $80,000 – Details

The Bitcoin (BTC) market continues to stabilize around $90,000 following a significant price recovery in the last week. Before these recent gains, the maiden cryptocurrency had undergone a heavy market correction, dropping about 36.10% from its all-time high of around $126,100.  Amid the ongoing consolidation, the latest data on Bitcoin miner activity suggests the asset may have hit a local bottom with sights now set on a sustained uptrend. 

Notably, market analyst BorisD shares on the CryptoQuant QuickTake platform an insight that suggests Bitcoin likely formed a local bottom as it dipped to $80,000 during its recent correction phase. The expert explains that this theory is confirmed by Bitcoin miners recording an underpaid status, which has historically been a strong signal in confirming a local market bottom. 

For context, Bitcoin miners become underpaid when the mining revenue, i.e., block rewards + fees, falls below miners’ average operating costs, resulting in financial stress, forced selling, and capitulation of certain miners, possibly due to bankruptcy.

Bitcoin Miners’ Economics In Influencing Market Ends

BorisD explains that Bitcoin miner profitability has been a consistent guiding metric in determining potential market tops or bottoms. For example, miner revenue in early 2024 reached intensely high levels as prices rallied strongly. This condition, created by a rise in transaction fees and block dollar value, allowed miners to become profitable to distribute supply to the market, thereby aligning early topping structures.

Bitcoin

By mid-2024, the market had created a pattern where capitulation zones often indicated local bottoms, and severely overpaid zones matched market tops with heavy liquidity outflows. Notably, this pattern held throughout late 2024, early and mid 2025, during which miners’ revenue alternated between the overpaid and underpaid zone.

As Bitcoin’s price struggled in Q4 2025, falling to around $80,000, BorisD explains that miners experienced another deep underpaid regime that completed a capitulation cycle, exhaustion of miner-driven selling pressure, but most importantly, confirmation of price local bottom.

Bitcoin Market Overview

At the time of writing, Bitcoin trades at $90,898 after a minor 0.64% gain in the past 24 hours. Meanwhile, the daily trading volume is down 36.32% to $38.77 billion.

According to BorisD, Bitcoin miners’ profitability is expected to continue improving, provided the market price stays above $80,000. This dynamic, in turn, supports a continuation of upward price momentum, potentially pushing Bitcoin toward another market top. Although the present market cycle has displayed atypical behavior compared to previous ones, analysts remain broadly optimistic. Many expect Bitcoin not only to recover but to eventually surpass its prior six-figure valuation.

Bitcoin

Bitcoin NPRL Returns To Neutral As Market Sits In Equilibrium – What This Means For Price

Blockchain analytics platform XWIN Research Japan shares that Bitcoin’s NPRL has returned to a neutral zone following a period of significant volatility. This development represents one of many positives following Bitcoin’s modest price gain over the last week.

NPRL Shows Balanced Market, New Trend Forms On Horizon

The Net Realized Profit and Loss (NRPL) is an on-chain metric that measures the total profit or loss that Bitcoin holders realize when they sell their coins at a given price. A positive NRPL suggests more BTC are being sold at a profit rather than at a loss, i.e., market participants are realizing gains, while a negative NRPL means more BTC are being sold at a loss than at a profit.

According to analysts at XWIN Research Japan, Bitcoin’s NPRL registered significant positive and negative deviations between November 22 and 24. However, the metric has stabilized in its neutral zone since November 25, as Bitcoin achieved a sustained market recovery. At near-zero NRPL, realized gains and losses are roughly balanced, suggesting market indecision or consolidation. This period usually comes after periods of market capitulation, marking a transition from a volatile phase to a calmer market environment.

Bitcoin

As earlier stated, the stabilization of NRPL aligns with Bitcoin’s price action, which has recently risen to steady around the $90,000 range. The lack of significant upward or downward pressure suggests that the market is digesting recent volatility and building a foundation for future movements. Analysts at XWIN state similar NRPL neutralization from the past phases has preceded the emergence of new trends, indicating BTC price may be consolidating for a new direction.

What Next For Bitcoin? 

Looking ahead, XWIN Research Japan states the critical factor will be whether NRPL maintains its position above the zero line or slips back into negative territory. A sustained positive NRPL would indicate improving demand and healthier inflows, potentially supporting a stronger recovery. Conversely, a return to negative NRPL could signal renewed weakness and the potential for another round of selling pressure.

In summary, the recent pattern, from deep negative swings to positive spikes, followed by convergence near zero, demonstrates that the market’s internal structure has largely reset and has completed its clearing phase for a new price trend to emerge.

At the time of writing, Bitcoin trades at $90,485 after a minor 0.65% loss in the last 24 hours. Meanwhile, its daily trading volume is up by 14.06% and valued at $57.04 billion.

Bitcoin

Major Ripple Developments That Could Trigger An XRP Price Surge

Crypto firm Ripple recently achieved a major milestone, providing a bullish outlook for the XRP price. XRP is also seeing significant demand amid the launch of the U.S. spot ETFs, which could trigger a price surge for the altcoin. 

Ripple Developments That Are Bullish For The XRP Price

In a press release, Ripple announced that its stablecoin RLUSD has gained recognition as an accepted Fiat-Referenced token by Abu Dhabi’s financial regulator. This enables the use of the stablecoin within the region’s financial markets. This marks a positive for the XRP price, as it could boost RLUSD’s demand, thereby increasing the demand for the altcoin as the native token of the XRP Ledger. 

Notably, the on-chain analytics platform Sentora (formerly IntoTheBlock) recognized RLUSD as one of the fastest-growing stablecoins, with its market cap increasing by 38.8% over the last month. Meanwhile, this development follows Ripple’s completion of the Hidden Road deal, which also strategically boosts RLUSD demand and positively impacts the XRP price.  

Meanwhile, crypto pundit SMQKE recently highlighted a U.S. Consumer Financial Protection Bureau report that acknowledged Ripple’s role in revolutionizing the cross-border payments industry through XRP. The report also suggested that Ripple’s payment system could be integrated into the traditional financial system, which would also be huge for the XRP price. 

Notably, the report specifically alluded to Ripple’s growth and expanding partnerships, which could make its payment platform the go-to choice for cross-border remittances. Meanwhile, XRP serves as the bridge currency for the effective settlement of these transfers. It is worth mentioning that Ripple Chief Technology Officer (CTO) David Schwartz has also assured that stablecoins cannot replace XRP’s role as the bridge currency on the XRP Ledger (XRPL). 

XRP’s Demand Is On The Rise

A CryptoQuant analysis revealed that the XRP reserves on Binance are plummeting, which could also trigger an XRP price surge. This development comes amid the launch of the U.S. XRP ETFs. The analysis suggested that institutional demand for the altcoin via these ETFs may have contributed to the decline in Binance’s reserves

Binance’s XRP reserves are said to have been steadily decreasing since October and have now dropped to around 2.7 billion XRP, which is one of the lowest levels ever on the exchange. CryptoQuant revealed that roughly 300 million XRP have left the exchange since October 6. The analysis noted that this indicates that real demand is building, which is bullish for the XRP price. 

XRP

Bitcoinist recently reported that institutions last week dumped Bitcoin, Ethereum, and Solana for XRP, which was one of the few majors to record inflows amid the broader outflows from crypto funds. If this demand trend for XRP continues, the CryptoQuant analysis stated the XRP price could enter a more structured phase amid expanding institutional interest. 

At the time of writing, the XRP price is trading at around $$2.21, up in the last 24 hours, according to data from CoinMarketCap.

XRP

Ethereum Market Structure Evolves As Futures Demand Becomes The Dominant Driver

Ethereum’s price is displaying signs of bullish momentum once again as the leading altcoin reclaims the $3,000 mark following a rebound across the broader cryptocurrency market. While the price has picked up pace, the ETH derivatives market is heating up, with futures demand rising sharply compared to the spot market.

Futures Appetite Surges Ahead Of Spot Buying

With the price of Ethereum displaying renewed upward strength, the altcoin appears to be changing its tempo, and this change is not coming from where most traders typically look. A recent report from CryptoQuant, a leading on-chain data analytics platform, has revealed a notable divergence between the futures and spot markets.

In the quick-take post, market expert and author with the pseudonym Crazzyblockk highlighted that the futures markets have accelerated significantly while spot activity continues to lag behind. Simply put, demand for futures is surging ahead of spot buying, indicating a shift among ETH investors or traders.

When this key trend emerges, it often serves as an early tremor that frequently precedes more significant developments in Ethereum’s narrative. It suggests that individuals betting on tomorrow may write the next chapter of ETH price action instead of accumulating today.

Ethereum

Over the last several days, ETH’s futures-to-spot ratio has steadily moved higher from the mid-5 range to nearly 6.9 on the most recent reading. Crazzyblockk stated that the rising multiple shows there is a fast increase in speculative interest around Ethereum than spot market participation. What this means is that traders positioning through leveraged markets are expanding rather than acquiring through spot.

In comparison to other major digital assets in the dataset, ETH currently holds the most robust futures demand relative to its spot volume. While Bitcoin and Solana maintain stable ratios in the 3.5–4.5 zone, the altcoin remains the leader and is widening the gap. 

ETH Traders Are Choosing Directional Exposure

The divergence points to an environment where traders are opting for directional exposure in ETH more aggressively than in other large assets. Meanwhile, the increase in futures participation could be a sign of impending catalysts or growing expectations for volatility unique to the Ethereum ecosystem.

According to the market expert, the consistency of this upward trajectory is important to the market. When market players expect greater short-term price movement, a rising futures multiple usually arises. Currently, the data indicates that Ethereum traders are sharply positioning ahead of potential trend acceleration.

However, whether this development leads to a persistent upward momentum or short-term volatility, the path remains clear. The behavior reflects heightened conviction and a noticeable change in Ethereum’s trading dynamics toward those driven by derivatives.

At the time of writing, the ETH price was trading at $3,007, demonstrating a 0.73% decline in the last 24 hours. Its trading volume has sharply dropped in the past day by more than 33%, indicating waning sentiment among ETH investors.

Ethereum

❌