Reading view

There are new articles available, click to refresh the page.

Ethereum Tightens Uptrend Structure as Market Eyes Another Wave of Gains

Ethereum price started a fresh increase above $3,200. ETH is now consolidating gains and might aim for more gains above $3,250.

  • Ethereum started a fresh increase above the $3,050 and $3,120 levels.
  • The price is trading above $3,120 and the 100-hourly Simple Moving Average.
  • There is a short-term contracting triangle forming with support at $3,130 on the hourly chart of ETH/USD (data feed via Kraken).
  • The pair could continue to move up if it settles above the $3,240 zone.

Ethereum Price Eyes Another Upside Break

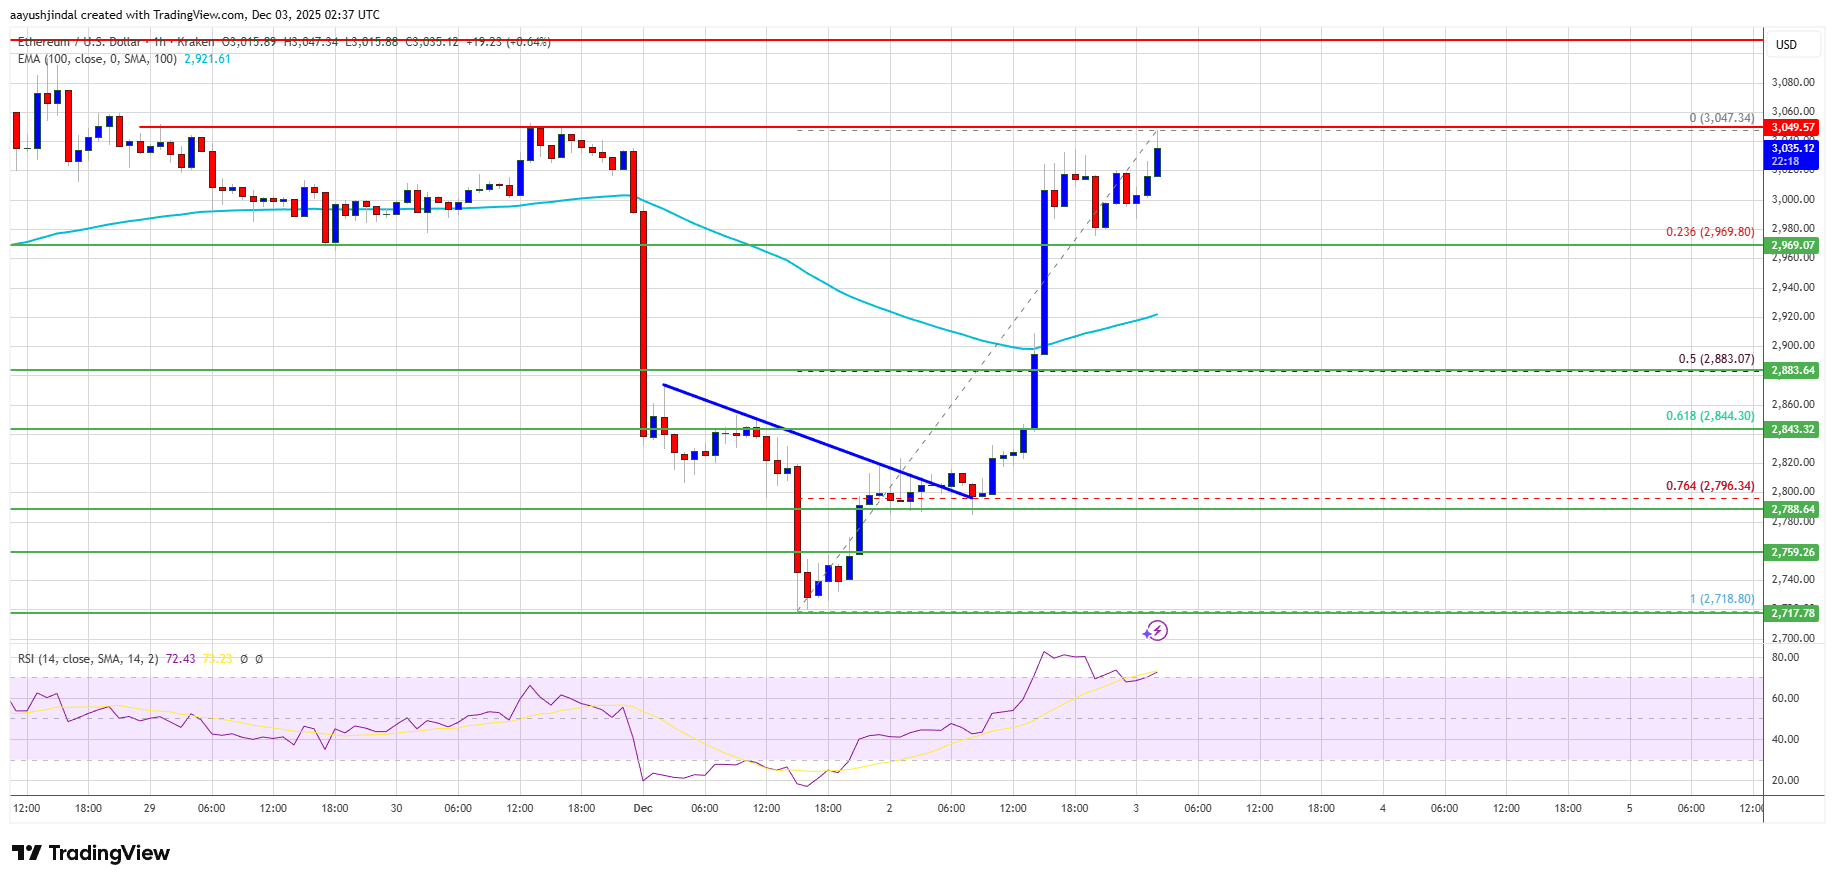
Ethereum price managed to stay above $2,920 and started a fresh increase, like Bitcoin. ETH price gained strength for a move above the $3,000 and $3,050 resistance levels.

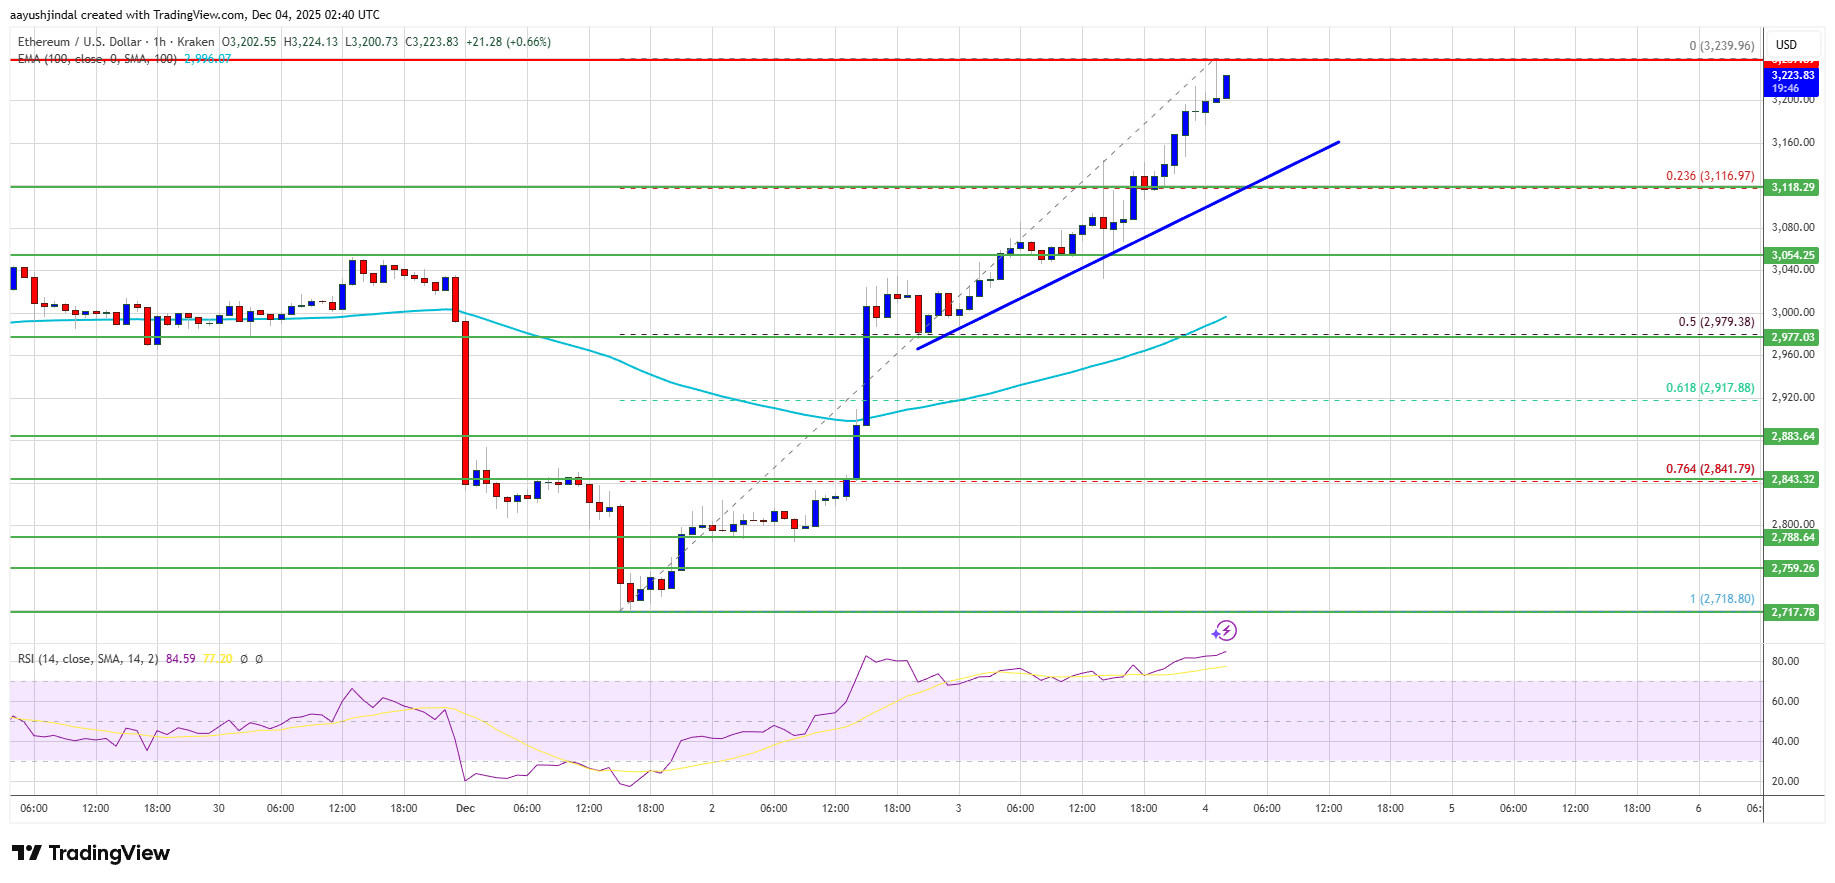
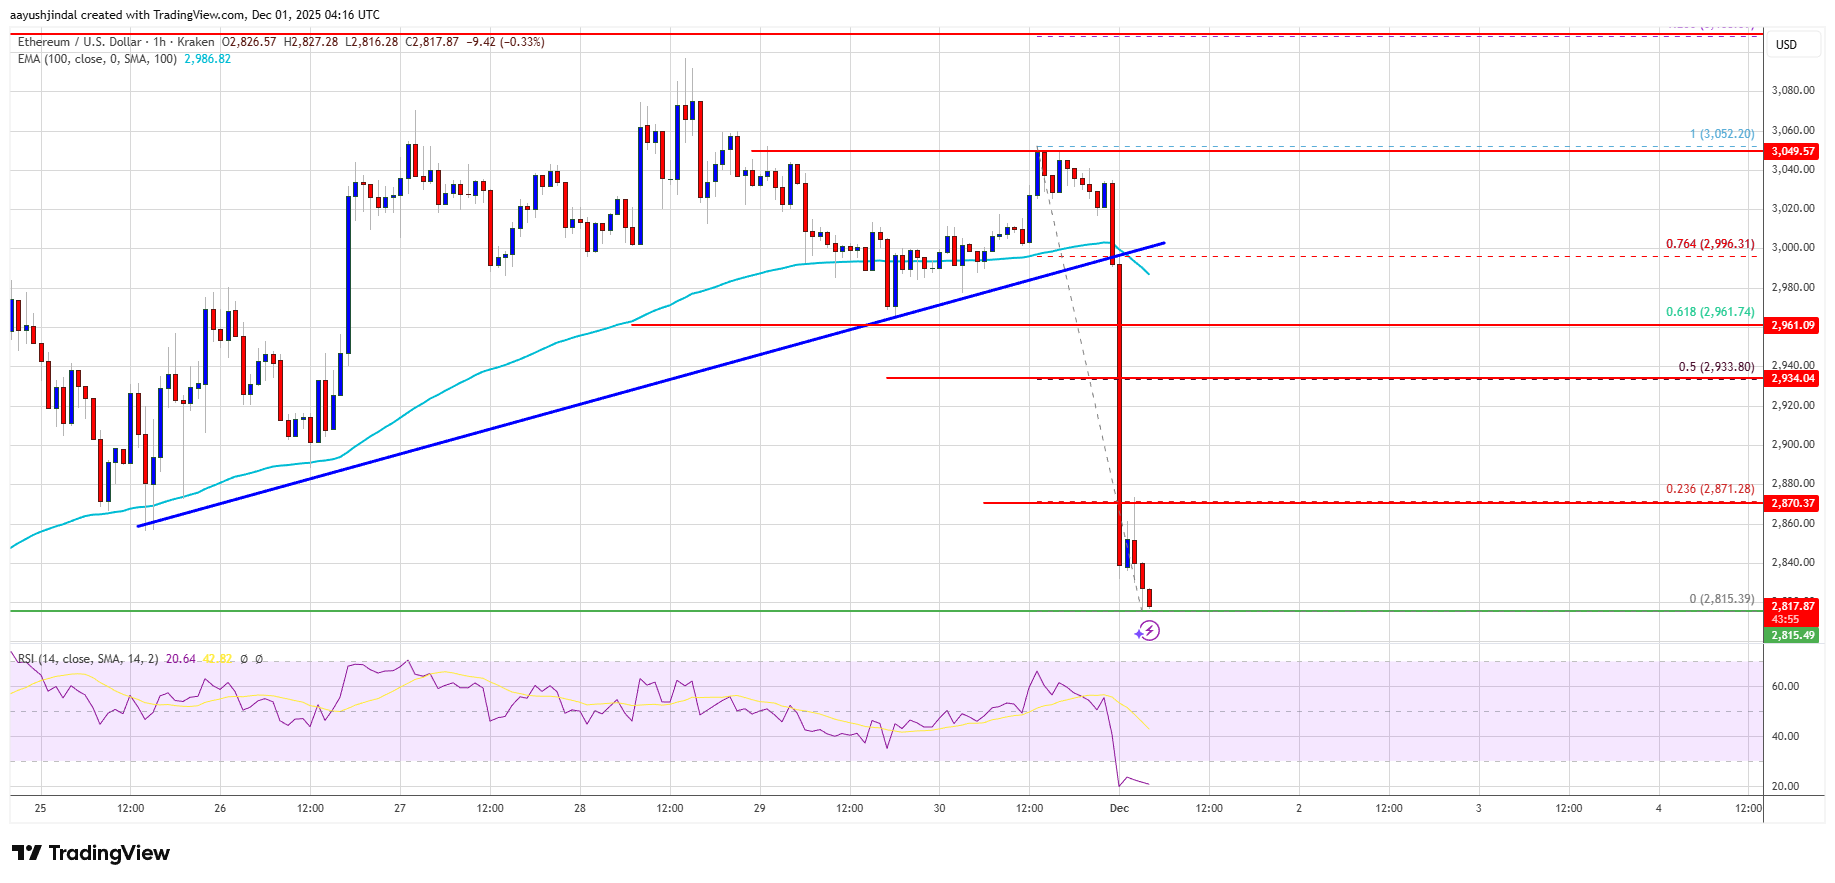
The bulls even pumped the price above $3,150.  However, the bulls struggled to clear $3,240 and $3,250. A high was formed at $3,239 and the price recently corrected some gains. There was a spike below the 23.6% Fib retracement level of the recent move from the $2,718 swing low to the $3,239 low.

Ethereum price is now trading above $3,120 and the 100-hourly Simple Moving Average. There is also a short-term contracting triangle forming with support at $3,130 on the hourly chart of ETH/USD.

Ethereum Price

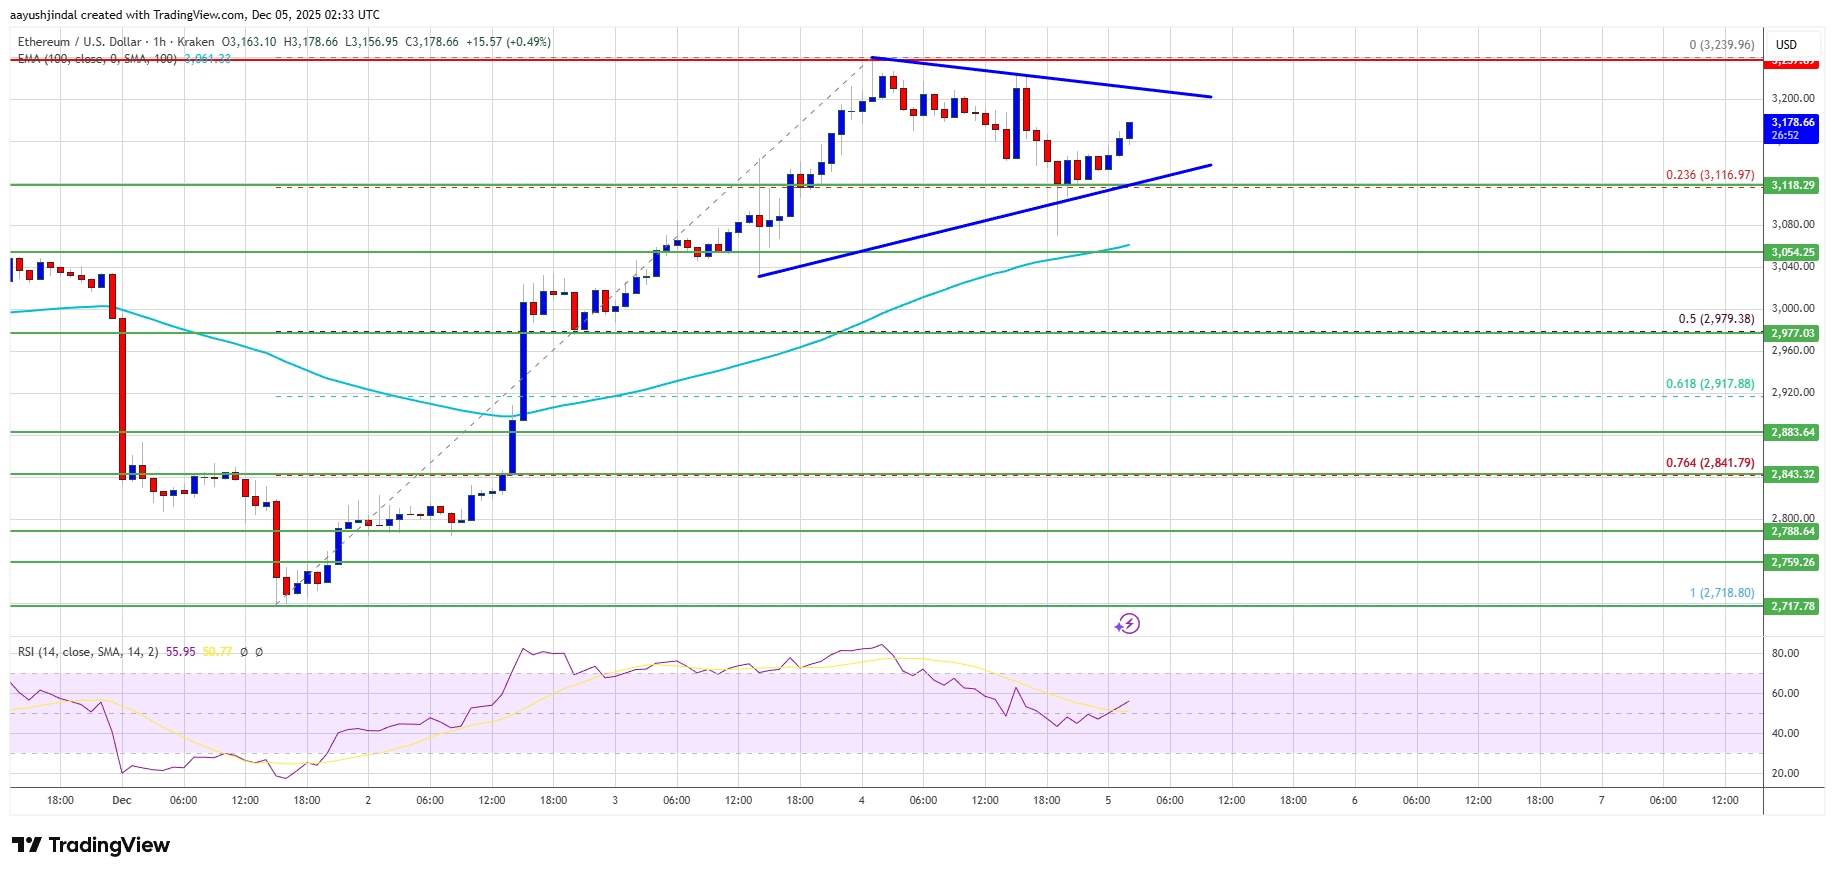
If there is another upward move, the price could face resistance near the $3,200 level. The next key resistance is near the $3,240 level. The first major resistance is near the $3,250 level. A clear move above the $3,250 resistance might send the price toward the $3,320 resistance. An upside break above the $3,320 region might call for more gains in the coming days. In the stated case, Ether could rise toward the $3,450 resistance zone or even $3,500 in the near term.

Downside Correction In ETH?

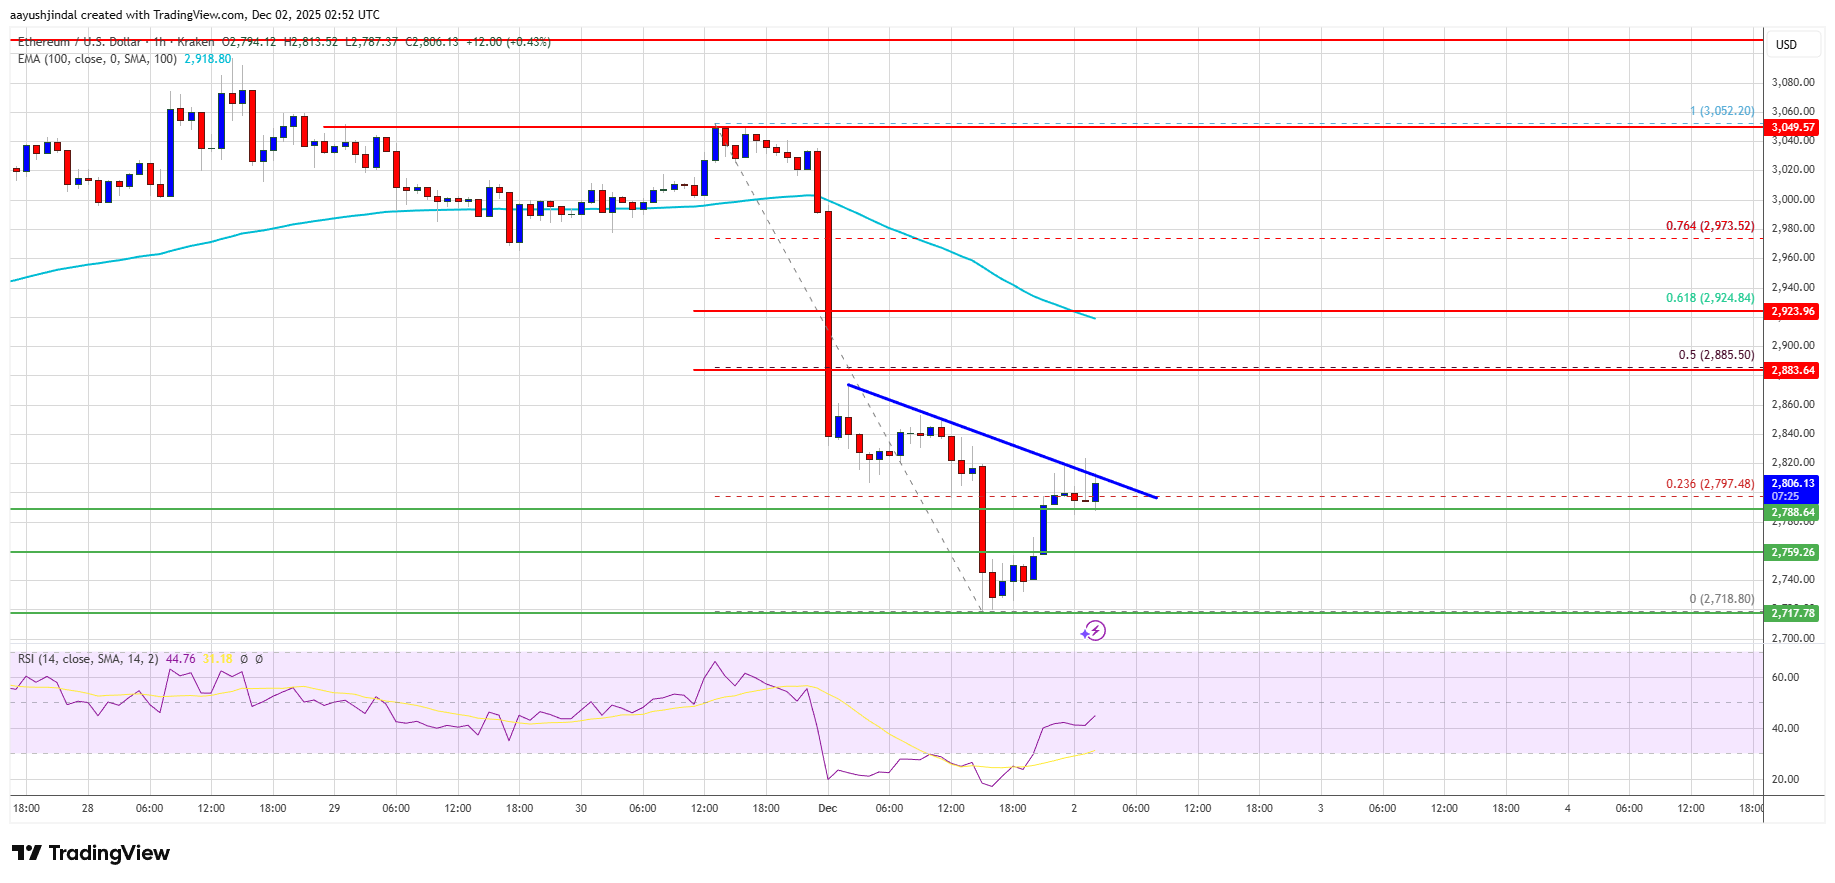
If Ethereum fails to clear the $3,240 resistance, it could start a fresh decline. Initial support on the downside is near the $3,120 level. The first major support sits near the $3,050 zone.

A clear move below the $3,050 support might push the price toward the $3,000 support. Any more losses might send the price toward the $2,980 region and the 50% Fib retracement level of the recent move from the $2,718 swing low to the $3,239 low in the near term. The next key support sits at $2,850 and $2,840.

Technical Indicators

Hourly MACDThe MACD for ETH/USD is gaining momentum in the bullish zone.

Hourly RSIThe RSI for ETH/USD is now above the 50 zone.

Major Support Level – $3,130

Major Resistance Level – $3,240

Ethereum Coils For A Breakout As IH&S + Heavy Accumulation Emerges

Ethereum is approaching a critical moment as multiple bullish signals begin to align. A clear Inverse Head & Shoulders formation, combined with rising accumulation and weakening trend rejection, suggests that the market may be gearing up for a powerful upside move. With momentum tightening and key levels coming into focus, ETH now stands on the verge of a breakout that could set the stage for its next major rally.

Inverse Head And Shoulders Signals Brewing Momentum

According to a recent update shared by crypto analyst Donald Dean, Ethereum may be gearing up for a significant move. He highlighted the development of a potential inverse head and shoulders pattern, a classic bullish reversal formation that often precedes strong upward momentum. This emerging structure suggests that ETH could soon shift into a more aggressive bullish phase if confirmed.

Dean also pointed out that the weekly chart is showing solid support near the 50% Fibonacci retracement level, positioned around $2,750. Adding to the bullish signals, a hammer candle has appeared on the weekly timeframe, hinting at buying pressure stepping back in after recent downside movement.

Ethereum

If the pattern plays out, Dean noted that Ethereum’s first major target lies at $4,109, a level that would allow ETH to challenge previous resistance/support zones. Reclaiming this region would mark a meaningful shift in momentum and strengthen the bullish outlook for the asset.

Beyond that, the next upside target sits near $5,766, which aligns closely with the 1.618 Golden Ratio extension calculated at approximately $5,793.51. Dean described this confluence as particularly noteworthy, suggesting that if Ethereum breaks above its nearer targets, a larger rally toward this golden-ratio level becomes a realistic possibility.

Growing Accumulation Suggests Bulls Are Preparing For Action

In an earlier analysis, LSTRADER reminded followers of the impressive move from $1,600 to $4,800, noting that this surge had been identified in advance through both the ETH chart and the ETH/BTC setup. The analysis captured the momentum shift that preceded the rally, reinforcing the value of tracking key structural signals.

In the current market structure, LSTRADER noted that the chart clearly shows multiple instances where the trend faced rejection. Despite these rejections, the trend is steadily losing strength while accumulation continues to build, a combination that typically reflects growing bullish interest and the potential for an upward breakout.

However, LSTRADER stressed that no major move should be assumed until the trendline itself is broken, and confirmation is still required. For now, patience is key as traders continue monitoring the structure and waiting for a decisive shift in trend direction.

Ethereum

Fusaka Upgrade Reignites Confidence in Ethereum, Analysts Eye $3,500 Target

Ethereum (ETH) is topping talks once again as its Fusaka upgrade goes live and the ETH price returns firmly above the $3,200 mark. After weeks of choppy trading and lingering fear across the broader crypto market, the combination of a major technical overhaul and rising on-chain activity is giving traders a fresh narrative to follow.

Related Reading: Eric Trump Says Bitcoin Could Hit $500,000, Stands By ABTC Strategy

In the last 24 hours, ETH has climbed around 4–5%, outperforming most large-cap cryptos and reclaiming a key psychological zone near $3,200. Market data shows rising volumes and a noticeable pickup in accumulation from larger holders, even as sentiment indicators still sit in “Fear” territory.

Ethereum ETH ETHUSD ETH price

Fusaka Upgrade Shifts Focus Back to Ethereum’s Scaling Roadmap

The Fusaka upgrade, Ethereum’s second major network update of 2025, activated at block height 18,200,000. At its core is PeerDAS, a data availability sampling system that lets nodes store only slices of blob data instead of entire payloads.

This change is estimated to expand blob throughput by roughly eight times, easing congestion and helping layer-2 networks push more transactions through Ethereum’s base layer.

Developers describe Fusaka as another step in Ethereum’s long-term scaling roadmap, aligning the main chain with growing layer-2 activity.

Beyond PeerDAS, the upgrade bundles a series of Ethereum Improvement Proposals that tweak gas limits, transaction sizes, cryptographic support, and block configuration, aiming to improve efficiency while keeping validator requirements manageable.

Whales, ETFs and Technical Signals Cluster Around $3,500

On-chain data shows “shark” wallets holding between 1,000 and 10,000 ETH have ramped up accumulation in recent weeks, buying aggressively on dips around $2,700–$3,000.

Institutional interest also appears to be rising. BitMine has reportedly added more than 18,000 ETH to its treasury ahead of Fusaka, while U.S. spot Ethereum ETFs have recorded notable net inflows.

Technically, ETH is trading around $3,200 with analysts watching resistance between $3,300 and $3,500. Short-term models project a move toward roughly $3,537 within days, implying upside of about 10% if the current trend holds.

However, indicators remain mixed. The broader setup is still labelled “bearish,” and any pullback could see ETH retesting support around $3,100, $3,000, or even the $2,850 zone.

Related Reading: XRP Price Is Performing As Expected; Analyst Reveals What Comes Next

For now, the Fusaka upgrade has shifted the conversation back to fundamentals, with Ethereum’s price action testing whether renewed confidence is enough to carry it through the $3,500 barrier.

Cover image from ChatGPT, ETHUSD chart from Tradingview

Ethereum Surges Above $3,200 as Traders Eye a Stronger Bullish Extension

Ethereum price started a fresh increase above $3,120. ETH is now attempting to clear the $3,250 resistance and might accelerate higher.

  • Ethereum started a fresh increase above the $3,000 and $3,120 levels.
  • The price is trading above $3,150 and the 100-hourly Simple Moving Average.
  • There is a bullish trend line forming with support at $3,120 on the hourly chart of ETH/USD (data feed via Kraken).
  • The pair could continue to move up if it settles above the $3,250 zone.

Ethereum Price Eyes More Gains

Ethereum price managed to stay above $2,880 and started a fresh increase, like Bitcoin. ETH price gained strength for a move above the $2,950 and $3,000 resistance levels.

The bulls even pumped the price above $3,120.  However, the price is now testing a key barrier at $3,250. A high was formed at $3,239 and the price is now consolidating above the 23.6% Fib retracement level of the recent move from the $2,718 swing low to the $3,239 low.

Ethereum price is now trading above $3,150 and the 100-hourly Simple Moving Average. If there is another upward move, the price could face resistance near the $3,250 level.

Ethereum Price

The next key resistance is near the $3,265 level. The first major resistance is near the $3,320 level. A clear move above the $3,320 resistance might send the price toward the $3,450 resistance. An upside break above the $3,450 region might call for more gains in the coming days. In the stated case, Ether could rise toward the $3,500 resistance zone or even $3,540 in the near term.

Downside Correction In ETH?

If Ethereum fails to clear the $3,250 resistance, it could start a fresh decline. Initial support on the downside is near the $3,160 level. The first major support sits near the $3,120 zone and the trend line.

A clear move below the $3,120 support might push the price toward the $3,050 support. Any more losses might send the price toward the $2,980 region and the 50% Fib retracement level of the recent move from the $2,718 swing low to the $3,239 low in the near term. The next key support sits at $2,920 and $2,880.

Technical Indicators

Hourly MACDThe MACD for ETH/USD is gaining momentum in the bullish zone.

Hourly RSIThe RSI for ETH/USD is now above the 50 zone.

Major Support Level – $3,120

Major Resistance Level – $3,250

Analysts Turn Bullish on SUI as Token Extends Gains Amid Renewed Institutional Interest

Sui (SUI) is drawing renewed market attention after staging one of its strongest breakouts in months, rising sharply at a time when most large-cap altcoins remain range-bound.

The latest 31% surge was triggered by a series of developments that converged within days, most notably Coinbase’s approval to offer SUI trading to New York residents, a move that places the token inside one of the most heavily regulated crypto markets in the U.S.

The rally also arrived immediately after one of the largest token unlocks of the month, an event that would normally dampen prices but instead saw buyers step in with force.

SUI Network SUIUSD

New York Listing Boosts Liquidity and Institutional Demand

SUI surged between 25% and 32% over the past 24 hours after Coinbase confirmed that New York residents can now buy and trade the token across its web and mobile platforms.

The approval extends SUI’s reach into one of the most tightly regulated U.S. markets, strengthening its profile as a compliant layer-1 network and increasing accessibility for institutional investors.

The listing comes at a notable time. On December 1, SUI unlocked approximately $82–86 million worth of tokens, increasing circulating supply by more than 0.5%. Large unlocks typically pressure prices, but SUI moved higher instead, signaling strong demand absorption.

Trading volume has more than doubled, hitting roughly $1.5 billion, levels analysts say indicate genuine accumulation rather than short-lived speculation.

The launch of USDsui, a fiat-backed stablecoin designed for payments and DeFi use across the Sui ecosystem, also contributed to renewed interest. Combined with Coinbase’s expansion, these developments have strengthened confidence in Sui’s broader market positioning.

SUI Technical Indicators Point to Momentum Shift

Price action shows that SUI recently rebounded from November’s lows near $1.12, climbing above the $1.60 support zone.

Indicators such as RSI and MACD now suggest easing selling pressure and a potential shift in short-term momentum. Analysts note that breaking above the mid-Bollinger Band near $1.90 would confirm a broader trend reversal.

SUI has also moved above the Keltner mid-band for the first time in weeks, with volume delta readings showing strong spot-market buying.

The next major resistance sits between $1.80 and $1.95, followed by a wider zone extending to $2.30. A decisive close above $1.92 is viewed as critical for invalidating November’s downtrend.

Rally Depends on Volume Holding

Market watchers say the current rally hinges on sustained demand. If daily volume remains above $1.5 billion and price holds the $1.60–$1.67 support zone, institutional participation could continue to push the token higher toward the $1.90 level.

However, weakening volume or a drop below $1.48 may signal that SUI has formed a local top. For now, sentiment remains constructive as the token benefits from increased U.S. accessibility, improving technical signals, and expanding ecosystem activity.

Cover image from ChatGPT, SUIUSD chart from Tradingview

Ethereum Network Fatigue? Monthly On-Chain Transactions Drops As Activity Slows Down

Over the past few weeks, the price of Ethereum has been on a downward trend due to a highly volatile market environment. ETH’s bearish action appears to have hampered on-chain activities, as evidenced by a decline in its total transactions carried out within a monthly period.

A Quiet Month For The Ethereum Network

Ethereum’s on-chain activity appears to have slowed down alongside the ongoing decline of ETH’s price. The blockchain, which is typically bustling with contract calls, exchanges, and transfers, now feels a little more roomy, suggesting a cooling pulse beneath the surface.

After examining the Transactions on the Ethereum Network metric in the monthly time frame, Everstake.eth, a market analyst and the head of the ETH segment at Everstake, revealed that the blockchain has recorded its worst month of the year. While price has declined, ETH’s total transactions executed in a month, particularly November, experienced a cool-off.

According to the data, the overall number of transactions carried out on the Ethereum network in November alone was approximately 32.2 million. Although this figure may seem large, it actually marks the lowest monthly count in the past 12 months.

Such a drop in transactions may suggest the renewed waning appetite for the network. In addition to suggesting a retreat, this delay reads more like a collective pause as users catch their breath, procedures recalibrating, and the market adjusting to its new rhythm. 

Ethereum

Everstake.eth highlighted that this kind of cooldown usually occurs when the market moves into a wait-and-see phase. During this phase, capital is observed sitting on the sidelines while developers continue to build on the blockchain. Despite this trend, the network still records more than 33 million transactions in a quiet month, which reflects its robust strength.

At a time like this, the expert noted that user behavior typically follows the market sentiment. As seen in the past, on-chain activity tends to cool down when volatility drops. However, Ethereum still retains the status as the most reliable network even during slow phases.

With the Fusaka Upgrade set to hit the market, Everstake.eth predicts that ETH transactions will see explosive growth. “If this is the worst month, imagine what the best will look like after Fusaka rolls out. It will be huge,” the expert stated.

ETH Active Transactions Pick Up

The monthly transactions may have slowed down, but the active addresses on the Ethereum network are heating up again. Leon Waidmann, the head of research at On-Chain Foundation, reported that active addresses throughout the entire ecosystem, Layer 1 and Layer 2s, bounced back above 9.5 million this week.

This surge points to a quiet resurgence of interest, utility, or a group readiness for the future. Waidmann highlighted that this marks the first meaningful reversal after several weeks of downside action.

ETH layer 2s such as Base, Arbitrum, Optimism, and World Chain have witnessed a strong rebound following a period of decline. Furthermore, multi-chain activity is starting to stabilize after the drop in Q3. These factors are painting a bullish picture for the network and its price prospects.

Ethereum

Here’s Why The Bitcoin Price Jumped Above $92,000, And Ethereum Price Reclaimed $3,000

The crypto market delivered a dramatic rebound this week, with the Bitcoin price vaulting above $92,000 and Ethereum climbing back over $3,000. The sharp recovery in both leading cryptocurrencies has caught the market’s attention, with analysts now sharing the major reason for the unexpected pump. 

Why The Ethereum And Bitcoin Price Are Rebounding

Bitcoin is currently trading above $93,000 after experiencing a period of accelerated selling and heavy long liquidations that had briefly pushed its price down over the past few weeks. Now that forced selling has eased, the cryptocurrency has recovered significantly, adding an astonishing $75 billion to its market capitalization within 10 hours. 

Ethereum has followed the same upward swing. Data from CoinMarketCap shows that ETH has gained more than 9% in the past 24 hours, with steady accumulation pushing its price above $3,050. 

Crypto market analyst Wimar.X has explained the reason behind the sudden surge in both Bitcoin and Ethereum prices. He framed the resurgence as a rapid wave of high-volume coordinated institutional buying. In his words, the market pumped because a massive round of accumulation occurred within a single hour. 

Data from Arkham Intelligence shows that Wintermute, a leading algorithmic trading firm, had bought 8,577 BTC ahead of the market surge. Binance, the world’s largest crypto exchange, also acquired 7,658 BTC, while a major whale wallet added 6,010 BTC to its portfolio. Finally, BitMEX, a crypto exchange co-founded by Arthur Hayes, reportedly accumulated 5,818 BTC, while Bitfinex absorbed 5,778 BTC. 

Bitcoin price 1

According to Wimar.X analysis, the sudden accumulation and its timing appear coordinated. He described the activity as manipulation, implying that it was intended to influence market perception and artificially sway prices. 

Analysts Share Outlook For Bitcoin And Ethereum Price After Pump

As the crypto market showed renewed strength and BTC recovered above $90,000, crypto expert Michael van de Poppe took to X to highlight the significance of the rebound. He noted that the recent dip in Bitcoin’s price at the start of the month appeared unusual but was followed by a strong bounce. According to the analyst, surpassing $92,000 will be critical for Bitcoin and could pave the way for a new all-time high and a potential test of $100,000. 

Bitcoin price 2

On the other hand, a market analyst identified as ‘More Crypto Online’ on X has stated that Ethereum is currently testing the micro support zone between $2,907 and $2,974. He noted that holding this support area is crucial for sustaining the upward momentum that began earlier this week.

Bitcoin Price 3

As a result, the analyst has predicted that Ethereum’s next upside window sits between $3,165 and $3,210. He cautioned that a breach below the lower support level could trigger a deeper corrective wave. However, current trends suggest that ETH is mainly aiming higher. 

Bitcoin price chart from Tradingview.com (Ethereum)

Can the Fusaka Upgrade Renew Ethereum’s Momentum After Recent Price Hit?

Ethereum fell more than 2% within 24 hours, sliding below $3,000 after losing its $2,900 support level. The drop triggered widespread liquidations, with around $500 million in long positions wiped out. Data shows that $79 million of the $106 million in ETH-focused contracts liquidated were long bets.

Trading activity spiked sharply during the decline, with daily volume rising 200% to $33.2 billion. The broader crypto market also contracted, falling nearly 1.2% and erasing an estimated $1100 billion in value within hours. Bitcoin, SOL, XRP, and DOGE followed similar downward moves.

Despite the volatility, some firms accumulated ETH during the downturn. BitMine Immersion Technologies increased its holdings by 96,798 ETH, diverging from the trend of companies reducing risk exposure.

Ethereum ETH ETHUSD ETH price

Fusaka Upgrade Goes Live, Aiming to Boost Scalability

On December 3, Ethereum is set to activate its Fusaka upgrade, the network’s second major 2025 update. The upgrade aligns execution- and consensus-layer changes, introducing features that aim to improve Layer 2 and reduce costs.

A key component is PeerDAS, a data-sampling mechanism designed to reduce the bandwidth validators need to verify Layer 2 data. This system aims to cut validator bandwidth requirements by up to 85% and expand blob data capacity, potentially lowering Layer 2 transaction fees by 40–60%.

Fusaka also raises Ethereum’s block gas limit to 60 million, enabling more transactions per block, and introduces updates to the Ethereum Virtual Machine that streamline smart contract execution. These combined changes are expected to enhance the network’s transaction capacity.

Industry interest had been rising ahead of the upgrade. Major financial players, including Amundi and Fidelity, recently announced moves into tokenized products built on Ethereum, reflecting broader institutional activity across the network.

Can Ethereum (ETH) Recover From Oversold Levels?

Ethereum (ETH) last traded at around $2,807, with technical indicators indicating continued bearish momentum. The MACD remains in negative territory, while the Relative Strength Index sits at 32, signaling oversold conditions.

Key support levels are at $2,700 and $2,500. A failure to hold these zones may deepen the downtrend, while a rebound could push ETH back toward $2,900–$3,000. Open Interest rose 4.3% after the decline, suggesting traders are reopening positions and preparing for higher volatility.

Whether the Fusaka upgrade can shift market sentiment remains uncertain, but its long-term scaling impact may play a role in Ethereum’s broader recovery.

Cover image from ChatGPT, ETHUSD chart from Tradingview

Ethereum Rockets Higher, Narrowing Distance to a Make-or-Break Resistance Line

Ethereum price started a fresh increase above $2,920. ETH is now attempting to clear the $3,050 resistance and might accelerate higher.

  • Ethereum started a fresh increase above the $2,920 and $2,950 levels.
  • The price is trading above $2,950 and the 100-hourly Simple Moving Average.
  • There was a break above a short-term bearish trend line with resistance at $2,825 on the hourly chart of ETH/USD (data feed via Kraken).
  • The pair could continue to move up if it settles above the $3,050 zone.

Ethereum Price Eyes Upside Break

Ethereum price managed to stay above $2,720 and started a fresh increase, like Bitcoin. ETH price gained strength for a move above the $2,850 and $2,880 resistance levels.

There was a break above a short-term bearish trend line with resistance at $2,825 on the hourly chart of ETH/USD. The bulls even pumped the price above $2,950.  However, the price is now testing a key barrier at $3,050. A high was formed at $3,047 and the price is now consolidating above the 23.6% Fib retracement level of the recent move from the $2,718 swing low to the $3,047 low.

Ethereum price is now trading above $2,950 and the 100-hourly Simple Moving Average. If there is another upward move, the price could face resistance near the $3,050 level.

Ethereum Price

The next key resistance is near the $3,080 level. The first major resistance is near the $3,120 level. A clear move above the $3,120 resistance might send the price toward the $3,200 resistance. An upside break above the $3,200 region might call for more gains in the coming days. In the stated case, Ether could rise toward the $3,350 resistance zone or even $3,380 in the near term.

Another Decline In ETH?

If Ethereum fails to clear the $3,050 resistance, it could start a fresh decline. Initial support on the downside is near the $2,970 level. The first major support sits near the $2,880 zone or the 50% Fib retracement level of the recent move from the $2,718 swing low to the $3,047 low.

A clear move below the $2,840 support might push the price toward the $2,800 support. Any more losses might send the price toward the $2,750 region in the near term. The next key support sits at $2,720 and $2,710.

Technical Indicators

Hourly MACDThe MACD for ETH/USD is gaining momentum in the bullish zone.

Hourly RSIThe RSI for ETH/USD is now above the 50 zone.

Major Support Level – $2,970

Major Resistance Level – $3,050

When Will Bitcoin, Ethereum, And Dogecoin Go Into A Bear Market?

The prices of Ethereum and Dogecoin have followed a similar trajectory to the Bitcoin price crash as the pioneer digital asset continues to lead the crypto market lower. The muted action from Bitcoin has led to speculations that the market is finally headed into another bear trend after rising over the last few years. In this same vein, a crypto analyst has predicted when they believe that the bear market will really start, and that the current trend could still lead to an eventual pump in the market.

Why The Bitcoin, Ethereum, And Dogecoin Prices Could Still Pump

Crypto analyst ChainShinobi explained what is going on in the market, predicting that the trend could end up going against what investors are expecting at this time. According to the X post, while everyone is currently calling for lower prices, it could lead to another pump that culminates in the final top for the crypto market

ChainShinobi predicts what they refer to as “a face-melter”, the type of rally that no one sees coming and takes the likes of Bitcoin, Dogecoin, and Ethereum to possibly new all-time highs. However, instead of using this time to call for higher prices, the analyst believes that it is the best time for investors to actually get out of the market. This pump, which the analyst refers to as an exit window, could provide investors one final chance to actually get out of the market before another price crash.

This is “The moment to lock in massive profit while everyone else is busy blinding themselves with hopium and pushing their targets higher and higher… the same way they dragged their targets lower and lower right now,” the crypto analyst said.

The Same Wave Every Cycle

As for when the Dogecoin, Ethereum, and Dogecoin prices could move into the next bear market, the crypto analyst tells investors not to expect it until next year. More precisely, ChainShinobi believes that the bear market will fully begin by the end of the first quarter of 2025.

When the pump comes, the analyst warns that there could be an influx of bullish sentiment, with bullish news flooding the market. But it is during this time that the market is expected to turn. Essentially, the bear market is expected to begin when investors least expect it. “It’s pretty easy to see what’s coming. You don’t need to overdo TA or PA right now to see the path laid out,” the post read.

Bitcoin price chart from Tradingview.com (Ethereum, Dogecoin)

BitMine Snaps Up $70 Million In Ether In Another Surprise Mega Buy

According to on-chain tracking, BitMine added 23,773 Ether over three days as the market softened. The buying included 7,080 ETH for close to $20 million on Monday and 16,693 ETH for roughly $50 million on Saturday. Based on reports, those two transactions together pushed the firm’s recent outlay to nearly $70 million.

BitMine Steps Up Accumulation

The purchases follow a larger wave of buying from last week, when Bitwise moved 96,800 ETH for roughly $273 million. Reports have disclosed that BitMine now holds about 3.7 million Ether at an average cost of $3,008 per coin.

That puts the treasury in the red at current prices, but management appears focused on long-term targets: the firm says it is about 60% of the way toward a plan to control 5% of Ether’s supply.

The scale of that aim is unusual. Few corporate treasuries aim for a single-asset share that large. Market watchers see the moves as a clear bet that Ether will be worth substantially more over time, even if the present valuation shows paper losses. The strategy is heavy accumulation during weakness, not trading around price swings.

It seems that Tom Lee(@fundstrat)’s #Bitmine just bought another 7,080 $ETH($19.8M) 2 hours ago.https://t.co/yZbTCFm9GT pic.twitter.com/JHb3WYDa0a

— Lookonchain (@lookonchain) December 2, 2025

Tom Lee’s Targets Shift Again

Meanwhile, Tom Lee, who chairs BitMine, has stepped back from earlier, bolder forecasts for Bitcoin. He previously expected Bitcoin to reach $250,000 by the end of 2025. In recent public comments he first softened that call and then said on CNBC that Bitcoin could reach a new all-time high by the end of January. Lee tied that outcome to a recovery in equities, which he said he expects.

Grayscale Research Counterpoints Cycle Fears

Grayscale Research released analysis pushing back against the idea that Bitcoin must follow the usual four-year halving cycle. The firm suggested BTC could make new highs in 2026 and urged investors to view large pullbacks as part of normal market swings.

Pricing data shows Bitcoin fell about 30% from its October peak through most of November, hitting roughly $84,000 briefly before edging back to about $86,909 as of early Tuesday, according to price feeds.

Why These Moves Matter Now

Large, coordinated buying by treasury firms can shift market psychology. When groups with deep pockets step in, some traders see it as a sign of conviction. At the same time, these entities can take months or years to reach break-even if prices stay below their average purchase levels. That dynamic makes markets more sensitive to both supply concentration and the pace of future buying.

BitMine’s on-chain activity will likely draw more attention if additional large transfers appear. Shifts in the firm’s average cost per ETH may also become a talking point, along with any new remarks from Tom Lee about his updated timeline. Analysts are already examining whether Grayscale’s stance on the halving cycle gains support from other major market participants.

Featured image from BIS Safety Software, chart from TradingView

Ethereum Takes a Blow, Though Buyers Continue Shielding Key Price Floors

Ethereum price started a fresh decline below $2,880. ETH is now attempting to recover from $2,720 but the bulls might face resistance.

  • Ethereum started a fresh decline below $2,880 and $2,800.
  • The price is trading below $2,850 and the 100-hourly Simple Moving Average.
  • There is a short-term bearish trend line forming with resistance at $2,820 on the hourly chart of ETH/USD (data feed via Kraken).
  • The pair could continue to move up if it settles above the $2,850 zone.

Ethereum Price Attempts Recovery

Ethereum price failed to stay above $2,950 and started a fresh decline, like Bitcoin. ETH price declined below $2,880 to enter a bearish zone. The bears even pushed the price below $2,800.

A low was formed at $2,718 and the price is now attempting to recover. There was a move above the $2,750 level. The price climbed above the 23.6% Fib retracement level of the downward move from the $3,052 swing high to the $2,718 low.

Ethereum price is now trading below $2,850 and the 100-hourly Simple Moving Average. If there is another upward move, the price could face resistance near the $2,820 level. There is also a short-term bearish trend line forming with resistance at $2,820 on the hourly chart of ETH/USD.

Ethereum Price

The next key resistance is near the $2,880 level or the 50% Fib retracement level of the downward move from the $3,052 swing high to the $2,718 low. The first major resistance is near the $2,920 level. A clear move above the $2,920 resistance might send the price toward the $3,000 resistance. An upside break above the $3,000 region might call for more gains in the coming days. In the stated case, Ether could rise toward the $3,050 resistance zone or even $3,150 in the near term.

Another Decline In ETH?

If Ethereum fails to clear the $2,880 resistance, it could start a fresh decline. Initial support on the downside is near the $2,760 level. The first major support sits near the $2,740 zone.

A clear move below the $2,740 support might push the price toward the $2,720 support. Any more losses might send the price toward the $2,650 region in the near term. The next key support sits at $2,550 and $2,500.

Technical Indicators

Hourly MACDThe MACD for ETH/USD is losing momentum in the bearish zone.

Hourly RSIThe RSI for ETH/USD is now below the 50 zone.

Major Support Level – $2,720

Major Resistance Level – $2,880

Ethereum’s Core Chain Ignites With Mainnet Usage Soaring Past Prior Peaks

The leading Ethereum network is witnessing serious engagement even as its price struggles to undergo a major surge. After a massive wave of both new and old investors, the ETH mainnet utilization has increased drastically, reaching levels of adoption not seen since its inception.

Historic Lift-Off For Ethereum Mainnet Utilization

Ethereum is undergoing a shift in network adoption. In a significant landmark that cements its dominance, the Ethereum Maninnet usage has increased to the point where it feels more like a structural awakening than regular growth. 

Leon Waidmann, the founder of On-Chain Foundation and market expert, reported that the ETH mainnet’s utilization is currently at an all-time high. This kind of spike in network traffic may indicate the return of activity from the periphery to the center of the chain, new applications, or even a resurgence of trust in the network’s long-term prospects.

Data shared by the market expert shows the network’s usage in the past 30 days rose to 1.97mags/s, marking its highest level in history. The chart reveals that the rise to a new peak represents a more than 57% increase in Year-Over-Year (YoY), indicating that ETH is moving with intent once again.

Ethereum

While weak network effects and parasitic Layer 2s are being debated within the community, Waidmann highlighted that the Ethereum Mainnet continues to display strong growth and strength. This robust growth is evidenced by the increase in activity, spiking gas fees, and the surge in the number of ETH being burned.

By combining these key factors about the network, Waidmann claims that ETH could attract more economic load. As a result, the leading altcoin may gradually shed its old skin and take on a more rigid financial function.

Waidmann has declared that ETH could become harder money and a settlement collateral. As a result, ETH is starting to resemble the foundation of a future financial structure rather than just a utility token.

ETH Layer 2s Dominates Network’s Transactions

In the midst of surging network activity and adoption, Ethereum layer 2s are now dominating in terms of transactions at a speed that makes the base layer feel nearly slow in contrast. While the center might still hold, the edges are undeniably where users’ action currently resides.

Last week, Waidmann noted that the total Transaction Per Second (TPS) across the Ethereum network reached over 358.21. Meanwhile, a more significant portion of these transactions was carried out on layer 2 networks. According to the data shared by the on-chain Foundation founder, layer 2s controlled over 95.2% of the overall throughput. 

Such a development implies that execution has largely moved to the layer 2 chains. A major reason for this might be that users, liquidity, and developers are looking for quicker and less expensive channels to carry out transactions, transforming ETH’s scaling stack into the ecosystem’s actual heartbeat.

Ethereum

Ethereum Dives Below $2,880 as Bears Tighten Their Grip on the Trend

Ethereum price started a fresh decline below $2,950. ETH is down over 5%, trading below $2,880, and might continue to move down.

  • Ethereum started a fresh decline below $2,950 and $2,900.
  • The price is trading below $2,880 and the 100-hourly Simple Moving Average.
  • There was a break below a key bullish trend line with support at $2,990 on the hourly chart of ETH/USD (data feed via Kraken).
  • The pair could continue to move down if it settles below the $2,800 zone.

Ethereum Price Dips Over 5%

Ethereum price failed to stay above $3,000 and started a fresh decline, like Bitcoin. ETH price declined below $2,880 to enter a bearish zone.

There was a break below a key bullish trend line with support at $2,990 on the hourly chart of ETH/USD. The bears even pushed the price below $2,850. A low was formed at $2,815 and the price is showing bearish signs below the 23.6% Fib retracement level of the downward move from the $3,052 swing high to the $2,815 low.

Ethereum price is now trading below $2,900 and the 100-hourly Simple Moving Average. If there is another upward move, the price could face resistance near the $2,880 level.

Ethereum Price

The next key resistance is near the $2,940 level or the 50% Fib retracement level of the downward move from the $3,052 swing high to the $2,815 low. The first major resistance is near the $2,960 level. A clear move above the $2,960 resistance might send the price toward the $3,000 resistance. An upside break above the $3,000 region might call for more gains in the coming days. In the stated case, Ether could rise toward the $3,050 resistance zone or even $3,150 in the near term.

More Losses In ETH?

If Ethereum fails to clear the $2,960 resistance, it could start a fresh decline. Initial support on the downside is near the $2,820 level. The first major support sits near the $2,800 zone.

A clear move below the $2,800 support might push the price toward the $2,740 support. Any more losses might send the price toward the $2,720 region in the near term. The next key support sits at $2,650 and $2,620.

Technical Indicators

Hourly MACDThe MACD for ETH/USD is gaining momentum in the bearish zone.

Hourly RSIThe RSI for ETH/USD is now below the 50 zone.

Major Support Level – $2,800

Major Resistance Level – $2,940

Ethereum Leverage Reset Complete – Time For Market Re-Accumulation?

Ethereum presently trades around $3,000 following a broader crypto market rebound in the last week. During this time, the market’s largest altcoin gained by 7.22%, providing a much-needed relief after an extended correction that dominated the majority of the last two months. As price stabilizes, crypto analytics platform XWIN Research Japan shares a forward-looking assessment of Ethereum’s outlook, especially considering developments in the futures market.

Ethereum Bulls Buy The Dip After Weak Position Exits

Amid the widespread correction of the crypto market in Q4 2025, Ethereum’s prices crashed from $4,700 to as low as $2,900, representing a 38% price decline. XWIN Research Japan reports this price fall coincided with certain relevant developments in the futures market.

In particular, Ethereum’s open interest across all exchanges dropped from $21 billion to around $17 billion in late November, as overleveraged long positions were closed down, forcing traders to open new positions with moderate leverage size. Meanwhile, funding rates stayed positive but declined to around 0.002, meaning that the dominant bullish sentiment from mid-2025 greatly reduced.

Ethereum

Looking at on-chain data, the Market Value to Realized Value (MVRV) is at 1.27, while Binance data shows it to be around 1.0, both values indicating Ethereum is in a neutral to fair value zone, suggesting a period of stability before the next major trend emerges. Meanwhile, the recent market recovery kick-started after ETH retested the realized price of whale addresses, indicating that large market players are bolstering their holdings. 

XWIN Research Japan supports this theory, noting that Ethereum Treasury BitMine has boosted its market holdings to 3.63 million ETH. Additionally, a BlackRock client recently acquired tens of millions of dollars’ worth of ETH, further reinforcing the strength of current market demand. However, despite this robust market demand, ETH Spot ETF net outflows for November hit $1.42 billion, indicating there is significant selling pressure in the market.

Ethereum Market Outlook

At the time of writing, Ethereum trades at $3,003, reflecting a 0.22% loss in the past day. Despite its gains in the last week, the altcoin is still down by 22.34% over the last month, suggesting the majority of short-term holders are in losses.

XWIN Research Japan explains that although the overleveraged position has been cleared out with market whales now ramping up their holding, Ethereum remains in a “bottom-building phase”.  Therefore, investors should still anticipate a “choppy, sell-on-rally” price action in the short term. The analysts predict a major trend reversal with time as the current price area becomes increasingly attractive to investors for massive accumulation opportunities.

Ethereum

Here’s Why Ethereum Emerges As The Global Capital Rails For On-Chain Finance

In the rapidly evolving landscape of digital finance, Ethereum is quickly establishing itself as the primary infrastructure for global on-chain capital markets. From tokenized bonds and money market funds to institutional liquidity rails, the world’s capital is beginning to migrate to an ecosystem where transactions are programmable, auditable, and borderless.

Why Is Ethereum Chosen As The Default Choice For Global Rails

The global capital markets are moving on-chain to Ethereum because it is credibly neutral. ETH has never experienced downtime, and it possesses the economic security necessary to support the world’s financial system. Investor and founder of GM42NFT, Captain GM, has stated that ETH is not fast enough to support trading because it wasn’t built for it.

However, the attempts to build a genuinely fast on-chain trading environment have consistently led teams to centralize significant parts of the trading system. This move creates security, reliability, and neutrality concerns for a system designed to be global. These compromises are in direct conflict with the very benefits that ETH provides, and make it the chosen blockchain for global finance.

This is where Raya Network steps in to solve these issues at the core. Raya is delivering a decentralized exchange (DEX) with institutional-grade execution speed and Ethereum-level security. It’s a platform that is as fast as TradFi and remains simultaneously secure, reliable, and credibly neutral as exactly DeFi should be. “Fast is easy, decentralized is hard, and it’s only Reya that does both,” Captain GM noted.

Analyst Alucard mentioned that the Raya network has become one of the few projects that genuinely solves the speed and security problem. The sub-millisecond execution speeds, trades are fully verified on ETH, and there’s no dependence on a single sequencer. This is an engineered combination designed for real progress in the space.

However, over 45% of the token supply is allocated to the community. Reya, combined with the ETH buyback mechanism, creates an ecosystem that’s aligned both technically and economically. They’re building something fast and secure, and because of that, Reya sits in a different category.

Why Reya’s Design Feels More Like A New Standard Than Another DEX

A trader and ambassador of Somnia, Onur, has also explained that his experience with Reya feels like a full redesign of on-chain execution rather than a small improvement. It offers sub-millisecond fills, unified margin, Ethereum security with ZK settlement, and smooth flow through EigenDA.

According to Onur, the peer-to-pool model keeps trades consistent, efficient, and free from bottlenecks or hidden edges. As a result of this approach, Reya isn’t just another venue anymore, and it’s actively becoming the new execution standard for DeFi.

Ethereum

Ethereum Market Structure Evolves As Futures Demand Becomes The Dominant Driver

Ethereum’s price is displaying signs of bullish momentum once again as the leading altcoin reclaims the $3,000 mark following a rebound across the broader cryptocurrency market. While the price has picked up pace, the ETH derivatives market is heating up, with futures demand rising sharply compared to the spot market.

Futures Appetite Surges Ahead Of Spot Buying

With the price of Ethereum displaying renewed upward strength, the altcoin appears to be changing its tempo, and this change is not coming from where most traders typically look. A recent report from CryptoQuant, a leading on-chain data analytics platform, has revealed a notable divergence between the futures and spot markets.

In the quick-take post, market expert and author with the pseudonym Crazzyblockk highlighted that the futures markets have accelerated significantly while spot activity continues to lag behind. Simply put, demand for futures is surging ahead of spot buying, indicating a shift among ETH investors or traders.

When this key trend emerges, it often serves as an early tremor that frequently precedes more significant developments in Ethereum’s narrative. It suggests that individuals betting on tomorrow may write the next chapter of ETH price action instead of accumulating today.

Ethereum

Over the last several days, ETH’s futures-to-spot ratio has steadily moved higher from the mid-5 range to nearly 6.9 on the most recent reading. Crazzyblockk stated that the rising multiple shows there is a fast increase in speculative interest around Ethereum than spot market participation. What this means is that traders positioning through leveraged markets are expanding rather than acquiring through spot.

In comparison to other major digital assets in the dataset, ETH currently holds the most robust futures demand relative to its spot volume. While Bitcoin and Solana maintain stable ratios in the 3.5–4.5 zone, the altcoin remains the leader and is widening the gap. 

ETH Traders Are Choosing Directional Exposure

The divergence points to an environment where traders are opting for directional exposure in ETH more aggressively than in other large assets. Meanwhile, the increase in futures participation could be a sign of impending catalysts or growing expectations for volatility unique to the Ethereum ecosystem.

According to the market expert, the consistency of this upward trajectory is important to the market. When market players expect greater short-term price movement, a rising futures multiple usually arises. Currently, the data indicates that Ethereum traders are sharply positioning ahead of potential trend acceleration.

However, whether this development leads to a persistent upward momentum or short-term volatility, the path remains clear. The behavior reflects heightened conviction and a noticeable change in Ethereum’s trading dynamics toward those driven by derivatives.

At the time of writing, the ETH price was trading at $3,007, demonstrating a 0.73% decline in the last 24 hours. Its trading volume has sharply dropped in the past day by more than 33%, indicating waning sentiment among ETH investors.

Ethereum

Ethereum Enters Disbelief Phase After Crash Below $3,000, But The Road Leads To $25,000

Ethereum has struggled greatly during the last few weeks, losing the psychological $3,000 level and triggering what many believe to be the start of another bear run. During this time, sentiment has taken an even bigger hit, plunging so far into the negative territory that it’s sitting at levels not seen in years. Naturally, this negative sentiment has triggered fear among investors, but this period of extreme wariness could serve as an opportunity to scoop up the altcoin at low prices.

Fear Could Be Presenting An Opportunity

With the Ethereum price still trending low, crypto analyst Sporia believes that this could be a good time for the price to bounce. Firstly, the analyst points to the fact that crypto market sentiment has not been bad since the COVID crash of 2020. Interestingly, though, the Bitcoin price had been below $10,000 back in 2020, and now, it’s trending between $80,000-$100,000, and this sentiment is this low.

With the Fear & Greed Index hitting new yearly lows and falling into Extreme Fear, everything may look bleak. However, Sporia opines that this could be a time for opportunity, especially for meme coins like Ethereum. The price has already seen a major crash, sending it below $2,700, but there are still factors that show this might be a good opportunity.

For one, the crypto analyst pointed out that the Ethereum price has just finished Wave 2 of its Elliot Wave Count. This means that the altcoin is now headed into Wave 3, a bigger bullish trend than the Wave 1 that sent its price above $4,900 earlier.

With Wave 3 yet to begin, the analyst believes that the Ethereum price has not hit its peak. Rather, this is more of a stopgap, and the real move is coming. Sporia expects ETH to cross the 5-digit threshold, predicting 2026 to be a very bullish year.

Ethereum price

How High Can The Ethereum Price Go In 2026?

By the time the third wave is completed, Sporia expects that the Ethereum price will have climbed as high as $11,000. This bullish run is expected to end sometime in May 2026, leading to the next wave. Wave 4 is a bearish wave and the analyst expects Ethereum to crash ~50% as a result. However, this crash is expected to be only temporary.

The final and most bullish wave of all, Wave 5, will follow after the Ethereum price finds its bottom with the ~50% crash. Once established, this wave will push the price toward new peaks, with the low-end target placed at $18,000 and the high-end at $25,000.

As for the timeline for this, the crypto analyst predicts that all of this will play out by the last quarter of 2026, or into the first quarter of 2027. “No breakout yet, but notice the deep pullbacks it always has right before the eventual clean break higher. We’re following the exact same script,” Sporia said.

Ethereum price chart from Tradingview.com

❌