Reading view

There are new articles available, click to refresh the page.

NASA Orbiter Shines New Light on Long-Running Martian Mystery

By: scarney1

5 min read

Preparations for Next Moonwalk Simulations Underway (and Underwater)

The European Space Agency’s Mars Express orbiter captured this view of Mars’ south polar ice cap Feb. 25, 2015. Three years later, the spacecraft detected a signal from the area to the right of the ice cap that scientists interpreted as an underground lake.
ESA/DLR/FU Berlin, CC BY-SA 3.0 IGO

Results from an enhanced radar technique have demonstrated improvement to sub-surface observations of Mars. 

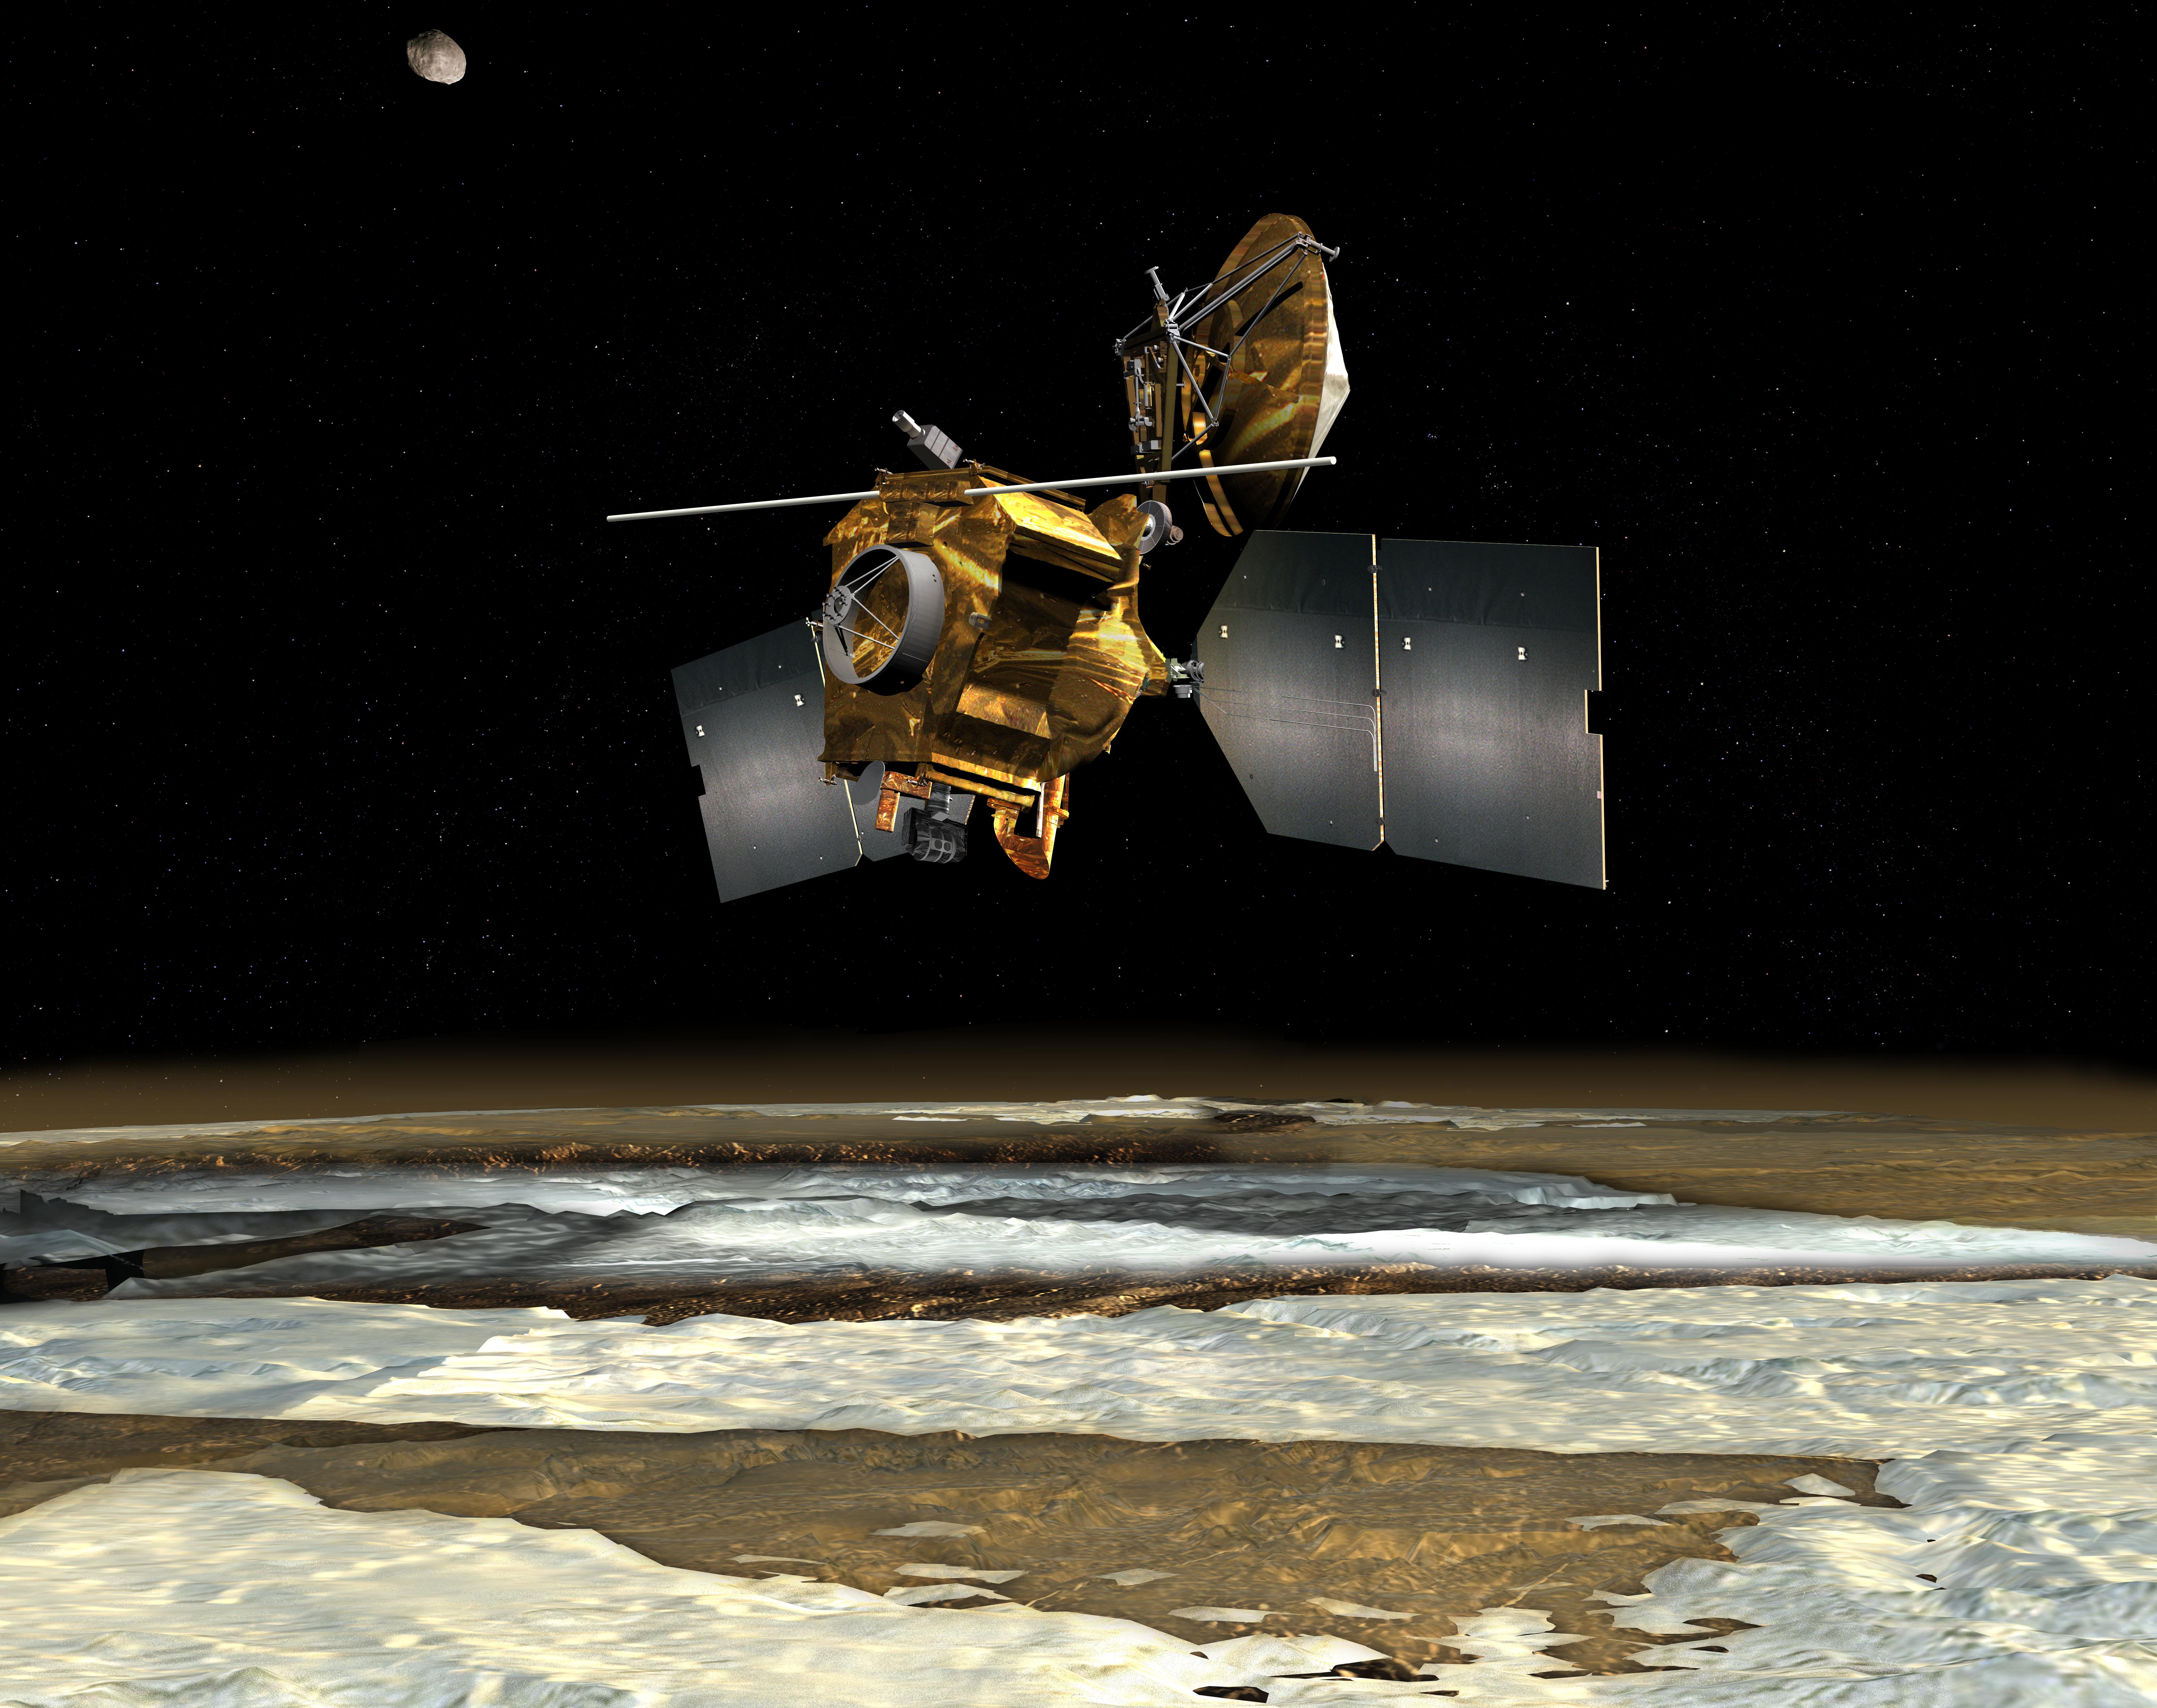
NASA’s Mars Reconnaissance Orbiter (MRO) has revisited and raised new questions about a mysterious feature buried beneath thousands of feet of ice at the Red Planet’s south pole. In a recent study, researchers conclude from data obtained using an innovative radar technique that an area on Mars suspected of being an underground lake is more likely to be a layer of rock and dust.  

The 2018 discovery of the suspected lake set off a flurry of scientific activity, as water is closely linked with life in the solar system. While the latest findings indicate this feature is not a lake below the Martian surface, it does suggest that the same radar technique could be used to check for subsurface resources elsewhere on Mars, supporting future explorers. 

The paper, published in Geophysical Research Letters on Nov. 17, was led by two of MRO’s Shallow Radar (SHARAD) instrument scientists, Gareth Morgan and Than Putzig, who are based at the Planetary Science Institute in Tucson, Arizona, and Lakewood, Colorado, respectively. 

The observations were made by MRO with a special maneuver that rolls the spacecraft 120 degrees. Doing so enhances the power of SHARAD, enabling the radar’s signal to penetrate deeper underground and provide a clearer image of the subsurface. These “very large rolls” have proved so effective that scientists are eager to use them at previously observed sites where buried ice might exist

This map shows the approximate area where in 2018 ESA’s Mars Express detected a signal the mission’s scientists interpreted as an underground lake. The red lines show the path of NASA’s Mars Reconnaissance Orbiter, which flew both directly overhead as well as over an adjacent region. Credit: Planetary Science Institute

Morgan, Putzig, and fellow SHARAD team members had made multiple unsuccessful attempts to observe the area suspected of hosting a buried lake. Then the scientists partnered with the spacecraft’s operations team at NASA’s Jet Propulsion Laboratory in Southern California, which leads the mission, to develop the very large roll capability. 

Because the radar’s antenna is at the back of MRO, the orbiter’s body obstructs its view and weakens the instrument’s sensitivity. After considerable work, engineers at JPL and Lockheed Martin Space in Littleton, Colorado, which built the spacecraft and supports its operations, developed commands for a 120-degree roll — a technique that requires careful planning to keep the spacecraft safe — to direct more of SHARAD’s signal at the surface.

Bright signal  

On May 26, SHARAD performed a very large roll to finally pick up the signal in the target area, which spans about 12.5 miles (20 kilometers) and is buried under a slab of water ice almost 1 mile (1,500 meters) thick.  

When a radar signal bounces off underground layers, the strength of its reflection depends on what the subsurface is made of. Most materials let the signal slip through or absorb it, making the return faint. Liquid water is special in that it produces a very reflective surface, sending back a very strong signal (imagine pointing a flashlight at a mirror). 

That’s the kind of signal that was spotted from this area in 2018 by a team working with the Mars Advanced Radar for Subsurface and Ionospheric Sounding (MARSIS) instrument aboard the ESA (European Space Agency) Mars Express orbiter. To explain how such a body of water could remain liquid under all that ice, scientists have hypothesized it could be a briny lake, since high salt content can lower water’s freezing temperature. 

An antenna sticks out like whiskers from NASA’s Mars Reconnaissance Orbiter in this artist’s concept depicting the spacecraft, which has been orbiting the Red Planet since 2006. This antenna is part of SHARAD, a radar that peers below the Martian surface.
NASA/JPL-Caltech

“We’ve been observing this area with SHARAD for almost 20 years without seeing anything from those depths,” said Putzig. But once MRO achieved a very large roll over the precise area, the team was able to look much deeper. And rather than the bright signal MARSIS received, SHARAD detected a faint one. A different very-large-roll observation of an adjacent area didn’t detect a signal at all, suggesting something unique is causing a quirky radar signal at the exact spot MARSIS saw a signal. 

“The lake hypothesis generated lots of creative work, which is exactly what exciting scientific discoveries are supposed to do,” said Morgan. “And while this new data won’t settle the debate, it makes it very hard to support the idea of a liquid water lake.”

Alternative explanations

Mars’ south pole has an ice cap sitting atop heavily cratered terrain, and most radar images of the area below the ice show lots of peaks and valleys. Morgan and Putzig said it’s possible that the bright signal MARSIS detected here may just be a rare smooth area — an ancient lava flow, for example. 

Both scientists are excited to use the very large roll technique to reexamine other scientifically interesting regions of Mars. One such place is Medusae Fossae, a sprawling geologic formation on Mars’ equator that produces little radar return. While some scientists have suggested it’s composed of layers of volcanic ash, others have suggested the layers may include heaps of ice deep within. 

“If it’s ice, that means there’s lots of water resources near the Martian equator, where you’d want to send humans,” said Putzig. “Because the equator is exposed to more sunlight, it’s warmer and ideal for astronauts to live and work.” 

More about MRO

NASA’s Jet Propulsion Laboratory in Southern California manages MRO for the agency’s Science Mission Directorate in Washington as part of NASA’s Mars Exploration Program portfolio. Lockheed Martin Space in Denver built MRO and supports its operations. SHARAD was provided to the MRO mission by the Italian Space Agency (ASI).

News Media Contacts

Andrew Good 
Jet Propulsion Laboratory, Pasadena, Calif. 
818-393-2433 
andrew.c.good@jpl.nasa.gov 

Karen Fox / Molly Wasser 
NASA Headquarters, Washington
202-358-1600
karen.c.fox@nasa.gov / molly.l.wasser@nasa.gov

2025-130

NASA, Aerospace Corporation Study Sharpens Focus on Ammonia Emissions

By: scarney1

6 min read

Preparations for Next Moonwalk Simulations Underway (and Underwater)

Researchers used data taken in March 2023 by an airborne imaging spectrometer to map ammonia emissions in the Imperial Valley. Produced by agricultural activities as well as geothermal processes, ammonia is a precursor to particulate matter, which can cause adverse health outcomes when inhaled.
NASA/JPL-Caltech

The pungent gas contributes to fine airborne particulate pollution, which endangers human health when inhaled and absorbed in the bloodstream. 

A recent study led by scientists at NASA’s Jet Propulsion Laboratory in Southern California and the nonprofit Aerospace Corporation shows how high-resolution maps of ground-level ammonia plumes can be generated with airborne sensors, highlighting a way to better track the gas. A key chemical ingredient of fine particulate matter — tiny particles in the air known to be harmful when inhaled — ammonia can be released through agricultural activities such as livestock farming and geothermal power generation as well as natural geothermal processes. Because it’s not systematically monitored, many sources of the pungent gas go undetected.  

Published in Atmospheric Chemistry and Physics in October, the study focuses on a series of 2023 research flights that covered the Imperial Valley to the southeast of the Salton Sea in inland Southern California, as well as the Eastern Coachella Valley to its northwest. Prior satellite-based research has identified the Imperial Valley as a prolific source of gaseous ammonia. In the study, scientists employed an airborne sensor capable of resolving ammonia plumes with enough detail to track their origins: Aerospace Corporation’s Mako instrument is an imaging spectrometer that observes long-wave infrared light emitted by areas of Earth’s surface and atmosphere 6 feet (2 meters) across. 

Using the instrument, which can detect ammonia’s chemical signature by the infrared light it absorbs, the authors found elevated levels of the gas near several sources, including agricultural fields, livestock feedlots, geothermal plants, and geothermal vents. Measurements in parts of the Imperial Valley were 2½ to eight times higher than in Coachella Valley’s Mecca community, which had ammonia concentrations closer to background levels. 

Though not toxic on its own in low concentrations, ammonia is a precursor to particulate matter, also known as aerosol or particle pollution. It reacts with other gases to form solid ammonium salt particles small enough to penetrate the bloodstream from the lungs. Particles under 2.5 micrometers in diameter — also known as PM2.5 — are associated with elevated rates of asthma, lung cancer, and cardiovascular disease, among other negative health outcomes. 

“Historically, more attention has focused on primary sources of PM2.5, such as auto emissions. But with significant reductions in those emissions and increasingly stringent air quality standards, there is growing interest in understanding secondary sources that form particles in the air from precursor gases,” said Sina Hasheminassab, lead author of the paper and a research scientist at JPL. “As an important precursor to PM2.5, ammonia plays a key role, but its emissions are poorly characterized and undermonitored.” 

Rising ammonia 

Previous satellite-based studies have shown rising levels of atmospheric ammonia, both globally and in the continental United States. That research revealed broad trends, but with spatial resolution on the order of tens of miles, the measurements were only sufficient to identify variation over areas of hundreds of square miles or more. 

The chemical behavior of ammonia also poses a particular monitoring challenge: Once emitted, it only stays in the atmosphere for hours before reacting with other compounds. In contrast, carbon dioxide can remain in the air for centuries. 

Planes and satellites can provide an overview of sources and the geographic distribution of emissions at a given moment. Although satellites offer wider and more recurrent coverage, airborne instruments, being closer to the source, produce higher-resolution data and can focus on specific locations at designated times.  

Those proved to be the right capabilities for the recent study. Researchers flew Mako over the Imperial and Eastern Coachella valleys on the mornings and afternoons of March 28 and Sept. 25, 2023, and took concurrent measurements on the ground with both a fixed monitoring station in Mecca operated by the South Coast Air Quality Management District (AQMD) and a mobile spectrometer developed at the University of California, Riverside. 

“The goal was to show that this technique was capable of delivering data with the required accuracy that aerosol scientists and potentially even air quality regulatory bodies could use to improve the air quality in those regions,” said David Tratt, a senior scientist at Aerospace Corporation and coauthor of the paper. “We ended up with maps that identify multiple sources of ammonia, and we were able to track the plumes from their sources and observe them coalescing into larger clouds.” 

Distinct plumes 

During the flights, the team collected data over the southeastern coast of the Salton Sea, which straddles Riverside and Imperial counties. There, Mako revealed small plumes coming from geothermal fumaroles venting superheated water and steam that react with nitrogen-bearing compounds in the soil, releasing ammonia. 

Farther to the southeast, the results showed several geothermal power plants emitting ammonia, primarily from their cooling towers, as part of their normal operations. 

Farther southeast still, the researchers spotted ammonia emissions, a byproduct of animal waste, from cattle farms in the Imperial Valley. During the March 28 flight, a plume from the largest facility in the study area measured up to 1.7 miles (2.8 kilometers) wide and extended up to 4.8 miles (7.7 kilometers) downwind of the source.

‘Very large puzzle’ 

As part of the study, AQMD’s Mecca monitoring station recorded seasonal changes in ammonia concentrations. Given the few sources in the area, the researchers surmised that winds during certain months tend to blow the gas from Imperial Valley to the Coachella Valley. 

The study underscores the benefits of detailed spatial information about ammonia emissions, and it partly informed the agency’s decision in July to expand its ammonia-monitoring network and extend the life of the Mecca station. 

As a precursor to PM2.5, ammonia is “one piece of a very large puzzle” that, for Coachella Valley residents, includes vehicle emissions, desert dust, and agricultural activities, said Payam Pakbin, manager of the Advanced Monitoring Technologies Unit at AQMD and a paper coauthor. 

“These communities want to know the contributions of these sources to the air quality they’re experiencing,” he added. “Findings like these help our agency better prioritize which sources require the most attention and ultimately guide our focus toward those that are the highest priority for achieving emission reductions in this community.” 

News Media Contacts

Andrew Wang / Andrew Good
Jet Propulsion Laboratory, Pasadena, Calif.
626-379-6874 / 626-840-4291
andrew.wang@jpl.nasa.gov / andrew.c.good@jpl.nasa.gov

2025-129

Share

Details

Last Updated
Nov 20, 2025

NASA’s Mars Spacecraft Capture Images of Comet 3I/ATLAS

By: scarney1

6 min read

Preparations for Next Moonwalk Simulations Underway (and Underwater)

On a largely black background, interstellar comet 3I/ATLAS appears as a white smudge with a semicircular shape at its core. A transparent white cloud extends slightly from the comet toward the bottom left of the image and, to a lesser extent, toward the right side of the image.
The High-Resolution Imaging Science Experiment (HiRISE) camera aboard NASA’s Mars Reconnaissance Orbiter captured this image of interstellar comet 3I/ATLAS on Oct. 2, 2025. At the time it was imaged, the comet was about 0.2 astronomical units (18.6 million miles, or 29.9 million kilometers) from the from the spacecraft.
NASA/JPL-Caltech/University of ArizonaNASA/JPL-Caltech/University of Arizona
On a largely black background, interstellar comet 3I/ATLAS appears as a white smudge with a semicircular shape at its core. A transparent white cloud extends slightly from the comet toward the bottom left of the image and, to a lesser extent, toward the right side of the image. A scale bar indicates a distance of 932 miles above the comet, and an arrow pointing from the comet to the bottom left of the image is labeled “comet trajectory.”
An annotated version of the image of 3I/ATLAS captured by NASA’s Mars Reconnaissance Orbiter shows the trajectory of the interstellar comet along with a scale bar. The image was captured by the spacecraft’s High Resolution Imaging Science Experiment (HiRISE) camera on Oct. 2, 2025.
NASA/JPL-Caltech/University of Arizona

Two orbiters and a rover captured images of the interstellar object — from the closest location any of the agency’s spacecraft may get — that could reveal new details.

At the start of October, three of NASA’s Mars spacecraft had front row seats to view 3I/ATLAS, only the third interstellar object so far discovered in our solar system. The Mars Reconnaissance Orbiter (MRO) snapped a close-up of the comet, while the MAVEN (Mars Atmosphere and Volatile EvolutioN) orbiter captured ultraviolet images and the Perseverance rover caught a faint glimpse as well.  

Imagery from MRO will allow scientists to better estimate the comet’s size, and MAVEN’s images are unique among all observations this year in determining the chemical makeup of the comet and how much water vapor is released as the Sun warms the comet. These details will help scientists better understand the past, present, and future of this object.

HiRISE 

The comet will be at its closest approach to Earth on Friday, Dec. 19. On Oct. 2, MRO observed 3I/ATLAS from 19 million miles (30 million kilometers) away, with one of the closest views that any NASA spacecraft or Earth-based telescopes are expected to get.  

The orbiter’s team viewed the comet with a camera called HiRISE (the High Resolution Imaging Science Experiment), which normally points at the Martian surface. By rotating, MRO can point HiRISE at celestial objects as well — a technique used in 2014, when HiRISE joined MAVEN in studying another comet, called Siding Spring

Captured at a scale of roughly 19 miles (30 kilometers) per pixel, 3I/ATLAS looks like a pixelated white ball on the HiRISE imagery. That ball is a cloud of dust and ice called the coma, which the comet shed as it continued its trajectory past Mars. 

A square, pixelated image with a dark background. At the center is a roughly circular cluster of bright pixels, transitioning from white at the very center to light blue, then darker blue and purple as it spreads outward. The edges and corners of the image are mostly dark purple and black pixels.
This ultraviolet image shows the halo of gas and dust, or coma, surrounding comet 3I/ATLAS as seen on Oct. 9, 2025, by NASA’s MAVEN spacecraft using its Imaging Ultraviolet Spectrograph. The brightest pixel at center indicates where the comet is. The surrounding bright pixels show where hydrogen atoms were detected coming from the comet.
NASA/Goddard/LASP/CU Boulder
A wide, rectangular, pixelated image with a dark purple background. Near the right side, there is a bright, elongated cluster of pixels labeled “Mars hydrogen” that transition from white at the center to light blue and then darker blue as they extend leftward. Fainter blue and purple pixels form a tapered shape stretching further to the left, labeled “interplanetary hydrogen”. Farther left is a more circular cluster of faint blue pixels, labeled “Comet 3I/ATLAS hydrogen.” The rest of the image is filled with dark purple and black pixels.
This annotated composite image showing hydrogen atoms from three sources, including 3I/ATLAS (at left), was captured Sept. 28, 2025, by NASA’s MAVEN orbiter using its Imaging Ultraviolet Spectrograph. Hydrogen emitted by Mars is the bright streak at right, with interplanetary hydrogen flowing through the solar system indicated by the dimmer streak in the middle.
NASA/Goddard/LASP/CU Boulder

“Observations of interstellar objects are still rare enough that we learn something new on every occasion,” said Shane Byrne, HiRISE principal investigator at the University of Arizona in Tucson. “We’re fortunate that 3I/ATLAS passed this close to Mars.” 

Further study of the HiRISE imagery could help scientists estimate the size of the comet’s nucleus, its central core of ice and dust. More study also may reveal the size and color of particles within its coma. 

“One of MRO’s biggest contributions to NASA’s work on Mars has been watching surface phenomena that only HiRISE can see,” said MRO’s project scientist Leslie Tamppari of NASA’s Jet Propulsion Laboratory in Southern California. “This is one of those occasions where we get to study a passing space object as well.” 

MAVEN  

Over the course of 10 days starting Sept. 27, MAVEN captured 3I/ATLAS in two unique ways with its Imaging Ultraviolet Spectrograph (IUVS) camera. First, IUVS took multiple images of the comet in several wavelengths, much like using various filters on a camera. Then it snapped high-resolution UV images to identify the hydrogen coming from 3I/ATLAS. Studying a combination of these images, scientists can identify a variety of molecules and better understand the comet’s composition.  

“The images MAVEN captured truly are incredible,” said Shannon Curry, MAVEN’s principal investigator and research scientist at the Laboratory for Atmospheric and Space Physics (LASP) at the University of Colorado Boulder. “The detections we are seeing are significant, and we have only scraped the surface of our analysis.” 

The IUVS data also offers an estimated upper limit of the comet’s ratio of deuterium (a heavy isotope of hydrogen) to regular hydrogen, a tracer of the comet’s origin and evolution. When the comet was at its closest to Mars, the team used more sensitive channels of IUVS to map different atoms and molecules in the comet’s coma, such as hydrogen and hydroxyl. Further study of the comet’s chemical makeup could reveal more about its origins and evolution. 

“There was a lot of adrenaline when we saw what we’d captured,” said MAVEN’s deputy principal investigator, Justin Deighan, a LASP scientist and the lead on the mission’s comet 3I/ATLAS observations. “Every measurement we make of this comet helps to open up a new understanding of interstellar objects.” 

A predominantly black view of space is dotted with stars, seen as short white streaks, in an animated image that consists of two observations. In the right half of the image, interstellar comet 3I/ATLAS is a barely visible white smudge that becomes slightly more distinct in the second observation.
Interstellar comet 3I/ATLAS is seen as a faint smudge against a background starfield in two images taken by the Mastcam-Z instrument aboard NASA’s Perseverance Mars rover on Oct. 4, 2025. At the time it was imaged, the comet was about 19 million miles (30 million kilometers) from the rover, which was exploring the rim of the Red Planet’s Jezero Crater.
NASA/JPL-Caltech/ASU/MSSS

Perseverance 

Far below the orbiters, on the Martian surface, NASA’s Perseverance rover also caught sight of 3I/ATLAS. On Oct. 4, the comet appeared as a faint smudge to the rover’s Mastcam-Z camera. The exposure had to be exceptionally long to detect such a faint object. Unlike telescopes that track objects as they move, Mastcam-Z is fixed in place during long exposures. This technique produces star trails that appear as streaks in the sky, though the comet itself is barely perceptible. 

More about MRO, MAVEN, Perseverance 

A division of Caltech in Pasadena, California, JPL manages MRO for NASA’s Science Mission Directorate in Washington as part of NASA’s Mars Exploration Program portfolio. The University of Arizona in Tucson operates MRO’s HiRISE, which was built by BAE Systems in Boulder, Colorado. Lockheed Martin Space in Denver built MRO and supports its operations. 

The MAVEN mission, also part of NASA’s Mars Exploration Program portfolio, is led by the Laboratory for Atmospheric and Space Physics at the University of Colorado Boulder. It’s managed by NASA’s Goddard Space Flight Center in Greenbelt, Maryland. MAVEN was built and operated by Lockheed Martin Space in Littleton, Colorado, with navigation and network support from JPL. 

JPL built and manages operations of the Perseverance rover on behalf of the agency’s Science Mission Directorate as part of NASA’s Mars Exploration Program portfolio. 

To learn more about NASA’s observations of comet 3I/ATLAS, visit: 

https://go.nasa.gov/3I-ATLAS

News Media Contacts

Andrew Good 
Jet Propulsion Laboratory, Pasadena, Calif. 
818-393-2433 
andrew.c.good@jpl.nasa.gov 

Alise Fisher / Molly Wasser 
NASA Headquarters, Washington 
202-617-4977 / 240-419-1732 
alise.m.fisher@nasa.gov / molly.l.wasser@nasa.gov 

2025-128

Share

Details

Last Updated
Nov 19, 2025

Related Terms

NASA, European Partners Set to Launch Sentinel-6B Earth Satellite

By: scarney1

5 min read

Preparations for Next Moonwalk Simulations Underway (and Underwater)

A wide-angle, distant photo of a white rocket on the launch pad, brightly lit, with a black night sky behind it.
Set to launch no earlier than Nov. 16, Sentinel-6B will continue the data record now being collected by its twin satellite Sentinel-6 Michael Freilich, which lifted off from Vandenberg Space Force Base in November 2020 aboard the SpaceX Falcon 9 rocket shown here.
SpaceX

Set to track sea levels across more than 90% of Earth’s ocean, the mission must first get into orbit. Here’s what to expect.  

Sentinel-6B, an ocean-tracking satellite jointly developed by NASA and ESA (European Space Agency), is ready to roll out to the launch pad, packed into the payload fairing of a SpaceX Falcon 9 rocket.   

Launch is targeted at 12:21 a.m. EST, Monday, Nov. 17 (9:21 p.m. PST, Sunday, Nov. 16). Once it lifts off from Vandenberg Space Force Base in California, the satellite will ride out a 57-minute sequence of events ending in spacecraft separation, when the satellite detaches from the rocket.  

Then Sentinel-6B’s real work begins. Orbiting Earth every 112 minutes at 4.5 miles (7.2 kilometers) per second, the satellite will eventually take over for its twin, Sentinel-6 Michael Freilich, launched five years ago, to continue a multidecade dataset for sea level measurements from space. Those measurements, along with atmospheric data the mission gathers, will help improve public safety and city planning while protecting coastal infrastructure, including power plants and defense interests. NASA will also use the data to refine atmospheric models that support the safe re-entry of Artemis astronauts.  

Here’s a closer look at what lies ahead for the satellite in the coming days.

Launch timeline 

Measuring 19.1 feet (5.82 meters) long and 7.74 feet (2.36 meters) high (including the communications antennas), the satellite weighs in at around 2,600 pounds (1,200 kilograms) when loaded with propellant at launch. 

The satellite will lift off from Space Launch Complex 4 East at Vandenberg. If needed, backup launch opportunities are available on subsequent days, with the 20-second launch window occurring about 12 to 13 minutes earlier each day.  

A little more than two minutes after the Falcon 9 rocket lifts off, the main engine cuts off. Shortly after, the rocket’s first and second stages separate, followed by second-stage engine start. The reusable Falcon 9 first stage then begins its automated boost-back burn to the launch site for a powered landing. About three minutes after launch, the two halves of the payload fairing, which protected the satellite as it traveled through the atmosphere, separate and fall safely back to Earth.  

The first cutoff of the second stage engine takes place approximately eight minutes after liftoff, at which point the launch vehicle and the spacecraft will be in a temporary “parking” orbit. The second stage engine fires a second time about 44 minutes later, and about 57 minutes after liftoff, the rocket and the spacecraft separate. Roughly seven minutes after that, the satellite’s solar panels deploy. Sentinel-6B is expected to make first contact with ground controllers about 35 minutes after separation (roughly an hour and a half after liftoff) — a major milestone indicating that the spacecraft is healthy. 

Science mission 

Following launch operations, the team will focus on its next challenge: getting the spacecraft ready for science operations. Once in orbit, Sentinel-6B will fly about 30 seconds behind its twin, the Sentinel-6 Michael Freilich satellite. When scientists and engineers have completed cross-calibrating the data collected by the two spacecraft, Sentinel-6B will take over the role of providing primary sea level measurements while Sentinel-6 Michael Freilich will move into a different orbit. From there, researchers plan to use measurements from Sentinel-6 Michael Freilich for different purposes, including helping to map seafloor features (variations in sea surface height can reveal variations in ocean floor features, such as seamounts). 

Sentinel-6B is part of a U.S.-European mission that will continue 30-year-plus record of sea-level measurements. Its observations will help build an accurate picture of local and global sea surface heights to support storm forecasting, secure coastal infrastructure, and help optimize commercial activities, such as shipping.
NASA/JPL-Caltech

Where to find launch coverage 

Launch day coverage of the mission will be available on the agency’s website, including links to live streaming and blog updates beginning no earlier than 11 p.m. EST, Nov. 16, as the countdown milestones occur. Streaming video and photos of the launch will be accessible on demand shortly after liftoff. Follow countdown coverage on NASA’s Sentinel-6B blog.  

For more information about NASA’s live programming schedule, visit 
plus.nasa.gov/scheduled-events

More about Sentinel-6B

The Copernicus Sentinel-6/Jason-CS (Continuity of Service) mission is a collaboration between NASA, ESA, EUMETSAT (European Organisation for the Exploitation of Meteorological Satellites), and the National Oceanic and Atmospheric Administration (NOAA). The European Commission contributed funding support while France’s space agency CNES (Centre National d’Études Spatiales) provided technical expertise. The mission also marks the first international involvement in Copernicus, the European Union’s Earth Observation Programme.  

A division of Caltech in Pasadena, JPL built three science instruments for each Sentinel-6 satellite: the Advanced Microwave Radiometer, the Global Navigation Satellite System – Radio Occultation, and the Laser Retroreflector Array. NASA is also contributing launch services, ground systems supporting operation of the NASA science instruments, the science data processors for two of these instruments, and support for the U.S. members of the international Ocean Surface Topography and Sentinel-6 science teams. The launch service is managed by NASA’s Launch Services Program, based at the agency’s Kennedy Space Center in Florida.

News Media Contacts

Elizabeth Vlock
NASA Headquarters, Washington
202-358-1600
elizabeth.a.vlock@nasa.gov

Andrew Wang / Andrew Good
Jet Propulsion Laboratory, Pasadena, Calif.
626-379-6874 / 626-840-4291
andrew.wang@jpl.nasa.gov / andrew.c.good@jpl.nasa.gov

2025-125

💾

NASA and its U.S. and international partners have teamed up to launch a new Earth-observing satellite called Sentinel-6B that will measure sea surface height...

6 Things to Know From NASA About New US, European Sea Satellite

By: scarney1

6 min read

Preparations for Next Moonwalk Simulations Underway (and Underwater)

Set to launch no earlier than Nov. 16, Sentinel-6B will continue a decades-long data record of sea level measurement that will help decision-makers manage coastal flooding, support hurricane intensity forecasts, and assist in the return of astronauts from space.
NASA

Data from Sentinel-6B will continue a decades-long record of sea surface height, helping to improve coastal planning, protect critical infrastructure, and advance weather forecasts.

With launch set for no earlier than 12:21 a.m. EST Monday, Nov. 17, Sentinel-6B is the latest satellite in a series of spacecraft NASA and its partners have used to measure sea levels since 1992. Their data has helped meteorologists improve hurricane forecasts, managers protect infrastructure, and coastal communities plan. 

After launch, Sentinel-6B will begin the process of data cross-calibration with its predecessor, Sentinel-6 Michael Freilich, to provide essential information about Earth’s ocean. 

Sentinel-6B is the second of two satellites that constitute the Sentinel-6/Jason-CS (Continuity of Service) mission, a collaboration between NASA, ESA (European Space Agency), EUMETSAT (European Organisation for the Exploitation of Meteorological Satellites), and the National Oceanic and Atmospheric Administration (NOAA). The European Commission contributed funding support while France’s space agency CNES (Centre National d’Études Spatiales) provided technical expertise.

Here are six things to know about Sentinel-6B and the broader Copernicus Sentinel-6/Jason-CS mission: 

1. Sentinel-6B will deliver data on about 90% of Earth’s ocean, providing direct benefits to humanity.

Sentinel-6B will contribute to a multidecade dataset for sea level measurements from space. This data is key to helping improve public safety, city planning, and protecting commercial and defense interests. 

Pioneered by NASA and its partners, the dataset enables users in government, industry, and the research community to better understand how sea levels change over time. Combined with information from other NASA satellites, data from Copernicus Sentinel-6/Jason-CS is vital for tracking how heat and energy move through Earth’s seas and atmosphere, as well as for monitoring ocean features such as currents and eddies. The measurements come courtesy of a radar altimeter that measures sea levels for nearly all of Earth’s ocean, providing information on large-scale currents that can aid in commercial and naval navigation, search and rescue, and the tracking of debris and pollutants from disasters at sea.

Sentinel-6B is part of a U.S.-European mission that will continue 30-year-plus record of sea-level measurements. Its observations will help build an accurate picture of local and global sea surface heights to support storm forecasting, secure coastal infrastructure, and help optimize commercial activities, such as shipping.
Credit: NASA/JPL-Caltech

2. Data from the Copernicus Sentinel-6/Jason-CS mission helps NASA prepare for the next phase of space exploration.

The better we understand Earth, the better NASA can carry out its mission to explore the universe. Data from the Copernicus Sentinel-6/Jason-CS mission is used to refine the Goddard Earth Observing System atmospheric forecast models, which the NASA Engineering Safety Center uses to plan safer reentry of astronauts returning from Artemis missions.

Additionally, changes to Earth’s ocean, observed by satellites, can have measurable effects beyond our planet. For instance, while the Moon influences ocean tides on Earth, changes in those tides can also exert a small influence on the Moon. Data from Copernicus Sentinel-6/Jason-CS can help improve understanding of this relationship, knowledge that can contribute to future lunar exploration missions.

3. The Copernicus Sentinel-6/Jason-CS mission helps the U.S. respond to challenges by putting actionable information into the hands of decision-makers.

Data collected by the mission helps city planners, as well as local and state governments, to make informed decisions on protecting coastal infrastructure, real estate, and energy facilities. The mission’s sea level data also improves meteorologists’ weather predictions, which are critical to commercial and recreational navigation. By enhancing weather prediction models, data provided by Copernicus Sentinel-6/Jason-CS improves forecasts of hurricane development, including the likelihood of storm intensification, which can aid disaster preparedness and response.

4. Data from Sentinel-6B will support national security efforts.

The ocean and atmosphere measurements from Sentinel-6B will enable decision-makers to better protect coastal military installations from such events as nuisance flooding while aiding national defense efforts by providing crucial information about weather and ocean conditions. The satellite will do so by feeding near-real time data on Earth’s atmosphere and seas to forward-looking weather and ocean models. Since the measurements are part of a long-term dataset, they also can add historical context that puts the new data in perspective.

5. The Copernicus Sentinel-6/Jason-CS mission’s direct observation of sea levels delivers information critical to protecting coastlines, where nearly half of the world’s population lives.

Sea level rise varies from one area to another, meaning that some coastlines are more vulnerable than others to flooding, erosion, and saltwater contamination of underground freshwater supplies, the latter of which threatens farmland and drinking water. Sea level measurements from Sentinel-6 Michael Freilich, and soon, Sentinel-6B, form the basis of U.S. flood predictions for coastal infrastructure, real estate, energy storage sites, and other coastal assets. Knowing which regions are more vulnerable to these risks will enable U.S. industries and emergency managers to make better-informed decisions about transportation and commercial infrastructure, land-use planning, water management, and adaptation strategies.

6. The international collaboration behind the mission enables the pooling of capabilities, resources, and expertise.

The multidecadal dataset that this mission supports is the result of years of close work between NASA and several collaborators, including NASA, ESA, EUMETSAT, CNES, and NOAA. By pooling expertise and resources, this partnership has delivered cost-effective solutions that have made precise, high-impact data available to industry and government agencies alike.

More about Sentinel-6B

Copernicus Sentinel-6/Jason-CS was jointly developed by ESA, EUMETSAT, NASA, and NOAA, with funding support from the European Commission and technical support from CNES. The mission also marks the first international involvement in Copernicus, the European Union’s Earth Observation Programme. 

Managed for NASA by Caltech in Pasadena, JPL contributed three science instruments for each Sentinel-6 satellite: the Advanced Microwave Radiometer, the Global Navigation Satellite System – Radio Occultation, and the laser retroreflector array. NASA is also contributing launch services, ground systems supporting operation of the NASA science instruments, the science data processors for two of these instruments, and support for the international ocean surface topography community. 

For more about Sentinel-6B, visit:

https://science.nasa.gov/mission/sentinel-6B

News Media Contacts

Elizabeth Vlock
NASA Headquarters, Washington
202-358-1600
elizabeth.a.vlock@nasa.gov

Andrew Wang / Andrew Good
Jet Propulsion Laboratory, Pasadena, Calif.
626-379-6874 / 626-840-4291
andrew.wang@jpl.nasa.gov / andrew.c.good@jpl.nasa.gov

2025-124

💾

NASA and its U.S. and international partners have teamed up to launch a new Earth-observing satellite called Sentinel-6B that will measure sea surface height...
❌