Reading view

There are new articles available, click to refresh the page.

Ore Formation: A Surface Level Look

The past few months, we’ve been giving you a quick rundown of the various ways ores form underground; now the time has come to bring that surface-level understanding to surface-level processes.

Strictly speaking, we’ve already seen one: sulfide melt deposits are associated with flood basalts and meteorite impacts, which absolutely are happening on-surface. They’re totally an igneous process, though, and so were presented in the article on magmatic ore processes.

For the most part, you can think of the various hydrothermal ore formation processes as being metamorphic in nature. That is, the fluids are causing alteration to existing rock formations; this is especially true of skarns.

There’s a third leg to that rock tripod, though: igneous, metamorphic, and sedimentary. Are there sedimentary rocks that happen to be ores? You betcha! In fact, one sedimentary process holds the most valuable ores on Earth– and as usual, it’s not likely to be restricted to this planet alone.

Placer? I hardly know ‘er!

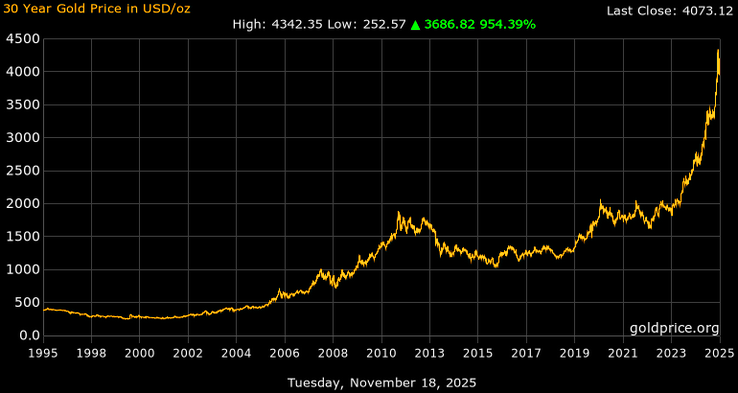
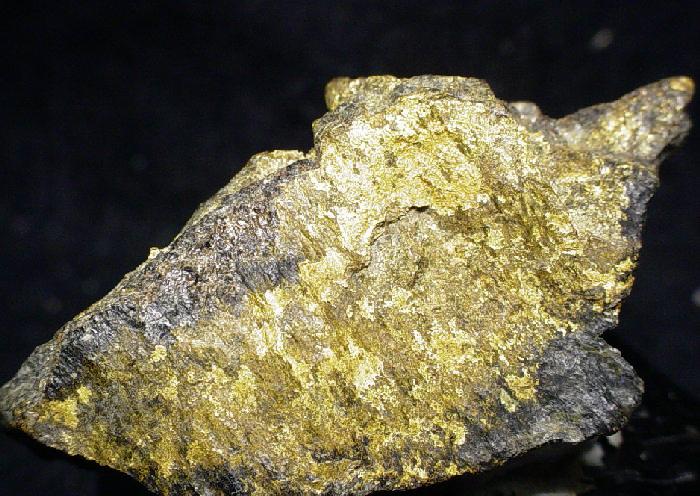
We’re talking about placer deposits, which means we’re talking about gold. In dollar value, gold’s great expense means that these deposits are amongst the most valuable on Earth– and nearly half of the world’s gold has come out of just one of them. Gold isn’t the only mineral that can be concentrated in placer deposits, to be clear; it’s just the one everyone cares about these days, because, well, have you seen the spot price lately?

The spot price of gold going back 30 years. Oof.
Oof. Data from Goldprice.org

Since we’re talking about sediments, as you might guess, this is a secondary process: the gold has to already be emplaced by one of the hydrothermal ore processes. Then the usual erosion happens: wind and water breaks down the rock, and gold gets swept downhill along with all the other little bits of rock on their way to becoming sediments. Gold, however, is much denser than silicate rocks. That’s the key here: any denser material is naturally going to be sorted out in a flow of grains. To be specific, empirical data shows that anything denser than 2.87 g/cm3 can be concentrated in a placer deposit. That would qualify a lot of the sulfide minerals the hydrothermal processes like to throw up, but unfortunately sulfides tend to be both too soft and too chemically unstable to hold up to the weathering to form placer deposits, at least on Earth since cyanobacteria polluted the atmosphere with O2.

Windswept dunes on Mars as pictured by MSL.
Dry? Check. Windswept? Check. Aeolian placer deposits? Maybe!
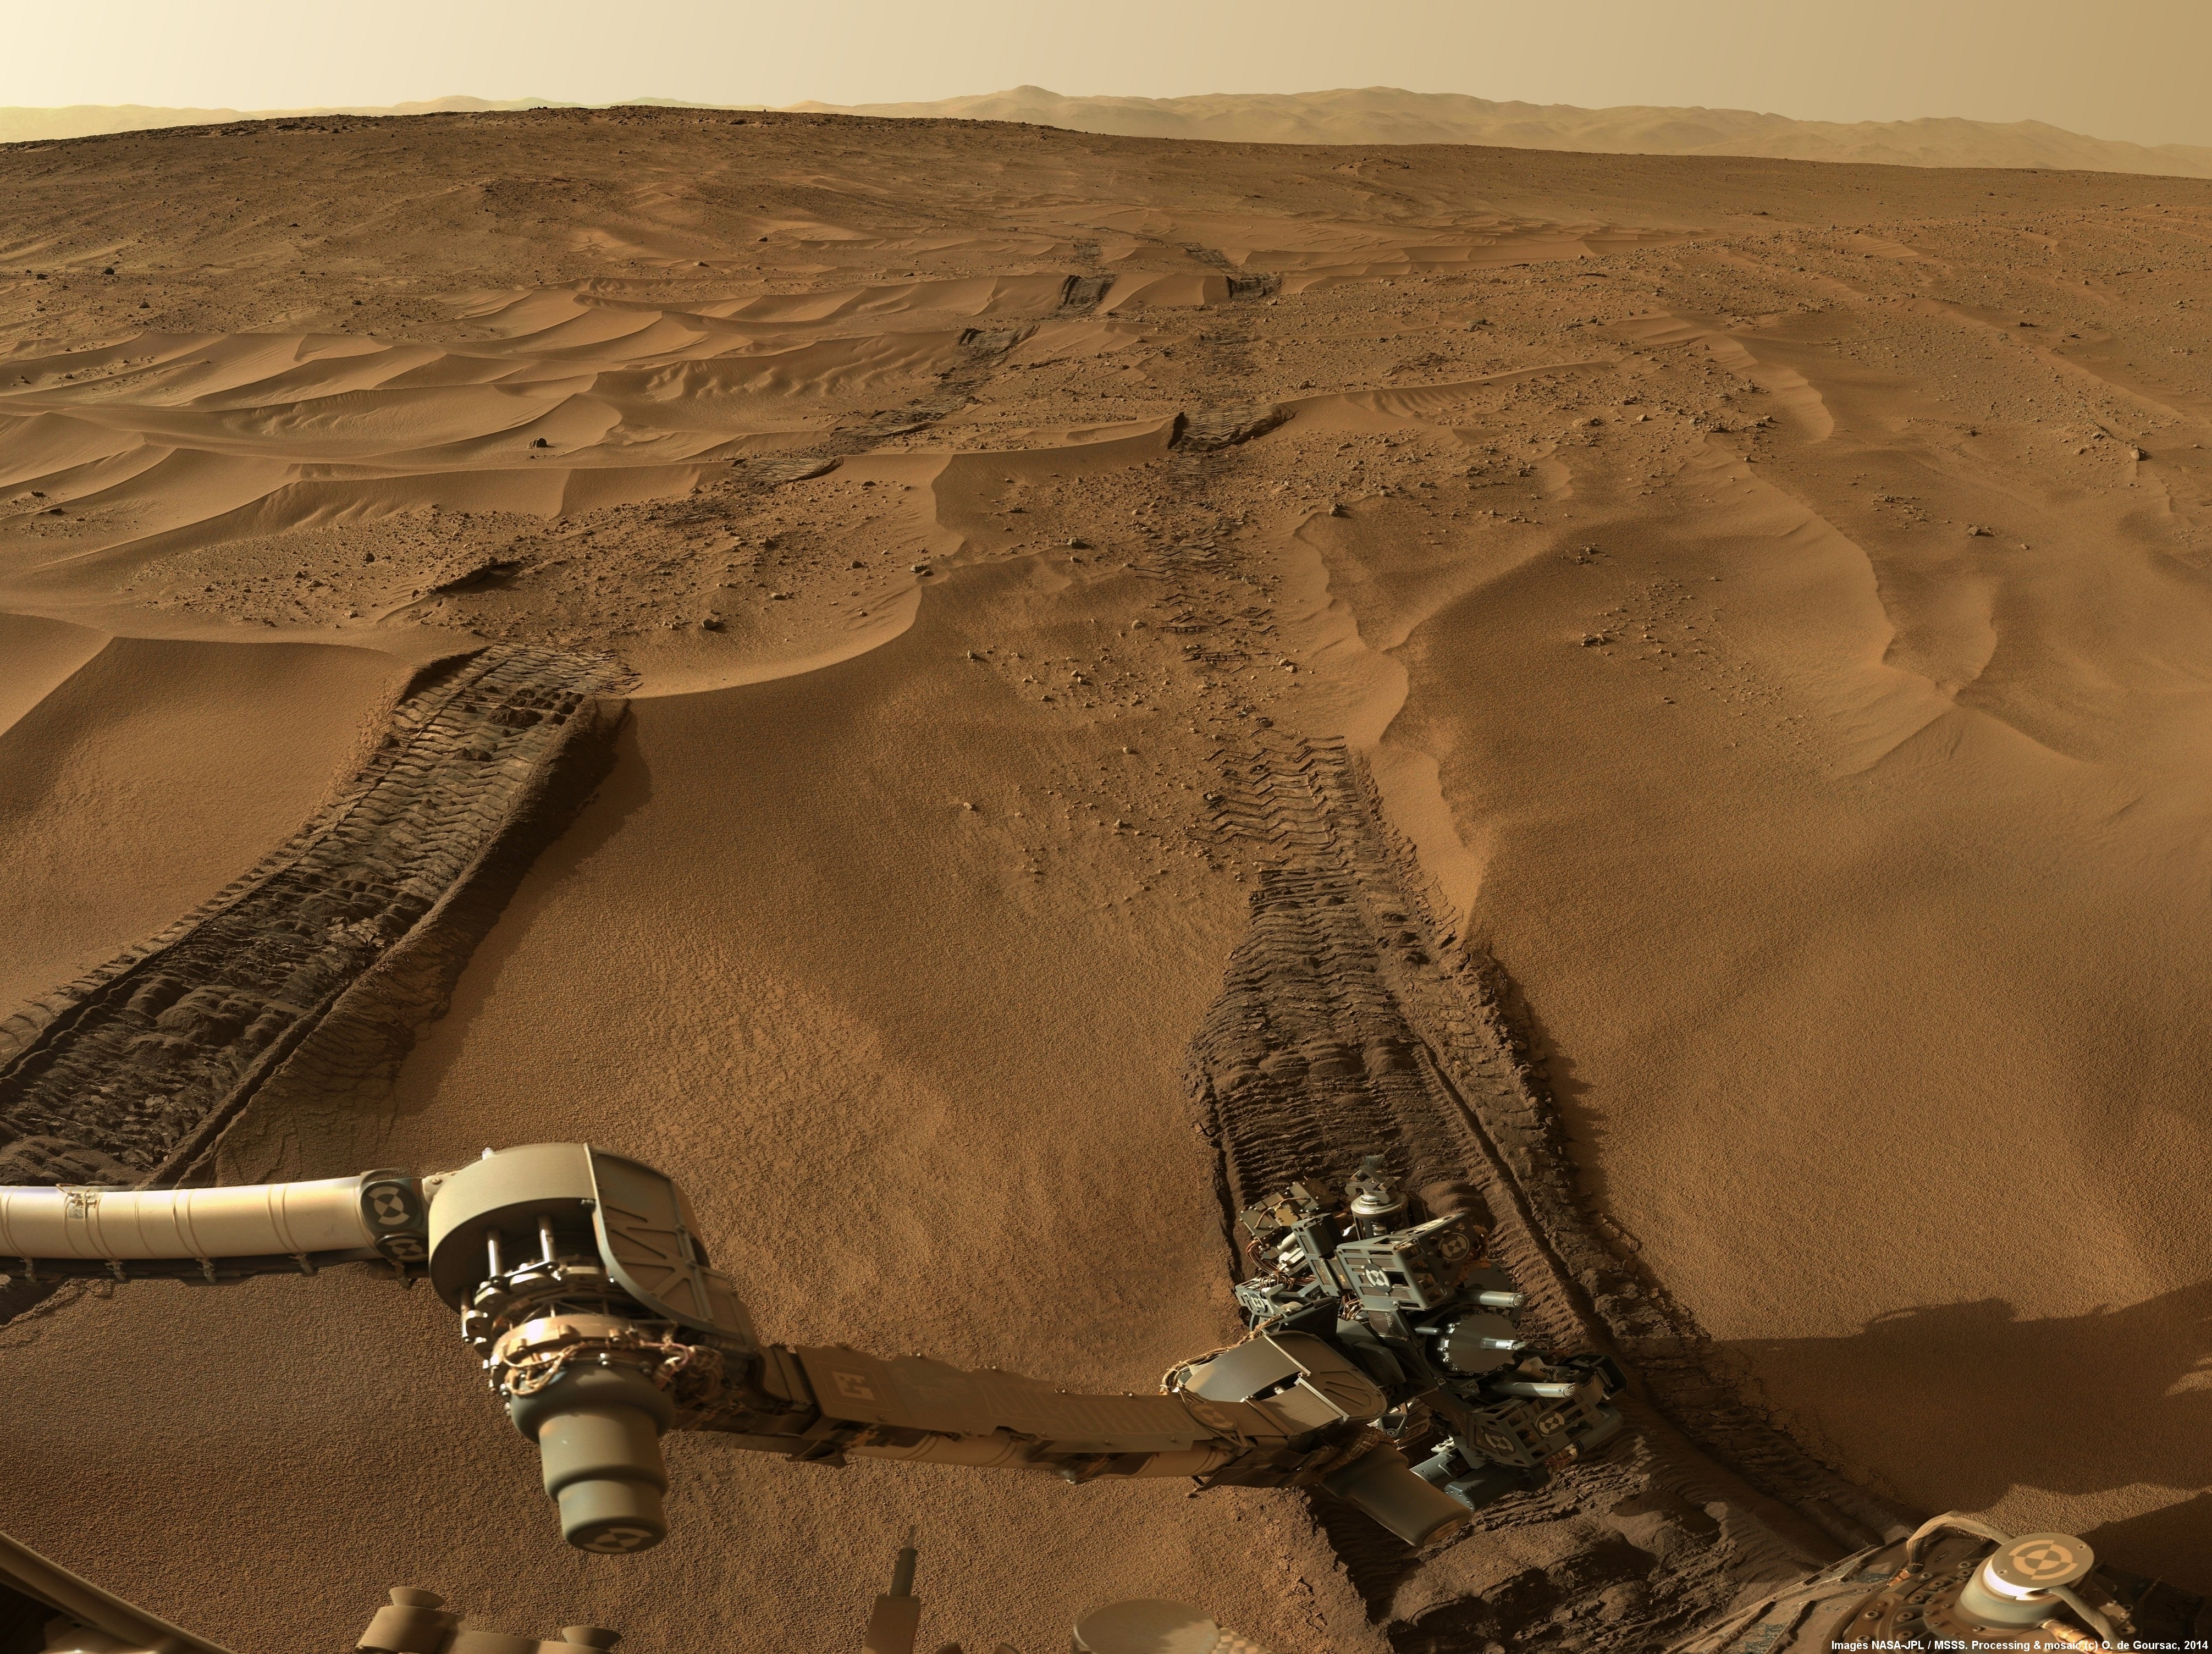
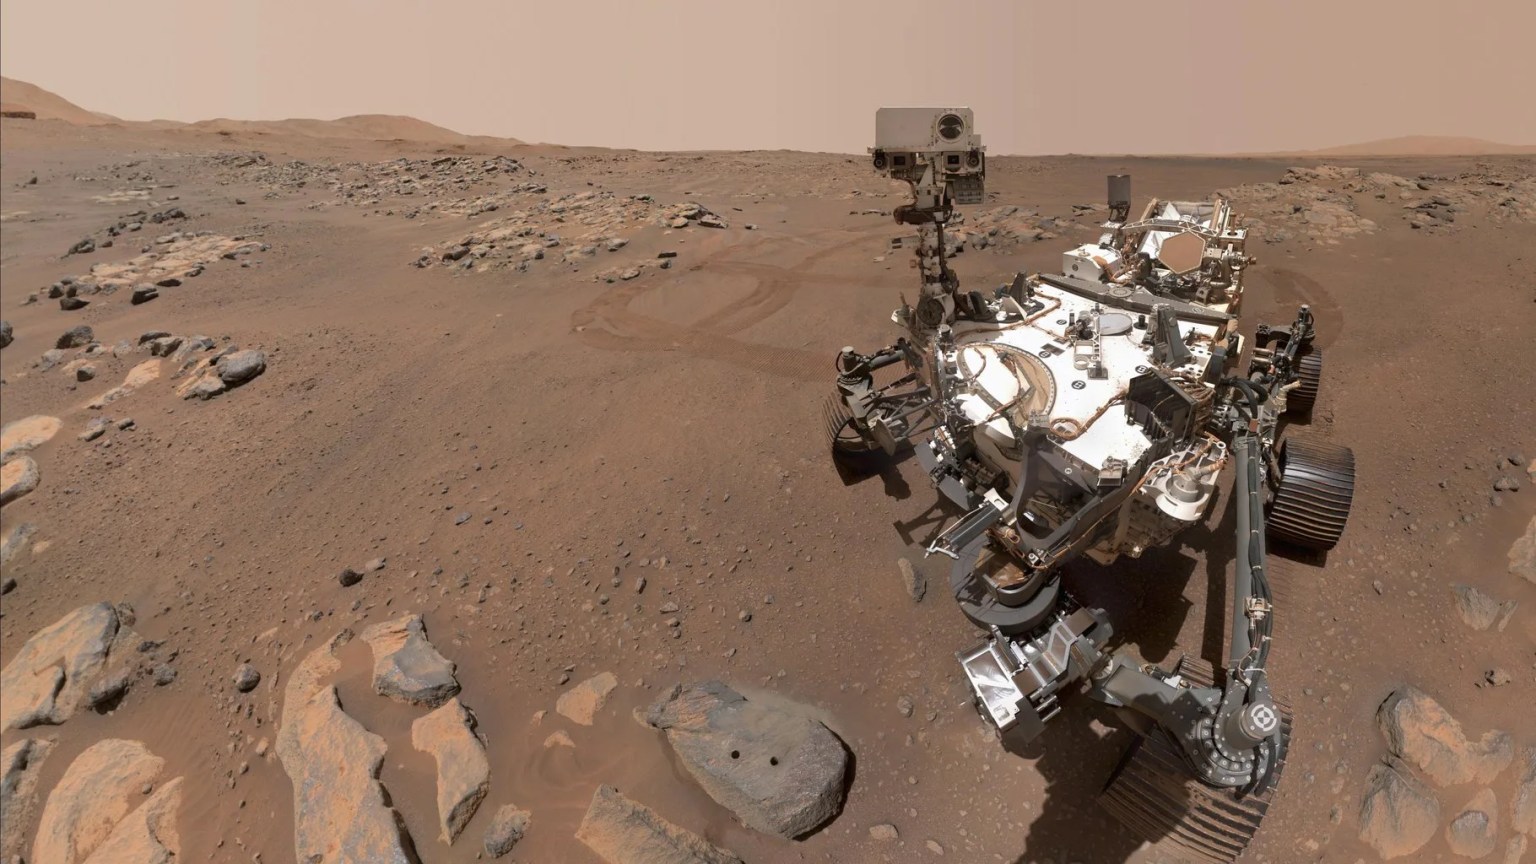
Image: “MSL Sunset Dunes Mosaic“, NASA/JPL and Olivier de Goursac

One form of erosion is from wind, which tends to be important in dry regions – particularly the deserts of Australia and the Western USA. Wind erosion can also create placer deposits, which get called “aeolian placers”. The mechanism is fairly straightforward: lighter grains of sand are going to blow further, concentrating the heavy stuff on one side of a dune or closer to the original source rock. Given the annual global dust storms, aeolian placers may come up quite often on Mars, but the thin atmosphere might make this process less likely than you’d think.

We’ve also seen rockslides on Mars, and material moving in this matter is subject to the same physics. In a flow of grains, you’re going to have buoyancy and the heavy stuff is going to fall to the bottom and stop sooner. If the lighter material is further carried away by wind or water, we call the resulting pile of useful, heavy rock an effluvial placer deposit.

Still, on this planet at least it’s usually water doing the moving of sediments, and it’s water that’s doing the sortition. Heavy grains fall out of suspension in water more easily. This tends to happen wherever flow is disrupted: at the base of a waterfall, at a river bend, or where a river empties into a lake or the ocean. Any old Klondike or California prospector would know that that’s where you’re going to go panning for gold, but you probably wouldn’t catch a 49er calling it an “Alluvial placer deposit”. Panning itself is using the exact same physics– that’s why it, along with the fancy modern sluices people use with powered pumps, are called “placer mining”. Mars’s dry river beds may be replete with alluvial placers; so might the deltas on Titan, though on a world where water is part of the bedrock, the cryo-mineralogy would be very unfamiliar to Earthly geologists.

Back here on earth, wave action, with the repeated reversal of flow, is great at sorting grains. There aren’t any gold deposits on beaches these days because wherever they’ve been found, they were mined out very quickly.  But there are many beaches where black magnetite sand has been concentrated due to its higher density to quartz. If your beach does not have magnetite, look at the grain size: even quartz grains can often get sorted by size on wavy beaches. Apparently this idea came after scientists lost their fascination with latin, as this type of deposit is referred to simply as a “beach placer” rather than a “littoral placer”.

Kondike, eat your heart out: Fifty thousand tonnes of this stuff has come out of the mines of Witwatersrand.

While we in North America might think of the Klondike or California gold rushes– both of which were sparked by placer deposits– the largest gold field in the world was actually in South Africa: the Witwatersrand Basin. Said basin is actually an ancient lake bed, Archean in origin– about three billion years old. For 260 million years or thereabouts, sediments accumulated in this lake, slowly filling it up. Those sediments were being washed out from nearby mountains that housed orogenic gold deposits. The lake bed has served to concentrate that ancient gold even further, and it’s produced a substantial fraction of the gold metal ever extracted– depending on the source, you’ll see numbers from as high as 50% to as low as 22%. Either way, that’s a lot of gold.

Witwatersrand is a bit of an anomaly; most placer deposits are much smaller than that. Indeed, that’s in part why you’ll find placer deposits only mined for truly valuable minerals like gold and gems, particularly diamonds. Sure, the process can concentrate magnetite, but it’s not usually worth the effort of stripping a beach for iron-rich sand.

The most common non-precious exception is uraninite, UO2, a uranium ore found in Archean-age placer deposits. As you might imagine, the high proportion of heavy uranium makes it a dense enough mineral to form placer deposits. I must specify Archean-age, however, because an oxygen atmosphere tends to further oxidize the uraninite into more water-soluble forms, and it gets washed to sea instead of forming deposits. On Earth, it seems there are no uraninite placers dated to after the Great Oxygenation; you wouldn’t have that problem on Mars, and the dry river beds of the red planet may well have pitchblende reserves enough for a Martian rendition of “Uranium Fever”.

If you were the Martian, would you rather find uranium or gold in those river bends?
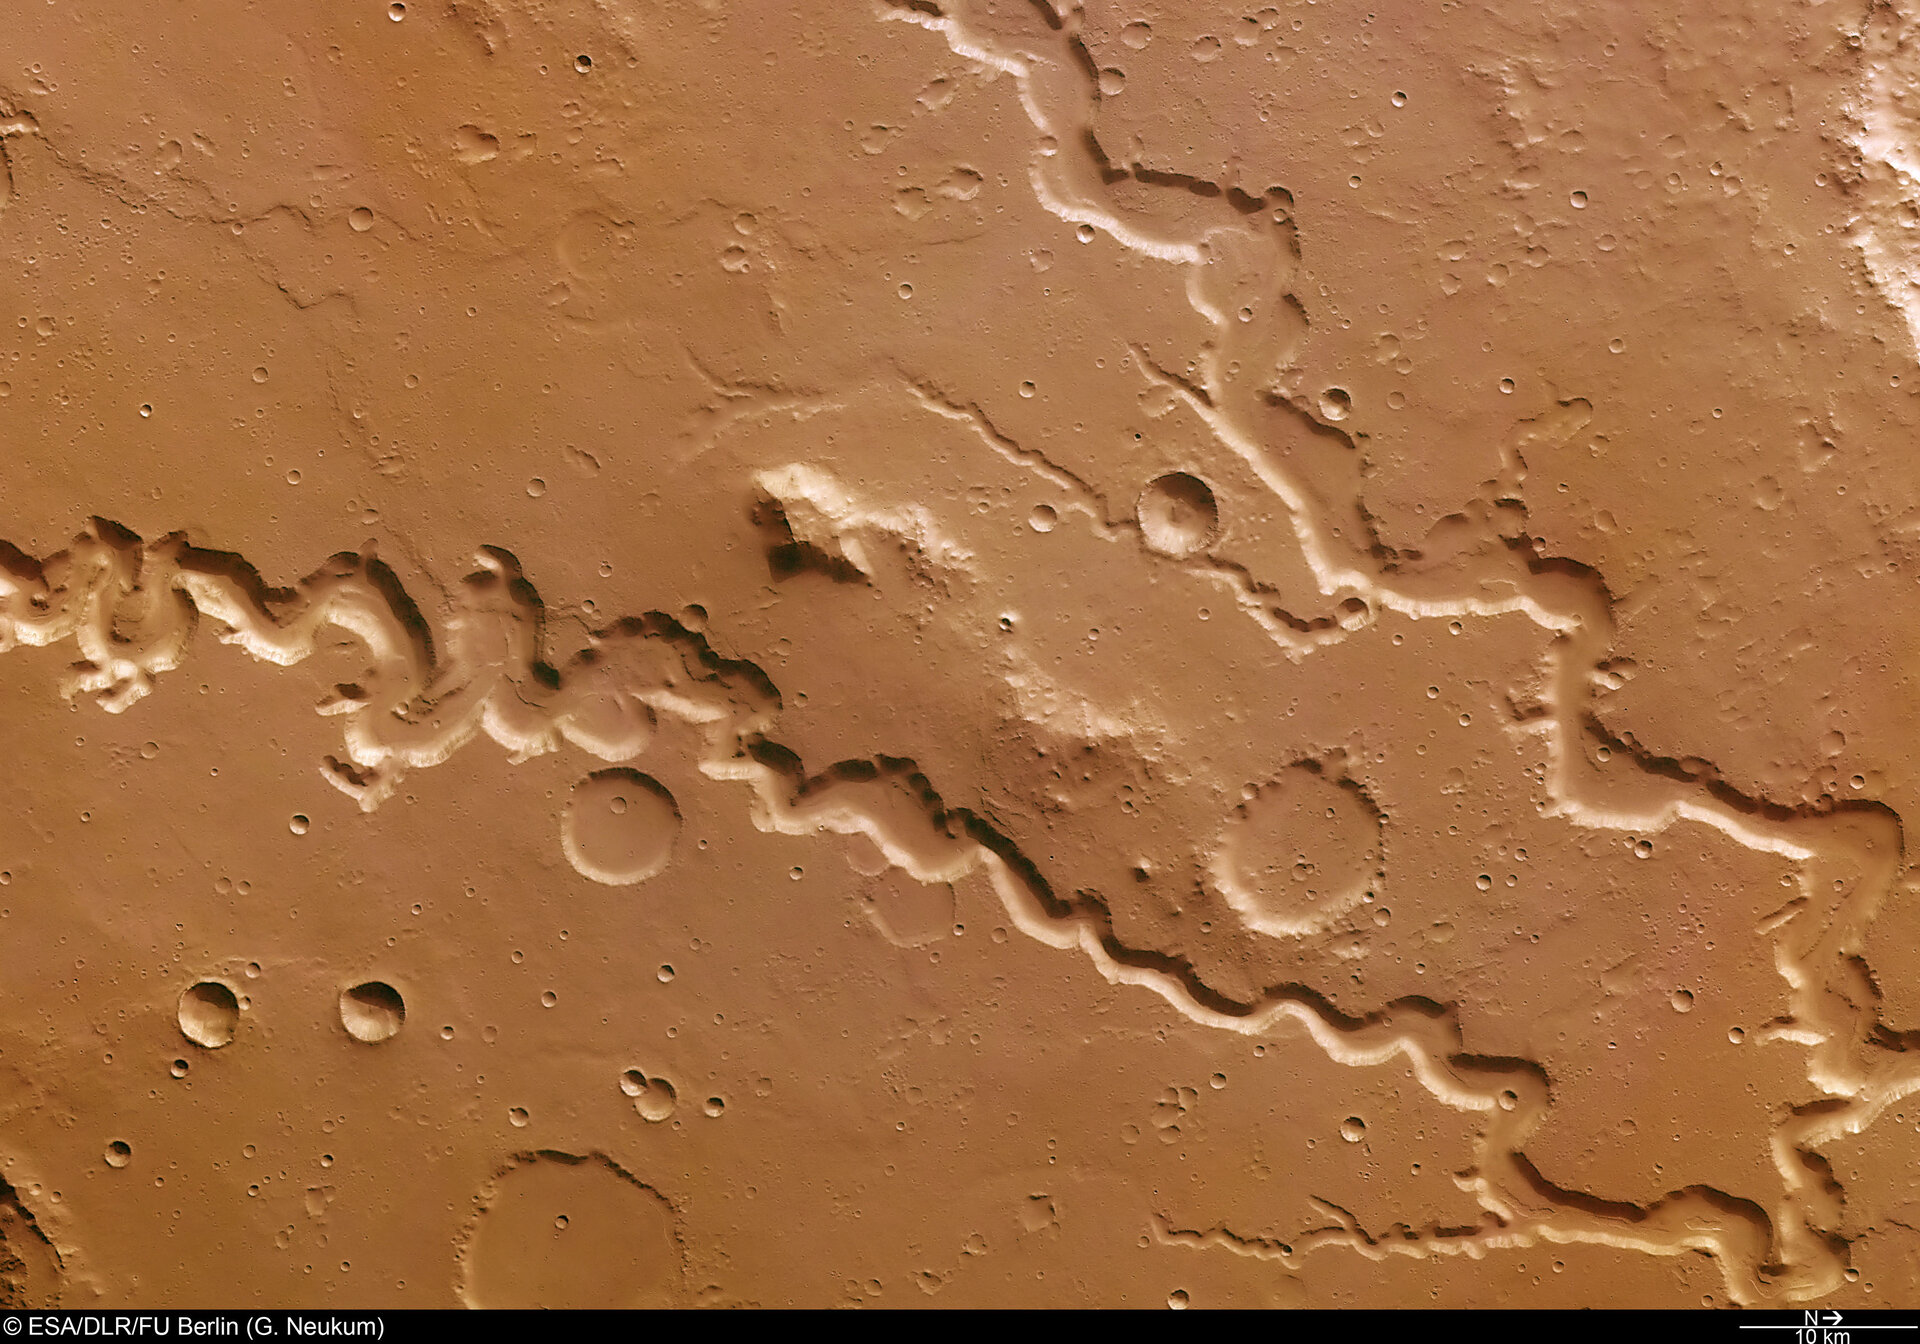
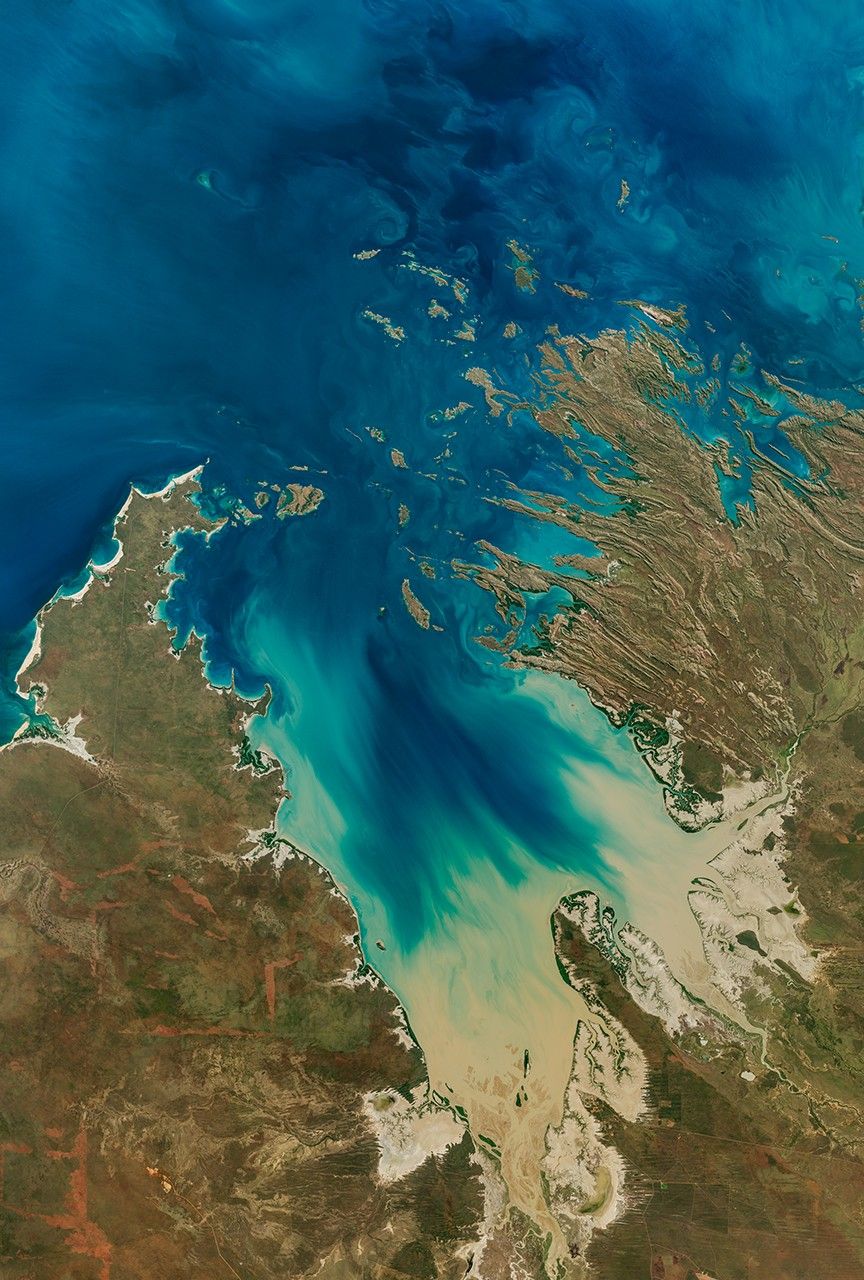
Image: Nandes Valles valley system, ESA/DLR/FU Berlin

While uranium is produced at Witwatersrand as a byproduct of the gold mines, uranium ore can be deposited exclusively of gold. You can see that with the alluvial deposits in Canada, around Elliot Lake in Ontario, which produced millions of pounds of the uranium without a single fleck of gold, thanks to a bend in a three-billion-year-old riverbed. From a dollar-value perspective, a gold mine might be worth more, but the uranium probably did more for civilization.

Lateritization, or Why Martians Can’t Have Pop Cans

Speaking of useful for civilization, there’s another type of process acting on the surface to give us ores of less noble metals than gold. It is not mechanical, but chemical, and given that it requires hot, humid conditions with lots of water, it’s almost certainly restricted to Sol 3. As the subtitle gives it away, this process is called “lateritization” and is responsible for the only economical aluminum deposits out there, along with a significant amount of the world’s nickel reserves.

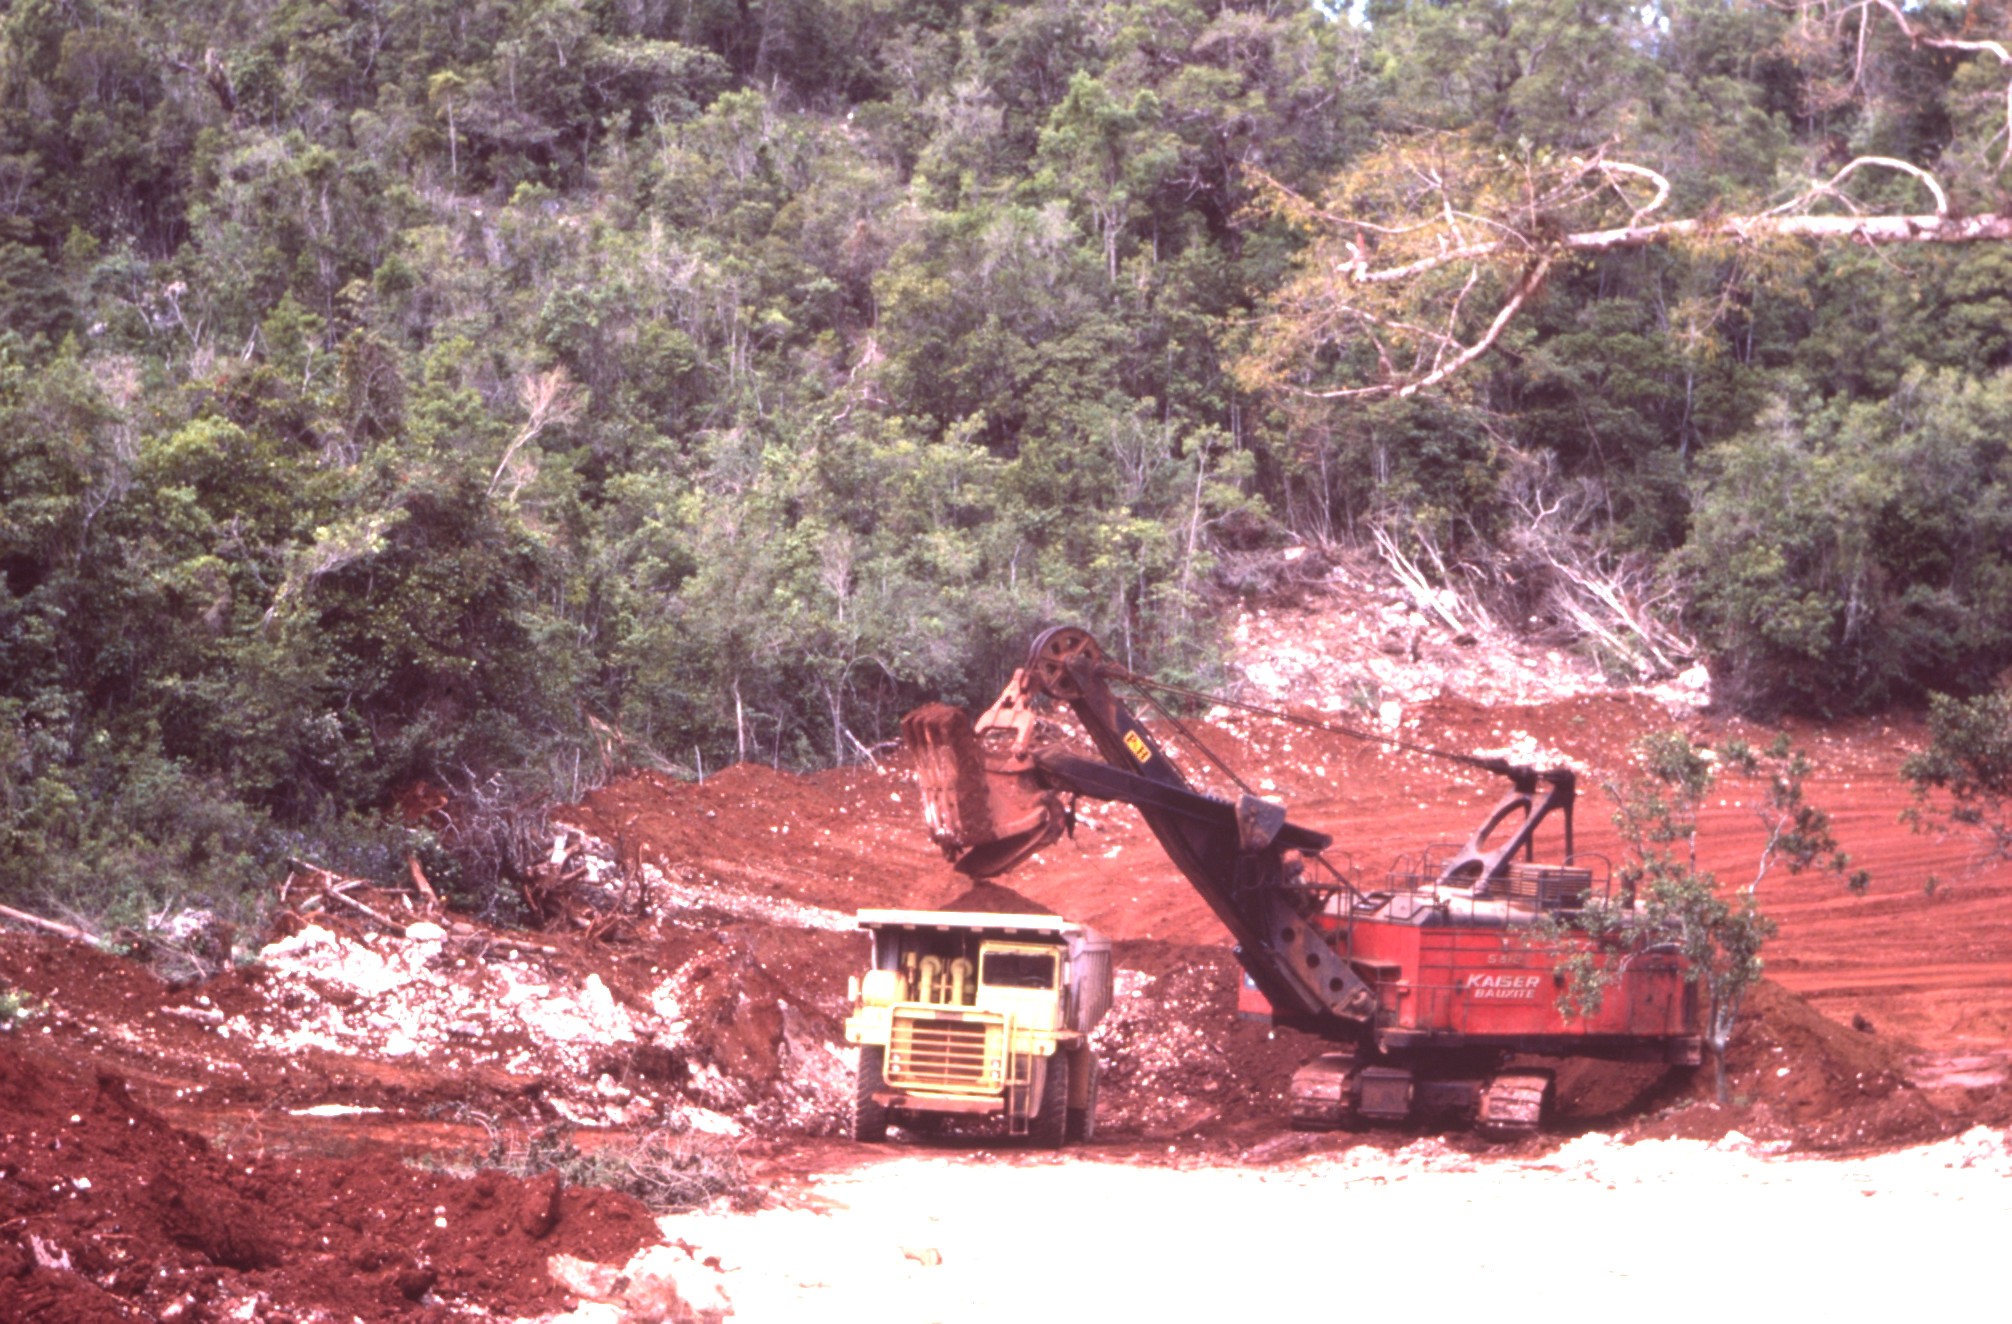
The process is fairly simple: in the hot tropics, ample rainfall will slowly leech any mobile ions out of clay soils. Ions like sodium and potassium are first to go, followed by calcium and magnesium but if the material is left on the surface long enough, and the climate stays hot and wet, chemical weathering will eventually strip away even the silica. The resulting “Laterite” rock (or clay) is rich in iron, aluminum, and sometimes nickel and/or copper. Nickel laterites are particularly prevalent in New Caledonia, where they form the basis of that island’s mining industry. Aluminum-rich laterites are called bauxite, and are the source of all Earth’s aluminum, found worldwide. More ancient laterites are likely to be found in solid form, compressed over time into sedimentary rock, but recent deposits may still have the consistency of dirt. For obvious reasons, those recent deposits tend to be preferred as cheaper to mine.

That red dirt is actually aluminum ore, from a 1980s-era operation on the island of Jamaica. Image from “Bauxite” by Paul Morris, CC BY-SA 2.0

When we talk about a “warm and wet” period in Martian history, we’re talking about the existence of liquid water on the surface of the planet– we are notably not talking about tropical conditions. Mars was likely never the kind of place you’d see lateritization, so it’s highly unlikely we will ever find bauxite on the surface of Mars. Thus future Martians will have to make due without Aluminum pop cans. Of course, iron is available in abundance there and weighs about the same as the equivalent volume of aluminum does here on Earth, so they’ll probably do just fine without it.

Most nickel has historically come from sulfide melt deposits rather than lateralization, even on Earth, so the Martians should be able to make their steel stainless. Given the ambitions some have for a certain stainless-steel rocket, that’s perhaps comforting to hear.

It’s important to emphasize, as this series comes to a close, that I’m only providing a very surface-level understanding of these surface level processes– and, indeed, of all the ore formation processes we’ve discussed in these posts. Entire monographs could be, and indeed have been written about each one. That shouldn’t be surprising, considering the depths of knowledge modern science generates. You could do an entire doctorate studying just one aspect of one of the processes we’ve talked about in this series; people have in the past, and will continue to do so for the foreseeable future. So if you’ve found these articles interesting, and are sad to see the series end– don’t worry! There’s a lot left to learn; you just have to go after it yourself.

Plus, I’m not going anywhere. At some point there are going to be more rock-related words published on this site. If you haven’t seen it before, check out Hackaday’s long-running Mining and Refining series. It’s not focused on the ores– more on what we humans do with them–but if you’ve read this far, it’s likely to appeal to you as well.


NASA & GLOBE Connect People, Land, and Space

4 min read

NASA & GLOBE Connect People, Land, and Space

A screenshot of the GLOBE Land Cover satellite comparison table. The table includes information and photographs of the land, submitted by the volunteer, as well as a Moderate Resolution Imaging Spectroradiometer (MODIS) land cover classification image for that location and a Landsat and Sentinel-2 image closest in time to the GLOBE Observer observation.
The GLOBE Land Cover satellite comparison table is generated weekly for every GLOBE Land Cover observation. GLOBE volunteers receive an email with a link to the table. Information about the table may be found on the GLOBE Observer website.

A group of elementary-aged students gather outside of Oldham County Public Library in La Grange, Kentucky, United States to look at clouds in the sky. “If anyone asks what you are doing, tell them, ‘I am a citizen scientist and I am helping NASA,’” Children’s Programming Librarian, Cheri Grinnell, tells the kids. Grinnell supports an afterschool program called Leopard Spot where she engages K-5 students in collecting environmental data with the GLOBE (Global Learning & Observations to Benefit the Environment) Program.

“One little boy really got excited about that, and I heard him tell his mom he was working for NASA as they were leaving,” says Grinnell. That idea is reinforced when the program receives an email from NASA with satellite data that align with the cloud data the students submitted. “I forwarded the NASA satellite response to the after-school coordinator, and she read it to them. That really excited them because it was evidence this is the real deal.”

This experience is one the GLOBE Observer Team (part of the NASA Science Activation program’s NASA Earth Science Education Collaborative, NESEC) hears often: GLOBE volunteers of all ages love getting an email from NASA that compares satellite data with their cloud observations. “Feedback from NASA is huge. It’s the hook,” says Tina Rogerson, the programmer at NASA Langley Research Center who manages the satellite comparison emails. “It ties NASA science into what they saw when they did the observation.”

Now, volunteers will have more opportunities to receive a satellite comparison email from NASA. GLOBE recently announced that, in addition to sending emails about satellite data that align with the cloud observations made by learners, they will now also be sending emails that compare the GLOBE Observer Land Cover observations made by learners with satellite data. The new satellite comparison for land cover builds on the system used to create cloud comparisons at NASA Langley Research Center.

When a volunteer receives the email, they will see a link for each observation they have submitted. The link will open a website with a satellite comparison table. Their observation is at the top, followed by a satellite-based assessment of the land cover at that location. The last row of the table shows the most recent Landsat and Sentinel-2 satellite images of the observation site. Rogerson pulls GLOBE land cover data from the public GLOBE database to generate and send the comparison tables on a weekly basis. While users may opt out of receiving these emails, most participants will be excited to review their data from the space perspective.

These new collocated land cover observations are expected to raise greater awareness of how NASA and its interagency partners observe our changing home planet from space in order to inform societal needs. They will help every GLOBE volunteer see how their observations of the land fit in with the wider space-based view and how they are participating in the process of science. Based on the response to cloud satellite emails, seeing that bigger, impactful perspective via the satellite comparison email is motivating. The hope is to encourage volunteers to continue being NASA citizen scientists, collecting Earth system observations for GLOBE’s long-term environmental record.

“I’m excited that land cover is finally becoming part of the operational satellite comparison system,” says Rogerson. This means that GLOBE volunteers will routinely receive satellite data for both land cover and clouds. “We are bringing real science right into your world.”

NESEC, led by the Institute for Global Environmental Strategies (IGES) and supported by NASA under cooperative agreement award number NNX16AE28A, is part of NASA’s Science Activation Portfolio. Learn more about how Science Activation connects NASA science experts, real content, and experiences with community leaders to do science in ways that activate minds and promote deeper understanding of our world and beyond: https://science.nasa.gov/learn/about-science-activation/.

Share

Details

Last Updated
Nov 25, 2025
Editor
NASA Science Editorial Team

25 Years of Scientific Discovery Aboard the International Space Station

8 Min Read

25 Years of Scientific Discovery Aboard the International Space Station

NASA astronaut Kate Rubins is looking towards the left at her hands while working on an experiment on the International Space Station.

November marks 25 years of human presence aboard the International Space Station, a testament to international collaboration and human ingenuity. Since the first crew arrived on Nov. 2, 2000, NASA and its partners have conducted thousands of research investigations and technology demonstrations to advance exploration of the Moon and Mars and benefit life on Earth.

Researchers have taken advantage of the unique microgravity environment to conduct experiments impossible to replicate on Earth, transforming research across disciplines. More than 4,000 experiments have pushed the boundaries of science, sparked discoveries, and driven scientific breakthroughs.

“25 years ago, Expedition 1 became the first crew to call the International Space Station home, beginning a period of continuous human presence in space that still continues to this day,” said NASA acting administrator Sean Duffy. “This historic milestone would not have been possible without NASA and its partners, as well as every astronaut and engineer who works to keep the lights on in low Earth orbit.”

To celebrate a quarter century of innovation in microgravity, NASA is highlighting 25 scientific breakthroughs that exemplify the station’s enduring impact on science, technology, and exploration.

Building the road to the Moon and Mars

A sliver of the Moon rises above Earth’s thin blue atmosphere, seen against the blackness of space. On the left side of the image, part of the International Space Station’s orange solar array comes into view with square grid sections along its surface.
The waxing crescent moon appears just above the Earth’s atmosphere as the International Space Station orbits the Earth.
NASA

NASA uses the space station as a proving ground to develop new systems and technologies for missions beyond low Earth orbit.

  • Navigation, communication, and radiation shielding technologies proven aboard the space station are being integrated into spacecraft and missions to reach the Moon and Mars.
  • Robotic systems, for example a robotic surgeon and autonomous assistants, will expand available medical procedures and allow astronauts to dedicate time to more crucial tasks during missions far from Earth. 
  • Astronauts have used recycled plastic and stainless steel to 3D print tools and parts. The ability to 3D print in space lays the groundwork for on-demand repair and fabrication during future deep space missions where resupply isn’t readily available.
  • From the deployment of the first wooden satellite to laser communications and self-healing quantum communications, the space station is a proving ground for cutting-edge space technologies.

Why this matters:

Humanity’s push to the Moon and Mars begins with discoveries in low Earth orbit. From demonstrating how astronauts can live, work, and repair equipment off Earth to testing life-support systems and advanced materials, every innovation aboard the station helps to advance NASA’s Artemis and other exploration initiatives and brings humanity closer to thriving beyond our planet.

Sustaining life beyond Earth

Jessica Watkins wears safety goggles and blue gloves while holding a plant growth unit with leafy greens and a large tangle of roots exposed. Bob Hines, in a black shirt, looks on from the background inside the space station laboratory.
NASA astronauts Jessica Watkins, front, and Bob Hines, back, work on XROOTS aboard the International Space Station. This experiment used the station’s Veggie facility to test soilless hydroponic and aeroponic plant growth.
NASA

As NASA prepares to return humans to the Moon through the Artemis program and push onward to Mars, sustaining life beyond Earth is more critical than ever.

  • Astronauts have grown more than 50 species of plants in space, including tomatoes, bok choi, romaine lettuce, and chili peppers.
  • Advanced life support systems are capable of recycling up to 98% of water in the U.S. segment aboard the space station, the ideal level needed for exploration missions.
  • Crew health data shows how space affects the brain, vision, balance and control, and  muscle and bone density, guiding strategies to maintain astronaut performance during extended missions and improve health on Earth.
  • Researchers have sequenced DNA in orbit and are advancing techniques to enable real-time assessment of microbial life in space, which is essential to maintaining astronaut health.

Why this matters:

By growing food, recycling water, and improving medical care in space, NASA is paving the way for future long-duration missions to the Moon and Mars while revolutionizing agriculture and medicine back home.

Helping humanity on Earth

Crystals cover the left side of the frame against a rust-colored background. The crystals are translucent and vary in shape and size, most resemble a rectangular prism. A bright yellow light shines through the crystals from the background.
Pharmaceutical crystals grown aboard the International Space Station are shown after returning to Earth.
Redwire

Research aboard the orbiting laboratory not only pushes humanity farther into the cosmos but can help address complex human health issues on the ground. By providing a platform for long-term microgravity research, the space station fosters breakthroughs that yield direct benefits to people on Earth.

  • Research aboard the space station provides new insights to develop treatments for diseases like cancer, Alzheimer’s, Parkinson’s, and heart disease by revealing how microgravity alters cellular functions.
  • New developments in medicine for cancer, muscular dystrophy, and neurodegenerative diseases have come from growing protein crystals in microgravity with larger, more organized structures.
  • High quality stem cells can be grown in greater quantities in space, helping to develop new regenerative therapies for neurological, cardiovascular, and immunological conditions.
  • Pioneering efforts in 3D bioprinting, which uses cells, proteins, and nutrients as source material, have produced human tissue structures such as a knee meniscus and heart tissue, a major step toward manufacturing organs in space for transplant patients on Earth.
  • Researchers are using miniaturized tissue models to observe how space affects tissues and organ systems, offering new ways to develop and test medicines to protect astronauts on future missions and improve treatments on Earth.
  • Photos taken by astronauts have supported emergency response to natural disasters, such as hurricanes, with targeted views from space.
  • Instruments mounted on the space station protect critical space infrastructure and provide data on the planet’s natural patterns by measuring Earth’s resources and space weather.

Why this matters:

Microgravity research is moving us closer to manufacturing human organs in space for transplant and revealing new ways to fight cancer, heart disease, osteoporosis, neurodegenerative disease, and other serious illnesses that affect millions of people worldwide. The station also serves as an observation platform to monitor natural disasters, weather patterns, and Earth’s resources.

Understanding our universe

Six red lasers shine into the middle of a clear, rectangular chamber, fixating on a small, blueish white sphere.
Artist concept of operations inside NASA’s Cold Atom Laboratory aboard the International Space Station.
NASA

The space station offers scientists an unparalleled vantage point to learn about the fundamental behavior of the universe. By studying cosmic phenomena typically blocked or absorbed by Earth’s atmosphere and observing physics at an atomic level, researchers can probe mysteries impossible to study from Earth.

Why this matters:

Research aboard the space station is helping us unravel the deepest mysteries of our universe, from the smallest quantum particles to the most powerful cosmic explosions. Observations of collapsing stars and black holes could inspire new navigation tools using cosmic signals and expand our grasp of space-time. Studies of antimatter and dark matter bring us closer to understanding the 95% of the universe invisible to the human eye. Creating the fifth state of matter in space unlocks new quantum pathways that could transform technology on Earth and in space.

Learning new physics

Small yellow flame spots cover a spherical space against a dark background. There is a faint blue ring surrounding the yellow clusters.
This image shows a flame ignited as part of the Flame Design investigation on the International Space Station.
NASA

Physical processes behave differently in microgravity, offering scientists a new lens for discovery.

  • Engineers can design more efficient fuel and life support systems for future spacecraft thanks to studies of fluid boiling, containment, and flow.
  • Analyzing gels and liquids mixed with tiny particles in space helps researchers fine-tune material compositions and has led to new patents for consumer products.
  • The discovery of cool flames in space, a phenomenon difficult to study on Earth, has opened new frontiers in combustion science and engine design.  

Why this matters:

Breakthroughs in fundamental physics aboard the space station drive innovation on Earth and advance spacecraft fuel, thermal control, plant watering, and water purification systems. Research in soft materials is improving products in medicine, household products, and renewable energy, while cool flames studies may lead to cleaner, more efficient engines.

Enabling global access to space

Nichole Ayers smiles at the camera while holding a hand-held radio aboard the space station. Her long blonde hair floats upward in microgravity. To her left, a laptop and cables are mounted on the wall, and the wall behind her is decorated with several mission stickers.
NASA astronaut Nichole Ayers talks on a ham radio with students from Lakeside Junior High School in Springdale, Arkansas. Ayers answered questions from the students about her experience living and working aboard the International Space Station.
NASA

Since 2000, the space station has opened doors for private companies, researchers, students, and astronauts around the world to participate in exploration and help propel humanity forward to the Moon and Mars.

  • The space station is a launchpad for the commercial space economy, enabling private astronaut missions and hosting hundreds of experiments from commercial companies, giving them the chance to strengthen their technologies through in-orbit research, manufacturing demonstrations, and innovation.
  • CubeSats deployed from the space station enable students and innovators around the world to test radio antennas, small telescopes, and other scientific demonstrations in space.
  • More than one million students have engaged with astronauts via ham radio events, inspiring the next generation to participate in science, technology, engineering, and mathematics.
  • More than 285 crew members from more than 25 countries have visited humanity’s longest-operating outpost in space, making it a symbol of global collaboration.

Why this matters:

The space station has enabled the space economy, where commercial research, manufacturing, and technology demonstrations are shaping a new global marketplace. NASA and its international partners have established a leadership position in low Earth orbit, creating new opportunities for industry and paving the way for exploration missions to the Moon, Mars, and beyond.

Learn more about the research aboard the International Space Station at:

www.nasa.gov/iss-science

Revisit the 20th anniversary for more information.

NASA, Aerospace Corporation Study Sharpens Focus on Ammonia Emissions

By: scarney1

6 min read

Preparations for Next Moonwalk Simulations Underway (and Underwater)

Researchers used data taken in March 2023 by an airborne imaging spectrometer to map ammonia emissions in the Imperial Valley. Produced by agricultural activities as well as geothermal processes, ammonia is a precursor to particulate matter, which can cause adverse health outcomes when inhaled.
NASA/JPL-Caltech

The pungent gas contributes to fine airborne particulate pollution, which endangers human health when inhaled and absorbed in the bloodstream. 

A recent study led by scientists at NASA’s Jet Propulsion Laboratory in Southern California and the nonprofit Aerospace Corporation shows how high-resolution maps of ground-level ammonia plumes can be generated with airborne sensors, highlighting a way to better track the gas. A key chemical ingredient of fine particulate matter — tiny particles in the air known to be harmful when inhaled — ammonia can be released through agricultural activities such as livestock farming and geothermal power generation as well as natural geothermal processes. Because it’s not systematically monitored, many sources of the pungent gas go undetected.  

Published in Atmospheric Chemistry and Physics in October, the study focuses on a series of 2023 research flights that covered the Imperial Valley to the southeast of the Salton Sea in inland Southern California, as well as the Eastern Coachella Valley to its northwest. Prior satellite-based research has identified the Imperial Valley as a prolific source of gaseous ammonia. In the study, scientists employed an airborne sensor capable of resolving ammonia plumes with enough detail to track their origins: Aerospace Corporation’s Mako instrument is an imaging spectrometer that observes long-wave infrared light emitted by areas of Earth’s surface and atmosphere 6 feet (2 meters) across. 

Using the instrument, which can detect ammonia’s chemical signature by the infrared light it absorbs, the authors found elevated levels of the gas near several sources, including agricultural fields, livestock feedlots, geothermal plants, and geothermal vents. Measurements in parts of the Imperial Valley were 2½ to eight times higher than in Coachella Valley’s Mecca community, which had ammonia concentrations closer to background levels. 

Though not toxic on its own in low concentrations, ammonia is a precursor to particulate matter, also known as aerosol or particle pollution. It reacts with other gases to form solid ammonium salt particles small enough to penetrate the bloodstream from the lungs. Particles under 2.5 micrometers in diameter — also known as PM2.5 — are associated with elevated rates of asthma, lung cancer, and cardiovascular disease, among other negative health outcomes. 

“Historically, more attention has focused on primary sources of PM2.5, such as auto emissions. But with significant reductions in those emissions and increasingly stringent air quality standards, there is growing interest in understanding secondary sources that form particles in the air from precursor gases,” said Sina Hasheminassab, lead author of the paper and a research scientist at JPL. “As an important precursor to PM2.5, ammonia plays a key role, but its emissions are poorly characterized and undermonitored.” 

Rising ammonia 

Previous satellite-based studies have shown rising levels of atmospheric ammonia, both globally and in the continental United States. That research revealed broad trends, but with spatial resolution on the order of tens of miles, the measurements were only sufficient to identify variation over areas of hundreds of square miles or more. 

The chemical behavior of ammonia also poses a particular monitoring challenge: Once emitted, it only stays in the atmosphere for hours before reacting with other compounds. In contrast, carbon dioxide can remain in the air for centuries. 

Planes and satellites can provide an overview of sources and the geographic distribution of emissions at a given moment. Although satellites offer wider and more recurrent coverage, airborne instruments, being closer to the source, produce higher-resolution data and can focus on specific locations at designated times.  

Those proved to be the right capabilities for the recent study. Researchers flew Mako over the Imperial and Eastern Coachella valleys on the mornings and afternoons of March 28 and Sept. 25, 2023, and took concurrent measurements on the ground with both a fixed monitoring station in Mecca operated by the South Coast Air Quality Management District (AQMD) and a mobile spectrometer developed at the University of California, Riverside. 

“The goal was to show that this technique was capable of delivering data with the required accuracy that aerosol scientists and potentially even air quality regulatory bodies could use to improve the air quality in those regions,” said David Tratt, a senior scientist at Aerospace Corporation and coauthor of the paper. “We ended up with maps that identify multiple sources of ammonia, and we were able to track the plumes from their sources and observe them coalescing into larger clouds.” 

Distinct plumes 

During the flights, the team collected data over the southeastern coast of the Salton Sea, which straddles Riverside and Imperial counties. There, Mako revealed small plumes coming from geothermal fumaroles venting superheated water and steam that react with nitrogen-bearing compounds in the soil, releasing ammonia. 

Farther to the southeast, the results showed several geothermal power plants emitting ammonia, primarily from their cooling towers, as part of their normal operations. 

Farther southeast still, the researchers spotted ammonia emissions, a byproduct of animal waste, from cattle farms in the Imperial Valley. During the March 28 flight, a plume from the largest facility in the study area measured up to 1.7 miles (2.8 kilometers) wide and extended up to 4.8 miles (7.7 kilometers) downwind of the source.

‘Very large puzzle’ 

As part of the study, AQMD’s Mecca monitoring station recorded seasonal changes in ammonia concentrations. Given the few sources in the area, the researchers surmised that winds during certain months tend to blow the gas from Imperial Valley to the Coachella Valley. 

The study underscores the benefits of detailed spatial information about ammonia emissions, and it partly informed the agency’s decision in July to expand its ammonia-monitoring network and extend the life of the Mecca station. 

As a precursor to PM2.5, ammonia is “one piece of a very large puzzle” that, for Coachella Valley residents, includes vehicle emissions, desert dust, and agricultural activities, said Payam Pakbin, manager of the Advanced Monitoring Technologies Unit at AQMD and a paper coauthor. 

“These communities want to know the contributions of these sources to the air quality they’re experiencing,” he added. “Findings like these help our agency better prioritize which sources require the most attention and ultimately guide our focus toward those that are the highest priority for achieving emission reductions in this community.” 

News Media Contacts

Andrew Wang / Andrew Good
Jet Propulsion Laboratory, Pasadena, Calif.
626-379-6874 / 626-840-4291
andrew.wang@jpl.nasa.gov / andrew.c.good@jpl.nasa.gov

2025-129

Share

Details

Last Updated
Nov 20, 2025

SARP 2025 Closeout

2 min read

Preparations for Next Moonwalk Simulations Underway (and Underwater)

Two students with headphones stand in the back of a cockpit, watching three pilots in flight suits fly the plane.
SARP students peer into the cockpit onboard NASA’s P-3 aircraft, during research flights for the 2025 Student Airborne Research Program (SARP) internship.
NASA/Milan Loiacono

In August 2025, 47 students from NASA’s Student Airborne Research Program (SARP) culminated a summer of science by presenting their research to an audience of mentors, professors, family, friends, and NASA personnel.

SARP is a summer internship for undergraduate students, hosted in two cohorts: this year SARP West operated out of Guardian Jet Center and University of California, Irvine in Southern California, while SARP East operated out of Wallops Flight Facility and Virginia Commonwealth University in Virginia.

SARP randomly assigns students into one of four research disciplines, to encourage interdisciplinary collaboration and give them the opportunity to work outside of their usual field. Each discipline is led by a faculty researcher who is an expert in their field, and supported by a graduate mentor. This year, SARP research topics spanned three spheres: atmosphere,  biosphere, and hydrosphere, covered between the two cohorts.

The beauty of Earth science lies in its interconnectedness. As a student who primarily researches atmospheric science, stepping out of my comfort zone to explore something new was truly eye-opening, and I am incredibly grateful for the experience.

Nimay mahajan

Nimay mahajan

2025 SARP West student

Over the course of two months, students learned more about NASA’s Airborne Science Program and Earth Science through lectures led by SARP faculty and guest speakers from NASA and the Earth science community, engaged in Earth science data collection while flying onboard Dynamic Aviation’s B-200 and NASA’s P-3 aircraft, and participated in field trips to perform ground sampling fieldwork. Students also visited NASA’s Jet Propulsion Laboratory, Goddard Space Flight Center, and NASA Headquarters. The program also includes other enriching opportunities such as visiting the University of California San Diego’s WAVElab and Virginia Commonwealth University’s Rice Rivers Center.

Students were also provided the opportunity to attend introductory programming sessions and receive hands-on support from a coding mentor to develop and strengthen their experience with code, and incorporate code in their research project. 

SARP really made me realize that science is bigger than all of us, but it needs every one of us – even those just stepping into the scientific world – to contribute. Every effort, no matter how big or small, is a step forward in a mission greater than any one individual.

TJ Ochoa Peterson

TJ Ochoa Peterson

2025 SARP East student

To watch videos of these student’s presentations, read their research abstracts, or see more photos from the summer, please follow the links below.

2025 SARP East Research Presentations

A group of students and faculty in gray shirts stand on dark gray tarmac in front of a large white plane with a blue stripe down the middle.
The 2025 SARP East Aerosols Group poses in front of the Dynamic Aviation B-200 aircraft, parked in a hangar at NASA’s Wallops Flight Facility in Virgina. During the internship, students spend a week engaged in Earth science data collection and learning from instruments specialists while flying onboard both the B-200 and NASA’s P-3 aircraft.
NASA/Milan Loiacono

2025 SARP West Research Presentations

A group of students in gray shirts and several men in tan flight suits stand on tan tarmac in front of a large white plane with a blue stripe down the middle.
The students and faculty of the 2025 Student Airborne Research Program (SARP) pose in front of NASA’s P-3 aircraft.
NASA/Milan Loiacono

About the Author

Milan Loiacono

Milan Loiacono

Science Communication Specialist

Milan Loiacono is a science communication specialist for the Earth Science Division at NASA Ames Research Center.

Share

Details

Last Updated
Nov 19, 2025
Keep Exploring

Discover More Topics From NASA

SARP East 2025 Atmospheric Chemistry Group

9 min read

Preparations for Next Moonwalk Simulations Underway (and Underwater)

A group of eight people stand together inside a hangar with a somewhat shiny floor. In the background is a small white plane with a blue stripe, and large windows behind that.
The 2025 SARP East Atmospheric Chemistry Group poses in front of the Dynamic Aviation B-200 aircraft, parked in a hangar at NASA’s Wallops Flight Facility in Virginia. During the internship, students spend a week engaged in Earth science data collection and learning from instruments specialists while flying onboard both the B-200 and NASA’s P-3 aircraft.
NASA/Milan Loiacono

Faculty Advisor:

Stacey Hughes, University of New Hampshire

Graduate Mentor:

Katherine Paredero, Georgia Institute of Technology

Atmospheric Chemistry Group Introduction

Faculty Advisor Stacey Hughes and Graduate Mentor Katherine Paredero

Kaylena Pham

Spooky Swamps: How Methane Emission Rates and Their Spatial Variability Differ Between the Great Dismal Swamp and the Alligator River 

Kaylena Pham, University of Southern California 

Wetlands represent a dominant natural source of methane emissions to the atmosphere through methanogenesis, a process that produces methane in nutrient-depleted anoxic sediments, or as a result of decomposition. In coastal wetlands, particularly brackish regimes such as the Alligator River, severe storms and rising sea levels intensify saltwater intrusion inland. This leads to expansive vegetation death and the formation of ghost forests, large areas of dead standing vegetation. The widespread forest loss caused by salinization suggests elevated methane emissions in areas with vegetation stress through increased rates of decomposition from plant death. Previous research has not yet considered ghost forests when estimating methane emissions in wetlands, leading us to explore emission concentrations across two wetlands with similar vegetation compositions: the Great Dismal Swamp and Alligator River. 

In this work, we utilized in-situ measurements collected aboard the Dynamic Aviation B-200 aircraft during the NASA Student Airborne Research Program (SARP) 2025 flight campaign. Methane and carbon monoxide measurements were determined using a PICARRO Gas Concentration Analyzer. This data was then linked with Normalized Difference Vegetation Index (NDVI) imagery from the Terra satellite’s Moderate Resolution Imaging Spectroradiometer (MODIS) instrument. With these two datasets, we studied how vegetation stress influences methane emissions. We observed greater vegetation stress in the Alligator River compared to the Great Dismal Swamp. Furthermore, the Alligator River has wider methane concentration variability occurring over areas with greater vegetation stress. In contrast, methane measurements over the Great Dismal Swamp have narrower distributions and less vegetation stress. This comparison of wetlands in differing vegetative states suggests a potential link between ecosystem stress and elevated methane emissions in wetland environments. Interestingly, despite these differences, the Great Dismal Swamp had a slightly higher mean methane concentration (2.11 ppm) compared to the Alligator River (1.96 ppm). Our results emphasize the importance of improving our understanding of what types of vegetation conditions lead to methane enhancements over wetland regimes. 

Carson Turner

Calculating Methane Flux Over the Great Dismal Swamp Using the Mass Balance Technique 

Carson Turner, University of North Dakota 

Methane is one of the most potent greenhouse gases in the atmosphere, with a warming potential approximately 28 times larger than carbon monoxide. When examining the Global Methane Budget, wetlands are the largest natural source of methane accounting for 20-40% of global methane emissions. Wetland methane emissions have been shown to present the highest uncertainty due to both a lack of in-situ measurements to compare with models as well as a lack of understanding of how different conditions, like soil moisture and air temperature, affect methane emissions. This study looks specifically at The Great Dismal Swamp (GDS), located on the border of southeast Virginia and northeast North Carolina, to study emissions over the region using data collected on flights conducted as part of the Student Airborne Research Program (SARP) in the summer of 2025. A PICARRO Gas Concentration Analyzer was used to collect high frequency methane and carbon monoxide measurements. The two research flights followed similar flight paths around the GDS, on the 23rd and 24th of June. Methane flux was then calculated using the mass balance approach for each flight. Methane flux values were measured at 0.037 kg/s and 0.603 kg/s for the 23rd and 24th respectively. A similar study on wetlands in northern Sweden and Finland found an average methane flux value of 5.56 kg/s. A decreased methane flux value was observed on the flight day associated with higher temperatures, which is contrary to previous research on the relationship between methane emissions and temperature. Future work includes utilizing these flux measurements to improve our understanding of methane emissions from wetlands in models and further explore the relationship between methane emissions and soil moisture. 

Alek Libby

Comparative Analysis of Urban Ozone Chemistry in Baltimore, Richmond, and Norfolk 

Alek Libby , Florida State University 

Urban ozone pollution remains a significant air quality concern in many U.S. cities. Ground-level ozone is not directly emitted but forms through photochemical reactions involving volatile organic compounds (VOCs) and nitrogen oxides (NOₓ) in the presence of sunlight—especially during the summer when incoming solar radiation is enhanced. The National Ambient Air Quality Standard set by the EPA for tropospheric ozone is 70 ppb, which is measured as an 8-hour average. Though exceedances of said standard have declined nationwide, understanding how emission composition varies across metropolitan areas remains critical. This study investigates the VOC makeup and ozone formation dynamics of three Mid-Atlantic urban environments: Baltimore, Richmond, and Norfolk. In-situ Whole Air Samples (WAS) were collected onboard the Aviation Dynamics B200 aircraft during the 2024 NASA Student Airborne Research Program (SARP) Campaign. Gas chromatography was used to quantify the VOC composition of each sample. Additional airborne data from CAFE and CANOE instruments provided measurements of formaldehyde (HCHO) and nitrogen dioxide (NO₂), respectively. This study looked at measurements collected below the boundary layer and within urban beltways to assess regional ozone production potential. Results showed that Baltimore exhibited significantly lower levels of key anthropogenic VOCs, particularly n-butane, i-pentane, and n-pentane. VOC/NOₓ ratios placed Richmond and Norfolk in NOₓ-limited regimes, while Baltimore fell within the transitional zone—supported by HCHO/NO₂ ratios averaging at 2.44 in Baltimore versus 5.14 and 5.09 in Norfolk and Richmond. Baltimore continues to experience notably more ozone exceedance days than Norfolk and Richmond, which is likely related to elevated NO₂ levels in the area. While reducing VOCs may help, these findings suggest that NOₓ reductions are likely more effective for mitigating ozone in the Baltimore area. Future work might replicate this analysis using the 2025 SARP dataset, which was collected on hot, stagnant days that are favorable for ozone production. 

Hannah Suh 

Characterization of Volatile Organic Compound (VOC) Sources in the Baltimore area 

Hannah Suh, University of California, Santa Cruz 

Volatile organic compounds (VOCs) play a key role in tropospheric photochemistry, as they react with nitrogen oxides (NOx) in sunlight to produce tropospheric ozone (O3). Both VOCs and tropospheric O3 can have negative impacts on air quality and human health. Understanding the sources of VOCs in urban areas such as Baltimore is essential for informing future air quality policies. In this study, in-situ VOC measurements collected onboard the Aviation Dynamics B200 aircraft during the NASA Student Airborne Research Program (SARP) were analyzed to characterize potential emission sources in the Baltimore area. VOC datasets from two flights from June 24th that flew over that location were investigated. This flight data was collected using aircraft instruments on the Aviation Dynamics B200, primarily the Whole Air Sampler (WAS). WAS canisters were later processed in lab using gas chromatography, which identified the different VOC mixing ratios in the air. VOCs ratios along with Positive Matrix Factorization (PMF), which reduces an inputted data matrix to separate out potential emission source contributions, were compared to each other to consider the most notable sources of VOCs in the Baltimore area. A total of six sources were looked at through PMF for this region. The top three sources seem to align with oil and natural gas, biogenic, and vehicular emissions. Chemical signature ratios indicate the presence of mixed plumes of both industrial and urban emissions, with many significant correlations with ethyne. These results point towards oil and natural gas industries, biogenic sources, and urban sources like vehicles as primary contributors to VOC signature ratios in the Baltimore area. A logical next step for this research would be to compare VOC signature ratios across multiple years to assess temporal trends. 

Aashi Parikh 

Characterizing VOC Emissions from Chemical Plant Plumes in Hopewell, VA 

Aashi Parikh, Boston University 

Hopewell, VA is home to a cluster of major chemical facilities, whose emissions have raised concerns in neighboring communities about air pollution and health disparities. While there is information about the historical pollution in Hopewell, few studies provide a comprehensive analysis of volatile organic compounds (VOCs). This study investigates the distribution of VOCs in Hopewell’s industrial corridor and 

In-situ whole air samples (WAS) were collected aboard the Aviation Dynamics B200 during the NASA Student Airborne Research Program in June 2024. In this study, samples collected at Hopewell were compared to the rest of the flight. The values were separated by chemical families, and enhancements were identified. The analysis showed that Hopewell had significant levels of aromatics, with 60 ppt of benzene, 119 ppt of toluene, and 47 ppt of styrene, which are VOCs linked to respiratory illness, neurological disorders, reproductive issues, and cancer. Aromatics observed over Hopewell were approximately 5x higher than that of the remaining flight path. According to the EPA, these carcinogenic compounds have no safe threshold for chronic exposure. As such, long-term exposure to these compounds can pose health risks. These findings reinforce existing health outcome disparities in the region, such as elevated cancer rates, and raise concerns about the exposure of nearby communities. Underserved communities are disproportionately being impacted by such health risks in Hopewell. Future research will evaluate VOC concentrations over Hopewell in 2025 and compare them to the 2024 baseline established in this study, providing insight into whether emissions reductions have occurred and if regulatory or community-driven interventions are showing impact. 

Share

Details

Last Updated
Nov 19, 2025

💾

Atmospheric Chemistry Introduction | Faculty Mentor Stacey Hughes, University of New Hampshire and Graduate Mentor Katherine Paredero, Georgia Institute of T...

SARP East 2025 Terrestrial Fluxes Group

10 min read

Preparations for Next Moonwalk Simulations Underway (and Underwater)

A group of eight people stand together inside a hangar with a somewhat shiny floor. In the background is a small white plane with a blue stripe, and large windows behind that.
The 2025 SARP East Terrestrial Fluxes Group poses in front of the Dynamic Aviation B-200 aircraft, parked in a hangar at NASA’s Wallops Flight Facility in Virginia. During the internship, students spend a week engaged in Earth science data collection and learning from instruments specialists while flying onboard both the B-200 and NASA’s P-3 aircraft.
NASA/Milan Loiacono

Faculty Advisors:

Lisa Haber, Virginia Commonwealth University

Brandon Alveshere, Virginia Commonwealth University

Graduate Mentor:

Kayla Preisler, University of Arizona

Terrestrial Fluxes Group Introduction

Rice Rivers Center Director Chris Gough and Graduate Mentor Kayla Preisler

Quinn Koch

Monitoring Postfire Ecosystem Recovery With Spectral Indices and Eddy-Covariance Flux Towers 

Quinn Koch, University of California, Los Angeles 

Fire is a common ecological disturbance in forest ecosystems, leading to changes in forest structure and function that have implications for the Earth’s carbon budget. Observations of post-fire carbon fluxes provide insight into the trajectory of forest recovery and its future as a carbon sink. Eddy-covariance flux towers measure high frequency greenhouse gas exchange between forests and the atmosphere, yielding measurements of net ecosystem exchange (NEE), gross primary productivity (GPP), and ecosystem respiration (Reco). While flux towers are the gold standard for quantifying ecosystem scale fluxes, vegetation indices derived from remote sensing are highly correlated with tower flux data and may provide broader spatial scale understanding of how carbon fluxes vary following fire and other disturbances. The objective of our study is to examine the relationship between tower carbon flux data and NASA Landsat-derived spectral indices at five sites in the United States and Australia that were disturbed by severe fire. Specifically, we evaluated changes following fire in two Landsat-derived spectral indices, Normalized Difference Vegetation Index (NDVI) and Normalized Burn Ratio (NBR), examining whether spectral indices paralleled temporal variation in NEE, GPP, and Reco. We found that the recovery of spectral indices outpaced the recovery of NEE and GPP at sites that experienced severe fire, highlighting how lags in structural and functional responses to disturbance may decouple vegetation indices from carbon fluxes. This suggests that a temporal lag should be considered when using vegetation indices as a proxy for carbon fluxes in post-fire ecosystems compared to unburned systems. This analysis represents a small snapshot of ecosystems worldwide; therefore, continuing to monitor these trends at future burned flux tower sites will be crucial to further understanding this relationship. 

Sara Typrin 

Characterizing Forest Response Pathways in the Blackwater National Wildlife Refuge 

Sara Typrin, Carleton College 

Coastal forests along the Chesapeake Bay are rapidly becoming marshes due to sea level rise and extreme weather events. Predicting these ecosystem shifts is essential for climate adaptation responses. Previous studies have employed Normalized Difference Vegetation Index (NDVI) time series trends to characterize the resilience of coastal ecosystems; however, few have assessed NDVI variation trends within the Chesapeake Bay coastal region, where rates of sea level rise far exceed the global average. This study examines the spatial distribution of forest response pathways in relation to elevation within Maryland’s Blackwater National Wildlife Refuge and the surrounding Eastern Shore region. We used the Landsat 8 record (2014-2024) to extract NDVI values for areas classified as upland forest. We calculated trends in NDVI and NDVI variation using Kendall’s τ (rank correlation) to characterize each 30m pixel into one of four ecosystem shift trajectories: abrupt transition, gradual transition, recovering, or stable. We found that 14.7% of the study area is in abrupt transition, 27.4% in gradual transition, 17.3% is in recovery, and 40.6% is stable. Mapping these regions qualitatively shows that in the BNWR, areas closer to the coast tend to experience abrupt or gradual transitions, and areas farther from the coast are typically stable or in recovery. Recovering forests have higher and more variable elevations than other pathways in a subset of BNWR’s southwest region. Future work can examine how elevation and distance to the coast relate to forest response pathways at a regional scale. 

Austin Jeffery

Structural Characteristic Variation Between Upland Forests and Forested Wetlands 

Austin Jeffery, The University of Texas at Austin 

Forested wetlands are important for regulating the Earth’s climate, cycling nutrients, and providing vital habitats, but are far less studied than upland forests. Prior work in upland forests has illustrated that canopy structural traits vary widely within and across forest types, and that these traits affect crucial ecosystem functions and services such as primary production and carbon sequestration. However, how canopy structure varies within and across forested wetlands has not been thoroughly explored. This study uses waveform lidar data collected during the 2024 SARP East flight campaigns over the Chesapeake Bay region using the LVIS (Land, Vegetation, and Ice Sensor) airborne platform. The LVIS Facility L2 Geolocated Surface Elevation and Canopy Height Products were used to investigate how canopy structure varies across forested wetlands and to compare canopy structural variation between forested wetlands and upland forests. To analyze the data, each lidar granule was first divided into upland and wetland forests by overlaying the granules over a USGS NLCD land use map and a USFS forest type map. Then, 20 plots were created of 100 granules each based on four tree species and whether it was an upland forest or forested wetland plot. Two upland and two wetland species were used with 5 plots each. Then, the data were used to assess variation in structural characteristics, including canopy height and vertical complexity, among forested wetlands and upland forests. The analysis resulted in a significant statistical difference between forested wetlands and upland forests structural characteristics. Additionally, forested wetlands showed a general larger variance in canopy structural complexity suggesting variation in canopy height, canopy density, layering, and forest age. This study serves as a benchmark for LiDAR-based structural characterization of forested wetlands, and informs management and conservation of forested wetlands in the mid-Atlantic region. 

Ellery Moore 

Arctic Ecosystem Carbon Dynamics: Comparing Greenhouse Gas Measurements in Alaska and Northern Canada Using MODIS Satellite Data and Atmospheric Flask Samples 

Ellery Moore, Colby College 

As global temperatures continue to warm, the International Panel on Climate Change (IPCC) has called attention to thawing permafrost as a potential tipping point leading to “irreversible” change to Earth’s ecosystems. Currently, permafrost holds an estimated 1,400 Pg of carbon, which will be released primarily as greenhouse gases (GHGs), methane (CH4), and carbon dioxide (CO2), through microbial activity as temperatures continue to rise, thus exacerbating the atmospheric GHG effect and further warming. In Alaska and Northern Canada, permafrost underlies most of the land, with regions determined by the percentage of frozen soil: continuous (90-100%) and discontinuous (50-90%). Upon examination of spatial maps, the continuous region tends to correspond to the tundra ecosystem, and the discontinuous region to the boreal forest ecosystem. We quantified the permafrost regions using Moderate Resolution Imaging Spectroradiometer (MODIS) derived Normalized Difference Vegetation Index (NDVI) and land surface temperature (LST). In this study, we aim to determine if CO2 and CH4 concentration measurements differ between the two ecosystems using atmospheric flask samples collected during the Arctic Boreal Vulnerability Experiment (ABoVE) in 2017. Overall, the results showed a positive correlation between NDVI and LST, with the boreal forest characterized by higher NDVI and LST than the tundra. Additionally, higher CO2 concentrations were associated with lower NDVI and LST. However, when separating the samples into the two ecosystems, no difference was seen in their diurnal cycles. In general, CH4 measurements did not show a clear relationship with NDVI and LST, but predominantly higher measurements were seen in the tundra when separating the samples by ecosystem. The different CH4 concentrations could be influenced by other environmental sources not considered in this study, such as thermokarst lakes and anthropogenic factors. Further work to differentiate the ecosystems and confirm findings can be done by examining soil moisture samples and comparing permafrost active layer thicknesses. Additionally, to better understand the rates of carbon release, eddy covariance measurements could be examined between the tundra and boreal forest over time. 

Rayyane Matonding

San Francisco BVOC Emissions: The Role of Urban Vegetation in HCHO/NO2 Ratios 

Rayyane Matonding, University of San Francisco 

Biogenic Volatile Organic Compounds (BVOCs) influence local air quality, especially during summer when emissions and photochemical activity peak. BVOCs can oxidize to form ground level ozone, which poses respiratory health risks. Formaldehyde (HCHO), a key photooxidation product of BVOCs, serves as a useful proxy for biogenic emissions in remote sensing studies. Likewise, nitrogen dioxide (NO2) indicates combustion-related activity and anthropogenic VOC influence. This study examines the relationship between urban tree cover and BVOC-related ozone formation using the HCHO to NO2 photochemical regime, which reflects the balance between biogenic and anthropogenic sources. HCHO and NO2 data were obtained from NASA’s TEMPO instrument, and tree cover data from SF OpenData. San Francisco was selected due to its urban greening efforts, high anthropogenic emissions, and prevalence of invasive tree species. Two neighborhoods were selected, Sunnyside with approximately 22 percent canopy cover and Potrero Hill with approximately 2 percent canopy cover, to compare temporal trends in HCHO to NO2 ratios using time series plots. These neighborhoods were chosen based on the availability of hyperlocal weather data, which allowed for more localized atmospheric analysis. No consistent relationship between tree cover and HCHO to NO2 ratios was observed, except during 15:11 and 18:11 on June 18, 2024, which may be associated with elevated photolysis. When weather variables such as zonal wind, meridional wind, and temperature were included in the analysis, no significant correlations were found. Further research should include other cities, additional time periods, and tree species information. 

Emmanuel Kaiser-Veyrat 

Vegetation Traits to Methane Fluxes: A Machine Learning Approach Across Diverse Wetlands 

Emmanuel Kaiser-Veyrat, Cornell University 


Wetlands are the largest and most uncertain biological source of CH4, a greenhouse gas with 56 times the radiative forcing of CO2 over a 20-year time horizon. Given the spatiotemporal constraints of these dynamic ecosystems for consistent on-site observations, remotely sensed vegetation indices (VIs) offer a scalable approach to capturing the biophysical and biochemical conditions that govern CH4 exchanges. However, their reliability in wetland environments is challenged by signal saturation in dense vegetation as well as spectral mixing of water, soil, and plants. Seeking to quantify these limitations, we employ the machine learning algorithm, Random Forest Regressor (RFR), to answer the question: Can remotely sensed vegetation traits predict CH4 fluxes across freshwater and saltwater marshes? VIs from the Index DataBase are derived from the Landsat Collection 2 Level-2 products for Landsat-7 ETM+ and Landsat-8 OLI. The FLUXNET-CH4 Community Product yields 17 wetland sites across the contiguous U.S. with daily mean methane flux values spanning some or all of the 2011 to 2018 interval. Generalized flux footprints were computed for every site adopting a uniform approach scaling fetch with increasing measurement height. Extracting feature importances from RFR, we found the Green Vegetation Moisture Index (GVMI) to consistently outperform all other indices, including two meteorological covariates measured from flux tower sites: air temperature and shortwave radiation. Grouping the VIs into five categories (moisture and water, greenness and productivity, structure and soil, pigments, and burn), we found that moisture and water indices consistently scored higher in feature importance than all other categories combined. 

Share

Details

Last Updated
Nov 19, 2025

💾

Terrestrial Fluxes Introduction | Faculty Mentors Chris Gough, Lisa Haber, and Brandon Alveshere, Virginia Commonwealth University, and Graduate Mentor Kayal...

SARP East 2025 Oceans Group

10 min read

Preparations for Next Moonwalk Simulations Underway (and Underwater)

A group of eight people stand together inside a hangar with a somewhat shiny floor. In the background is a small white plane with a blue stripe, and large windows behind that.
The 2025 SARP East Oceans Group poses in front of the Dynamic Aviation B-200 aircraft, parked in a hangar at NASA’s Wallops Flight Facility in Virginia. During the internship, students spend a week engaged in Earth science data collection and learning from instruments specialists while flying onboard both the B-200 and NASA’s P-3 aircraft.
NASA/Milan Loiacono

Faculty Advisors:

Tom Bell, Woods Hole Oceanographic Institute

Graduate Mentor:

Sarah Lang, University of Rhode Island

Oceans Group Introduction

Faculty Advisor Tom Bell and Graduate Mentor Sarah Lang

Isabella Showman 

Detecting Coastal Sea Ice Extent and Freshet Event Timing in Prudhoe Bay, Alaska Using Sentinel-1 C-SAR 

Isabella Showman, University of Washington 

The detachment of coastal sea ice due to increasing upstream snowmelt causes dramatic seasonal changes in the Arctic Ocean. Termed a freshet, these freshwater pulses influence the timing of sea ice degradation, but the effects are difficult to quantify because of frequent cloud cover and limited ground observations. Sentinel-1 C-SAR (Synthetic Aperture Radar) collects high-spatiotemporal data using microwave radiation backscatter allowing it to see through clouds, making it a valuable tool to identify freshet timing in the Arctic. 

We used SAR imagery to classify seasonal sea ice extent for a 45 km transect north of Prudhoe Bay, Alaska. The backscatter signature of SAR is influenced by roughness, and since ocean water is smoother than ice, the backscatter differences allow for the estimation of proportional sea ice cover along the transect. We validated the accuracy of our SAR classifications using shortwave infrared from cloud-free Sentinel-2 images, and found strong agreement between the methods. We then calculated the average annual percent ice cover from 2017 to 2024, serving as a seasonal baseline to compare against individual years. We found mean sea ice decline throughout the spring and summer months and associated freshet event timing to begin in the middle of June. The rate of decline in sea ice cover along the transect has higher variability in the weeks following the onset of sea ice melt. 

The use of SAR to track localized seasonal ice melt and identify the timing of spring freshet events allows for a more complete seasonal time series than optical imagery alone. Variability in Arctic freshet timing influences how and when sea ice degradation begins, having potential implications for organisms reliant on sea ice extent and larger-scale surface albedo. This study also lays the groundwork for future investigations to better understand across- watershed variability and environmental factors like river discharge and surface temperature on freshet timing. 

Sarah Gryskewicz

Investigating the Impacts of the January 2025 California Wildfires on Phytoplankton Blooms in the Pacific Ocean 

Sarah Gryskewicz, State University of New York at Oswego 

Wildfires are increasing in frequency and intensity across North America as a result of climate change. The release of particulates by these events result in short-range and long-range implications on human and ecophysiological health. Marine ecosystems may also be impacted due to the deposition of these chemical constituents, particularly ash, which can alter nutrient cycling in the water by fertilization and reduce light availability for phytoplankton. Phytoplankton are microscopic organisms that live in marine waters and are responsible for half of the photosynthetic activity on Earth. An area of complex interdisciplinary research concerns the interactions between wildfires and the marine ecosystem. There is a large scientific need to understand biogeochemical cycling between wildfire emissions and phytoplankton blooms. 

This study investigates the January 2025 California wildfire impacts on phytoplankton blooms offshore the southern California coast in nutrient limited waters. The Visible Infrared Imaging Radiometer Suite (VIIRS) onboard the Suomi National Polar-orbiting Partnership (SNPP) satellite is used to assess interannual and seasonal variabilities while the Plankton, Aerosol, Cloud, ocean Ecosystem (PACE) satellite was utilized for the additional ocean-based analyses. Variables considered include chlorophyll-a (chl-a) as a proxy for phytoplankton biomass, particulate organic carbon (POC) to assess phytoplankton physiology, and diffuse attenuation at 490 nm (Kd490) to assess light availability. From this analysis, it was found that there was no evident fertilization of a phytoplankton bloom given that chl-a eight-day composites did not deviate significantly from 2012-2025 average geometric mean concentrations. Analyses of the chl-a:POC and chl-a:Kd490 ratios suggest a potential physiological or phytoplankton community shift, but future work using in-situ data is necessary to connect wildfires impacts on phytoplankton communities offshore Southern California. Additionally, the research sets the stage for future work using PACE to investigate impacts on phytoplankton community groups. Future research also involves the expansion of sample wildfire cases and consideration of forested versus urban emission impacts. 


Philip Espinal

How Well Can Machine Learning Forecast Kelp Biomass Along the Central California Coast? 

Philip Espinal, Texas A&M University 

Giant Kelp is an integral part of the coastal ecosystem off the Central California Coast because it provides food and shelter for several marine organisms, and supports a multi-million dollar commercial fishing industry. In recent decades, Giant Kelp forests have been in decline due to warming ocean temperatures and overgrazing by marine organisms such as sea urchins. Conservation efforts like outplanting, transplanting, and sea urchin removal are occurring in an effort to restore Giant Kelp populations along the California Coast. Knowing when the environment will be favorable for kelp growth is important to focus conservation resources and effort most efficiently. Observations from the Landsat series of satellites allow for the estimation of kelp biomass density going back to 1984. Two machine learning algorithms, random forests and a simple neural network, were trained on the Landsat observations, coastal wave model output, climate indices, and reanalysis products from 1984 to 2015. Models were evaluated on the mean absolute error (MAE) for predictions from 2016 to 2021, as well the MAE and mean absolute percent error (MAPE) of just the third quarters, when maximum biomass density is typically achieved. The random forest models showed little skill even at the minimum forecast horizon of one quarter, performing similar to a prediction made by a 5-year rolling seasonal average. The neural networks performed significantly better than the random forests and seasonal averages when forecasting one quarter into the future, and performed marginally better at two and four quarters into the future. The neural network trained to forecast one quarter ahead had a third quarter MAPE of 13.4% while the 5-year seasonal average had a MAPE of 42.8%. Models performed poorly in the area surrounding Monterey, greatly overestimating the amount of kelp biomass. This overprediction may be due to the severe reduction in kelp biomass since 2015 due to sea urchin overgrazing. While the predictions did not match the actual outcome, the environment may have in fact still been productive for kelp if not for the presence of sea urchins. Overall, these models can serve as a proof of concept that machine learning models, especially neural networks, can use current environmental conditions to forecast kelp biomass one to two quarters into the future, providing useful operational guidance for conservationists. 

Carolyn Chen

Sea Surface Temperature as an Indicator of Benthic Symbiont Loss in the Florida Keys: A Comparative Analysis of ECOSTRESS and MODIS 

Carolyn Chen, University of Florida 

Coral bleaching events, which pose significant threats to marine biodiversity and reef structure, have increased in frequency and severity over recent decades. Accurate monitoring of sea surface temperature is vital for understanding the drivers of zooxanthellae loss in these foundational habitats. Traditional methods of satellite temperature data collection have relatively coarse spatial resolution (1 km). This can obscure finer-scale thermal variability, especially in nearshore and coastal reef environments where localized temperature anomalies may lead to significant biological impacts. Here, we use ECOSTRESS at a fine spatial resolution (70 m) to investigate the relationships between sea surface temperature and bleaching in the Florida Keys. Thermal imagery from July 24, 2023 was spatially overlaid with in situ coral bleaching survey data to investigate potential thermal stress–bleaching relationships. We then quantified this relationship through correlation analyses at varying spatial thresholds, examining the strength and direction of associations between sea surface temperature and corresponding levels of coral bleaching intensity across survey sites. Parallel analyses were conducted using MODIS for comparative assessment. We were able to determine that ECOSTRESS sea surface temperature had a weak association with bleaching intensity (r² = 0.348, p<0.001). Greater thresholds yielded lower correlation. Comparatively, MODIS showed low correlation at all spatial thresholds. These findings demonstrate the potential of ECOSTRESS for quantifying thermal relationships and lays the groundwork for future work across temporal scales. 

Joshua Chapin

Impacts of Atmospheric Rivers on Phytoplankton in the Central California Current System 

Joshua Chapin, The University of Alabama in Huntsville 

Atmospheric rivers (ARs) are powerful meteorological events that deliver large volumes of freshwater to coastal systems, potentially reshaping oceanographic and ecological conditions. This study investigates the impact of AR-induced freshwater outflow—specifically from the Russian River (RR) and other freshwater sources–on phytoplankton communities in the central California Current System on April 11, 2023. Using Sentinel-3 ocean color reflectance bands within the visual spectrum (e.g., bands 2 through 11), we applied k-means clustering to classify waters with distinct bio-optical properties. To validate and interpret these water types, we integrated data from NASA’s Sub-Mesoscale Ocean Dynamics Experiment (S-MODE) field campaign, including flow-through measurements of temperature, salinity, chlorophyll-a, and particulate organic carbon (POC), along with bottle sample data on nutrients and high-performance liquid chromatography (HPLC) pigments (e.g., fucoxanthin, peridinin, nitrate). These in situ observations revealed physical and biological signatures across the clustered water masses. One cluster is characterized by cold temperatures, low salinity, low chlorophyll-a concentrations. The cluster is also characterized by reduced fucoxanthin (denoting reduced diatom concentrations) and low nitrate. These T/S and bio-optical characteristics suggest an association with terrestrial outflow, potentially linked to AR-driven discharge from the Russian River and adjacent watersheds. However, within the same T/S space, elevated chlorophyll-a concentrations are observed, indicating that some RR water is associated with elevated productivity. . T/S diagrams also indicated that elevated chl-a was associated with mixing of the RR with surrounding waters. In contrast, other clusters were characterized by warmer temperatures, higher salinity, elevated chlorophyll-a concentrations, higher nitrate levels, and higher accessory pigment concentrations such as alloxanthin and prasinoxanthin (associated with this cluster). Overall, these contrasting signatures among clustered water masses illustrate the ecological gradients shaped by AR-driven freshwater delivery. This integrated approach highlights the ecological consequences of terrestrial runoff following AR events and demonstrates the utility of combining satellite-based classifications with high-resolution in situ measurements to monitor phytoplankton variability in dynamic coastal environments. 

Eli Mally

Predicting Phytoplankton Pigment Groups in Coastal Southern California with PACE 

Eli Mally, University of California, Irvine 

Phytoplankton produce half of the world’s oxygen, influence nutrient cycling, and form the basis of the ocean’s food chain. Predicting phytoplankton pigment groups from hyperspectral satellite data, especially in coastal areas where accurate retrievals are challenging, is crucial to gaining a better understanding of ocean ecosystems. Phytoplankton community models from hyperspectral data (such as the MOANA model) have recently become available for the Atlantic, but are not yet available for the Pacific Ocean. To address this observational gap, we created regional models of phytoplankton pigment groups in coastal southern California. We used Level 2 Ocean Color Instrument reflectance data in mid-September 2024 from the NASA PACE satellite. We matched the reflectance data with in situ high performance liquid chromatography (HPLC) data from PACE validation cruises (PACE-PAX) in the Santa Barbara Channel and near Long Beach, with a focus on total chlorophyll, chlorophyll-a, -b, and -c, and five pigments associated with different phytoplankton groups characterized in Kramer et al. 2022 (diatoms, dinoflagellates, haptophytes, green algae, and cyanobacteria). We then performed a principal component regression on the satellite data to find models for each pigment. This project resulted in significant models and R2 values for total chlorophyll (0.911), chlorophyll-a (0.868), -b (0.650), and -c (0.861), 19′-hexanoyloxyfucoxanthin (0.517), peridinin (0.327), zeaxanthin (0.381), fucoxanthin (0.678), and monovinyl chlorophyll-b (0.650). Furthermore, these results help validate PACE satellite measurements, which provide much finer spectral detail on phytoplankton community groups than multispectral data. Further cruises in this area would increase the scope and amount of HPLC samples, and therefore the accuracy and scope of our phytoplankton pigment models. 

Share

Details

Last Updated
Nov 19, 2025

💾

Lucas DiSilvestro, 2024 participant in the East Coast Student Airborne Research Program (SARP), presents his final research project titled “Shallow Water Ben...

SARP West 2025 Aerosols Group

9 min read

Preparations for Next Moonwalk Simulations Underway (and Underwater)

A group of seven students wearing badges on lanyards stand on tan tarmac in front of a small gray plane.
The 2025 SARP West Aerosols Group poses in front of the Dynamic Aviation B-200 aircraft, parked on the tarmac at Guardian Jet Center in Southern California. During the internship, students spend a week engaged in Earth science data collection and learning from instruments specialists while flying onboard both the B-200 and NASA’s P-3 aircraft.
NASA/Milan Loiacono

Faculty Advisors:

Andreas Beyersdorf, California State University, San Bernardino 

Graduate Mentor:

Bradley Ries, University of California, Riverside 

Aerosols Group Introduction

Faculty Advisor Andreas Beyersdorf

Martha Santiago

Aerosol Pollution in Two Coastal Agricultural Regions in the United States 

Martha Santiago, Northwestern University 

Although air quality has improved across the United States since the passage of the Clean Air 

Act in 1970, air pollution remains an issue for millions of Americans. Livestock, fertilizers, and pesticides can release pollutants into the surrounding environment, which may be associated with adverse health effects like asthma and cardiovascular disease, in nearby populations. Because some aerosols are tracers for agriculture, examining aerosol concentrations and composition can help better understand sources and impacts of air pollution. Here, we compare two agricultural regions, the Central Valley in California, which is dominated by fruit, nut, and cattle farms, and the Delmarva Peninsula, which comprises chicken hatcheries and vegetable farms. Using airborne data from the Aerosol Mass Spectrometer (AMS), we compare relative and absolute levels of ammonium (NH4+), chloride (Cl-), nitrates (NO3-), organics, and sulfates (SO42-), and calculate total particulate matter smaller than one micron (PM1). We also examine other agricultural pollutants such as methane (CH4), a tracer for agricultural activity, and compare hotspots between each region. Although both regions are known for high levels of agriculture, our results indicate that their aerosol and trace gas compositions and concentrations vary significantly. On the Delmarva Peninsula, air pollution appears to be a regional issue; average pollutant concentrations are higher but evenly distributed. Conversely, pollution in the Central Valley is localized, as indicated by higher pollutant peaks that overlap over clusters of communities. Understanding differences in composition, concentration, and distribution enables communities and policymakers to identify solutions to address air pollution and to improve air quality. 

Eli Garcia 

Analysis of missed approaches across the Los Angeles basin with a focus on Long Beach aerosol composition 

Eli Garcia, Trinity College 

Aerosols play an important part in the overall air quality, visibility, and human health in urban and rural areas alike. Within the urban sprawl of Los Angeles, many sources of anthropogenic aerosols contribute meaningfully to the improving, yet still below-average air quality of the greater metropolitan area. Because of the relative size and topography of urban Los Angeles, the area can be divided into multiple distinct regions each with distinct sources and compositions of aerosols. To better understand these sources, missed approaches were examined from the NASA Student Airborne Research Program flight campaigns over the last two summers. These missed approaches provide us with an accurate snapshot of the local aerosol composition for people living near these airports, so that we can better understand the sources of these pollutants. For this study, we used aerosol mass spectrometer data to determine the relative amounts of organics, sulfates, nitrates, ammonium, and chlorides. We were also able to collect the total number count of particulate matter and the nonvolatile number count utilizing a condensation particle counter. Data were acquired from six common airports where missed approaches were performed, and we discovered the aerosol composition varies based on the location within the basin. At airports with large amounts of traffic and warehouses, nitrates are a greater portion of total mass, while at airports with a greater concentration of industry, like Long Beach, sulfates are also a greater fraction. By determining what the largest contributing aerosols are and their major sources, efforts can be focused to mitigate these specific polluters. 

Kiersten Sundell

Mega-Feedlots, Mega-Impact: Differences in Health Outcomes in California’s Imperial Valley 

Kiersten Sundell, University of Rhode Island 

Imperial Valley communities show asthma rates significantly higher than California averages across all age groups, despite relatively low particulate matter (PM2.5 and PM10) readings at regulatory monitoring stations. This health-pollution disconnect indicates potential unmeasured emission sources in a region dominated by industrial cattle feedlots. Imperial Valley hosts California’s largest Concentrated Animal Feeding Operation (CAFO) and slaughterhouse, facilities that confine thousands of cattle and produce large volumes of methane, PM, nitrous oxide, and ammonia, producing complex aerosols linked to respiratory and cardiovascular health impacts. While previous studies have used downwind total suspended particulate filters, dispersion modeling, and supply chain mapping to assess CAFO emissions, these approaches often miss concentrated pollution hotspots. We combine aerosol data from the NASA Student Airborne Research Program, EPA air quality monitoring stations, IPCC calculations, and California wastewater permits to quantify and map emissions from the state’s largest cattle feedlot and slaughterhouse: Brandt Beef in Calipatria and Brawley, California. We mapped these pollutants against health and demographic data in California’s Imperial Valley using data from California Department of Public Health and CalEnviroScreen, finding significant correlations between pollutant spread and prevalence of health indicators such as asthma and cardiovascular disease. Our analysis reveals that Brandt Beef operations emit 26.73 tons of methane and 39.98 tons of nitrous oxide daily. Airborne measurements revealed elevated PM concentrations around facilities, while spatial analysis showed significant correlations between facility proximity and health conditions. These findings indicate that large-scale cattle operations are associated with measurable environmental impact in the surrounding communities, which may be linked to differences in health outcomes, despite compliance with federal air quality standards. 

Lilly Kramer

Dust Over the Salton Sea 

Lilly Kramer, Oberlin College 

Dust storms occur from winds picking up loose sediments, which creates health issues for surrounding populations. The largest dust source in the US is found in California’s Owens Dry Lake. These dust storms are incredibly toxic, carrying carcinogens from the exposed lakebed (playa) into the atmosphere and toward people. The Salton Sea is a lake in California that is rapidly drying, exposing its playa to the environment. In its decline, the Salton Sea mirrors the fate of Owens Lake, which dried up in 1905. A 2024 research paper by Eric C. Edwards (et al.) used a spatially explicit particle transport model to demonstrate increased dust emissions from the Salton Sea. Our research will showcase environmental evidence that the increasing playa creates more dust in the Salton Sea area, corroborating the existing model. This was achieved by analyzing the NASA Student Airborne Research Program flight data over nearly a decade. An Ultra-High Sensitivity Aerosol Spectrometer (UHSAS) and Laser Aerosol Spectrometer (LAS) provided the information on the size of aerosol particles and their quantity. The analysis established a trend of increasing dust particles over the Salton Sea area by looking at particles over 500 nm in diameter. This trend is currently dangerous for the people living near the lake, as increased toxic dust causes significant health issues. This problem will only be exacerbated because if the lake continues its projected path and completely dries up, it could create massive toxic dust storms that extend much farther. 

Justin Staley

Seasonal Variability in Boundary Layer Vertical Profiles over Los Angeles: A Comparative Analysis of Summer and Winter Conditions 

Justin Staley, Villanova University 

The planetary boundary layer (PBL) is the lowest part of the atmosphere, in situ air that borders the free troposphere and the Earth’s surface. Characterized by turbulent mixing, PBL plays an important role in climate patterns, weather dynamics, and air quality, and is influenced by external factors such as temperature, geography, and proximity to the ocean. This project analyzes the seasonal differences in PBL characteristics over the greater Los Angeles area by asking how vertical profiles of trace gases and aerosols compare during missed approaches in summer 2025 and winter 2021. Aircraft-based measurements of trace gases (CH₄, NH₄, O₃, NO₃), organic aerosols, and total number count of aerosols, were used to analyze how the PBL structure influences pollutant distribution across urban and coastal regions. Results indicate that summer mornings often exhibit deeper boundary layers from increased solar intensity. In contrast, winter morning profiles exhibit shallower and more stable boundary layers from less warming and more cloud coverage, with weaker vertical mixing. Observed chemical species, particularly O₃ and NH₄, displayed distinct vertical gradients at the PBL top, aiding in defining its height and dynamics. Additionally, ozone concentrations increase above PBL, while total aerosol number counts vary with altitude and location. These findings provide insight into pollutant dispersion, chemical reactivity, implications for regional air quality modeling, and a better understanding of the role of local geography and meteorology in shaping boundary layer behavior in Southern California. 

Jacob Garside

Biomass Burning Aerosol Fingerprints: Combining Absorption and Trace Gas Measurements for Plume Characterization 

Jacob Garside, Plymouth State University 

With thousands of wildfires occurring annually in California, understanding smoke composition is critical for air quality and climate assessments. As wildfire severity and intensity are increasing year over year, being able to characterize aerosol plumes becomes more important. This study examines two significant 2025 fires through combined airborne and ground-based measurements: the June 30th Juniper Fire and the 24-day Eaton Fire (January 7th–31st). During the NASA Student Airborne Research Program, the P-3B aircraft intercepted the Juniper Fire plume, enabling a comprehensive analysis of biomass burning aerosols. We investigated whether aerosols and trace gases could serve as definitive fire signatures by comparing aircraft and surface measurements. The study utilized absorption measurements from both the airborne Langley Aerosols Research Group, instrument suite and a ground-based Atmospheric Science and Chemistry mEasuremet NeTwork (ASCENT) aethalometer to derive the absorption Ångström exponent (AAE), while simultaneous CO and CO₂ measurements on the aircraft identified plume intercepts and combustion efficiency. Calculated AAE values of 1.5-1.7 indicated mixed contributions from black carbon and brown carbon, which is characteristic of biomass burning. Elevated CO to CO₂ ratios confirmed inefficient smoldering fires, as high values of CO are usually linked to such fires. These findings demonstrate that integrated AAE and trace gas measurements from multiple platforms effectively characterize smoke composition, providing valuable discrimination between black carbon and brown carbon-dominated plumes for improved atmospheric modeling and public health assessment. 

Share

Details

Last Updated
Nov 19, 2025

💾

2025 SARP West Aerosols Group Introduction | Faculty Mentor Andreas Beyersdorf, California State University, San Bernardino

SARP West 2025 Land Group

11 min read

Preparations for Next Moonwalk Simulations Underway (and Underwater)

A group of eight people stand on tan tarmac in front of a small gray plane.
The 2025 SARP West Land Group poses in front of the Dynamic Aviation B-200 aircraft, parked on the tarmac at Guardian Jet Center in Southern California. During the internship, students spend a week engaged in Earth science data collection and learning from instruments specialists while flying onboard both the B-200 and NASA’s P-3 aircraft.
NASA/Milan Loiacono

Faculty Advisors:

Daniel Sousa, San Diego State University 

Graduate Mentor:

Megan Ward-Baranyay, San Diego State University 

Land Group Introduction

Faculty Advisor Daniel Sousa

Robert Purvis

Fractional cover estimates of the epiphytic macrolichen Ramalina menziesii in oak canopies from simulated mixed spectra and airborne imaging spectroscopy 

Robert Purvis, Western Kentucky University 

Lichens, a symbiotic relationship between a fungus (mycobiont) and green algae or cyanobacterium (photobiont), occur globally with great variability in form and function. On the North American west coast, Ramalina menziesii is a robust lichen with net-like morphology found across three distinct biomes. In the mediterranean climate of coastal California, R. menziesii can survive with thallus water content as low as 13%, making the lichen a powerful medium for wildfire spread. As a late-successional community member, changes in wildfire incidence observed in the region have caused R. menziesii coverage to decline. Despite their importance, there is little research on the detection of lichen with imaging spectroscopy, which would provide a potentially novel piece of information to wildland firefighters. The lichen primarily grows on oaks of the region, with the percentage of top-cover ranging from near zero to tree canopy overgrowth due to the lichens’ pendulous growth form. These characteristics may make R. menziesii a good candidate for airborne imaging spectroscopy. Reflectance spectra were collected with a field spectrometer and contact probe from the Figueroa creek area of Sedgwick Reserve in Santa Barbara County, California. From this collection, a spectral library was built (n=70) to contain three endmember types: Quercus lobata (California Valley Oak) leaf (GV; n=34), Q. lobata bark (NPV; n=8), and R. menziesii, (lichen; n=28). This library was sampled using a stratification method and was split into a simulation library (n=41) and an unmixing library (n=29). Mixed spectroscopic pixels at 5% increments of lichen coverage were simulated (n=1344) with random fractions of GV and NPV coverage. Multiple endmember spectral mixture analysis (MESMA) on the simulated pixels recovered the known lichen fractions at an RMSE of 0.25 and R2 of 0.38, with some overestimation of lichen coverage at high GV fractions. Future work will include evaluating the performance of the model with Airborne Visible and Infrared Imaging Spectroscopy (AVIRIS) imagery over Sedgwick Reserve. 

Kyra Shimbo

Investigating the Influence of Pre-Fire Fuels and Topography on Burn Severity Prediction in the 2024 Lake Fire in Santa Barbara County, California 

Kyra Shimbo, University of Rochester 

Wildfires can pose significant threats to air and water quality, vegetation, soil health, and public safety. The growing severity, frequency, and intensity of wildfires underscore the need to mitigate their impacts on ecosystems and communities. In California, a total of 8,110 wildfires occurred in 2024—burning over 1 million acres of land and destroying more than 1,800 structures. Prospective modeling of potential burn severity in fire-prone areas can help inform decisions on effectively implementing fire management strategies to reduce wildfire hazards. Previous studies have demonstrated that various combinations of pre-fire environmental characteristics, such as fuels and topography, can explain burn severity patterns. However, identifying the dominant drivers of burn severity and accurately predicting it remains challenging across different landscapes. To gain a stronger understanding of burn severity dynamics, we evaluated the influence of pre-fire fuels and topography on predicting post-fire char fractional cover—a proxy for burn severity—for the 2024 Lake Fire in Santa Barbara County, California. We used a random forest regression model to predict post-fire char fractional cover based on pre-fire measurements of fuel structure, fuel moisture, fuel condition, fuel water stress, and topography. Fuel structure was measured with the Land, Vegetation, and Ice Sensor (LVIS), a full-waveform LiDAR. Fuel moisture, fuel condition, and char fractional cover were derived from surface reflectance collected by the Earth Surface Mineral Dust Source Investigation (EMIT). Variables related to fuel water stress were estimated from the ECOsystem Spaceborne Thermal Radiometer Experiment on Space Station (ECOSTRESS). Topographic variables were acquired from the Shuttle Radar Topography Mission (SRTM). Preliminary results indicate that the model explains 28% of the variance in post-fire burn severity for the Lake Fire (R-squared = 0.28), with canopy height, green vegetation fractional cover, and aspect ranking the highest in predictor importance. Future work could focus on model improvement by incorporating additional pre-fire and active fire weather variables into the model. Overall, this model can be applied to monitoring fuel parameters associated with high burn severity that jeopardize ecosystems and water resources. 

Nimay Mahajan 

Evaluating Spectral Mixture Analysis (SMA) Derived Vegetation Fraction for Improved ET Estimates in the Semi-Arid Ecosystems of the Sierra Foothills 

Nimay Mahajan, University of Miami 

Evapotranspiration (ET) plays a critical role in water and energy cycles, particularly in semi-arid ecosystems. For decades, ET models have used spectral indices like the Normalized Difference Vegetation Index (NDVI) to quantify the abundance of green vegetation. However, NDVI has long-recognized limitations in semi-arid environments, including saturation for densely vegetated pixels and sensitivity to soil reflectance in sparsely vegetated areas. We explore the potential for vegetation fraction (VF) derived from spectral mixture analysis (SMA) of imaging spectroscopy data to provide a more accurate alternative to NDVI for modeling ET. Focusing on a region east of Fresno, California, we leverage data from National Ecological Observatory Network (NEON) flux towers (SJER and SOAP) which provide ground-based measurements of Latent Heat Flux (LE). We derive VF from surface reflectance collected by the Earth Surface Mineral Dust Source Investigation (EMIT) and compare it to the Landsat-based NDVI product currently used by NASA’s Priestley-Taylor Jet Propulsion Laboratory (PT-JPL) model. Land Surface Temperature (LST) from the ECOsystem Spaceborne Thermal Radiometer Experiment on Space Station (ECOSTRESS) is incorporated as the thermal data source for each PT-JPL model run. Both model configurations use the same six environmental variable inputs, differing only in their representation of fractional vegetation cover. Preliminary findings suggest that SMA-derived VF tends to produce more conservative LE estimates than NDVI, especially in areas with sparse or mixed vegetation cover. These VF-based estimates also appear to better align with flux tower observations, indicating that NDVI may be overestimating ET in this region. While both vegetation metrics show broad agreement in spatial structure (r = 0.73), localized LE differences highlight the importance of subpixel vegetation characterization in ET modeling. As orbital imaging spectrometers become more widely deployed, it is clear that improving remote sensing-based ET modeling can help support water monitoring, drought-resilient agriculture, and wildfire hazard assessments. 

Patricia Sibulo

Comparative Analysis of UAVSAR Derived Flooding Extent During Hurricane Florence (2018) to Urban Flood Hazard Models 

Patricia Sibulo, University of San Francisco 

Urban flooding poses major risks to public safety, infrastructure, and city planning. Yet, floods remain difficult to detect, especially during storms, when high precipitation is often accompanied by spatially and temporally persistent cloud cover. Synthetic aperture radar (SAR) sensors, such as airborne Uninhabited Aerial Vehicle Synthetic Aperture Radar (UAVSAR), emit microwave pulses that can image regardless of cloud cover or time of day and respond sensitively to surface water. This is due to both the high dielectric constant and the flat geometry of standing water. Given sufficient resources, airborne SAR is capable of capturing rapidly evolving flood events that unfold on hourly timescales. We investigated how daily airborne SAR can be applied to improve flood hazard mapping and monitoring in urban areas. This study incorporates airborne quad-polarized L-band UAVSAR data acquired for five days during the 2018 Hurricane Florence in North Carolina and flood hazard models developed by the state. From daily inundation extent maps, we computed the total area flooded in the Northeast Cape Fear River Basin spanning the area between the cities of Wilmington and Goldsboro. Spatial overlap between the total flooded area estimated by UAVSAR and the region’s projected flood hazard zones was quantified. A LiDAR-derived digital terrain model (DTM) with a spatial resolution of 3ft was also used to identify low-lying areas prone to pooling. Preliminary findings suggest that roughly 66% of the SAR-detected flood did not appear within the state’s modeled 100-year flood hazard zone. Future work could compare UAVSAR estimates of total flooded area to estimates derived from lower temporal resolution (6-12 days) spaceborne SAR to improve flood mapping globally. These results support the integration of high-temporal-resolution airborne SAR and satellite SAR in urban flood workflows for hazard assessment and active flood monitoring. The recently launched NASA-ISRO SAR (NISAR) mission, with global coverage up to twice every 12 days, is expected to enhance this fusion approach by providing more frequent spaceborne observations. Integrating SAR and LiDAR may enable more accurate, timely assessments in response to flood disasters. 

Charlotte Perry

Investigating Spaceborne Detection Limits of Geothermally Active Mud Features, Land Surface Temperature, and Surface Mineralogy in the Salton Sea Geothermal Field 

Charlotte Perry, Stonehill College 

Geothermally active mud features, such as mud pots and mud volcanoes, are manifestations of subsurface geothermal activity. Geothermal activity also provides energy resources. In California’s Salton Trough, geothermal power plants produce roughly 340 Megawatts of electric power annually. Detecting and monitoring geothermal surface features is thus valuable, as these features can be key indicators of geothermal resource potential. Here, we investigated the ability of spaceborne multispectral thermal imaging and imaging spectroscopy to detect and monitor these small-scale (sub-decameter) geothermal mud features near the southeastern edge of the Salton Sea. For this investigation, LST data were obtained from the ECOsystem Spaceborne Thermal Radiometer Experiment on Space Station (ECOSTRESS) and surface mineralogy estimates were provided by the Earth Surface Mineral Dust Source Investigation (EMIT) L2B Estimated Mineral Identification and Band Depth product. To examine temporal variability, we processed four images per sensor acquired over two seasons from two consecutive years, May and August for 2023 and 2024. We conducted t-tests to determine if consistent differences in mineralogy and/or LST were observable between known mud pots and control areas. Preliminary results did not find a statistically significant relationship (p > 0.05) between the presence of small-scale geothermal mud features, spaceborne-acquired surface mineralogy, and LST. This study has identified key spatial resolution limitations to locating and monitoring small geothermal mud features. Future work is suggested to determine the threshold for spatial resolution relative to the size of geothermal features of interest. Effectively locating and monitoring geothermally active areas has implications for improving energy security, quantifying the abundance of critical minerals, investigating the effect of their emissions, and understanding the potential geologic hazards they pose. 

Brianna Francis

AVIRIS, Altadena, and Asphalt: Assessing the capabilities of airborne imaging spectroscopy in classifying asphalt road condition 

Brianna Francis, University of Georgia 

Ninety-four percent of paved roads in the United States are surfaced with asphalt. Fire accelerates the aging process of asphalt and causes roads to degrade prematurely. This causes moisture pooling, accelerated pothole formation, and produces hazardous conditions for all motorists. Asphalt can have distinct spectral features depending on its condition. Undamaged asphalt typically has an albedo of 0.05 to 0.10 and is characterized by a notable decrease in reflectance near 1700 nm and 2300 nm due to absorption by the hydrocarbon-based asphalt sealant applied to the top of roads during its initial paving. As road surfaces are subjected to physical and chemical weathering, the hydrocarbon-based sealant is eroded away, revealing the mineral-filled aggregate below. Because of this process, the spectra of weathered asphalt is characterized by a reduction in complex hydrocarbon absorption, an increase in albedo, and an increase in mineral absorptions, especially that of iron oxide near 490 nm. Previous research has applied in situ imaging spectroscopy to identify these absorption features in asphalt roads and correlated them with pavement condition. We evaluated the capabilities of airborne imaging spectroscopy in detecting asphalt damage in Altadena, California after the January 2025 Eaton Fire to assess the accuracy of this method for mapping road damage for repair prioritization. AVIRIS-3 (Airborne Visible Infrared Spectrometer 3) surface reflectance data was collected post-fire over Altadena on January 16, 2025, at a spatial resolution of 1.8m. We compared two spectral methods for road damage classification, the VIS2 band difference and Spectral Angle Mapper (SAM). Results show that road conditions can be classified with an accuracy of 76% for SAM and 85% for VIS2 with a 10% margin of error based on 100 validation samples; however, these methods notably exhibited limited effectiveness in mountainous areas and sensitivity to crack sealing. These findings can contribute to near immediate post–fire recovery efforts by supporting detour planning, repair prioritization, and a smoother restoration process. 

Share

Details

Last Updated
Nov 19, 2025

💾

Land Group Introduction | Faculty Mentor Daniel Sousa, San Diego State University

SARP West 2025 Oceans Group

13 min read

Preparations for Next Moonwalk Simulations Underway (and Underwater)

A group of seven students stand on tan tarmac in front of a small gray plane.
The 2025 SARP West Oceans Group poses in front of the Dynamic Aviation B-200 aircraft, parked on the tarmac at Guardian Jet Center in Southern California. During the internship, students spend a week engaged in Earth science data collection and learning from instruments specialists while flying onboard both the B-200 and NASA’s P-3 aircraft.
NASA/Milan Loiacono

Faculty Advisor:

Henry Houskeper, Woods Hole Oceanographic Institute 

Graduate Mentor:

Camille Pawlak, University of California, Los Angeles 

Oceans Group Introduction

Faculty Advisor Henry Housekeeper

Molly McKellar

Spatiotemporal dynamics of canopy-forming kelp forests in the Russian province of Kamchatka 

Maria (Molly) McKellar, University of Wisconsin, Madison 

Interannual variability in canopy-forming kelps and the environmental conditions in which kelps thrive have not been studied extensively in the Kamchatka region of eastern Russia. Canopy forming kelps promote diverse and productive coastal ecosystems by boosting coastal resilience and supporting ecological communities. To better understand how kelp in the Kamchatka region contributes to these impacts, we must understand the spatiotemporal dynamics and drivers of kelp forests in the region. In this study, we evaluate spatiotemporal patterns in kelp canopy, including characterizing the climatology and assessing medium and long-term trends. We compare patterns in kelp forest dynamics with biological parameters, such as satellite-derived chlorophyll-a time series, as well as climatological indices, such as the Pacific Decadal Oscillation (PDO) and the Northern Pacific Gyre Oscillation (NPGO). New data from Kelpwatch, a global dataset utilizing Landsat satellite imagery, was used to map kelp canopy area from 1999 to present with quarterly resolution. This study is the first spatially resolved analysis of canopy-forming kelps in the Kamchatka region. Kelp area time series were assessed in three sub-regions corresponding to the eastern, western, and southern margins of Kamchatka. We found that the spatial extent of kelp across the entire region is maximal in the third quarter, which encompasses July 1 to September 30 and corresponds to the latter portion of the northern hemisphere growing season. We observed kelp forest patterns to vary spatially, with the southern subregion indicating a positive trend in climatologically adjusted canopy area. Pearson correlation indicated a strong relationship between phytoplankton and kelp dynamics in the southern subregion, perhaps suggesting the importance of nitrate as a regional driver of kelp forest variability. A weak correlation was found between the PDO and NPGO across the entire Kamchatka region and within the eastern and western subregions. While these results support a primary importance of nutrients to kelp population dynamics in the southern region, more work must be done to understand drivers of nutrients variability in Kamchatka. Further investigation of subregional dynamics is warranted given the climatological and mixing differences between the Sea of Okhotsk and the western Pacific Ocean, which each border Kamchatka. Sea surface temperature may also have an impact on kelp forests and should be considered. Understanding regional patterns and trends in Kamchatka would strengthen our understanding of spatiotemporal variability in kelp at global scales and the key associated drivers, including resolving key oceanic and atmospheric processes or modes. The findings supporting positive trends of kelp area in the southern portion of Kamchatka warrants further future research and investigation. 

Grace Woerner

Tropical Storm Effects on Ocean Dynamics Measured Through a Multi-Platform Observing Approach 

Grace Woerner, North Carolina State University 

Elevated low-latitude sea surface temperatures (SSTs) are associated with heightened intensity and frequency of tropical cyclone events. Tropical systems can modify surface marine ecosystems, often to the detriment of coastal communities and fisheries. Characterizing ocean properties before and after storm events can provide insight into storm-driven mixing and corresponding ecosystem responses. However, extreme conditions during tropical storms can impede ocean observing. For example, satellite remote sensing of SST and ocean color during tropical storms is challenged by cloud cover and surface disturbances such as white capping. This study pairs satellite remote sensing observations with in-situ oceanographic data to characterize oceanographic changes in phytoplankton concentrations and SST associated with a tropical cyclone in the western Pacific during March 2024 to April 2025. Chlorophyll-a is a pigment present in phytoplankton and is commonly used as a proxy for estimating phytoplankton abundance. In-situ chlorophyll-a and SST measurements collected by Argo floats were used to validate satellite ocean color observations from the NASA Plankton, Aerosols, Clouds, ocean Ecosystem (PACE) mission and SST from the Multi-scale Ultra-high Resolution (MUR) dataset before and after Typhoon ShanShan, the equivalent of a category four hurricane. The PACE observations indicate agreement with Argo float data, albeit with a slight positive bias and variability in post-storm conditions. MUR SST data also closely matched Argo measurements. It was found that the typhoon passage did not produce a detectable chlorophyll-a anomaly. This finding was further investigated by comparing changes in the mixed layer depth (MLD) and assessing whether the observed storm-induced mixing reached adequate depths to significantly increase surface nitrogen concentrations, prerequisite to inducing a phytoplankton bloom. The findings suggest that while the MLD deepened, deepening was inadequate at regional scales to bring nitrate and other nutrients to the surface. Although Typhoon Shanshan did not generate mixing deeper than the nutricline, more powerful storms or those occurring in waters with shallower nutriclines may more effectively introduce nutrients into surface waters. Limitations such as cloud coverage for satellite observing, plus the sampling frequency, coverage, and sensor availability of Argo float observations, highlight the importance of continued multi-platform observations for ocean environments to advance knowledge of tropical cyclone effects on surface ocean ecosystems. 

Alex Lacayo

Peruvian Coastal Water Temperature Anomalies Correspond to Variability in El Niño Position and Timing 

Alex Lacayo, Columbia University 

The El Niño–Southern Oscillation (ENSO) is a basin-scale oscillation pattern in the tropical Pacific that drives, via teleconnections, atmospheric and oceanic variability at larger scales. El Niño events are ENSO phenomena defined by anomalously warm sea surface temperatures (SSTs) in low-latitude Pacific domains, and the spatial and temporal expression of El Niño events can vary. Recent literature has established distinct differences between the spatial expression of SST anomalies associated with El Niño events. Elevated SST in the Central (often called “Modoki”) and Eastern equatorial Pacific, for example, have been described as so-called El Niño “flavors” and are associated with different responses across global environments. 

This study investigates the relationship between El Niño variability and coastal upwelling within Peru’s Exclusive Economic Zone (EEZ), using satellite-derived SST as a proxy. Coastal upwelling is a vital driver of strongly elevated biological productivity in the Peru EEZ, sustaining one of the globe’s most productive fisheries and the largest anchovy stock worldwide. This analysis evaluates SST anomalies in the Peruvian EEZ as a function of the spatiotemporal dynamics of SST in the tropical Pacific during the onset and evolution of El Niño events spanning the past three decades. The analysis is conducted for two domains in the Peruvian EEZ. The first corresponds to primarily north-south coastline north of Pisco, and the second to the northwest-southeast coastline south of Pisco. Preliminary findings are consistent with Modoki events corresponding to less pronounced warming in Peru during El Niño peaks, along with a lag in post-event upwelling rebound response, compared to Eastern Pacific events. The findings indicate that seasonal timing of El Niño events modify the strength of temperature anomalies in coastal Peru. The subregional comparison suggests that the northern Peruvian EEZ is more impacted by El Niño timing and position variability, likely consistent with its lower latitude and exposure to Kelvin wave propagation. These findings support improved knowledge of how different El Niño expressions influence Peruvian coastal ecosystems, which is critical for assessing ecosystem resilience and informing the management of coastal fisheries. 

Melanie Lin

Utility of SAR in detection of canopy-forming kelp in South Africa 

Melanie Lin, Boston University 

Kelp forests are valuable to coastal cities and towns because they support marine ecosystems, benefit economies, and dampen the effects of waves and erosion. This study aims to understand the extent to which synthetic aperture radar (SAR) can be used to accurately map the distribution of the South African canopy-forming kelp, Ecklonia maxima, or sea bamboo. SAR data was obtained from Sentinel-1, which has a five-day revisit time. SAR observations use radio waves, which penetrate clouds, thereby supporting observations of kelp forest habitat in any cloud condition. Despite the potential to use SAR to increase data availability on cloudy days, there are fewer SAR products for kelp canopy—especially sea bamboo—relative to passive optical remote sensing, which is obstructed by clouds. SAR observations were validated by comparing with manually classified optical imagery obtained using Airborne Visible Infrared Imagining Spectrometer – Next Generation (AVIRIS-NG), which was flown on NASA’s Gulfstream III in 2023 as part of The Biodiversity Survey of the Cape (BioSCape). BioSCape was an integrated field and airborne campaign collaboration between the United States and South Africa to study the biodiversity of the Great Cape Floristic Region (GCFR). More commonly used passive optical remote sensing datasets were also assessed using imagery from Landsat that had been classified using a random forest. This research shows that SAR observations yield distinct values between kelp and ocean, indicating potential to use SAR data to map kelp canopy extent in calm oceanic conditions. SAR observations in the VH (vertically transmitted, horizontally received) polarization indicates a larger distinction between kelp and calm ocean water than data in the VV (vertically transmitted, vertically received) polarization. The sensitivity and responsivity of SAR kelp forest retrievals was dependent on the tidal state during the data acquisition. In VH polarized data, a lower tidal state supports more accurate classifications between kelp and calm ocean water than a high tidal state. Waves, which may contain kelp beneath them, obscure kelp backscatter response in SAR data. This study improves understanding of the utility of SAR for mapping sea bamboo extent, which in turn supports future opportunities to develop better understanding of marine biodiversity and coastal resilience in the GCFR where sea bamboo is the dominant canopy-forming taxa. 

John Lund

Kinetic energy of multiscale oceanic features derived from SWOT altimetry 

John Lund, Adelphi University 

Oceanic eddies are circular movements of water that separate the main flow and facilitate oceanic energy transfer across multiple scales, thereby underlying biophysical interactions and modifying climate and ocean dynamics. Oceanic eddies correspond to dynamics spanning geostrophic to ageostrophic processes, spatial scales spanning 0.1 to 100 km, and temporal scales spanning hours to months. Eddies spanning horizontal spatial scales of 0.1 to 10 km and temporal scales of hours to days, termed submesoscale eddies, are difficult to resolve from legacy satellites due to the finer spatial resolution requirements for observing smaller scale features. Conversely, eddies spanning larger horizontal spatial scales and longer temporal scales, termed mesoscale eddies, are more readily resolved using legacy satellite altimeters. This research utilizes observations from the recently launched Surface Water and Ocean Topography’s (SWOT) Ka-band Radar Interferometer (KaRIn) to resolve submesoscale eddies and quantify associated kinetic energy. We contextualize our SSHA observations using the Data Unification and Altimeter Combination System (DUACS)—a project that merges satellite data to observe coarser mesoscale fields on a global scale—to visualize ocean dynamics around SWOT swaths more clearly. Comparing the kinetic energy associated with SWOT-detected features to that estimated from DUACS data supports improved understanding of the relative importance of the submesoscale in global energy transfer. Results from this investigation demonstrate that SWOT supports characterizations of features at the upper bound of the submesoscale to analyze ocean dynamics and energy cascades at specific moments and locations. Resolving the temporal dynamics of submesoscale features remains challenging due to SWOT’s 21-day revisit cycle, which also limits submesoscale characterizations to isolated swaths, but novel SWOT observations nonetheless support snapshot opportunities to constrain the role of submesoscale processes in global energy transfer. Future directions with SWOT include coupling data with high-resolution numerical models or additional satellite missions such as PACE to map a wider region and investigate key controls on biophysical interactions associated with submesoscale processes. 

Logan Jewell

Machine Learning Classification of Remote Sensing Imagery for Investigating Changes in Natural Oil Seepage 

Logan Jewell, State University of New York, Brockport 

Spatiotemporal variability in oil content of the Santa Barbara Channel (SBC) corresponds to natural hydrocarbon seepage and past anthropogenic spills. The marine geology of the SBC is characterized by a relatively shallow and abundant hydrocarbon reserve beneath faulted anticlines that run parallel to the shore. Natural seepage occurs when pressure in the reserve exceeds hydrostatic, and gaseous bubbles coated in liquid petroleum seep through the sea floor and enter the marine environment. Because gaseous hydrocarbons and oil are both buoyant in seawater, the seepage manifests as oil slicks at the surface of the ocean. Oil has historically been extracted from the reserve by human drilling, potentially alleviating pressure in the reserve, at sites such as Platform Holly, which operated in the SBC from 1966 until production ceased in 2015. Platform Holly is located roughly 3.2 kilometers from the shore and is the only offshore oil platform in California State waters. Since decommissioning, the only mechanism releasing oil in this region of the hydrocarbon reserves is natural seepage. In this study, machine learning via a random forest model is utilized to identify and classify oil slick regions in Sentinel-2 optical images encompassing the decommissioned oil platform Holly and other nearshore waters near Santa Barbara, CA. The random forest model was developed to predict 3 classes, or targets: clear, turbid, and oil-contaminated waters. Sentinel-2 supports a 5-day revisit time, which mitigates cloud obstruction in the region, and 10-meter spatial resolution appropriate for distinguishing small-scale surface features such as slicks. 6 images were manually classified for training, and classification using the random forest supported an additional 27 classified images. A time analysis was conducted using the combined 33 images, which spanned 2019 to present to assess variability in hydrocarbon seepage starting 4 years after decommissioning to present. Preliminary results do not indicate a trend in the area of the natural oil slick from 2019 to 2025. We conducted sensitivity testing by assessing covariance between oil slick area with wind and tidal measurements and found no significant correlation to winds or tides. More frequent imagery spanning a wider temporal range could help to better determine whether oil slick area is changing or stable through time. 

Share

Details

Last Updated
Nov 19, 2025

💾

Spatiotemporal dynamics of canopy-forming kelp forests in the Russian province of Kamchatka | Molly McKellar, University of Wisconsin, MadisonInterannual var...

SARP West 2025 Whole Air Sampling Group

8 min read

Preparations for Next Moonwalk Simulations Underway (and Underwater)

A group of eight people wearing badges on lanyards stand on tan tarmac in front of a small gray plane.
The 2025 SARP West Whole Air Sampling (WAS) Group poses in front of the Dynamic Aviation B-200 aircraft, parked on the tarmac at Guardian Jet Center in Southern California. During the internship, students spend a week engaged in Earth science data collection and learning from instruments specialists while flying onboard both the B-200 and NASA’s P-3 aircraft.
NASA/Milan Loiacono

Faculty Advisor:

Donald Blake, University of California, Irvine

Graduate Mentor:

Oluwaseun Moses Akinola, University of Connecticut

Whole Air Sampling Group Introduction

Faculty Advisor Donald Blake

Sarah Kinlaw

Impact of Dairies on Ozone Production in Ontario, CA 

Sarah Kinlaw, College of William & Mary 

In the center of Ontario, California’s urban sprawl sits 5 square miles of livestock farming, including many dairies. Emissions from silage from dairy farms result in significant amounts of ethanol and methanol entering the atmosphere. These volatile organic compounds (VOCs) can participate in the formation of tropospheric ozone through oxidation and photolytic processes. Ozone is known to have negative impacts on humans, agriculture, and the climate. Of concern is that the dairy regions and regions downwind will likely have enhanced levels of ozone. In this study, 19 samples were collected from dairy farms and downwind sites over two days. The extent of enhancement in reactive species was determined by comparing concentrations of speciated VOCs, collected from air samples from the downwind sampling sites, with estimated upwind background concentrations. The “ozone production potential” (OFP) was estimated by multiplying the mixing ratios of VOCs of interest by their respective hydroxyl rate constants, and it was found that methanol and ethanol were the major VOC contributors to OFP. HYSPLIT trajectory modeling was used to determine the dispersion patterns of air masses originating from the dairy farm area and identify potentially impacted downwind communities. This analysis emphasizes the need for more robust air quality and agricultural management with a focus on directing policies to improve air quality at a local and regional scales. 

Ryan Glenn

Examining the Chemical Composition and Evolution of Palisades Fire Gas Emissions 

Ryan Glenn, Dartmouth College 

Wildland-urban-interface (WUI) fires in the US are increasing in frequency and intensity with disproportionately large impacts on air quality and human health. The 2025 Palisades Fire alone destroyed nearly 7,000 structures and displaced more than 30,000 people. Despite their significance, they remain understudied compared to wildland fires, especially in regard to emission composition, evolution, and ozone formation potential. Here we analyze trace gases and volatile organic compounds (VOCs) collected via air canisters during the Palisades Fire and use the Framework for 0-D Atmospheric Modeling (FOAM) box model to simulate their evolution. Gas chromatography-mass spectrometry reveals high daytime VOC concentrations despite the increase of the boundary layer. C1-C4 oxygenates exhibited by far the highest reactivity and concentrations, accompanied by alkanes, alkenes, aromatics, biogenic, and chlorinated compounds indicative of the combustion of anthropogenic materials. Using the sampling data to constrain the FOAM box model, we characterize the regime as primarily VOC-limited and identify acetaldehyde and methanol as key ozone precursors and nitric acid as the primary nitrogen oxide (NOx) sink. These findings suggest that targeted reductions in oxygenates will be most effective in mitigating ozone formation from WUI fire emissions. This study has significant implications for wildfire air quality management and highlights the need for further research comparing WUI and wildland fire emission chemistry. 

Riley Gallen

Temporal and Spatial Analysis of Nitrogen Dioxide (NO₂) in Long Beach: Assessing Its Role in Ozone Formation and Impact on Nearby Communities/Coastal Ecosystems 

Riley Gallen, University of Florida 

Nitrogen dioxide (NO₂), a key precursor to ozone formation, is emitted from various combustion sources including vehicles, cargo ships, and power plants. In Long Beach, California, these sources are concentrated around highways and the busy port, thus raising concerns about localized air pollution and its broader environmental impact. This project investigates NO₂ concentrations over Long Beach using NASA’s B200 and DC-8 aircraft flight data from 2019, 2021, and 2025. Data were analyzed through latitude–longitude mapping and altitude comparisons to assess temporal trends and spatial distribution of NO₂. The 2021 dataset, collected during pandemic-related port congestion, showed elevated NO₂ levels, though seasonal differences required comparison between 2019 and 2025 for consistency. Overall, NO₂ concentrations increased in 2025 relative to 2019. HYSPLIT wind trajectory modeling often carried pollutants inland, particularly toward the communities of Wilmington and West Long Beach, which already experience elevated respiratory health risks due to pollution exposure. Although the scope of this study was not to determine the exact NO₂ sources in Long Beach, the prevailing wind patterns as indicated from the HYSPLIT model suggests the port as a likely source. While inland transport dominated during the selected flight days, wind patterns are unpredictable. This variability suggests that NO2 and its photochemical transformation into ozone could occur over adjacent marine ecosystems such as Bolsa Bay State Marine Conservation Area and Albone Cove State Marine Conservation Area. Collectively, this study highlights the potential impacts of NO₂ exposure on local communities and nearby coastal ecosystems and emphasizes the need for continued monitoring and apportionment of sources of NO2 in urban coastal regions. 

Owen Rader

Quantifying the Impact of Meteorological Variables on Wildland Fire Spread 

Owen Rader, University of Delaware 

Past studies have revealed that wildfire is becoming more extreme due to increasing hydroclimate variability. Using Los Angeles County’s Eaton Fire, a primarily wind-driven fire, as a case study, I simulate the fire under isolated meteorological variables with a focus on quantifying the impacts of wind speed simulations on the fire’s spread. A comprehensive analysis of the Eaton Fire’s spread can indicate how Wildland Urban Interface (WUI), a growing transition zone particularly in Southern California, is vulnerable to enhanced fire activity under different meteorological conditions. This study aims to demonstrate how fuel metrics behave under different wind conditions, thus providing valuable insight into the potential rates of spread and response times to wildfire-encroached WUI areas. To achieve this, LANDFIRE surface/canopy fuel products and topographical products are used as pre-model run fire parametrizations using FLAMMAP’s built-in Landscape file generator, using variable wind speeds while holding other values constant, to output fuel-load metrics. Following this, I utilized ARSITE, a built-in application to FLAMMAP, to simulate several scenarios over time, using real-time ERA5 Reanalysis meteorological data from the wildfire event period, and quantified the impacts of variable wind speeds. These model runs can provide valuable insights into how fires behave under varying meteorological conditions, which can be further quantified through future research to better understand how a shift towards hydroclimate extremes impacts WUI fires. 

Stephen Shaner

Analysis of Bromoform Concentrations and Impact in California 

Stephen Shaner, University of Maryland, Baltimore County 

Bromoform is a haloalkane which is commonly found over the ocean, with major sources being marine organisms such as phytoplankton and macroalgae. This compound has been measured around California during the NASA Student Airborne Research Program flights campaigns since 2010. Within this sampled period, 2014 showed significantly higher bromoform concentrations than any other measured year. In this study, the concentrations of bromoform from 2010–2022 were analyzed and consistently higher than average concentrations were evident over the Los Angeles, Long Beach, and Inland Empire area. The effect on ozone concentrations in the atmosphere caused by the higher concentrations was measured using the Framework for 0D atmospheric modeling (F0AM). It was found that at its peak of 28 ppt, bromoform decreases ozone concentration by 0.14% at the altitude where the sample was taken. However, the potential impact in the stratosphere of Br radicals which come from Bromoform is expected to be higher due to its reaction rates with various molecules commonly found in the stratosphere. 

Maggie Rasic

Shifting Seas and Changing Chemistry: Gaseous Emissions in Upper Newport Bay 

Maggie Rasic, University of California, Los Angeles 

Coastal wetlands are ecologically rich environments that provide critical regulatory services, including carbon storage and nutrient cycling. However, these ecosystems are vulnerable to the impacts of sea level rise, which may alter biogeochemical cycles and enhance the production of trace gases. This study analyzed whole air samples collected across six sites spanning from San Diego Creek to Upper Newport Bay to investigate the spatial and temporal patterns of volatile organic compound (VOC) emissions at the study areas, with a focus on halomethanes and methane. Results showed increasing concentrations of halomethanes (specifically CHBr₃, CH₃Br, and CH₃Cl) as sample sites increase in proximity to the mouth of Newport Bay. Further research could indicate possible relationships between salinity, microbial activity, and halogenated compound production. Additionally, at the site closest to the ocean, a notably elevated concentration of methane was observed, a common byproduct of anaerobic microbial decomposition in wetlands. These findings suggest that sea level rise could intensify the production of both halomethanes and methane in coastal wetlands. Given their roles as potent greenhouse gases and, in the case of halomethanes, as stratospheric ozone-depleting substances, this emphasizes the importance of monitoring trace gas fluxes in dynamic coastal environments. 

Share

Details

Last Updated
Nov 19, 2025

💾

Whole Air Sampling Group Introduction | Faculty Mentor Don Blake, University of California, Irvine

SARP East 2025 Ecohydrology Group

9 min read

Preparations for Next Moonwalk Simulations Underway (and Underwater)

A group of eight people stand together inside a hangar with a somewhat shiny floor. In the background is a small white plane with a blue stripe, and large windows behind that.
The 2025 SARP East Ecohydrology Group poses in front of the Dynamic Aviation B-200 aircraft, parked in a hangar at NASA’s Wallops Flight Facility in Virgina. During the internship, students spend a week engaged in Earth science data collection and learning from instruments specialists while flying onboard both the B-200 and NASA’s P-3 aircraft.
NASA/Milan Loiacono

Faculty Advisor:

Dom Ciruzzi, William & Mary

Graduate Mentor:

Sarah Payne, University of California, Santa Barbara

Ecohydrology Group Introduction

Faculty Advisor Dom Ciruzzi and Graduate Mentor Sarah Payne

Ethan Bledsoe

Uncovering Hidden Green to Reveal Water: Can Spectral Unmixing of Vegetation Reduce Evapotranspiration Bias in Semi-Arid Landscapes? 

Ethan Bledsoe, Northwestern University 

Deserts push life to its limits, presenting sparse vegetation and scarce water that challenge traditional methods for accurately capturing evapotranspiration (ET). Current satellite ET estimates often struggle in dryland areas. These estimates typically rely on vegetation indices like the Normalized Difference Vegetation Index (NDVI), which can be distorted by bright desert soils and sparse vegetation. This distortion leads to inaccurate ET estimates, affecting crucial decisions related to drought management and water resource planning. To address this problem, we used a technique called Multiple Endmember Spectral Mixture Analysis (MESMA), which classifies pixels into percentages of green vegetation, soil, and shade based on unique spectral signatures. We created a spectral library using high-resolution (1 m) hyperspectral images collected from the NEON Airborne Observation Platform (AOP) over the Santa Rita Experimental Range (SRER). This library was then applied to imagery at different resolutions—medium-resolution (30 m) Landsat 8 Operational Land Imager (OLI) satellite imagery and lower-resolution (500 m) Moderate Resolution Imaging Spectroradiometer (MODIS) satellite imagery—to produce more accurate fractional vegetation maps. We integrated these detailed vegetation maps into OpenET’s Priestley-Taylor Jet Propulsion Laboratory (PT-JPL) ET model and compared the results to ground-based ET measurements from the SRER flux tower near Tucson, Arizona. On August 20, 2021, all models underestimated ET compared to flux tower observations. Among them, the standard PT-JPL model produced the closest estimate, while MESMA-based ET values were lower and generally declined further with decreasing spatial resolution. Because our method uses publicly available imagery and a remotely collected spectral library, it can be applied to other desert regions, enhancing our understanding of modeling ET and, in-turn, improving our water management in an increasingly arid world. 

Rylee Chafin 

Examining Changes in Vegetation Moisture Indices and Biodiversity Estimates at the San Clemente Dam Removal Site in California 

Rylee Chafin, University of North Georgia 

With dam removal becoming a more widespread practice, it is important to understand how riparian ecosystems respond to these hydrological changes. Airborne Visible Infrared Imaging Spectrometer (AVIRIS) flights over the San Clemente Dam near Carmel, California provide an ideal opportunity to understand changes in hydrology and biodiversity across an entire watershed, rather than at small vegetation plots. This case study investigates the only large dam in the nation that has had sufficient AVIRIS data to understand these changes. This study processed AVIRIS data from August 2015 and October 2019 and examined how the Normalized Difference Moisture Index (NDMI) changes between the two flights. This data was then compared with two stream gauges located downstream of the dam to better understand the hydrology of this watershed and the effects of dam removal on streamflow. Then, I used the AVIRIS data to create estimated alpha diversity maps using the biodivMapR R package. This study found that NDMI and alpha diversity estimates were correlated in the riparian area. This indicates that moisture and plant biodiversity have changed across the riparian ecosystem, possibly as a result of dam removal, and helps us understand the ecological implications of this practice. Future AVIRIS (or other hyperspectral) flights over other dam removal sites can help expand this research to evaluate the effectiveness of these methods and better establish correlation between dam removal, moisture, and biodiversity. 

Sumaya Tandon

Tracking Tree Emissions from the Sky: Improving Isoprene Estimates with MEGAN 

Sumaya Tandon, Trinity University 

Isoprene, a biogenic volatile organic compound, is emitted from tree species and contributes to the formation of secondary pollutants such as formaldehyde and ozone. With its short atmospheric life span of up to an hour and complex emissions dynamics, it is hard to quantify, and therefore predict, how much of it is in the atmosphere. This study employs the Model of Emissions of Gases and Aerosols from Nature (MEGAN) to estimate isoprene emissions in California and Missouri, two regions with contrasting vegetation types, during the summer of 2013. The predictions were compared to airborne data, specifically whole air sampling, from the flight campaign SEAC4RS to evaluate MEGAN’s accuracy. Specifically, to parameterize MEGAN this study utilizes the North American Data Assimilation System (NDLAS) to compile a list of meteorological and surface variables. Two different models were run, one with consideration of drought stress and one without, to evaluate the impact of water stress on modeled isoprene emissions. The results of this study show MEGAN consistently underpredicted isoprene in both regions with and without water stress consideration. However, including drought stress can potentially improve predictions for areas with very low-emissions suggesting that accounting for water stress may improve MEGAN. With these findings in mind, it’s beneficial to integrate ecohydrological understanding into emissions models. Isoprene emissions from airborne data has rarely been used in the context of studying drought with MEGAN, therefore this work highlights the importance of understanding and refining stress response parameters- a crucial step towards improving predictions of biogenic emissions for future climate scenarios. 

TJ Ochoa Peterson

Understanding the Relationship Between Cloud Type and Evapotranspiration in Shrubland Vegetation 

TJ Ochoa Peterson, Michigan State University 

Evapotranspiration (ET) is a key indicator of ecosystem health, representing water flux from the surface to the atmosphere. High ET values can result, in-part, from water-intensive vegetation while the inverse can indicate insufficient water for evaporation. A persistent challenge in remote sensing ET is cloud contamination. Thermal infrared sensors used to derive remote sensed ET apply cloud masking which removes affected pixels and results in data gaps. Although prior studies have examined the impact of cloud amount on ET, the influence of specific cloud types remains underexplored. This study investigates how distinct cloud types (Cumulus, Altostratus, and Cumulonimbus) affect surface-level ET over shrubland vegetation in Tucson, Arizona, during the North American Monsoon season. Cloud classification was performed using Cloud Optical Depth (COD) and Cloud Top Pressure (CTP) from GOES-18 Level 2 products, following criteria from the International Satellite Cloud Climatology Project (ISCCP) dataset. These classifications were compared against in-situ ET observations from the Santa Rita Experimental Range NEON flux tower. Results indicate that cloud presence generally reduces instantaneous ET relative to preceding clear-sky conditions. Clouds with low altitude and low density (Cumulus, Stratocumulus) generally showed brief reductions in ET. Notable results include ET values observed under high COD and low CTP conditions, characteristic of Cumulonimbus clouds, did not differ significantly from clear-sky conditions. Future research should incorporate cloud-type into ET models to improve accuracy, particularly in regions prone to frequent cloud cover. Further work could deduce cloud-type patterns for the intent of data gap filling models that estimate ET during cloud-contaminated periods, reducing data loss and enhancing understanding of land-atmosphere interactions. 

Rachel Faessler

Comparing Tree Biodiversity in San Jose, California Using Hyperspectral Imagery and Ground Data 

Rachel Faessler, University of Wisconsin-Green Bay 

Street trees provide a myriad of ecosystem services, such as cooling air temperature, improving air quality, reducing runoff, and improving human well-being. Furthermore, having many different species of trees (high biodiversity) is important, as this improves the overall resilience of a forest community to disturbances, which increases reliable access to ecosystem services. Airborne hyperspectral data is often used to measure biodiversity or health of trees in natural forests, but rarely in urban environments. When urban ecosystems are studied, the focus is on interactions with humans or the local effects of vegetation. Uniquely, this study seeks to compare indicators of alpha and beta diversity compiled from Airborne Visible/Infrared Imaging Spectrometer (AVIRIS) hyperspectral imagery (collected in 2024) and Dryad ground-based sampling of 264,000 street trees in San Jose, California (collected in 2021). There appears to be more spatial variability in the AVIRIS estimated beta diversity than in alpha diversity. There is a modest correlation between ground and AVIRIS derived measures of alpha diversity, which is a step forward in expanding estimates of tree biodiversity in cities using hyperspectral imagery. Future work could connect spatial variation of biodiversity to city planning measures such as income, residential/business areas, income, or redlining; compare hyperspectral diversity to areas of alpha diversity with consistent sampling; or build on different measures of diversity than species diversity (e.g. isohydricity). 

Katie Wilson

How Does Antecedent Soil Moisture Influence Flooding in the Southeastern U.S.? A Case Study in Athens, Georgia 

Katie Wilson, North Carolina State University 

Floods are the most common and deadly natural disaster in the United States, known for their rapid and widespread impacts. While previous research has examined how antecedent soil moisture (ASM) affects flood severity, relatively little work has focused on the Southeastern United States. This region is especially vulnerable due to high annual rainfall and tropical systems, both of which can lead to flooding. To address this gap, this study investigates the relationship between ASM and streamflow response during rainfall events in Athens, Georgia, located within the South Atlantic-Gulf watershed. Precipitation datasets (1977–2025) were compiled from three NOAA National Centers for Environmental Information weather stations in Athens. Streamflow data was obtained from the USGS Apalachee River near Bostwick, GA (1977–2025). ASM data was gathered from the Soil Climate Analysis Network (SCAN) Watkinsville station (1997–2025) and NASA’s Soil Moisture Active Passive (SMAP) satellite (2015–2025). Precipitation events were binned by total rainfall, with maximum streamflow recorded during the event and ASM taken from the day prior. Events were grouped into four rainfall categories (0–1″, 1–2″, 3–4″, and 5–6″), and streamflow responses were compared between low (0-40%) and high (60-100%) ASM conditions using the Kruskal-Wallis H test. Results showed statistically significant differences (p < 0.05) in streamflow dependent on ASM across all rainfall bins, confirming that wetter antecedent conditions increase runoff and flood potential. Incorporating ASM into flood forecasting models, along with tools like SMAP, can improve early warning systems in the Southeast U.S. and enhance flood preparedness. 

Share

Details

Last Updated
Nov 19, 2025

💾

Ecohydrology Introduction | Faculty Mentor Dom Ciruzzi, College of William &amp; Mary and Graduate Sarah Payne, University of California, Santa Barbara

NASA, European Partners Set to Launch Sentinel-6B Earth Satellite

By: scarney1

5 min read

Preparations for Next Moonwalk Simulations Underway (and Underwater)

A wide-angle, distant photo of a white rocket on the launch pad, brightly lit, with a black night sky behind it.
Set to launch no earlier than Nov. 16, Sentinel-6B will continue the data record now being collected by its twin satellite Sentinel-6 Michael Freilich, which lifted off from Vandenberg Space Force Base in November 2020 aboard the SpaceX Falcon 9 rocket shown here.
SpaceX

Set to track sea levels across more than 90% of Earth’s ocean, the mission must first get into orbit. Here’s what to expect.  

Sentinel-6B, an ocean-tracking satellite jointly developed by NASA and ESA (European Space Agency), is ready to roll out to the launch pad, packed into the payload fairing of a SpaceX Falcon 9 rocket.   

Launch is targeted at 12:21 a.m. EST, Monday, Nov. 17 (9:21 p.m. PST, Sunday, Nov. 16). Once it lifts off from Vandenberg Space Force Base in California, the satellite will ride out a 57-minute sequence of events ending in spacecraft separation, when the satellite detaches from the rocket.  

Then Sentinel-6B’s real work begins. Orbiting Earth every 112 minutes at 4.5 miles (7.2 kilometers) per second, the satellite will eventually take over for its twin, Sentinel-6 Michael Freilich, launched five years ago, to continue a multidecade dataset for sea level measurements from space. Those measurements, along with atmospheric data the mission gathers, will help improve public safety and city planning while protecting coastal infrastructure, including power plants and defense interests. NASA will also use the data to refine atmospheric models that support the safe re-entry of Artemis astronauts.  

Here’s a closer look at what lies ahead for the satellite in the coming days.

Launch timeline 

Measuring 19.1 feet (5.82 meters) long and 7.74 feet (2.36 meters) high (including the communications antennas), the satellite weighs in at around 2,600 pounds (1,200 kilograms) when loaded with propellant at launch. 

The satellite will lift off from Space Launch Complex 4 East at Vandenberg. If needed, backup launch opportunities are available on subsequent days, with the 20-second launch window occurring about 12 to 13 minutes earlier each day.  

A little more than two minutes after the Falcon 9 rocket lifts off, the main engine cuts off. Shortly after, the rocket’s first and second stages separate, followed by second-stage engine start. The reusable Falcon 9 first stage then begins its automated boost-back burn to the launch site for a powered landing. About three minutes after launch, the two halves of the payload fairing, which protected the satellite as it traveled through the atmosphere, separate and fall safely back to Earth.  

The first cutoff of the second stage engine takes place approximately eight minutes after liftoff, at which point the launch vehicle and the spacecraft will be in a temporary “parking” orbit. The second stage engine fires a second time about 44 minutes later, and about 57 minutes after liftoff, the rocket and the spacecraft separate. Roughly seven minutes after that, the satellite’s solar panels deploy. Sentinel-6B is expected to make first contact with ground controllers about 35 minutes after separation (roughly an hour and a half after liftoff) — a major milestone indicating that the spacecraft is healthy. 

Science mission 

Following launch operations, the team will focus on its next challenge: getting the spacecraft ready for science operations. Once in orbit, Sentinel-6B will fly about 30 seconds behind its twin, the Sentinel-6 Michael Freilich satellite. When scientists and engineers have completed cross-calibrating the data collected by the two spacecraft, Sentinel-6B will take over the role of providing primary sea level measurements while Sentinel-6 Michael Freilich will move into a different orbit. From there, researchers plan to use measurements from Sentinel-6 Michael Freilich for different purposes, including helping to map seafloor features (variations in sea surface height can reveal variations in ocean floor features, such as seamounts). 

Sentinel-6B is part of a U.S.-European mission that will continue 30-year-plus record of sea-level measurements. Its observations will help build an accurate picture of local and global sea surface heights to support storm forecasting, secure coastal infrastructure, and help optimize commercial activities, such as shipping.
NASA/JPL-Caltech

Where to find launch coverage 

Launch day coverage of the mission will be available on the agency’s website, including links to live streaming and blog updates beginning no earlier than 11 p.m. EST, Nov. 16, as the countdown milestones occur. Streaming video and photos of the launch will be accessible on demand shortly after liftoff. Follow countdown coverage on NASA’s Sentinel-6B blog.  

For more information about NASA’s live programming schedule, visit 
plus.nasa.gov/scheduled-events

More about Sentinel-6B

The Copernicus Sentinel-6/Jason-CS (Continuity of Service) mission is a collaboration between NASA, ESA, EUMETSAT (European Organisation for the Exploitation of Meteorological Satellites), and the National Oceanic and Atmospheric Administration (NOAA). The European Commission contributed funding support while France’s space agency CNES (Centre National d’Études Spatiales) provided technical expertise. The mission also marks the first international involvement in Copernicus, the European Union’s Earth Observation Programme.  

A division of Caltech in Pasadena, JPL built three science instruments for each Sentinel-6 satellite: the Advanced Microwave Radiometer, the Global Navigation Satellite System – Radio Occultation, and the Laser Retroreflector Array. NASA is also contributing launch services, ground systems supporting operation of the NASA science instruments, the science data processors for two of these instruments, and support for the U.S. members of the international Ocean Surface Topography and Sentinel-6 science teams. The launch service is managed by NASA’s Launch Services Program, based at the agency’s Kennedy Space Center in Florida.

News Media Contacts

Elizabeth Vlock
NASA Headquarters, Washington
202-358-1600
elizabeth.a.vlock@nasa.gov

Andrew Wang / Andrew Good
Jet Propulsion Laboratory, Pasadena, Calif.
626-379-6874 / 626-840-4291
andrew.wang@jpl.nasa.gov / andrew.c.good@jpl.nasa.gov

2025-125

💾

NASA and its U.S. and international partners have teamed up to launch a new Earth-observing satellite called Sentinel-6B that will measure sea surface height...

6 Things to Know From NASA About New US, European Sea Satellite

By: scarney1

6 min read

Preparations for Next Moonwalk Simulations Underway (and Underwater)

Set to launch no earlier than Nov. 16, Sentinel-6B will continue a decades-long data record of sea level measurement that will help decision-makers manage coastal flooding, support hurricane intensity forecasts, and assist in the return of astronauts from space.
NASA

Data from Sentinel-6B will continue a decades-long record of sea surface height, helping to improve coastal planning, protect critical infrastructure, and advance weather forecasts.

With launch set for no earlier than 12:21 a.m. EST Monday, Nov. 17, Sentinel-6B is the latest satellite in a series of spacecraft NASA and its partners have used to measure sea levels since 1992. Their data has helped meteorologists improve hurricane forecasts, managers protect infrastructure, and coastal communities plan. 

After launch, Sentinel-6B will begin the process of data cross-calibration with its predecessor, Sentinel-6 Michael Freilich, to provide essential information about Earth’s ocean. 

Sentinel-6B is the second of two satellites that constitute the Sentinel-6/Jason-CS (Continuity of Service) mission, a collaboration between NASA, ESA (European Space Agency), EUMETSAT (European Organisation for the Exploitation of Meteorological Satellites), and the National Oceanic and Atmospheric Administration (NOAA). The European Commission contributed funding support while France’s space agency CNES (Centre National d’Études Spatiales) provided technical expertise.

Here are six things to know about Sentinel-6B and the broader Copernicus Sentinel-6/Jason-CS mission: 

1. Sentinel-6B will deliver data on about 90% of Earth’s ocean, providing direct benefits to humanity.

Sentinel-6B will contribute to a multidecade dataset for sea level measurements from space. This data is key to helping improve public safety, city planning, and protecting commercial and defense interests. 

Pioneered by NASA and its partners, the dataset enables users in government, industry, and the research community to better understand how sea levels change over time. Combined with information from other NASA satellites, data from Copernicus Sentinel-6/Jason-CS is vital for tracking how heat and energy move through Earth’s seas and atmosphere, as well as for monitoring ocean features such as currents and eddies. The measurements come courtesy of a radar altimeter that measures sea levels for nearly all of Earth’s ocean, providing information on large-scale currents that can aid in commercial and naval navigation, search and rescue, and the tracking of debris and pollutants from disasters at sea.

Sentinel-6B is part of a U.S.-European mission that will continue 30-year-plus record of sea-level measurements. Its observations will help build an accurate picture of local and global sea surface heights to support storm forecasting, secure coastal infrastructure, and help optimize commercial activities, such as shipping.
Credit: NASA/JPL-Caltech

2. Data from the Copernicus Sentinel-6/Jason-CS mission helps NASA prepare for the next phase of space exploration.

The better we understand Earth, the better NASA can carry out its mission to explore the universe. Data from the Copernicus Sentinel-6/Jason-CS mission is used to refine the Goddard Earth Observing System atmospheric forecast models, which the NASA Engineering Safety Center uses to plan safer reentry of astronauts returning from Artemis missions.

Additionally, changes to Earth’s ocean, observed by satellites, can have measurable effects beyond our planet. For instance, while the Moon influences ocean tides on Earth, changes in those tides can also exert a small influence on the Moon. Data from Copernicus Sentinel-6/Jason-CS can help improve understanding of this relationship, knowledge that can contribute to future lunar exploration missions.

3. The Copernicus Sentinel-6/Jason-CS mission helps the U.S. respond to challenges by putting actionable information into the hands of decision-makers.

Data collected by the mission helps city planners, as well as local and state governments, to make informed decisions on protecting coastal infrastructure, real estate, and energy facilities. The mission’s sea level data also improves meteorologists’ weather predictions, which are critical to commercial and recreational navigation. By enhancing weather prediction models, data provided by Copernicus Sentinel-6/Jason-CS improves forecasts of hurricane development, including the likelihood of storm intensification, which can aid disaster preparedness and response.

4. Data from Sentinel-6B will support national security efforts.

The ocean and atmosphere measurements from Sentinel-6B will enable decision-makers to better protect coastal military installations from such events as nuisance flooding while aiding national defense efforts by providing crucial information about weather and ocean conditions. The satellite will do so by feeding near-real time data on Earth’s atmosphere and seas to forward-looking weather and ocean models. Since the measurements are part of a long-term dataset, they also can add historical context that puts the new data in perspective.

5. The Copernicus Sentinel-6/Jason-CS mission’s direct observation of sea levels delivers information critical to protecting coastlines, where nearly half of the world’s population lives.

Sea level rise varies from one area to another, meaning that some coastlines are more vulnerable than others to flooding, erosion, and saltwater contamination of underground freshwater supplies, the latter of which threatens farmland and drinking water. Sea level measurements from Sentinel-6 Michael Freilich, and soon, Sentinel-6B, form the basis of U.S. flood predictions for coastal infrastructure, real estate, energy storage sites, and other coastal assets. Knowing which regions are more vulnerable to these risks will enable U.S. industries and emergency managers to make better-informed decisions about transportation and commercial infrastructure, land-use planning, water management, and adaptation strategies.

6. The international collaboration behind the mission enables the pooling of capabilities, resources, and expertise.

The multidecadal dataset that this mission supports is the result of years of close work between NASA and several collaborators, including NASA, ESA, EUMETSAT, CNES, and NOAA. By pooling expertise and resources, this partnership has delivered cost-effective solutions that have made precise, high-impact data available to industry and government agencies alike.

More about Sentinel-6B

Copernicus Sentinel-6/Jason-CS was jointly developed by ESA, EUMETSAT, NASA, and NOAA, with funding support from the European Commission and technical support from CNES. The mission also marks the first international involvement in Copernicus, the European Union’s Earth Observation Programme. 

Managed for NASA by Caltech in Pasadena, JPL contributed three science instruments for each Sentinel-6 satellite: the Advanced Microwave Radiometer, the Global Navigation Satellite System – Radio Occultation, and the laser retroreflector array. NASA is also contributing launch services, ground systems supporting operation of the NASA science instruments, the science data processors for two of these instruments, and support for the international ocean surface topography community. 

For more about Sentinel-6B, visit:

https://science.nasa.gov/mission/sentinel-6B

News Media Contacts

Elizabeth Vlock
NASA Headquarters, Washington
202-358-1600
elizabeth.a.vlock@nasa.gov

Andrew Wang / Andrew Good
Jet Propulsion Laboratory, Pasadena, Calif.
626-379-6874 / 626-840-4291
andrew.wang@jpl.nasa.gov / andrew.c.good@jpl.nasa.gov

2025-124

💾

NASA and its U.S. and international partners have teamed up to launch a new Earth-observing satellite called Sentinel-6B that will measure sea surface height...

NASA Sets Launch Coverage for International Ocean Tracking Mission

In this artist’s concept, the ocean-observing satellite Sentinel-6B orbits Earth with its deployable solar panels extended.
Credit: NASA/JPL-Caltech

NASA will provide live coverage of prelaunch and launch activities for Sentinel-6B, an international mission delivering critical sea level and ocean data to protect coastal infrastructure, improve weather forecasting, and support commercial activities at sea.

Launch is targeted at 12:21 a.m. EST, Monday, Nov. 17 (9:21 p.m. PST, Sunday, Nov. 16) aboard a SpaceX Falcon 9 rocket from Space Launch Complex 4 East at Vandenberg Space Force Base in California.

Watch coverage beginning at 11:30 p.m. EST (8:30 p.m. PST) on NASA+, Amazon Prime, and more. Learn how to watch NASA content through a variety of platforms, including social media.

The Sentinel-6B mission continues a decades-long effort to monitor global sea level and ocean conditions using precise radar measurements from space. Since the early 1990s, satellites launched by NASA and domestic and international partners have collected precise sea level data. The launch of Sentinel-6B will extend this dataset out to nearly four decades.

NASA’s mission coverage is as follows (all times Eastern and subject to change based on real-time operations):

Saturday, Nov. 15

4 p.m. – NASA Prelaunch Teleconference on International Ocean Tracking Mission

  • Karen St. Germain, director, Earth Science Division, NASA Headquarters in Washington
  • Pierrik Veuilleumier, Sentinel-6B project manager, ESA (European Space Agency)
  • Parag Vaze, Sentinel-6B project manager, NASA’s Jet Propulsion Laboratory in Pasadena, California
  • Tim Dunn, senior launch director, Launch Services Program, NASA’s Kennedy Space Center in Florida
  • Julianna Scheiman, director, NASA Science Missions, SpaceX
  • 1st Lt. William Harbin, launch weather officer, U.S. Air Force

Audio of the teleconference will stream on the NASA Video YouTube channel.  

Media interested in participating by phone must RSVP no later than two hours prior to the start of the call at: ksc-newsroom@mail.nasa.gov. A copy of NASA’s media accreditation policy is online.

Sunday Nov. 16

11:30 p.m. – Launch coverage begins on NASA+, Amazon Prime, and more.

Audio-only coverage

Audio-only of the launch coverage will be carried on the NASA “V” circuits, which may be accessed by dialing 321-867-1220 or -1240. On launch day, “mission audio” countdown activities without NASA+ launch commentary will be carried at 321-867-7135.

NASA website launch coverage

Launch day coverage of the mission will be available on the agency’s website. Coverage will include links to live streaming and blog updates beginning no earlier than 11 p.m. EST, Nov. 16, as the countdown milestones occur. Streaming video and photos of the launch will be accessible on demand shortly after liftoff. Follow countdown coverage on NASA’s Sentinel-6/Jason-CS blog.

For questions about countdown coverage, contact the NASA Kennedy newsroom at: 321-867-2468.

Attend launch virtually

Members of the public can register to attend this launch virtually. NASA’s virtual guest program for this mission includes curated launch resources, notifications about related opportunities or changes, and a stamp for the NASA virtual guest passport following launch.

Watch, engage on social media

Let people know you’re watching the mission on X, Facebook, and Instagram by following and tagging these accounts:

X: @NASA, @NASAKennedy, @NASAJPL, @NASAEarth

Facebook: NASA, NASA Kennedy, NASA JPL, NASA Earth

Instagram: @NASA, @NASAKennedy, @NASAJPL, @NASAEarth

Sentinel-6B is the second of twin satellites in the Copernicus Sentinel-6/Jason-CS (Continuity of Service) mission, a collaboration among NASA, ESA, EUMETSAT (European Organisation for the Exploitation of Meteorological Satellites), and the National Oceanic and Atmospheric Administration (NOAA). The first satellite in the mission, Sentinel-6 Michael Freilich, launched in November 2020. The European Commission contributed funding support, while France’s space agency CNES (Centre National d’Études Spatiales) provided technical expertise. The mission also marks the first international involvement in Copernicus, the European Union’s Earth Observation Programme.

For more information about these missions, visit:

https://science.nasa.gov/mission/sentinel-6b/

-end-

Elizabeth Vlock
NASA Headquarters, Washington
202-358-1600
elizabeth.a.vlock@nasa.gov

Leejay Lockhart
Kennedy Space Center, Fla.
321-747-8310
leejay.lockhart@nasa.gov

Andrew Wang / Andrew Good
Jet Propulsion Laboratory, Pasadena, Calif.
626-379-6874 / 818-393-2433
andrew.wang@jpl.nasa.gov / andrew.c.good@jpl.nasa.gov

❌