Reading view

There are new articles available, click to refresh the page.

Bitcoin Structure Tightens: One Break Above This Zone Could Ignite A Run To $107,000

Bitcoin finds itself at a critical crossroads, hovering between two major price zones that could define its next big move. Buyers and sellers are locked in a tight battle, and the market now waits for a decisive break. A push above key resistance could open the door to $107,000, while weakness at support risks a deeper slide toward $71,000.

Bounce Scenario: A Return Toward The Pink Box And Descending Trendline

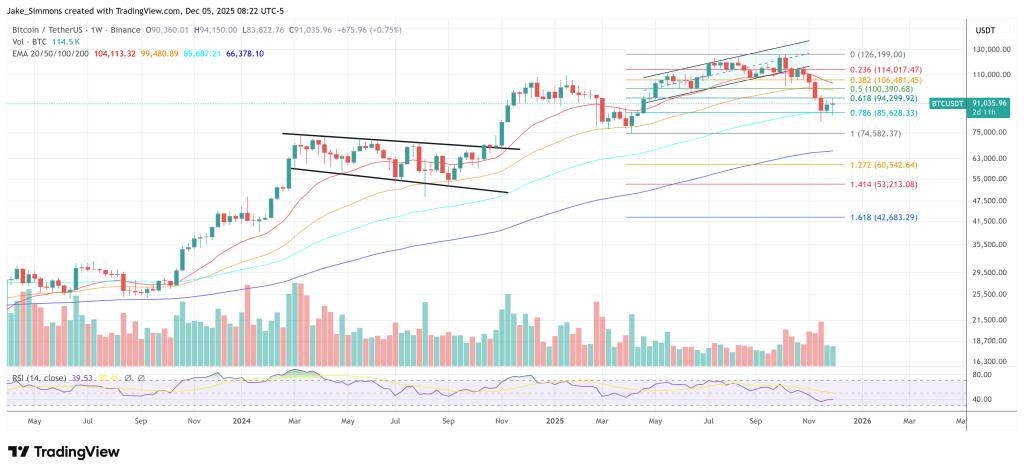
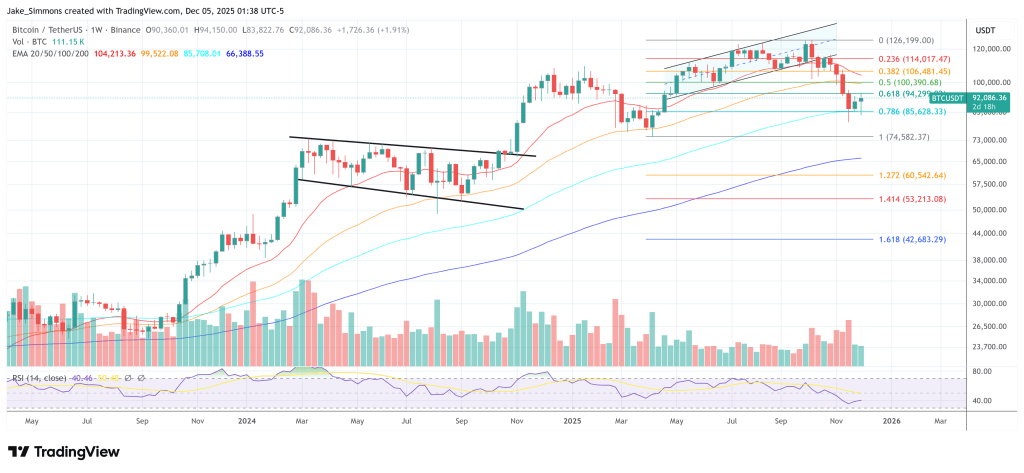
Kamile Uray, in her latest update on Bitcoin, noted that BTC failed to hold above the $90,720 level on the hourly chart, triggering the expected decline. The first immediate support now sits at $87,644, while the deeper support range lies between $83,822 and $82,477. If buyers defend this zone successfully, Bitcoin could attempt another climb toward the pink box region and retest the descending trendline overhead.

Uray explained that a sustained move above the pink box resistance on the daily timeframe would open the door for Bitcoin to challenge the descending blue trendline. A confirmed breakout from this area could strengthen bullish momentum, pushing the price toward the next major resistance levels at $98,200 and $107,500. A break above $107,500 alongside the descending trendline would serve as a strong signal that the broader uptrend is ready to continue.

Bitcoin

However, she warned that a daily close below $82,477 would shift the market structure toward further weakness, placing Bitcoin at risk of revisiting lower levels. Even so, Uray highlighted one critical area of strength: the $74,496–$71,237 zone. This region represents the key breakout top from November 2024 and is considered a strong historical support. In this area, buyers may step in aggressively, potentially setting the stage for an upward reversal.

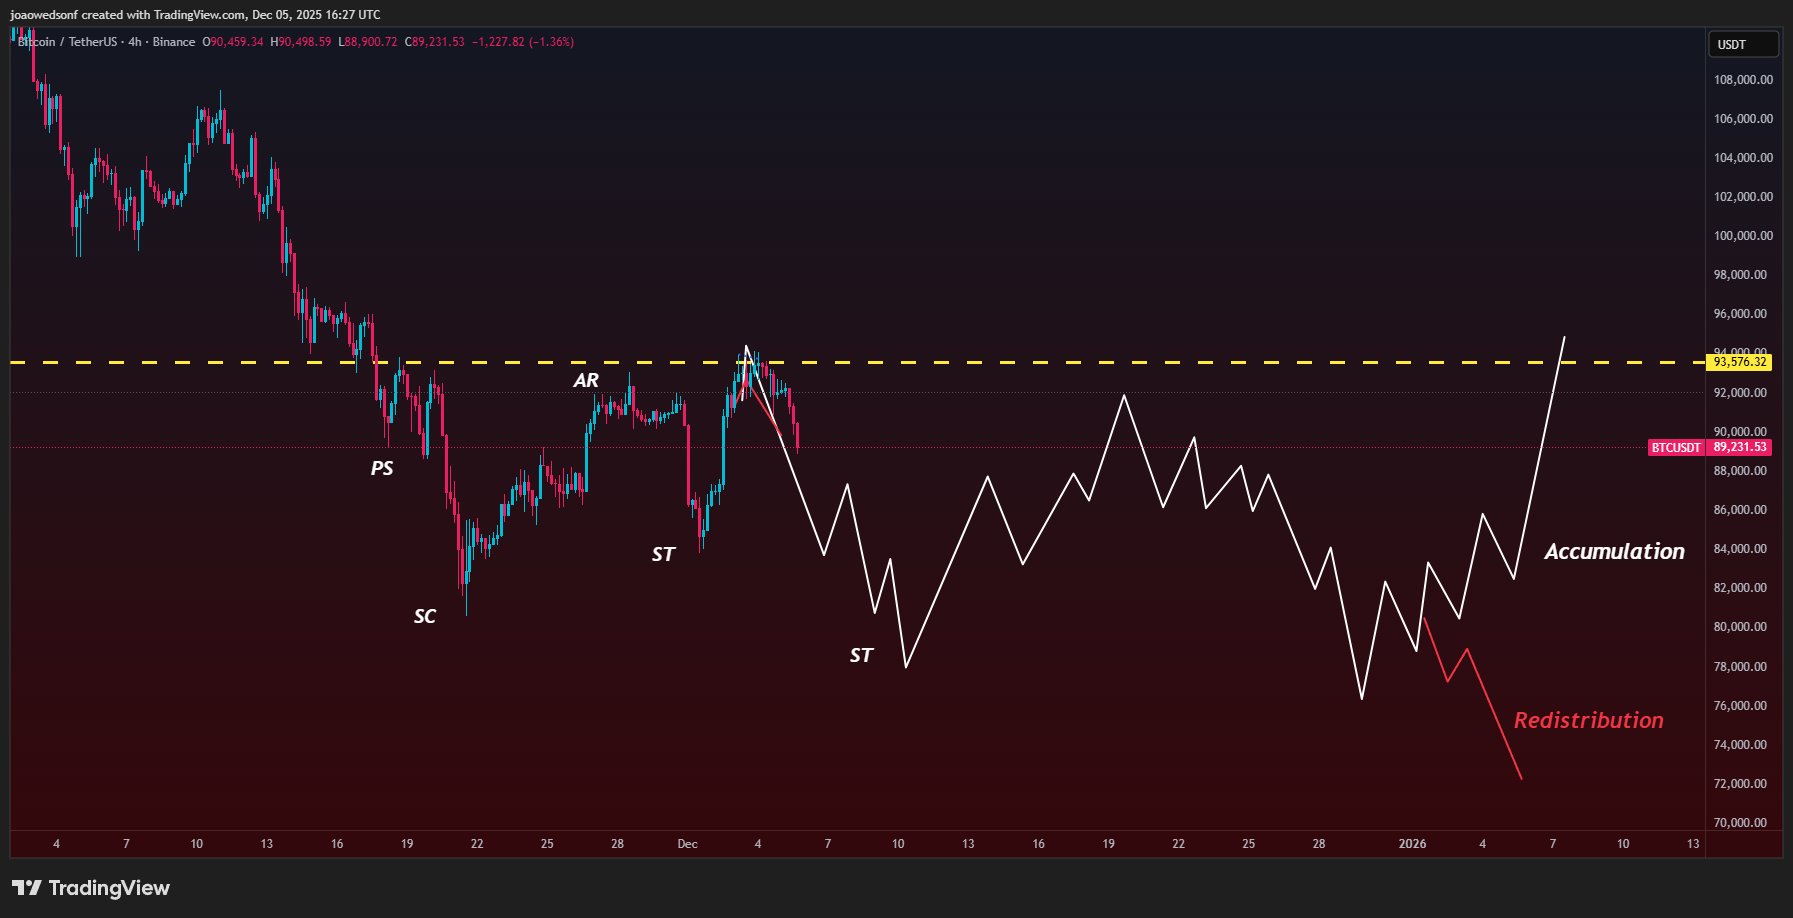
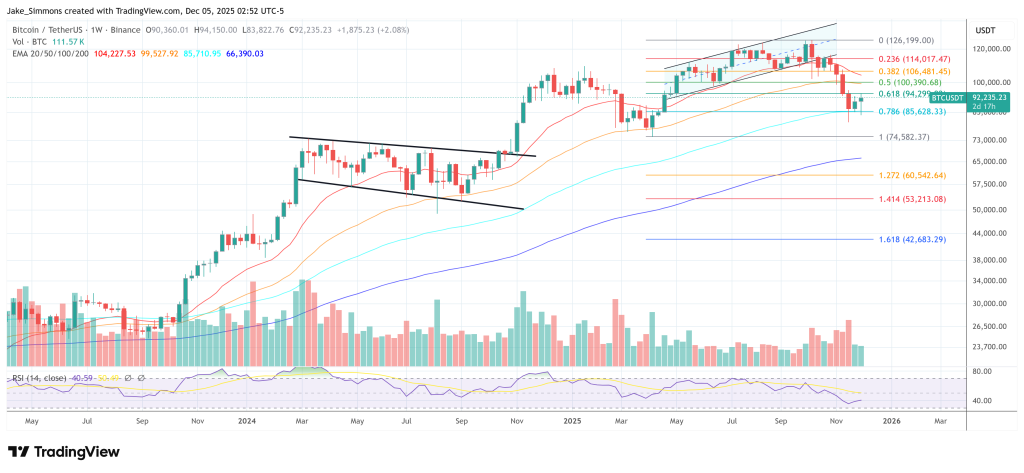
Bitcoin Price Rejection At $93,000–$95,000 Zone

According to Crypto Candy, Bitcoin’s latest price action has been unfolding precisely in line with expectations. After facing rejection in the $93,000–$95,000 resistance zone, BTC dipped sharply and nearly touched the anticipated support range at $86,000–$87,500. This move reflects the broader market’s reaction to heavy selling pressure near the upper resistance band.

Crypto Candy emphasized that the $86,000–$87,500 zone now serves as a crucial pivot area. If buyers successfully defend this support and the price stabilizes above it, Bitcoin could once again revisit the $93,000–$95,000 range, or even push beyond it.

Such a rebound would signal renewed bullish momentum and set the stage for another attempt at breaking higher resistance levels. However, the analyst also warned that failure to hold the $86,000–$87,500 support could trigger deeper downside movement. If the level gives way, Bitcoin may slide to lower price zones in the coming days as bearish pressure strengthens.

Bitcoin

Bitcoin ETF, Treasury Firms Might Have Stopped Buying — But How Much Have They Offloaded?

The Bitcoin market structure is believed to have undergone a massive shift since the significant price downturn seen on October 10, 2025. While the premier cryptocurrency has been on something resembling a recovery path since the market bloodbath, some sectors believe that the bear season has already kicked off.

With BTC sitting beneath its opening price of 2025, it is becoming increasingly difficult to make a bullish case for the world’s largest cryptocurrency. Moreover, an interesting data point about a relevant class of Bitcoin investors has emerged, further adding credence to the beginning of a possible bear market. 

Are Bitcoin Treasury Firms Offloading Their Coins?

In a new post on X, CryptoQuant’s Head of Research, Julio Moreno, shared an on-chain insight to support the hypothesis that the Bitcoin bear market has started. This conclusion is based on the Balance Growth of an investor group known as the “dolphins.”

Dolphins refer to a group of crypto investors holding substantial amounts of a coin, placing them between small investors (shrimps) and the largest investors (whales). Specifically, Moreno described dolphins as wallet addresses with significant BTC holdings between 100 – 1,000 coins. 

According to the latest data from CryptoQuant, the growth in the Dolphins’ BTC holdings has slowed down in the past year and appears to be in a downward trend. Moreno believes that this negative change points to the emergence of a Bitcoin bear market.

Bitcoin

Moreno revealed that these Dolphin addresses had increased year-over-year by roughly 965,000 BTC when the BTC price hit its current all-time high around $125,000. Now that the BTC price is nearly 30% below its record high, the Bitcoin Dolphins’ balance stands at around 694,000 coins.

Moreno wrote on X:

This address cohort includes ETFs and Treasury companies, which have also stopped buying.

More interestingly, the CryptoQuant Head of Research revealed that this investor group consists of ETF issuers and Treasury companies, which have stopped purchasing Bitcoin. According to data from SoSoValue, the US-based Bitcoin exchange-traded funds have posted net outflows in five out of the last six weeks.

Meanwhile, BTC and crypto treasury companies have struggled in the past few months, with retail investors losing tens of billions to the hype. While there have been rarely reports of crypto treasury sell-offs, this decline in these Dolphins’ holdings tells an entirely different story.

Bitcoin Price At A Glance

As of this writing, the price of BTC stands at around $89,151, reflecting an over 3% decline in the past 24 hours.

Bitcoin

Bitcoin Price Falls Below $90,000 — Is The Recovery Over?

The Bitcoin price has had a mixed performance over the past week, with both sides of the market divide struggling to establish dominance. In the latest battle between the bulls and bears, the premier cryptocurrency appears to be succumbing to pressure from the latter group.

As this weekend approached, the Bitcoin price retreated from its latest local high of around $94,000 to beneath the psychological $90,000 level. This latest correction has prompted questions in the crowd, with investors wondering whether it is just a brief obstacle or the end of the recovery.

Why $80,500 Could Be The Next Local Low For BTC

In a December 5 post on the social media platform X, Alphractal CEO and founder shared insight into the latest Bitcoin price decline below $90,000. The on-chain expert revealed that losing the $89,800 level is the more relevant occurrence in the latest price downturn.

In a previous post on X, Wedson evaluated the likely trajectory of the Bitcoin price should it lose the $89,800 level. The crypto pundit revealed that losing this price mark could lead to an accumulation pattern for the bulls or a redistribution phase for the bears.

While the accumulation period for the bulls would initially coincide with lower prices, it eventually leads to a Bitcoin price return to above the latest local high. Meanwhile, a redistribution phase could see the bears push the flagship cryptocurrency to around the $70,000 mark.

Bitcoin price

According to the Alphractal CEO, the price of BTC also failed to hold the key on-chain levels, strengthening the probability of a broader price sideways phase. “Sideways action is the cause — the big pumps or dumps are just the effect,” Wedson had earlier stated in his previous X post.

Furthermore, Wedson noted that the next level to watch is $86,500, which, if lost, opens the very high possibility for the formation of a new local low around $80,500. This local low could provide a perfect spot for investors to buy the dip and enter the market.

Bitcoin Price Overview 

As mentioned earlier, the past week has been one of highs and lows for the premier cryptocurrency, plummeting to as low as $84,600 on Monday, December 1. After a shaky start to the month, the Bitcoin price recovered strongly to around $94,000 on Thursday, December 4.

As of this writing, the market leader is valued at around $89,415, reflecting an over 3% price decline in the past 24 hours. According to data from CoinGecko, the price of Bitcoin has been down by nearly 10% in the past year.

Bitcoin price

Bitcoin Bull Run Set To Last Until 2027, Analysts Highlight Influential Factors

Many in the crypto space have echoed a familiar sentiment over recent months: “The four-year crypto market cycle is dead.” Experts from the Bull Theory assert that while the four-year cycle may have come to an end, the Bitcoin bull run itself is merely delayed and could stretch until 2027.

Why The Four-Year Cycle May Be Ending

In a recent post on social media platform X, formerly known as Twitter, the Bull Theory analysts noted that the concept of Bitcoin adhering to a neat four-year cycle is weakening. 

They highlighted that significant price movements over the last decade weren’t solely driven by Halving events; rather, they were influenced by shifts in global liquidity. 

The analysts pointed to the current landscape of stablecoin liquidity, which remains high despite recent downturns, indicating that larger investors are still engaged in the market, poised to invest when appropriate macroeconomic conditions arise.

In the US, Treasury policies are emerging as pivotal catalysts. The recent buybacks are notable, but the analysts emphasize that the larger narrative lies in the Treasury General Account (TGA) balance, which is currently around $940 billion—almost $90 billion above its normal range. 

This surplus cash is likely to flow back into the financial system, enhancing financing conditions and adding liquidity that typically gravitates toward risk assets.

Globally, the trends appear even more promising. China has been injecting liquidity for several months, while Japan recently announced a stimulus package worth approximately $135 billion, alongside efforts to simplify cryptocurrency regulations. 

Canada is also moving toward easing its monetary policy, and the US Federal Reserve (Fed) has officially halted its quantitative tightening (QT) measures—a historical precursor to some form of liquidity expansion.

Political And Monetary Factors Align To Create Bullish Condition

The analysts explained that when major economies adopt expansive monetary policies simultaneously, risk assets like Bitcoin tend to respond more rapidly than traditional stocks or broader markets. 

Additionally, potential policy tools, such as the Supplementary Leverage Ratio (SLR) exemption—implemented in 2020 to allow banks more flexibility in expanding their balance sheets—could return, resulting in increased credit creation and overall market liquidity.

There is also a political dimension to consider. President Trump has discussed potential tax reforms, including abolishing income tax and distributing $2,000 tariff dividends. 

Furthermore, the likelihood of a new Federal Reserve chair who supports liquidity assistance and is constructive toward cryptocurrency could bolster conditions for economic growth.

Extended Bitcoin Uptrend

Historically, whenever the Institute for Supply Management’s Purchasing Managers’ Index (ISM PMI) surpasses 55, it has been followed by periods of altcoin season. The probability of this occurring in 2026 appears high, according to the Bull Theory.

The convergence of rising stablecoin liquidity, the Treasury’s injection of cash back into markets, global quantitative easing, the cessation of QT in the US, potential bank-lending relief, pro-market policy shifts in 2026, and major players entering the crypto sector suggests a very different scenario than the old four-year halving model. 

The analysts concluded that if liquidity expands concurrently across the US, Japan, China, Canada, and other significant economies, Bitcoin is unlikely to move counter to that trend.

Therefore, rather than experiencing a sharp rally followed by a prolonged bear market, the current environment indicates a more extended and broader uptrend that could span through 2026 and into 2027.

Bitcoin

Featured image from DALL-E, chart from TradingView.com

Bitcoin Price Faces Potential 60% Decline As Expert Warns Of ‘Major Bull Trap’

Despite the Bitcoin price recovery above the crucial $90,000 threshold—a level that has historically served as a supportive floor for the cryptocurrency—the market is exhibiting signs that a further correction may be imminent. 

Bitcoin Price Recovery At Risk?

Market expert Rekt Fencer recently shared insights on social media platform X, formerly known as Twitter, suggesting that the Bitcoin price might be forming what he calls a “massive bull trap.” 

This term refers to a deceptive bullish signal in which the price briefly surpasses a resistance level, in this case, the $90,000 mark, only to reverse into a decline. Such movements can entrap investors who bought in during the peak, leading to significant losses.

Fencer pointed out a troubling pattern reminiscent of early 2022 when Bitcoin reclaimed its 50-week moving average (MA)—currently positioned above $102,300—before experiencing a severe decline of roughly 60%, plummeting below $20,000 by June of that year. 

Bitcoin price

He indicated that the recent price recovery following major drops to $84,000 should not be interpreted as a signal of near-term success, especially since the Bitcoin price is currently trading under the 50-week MA.

If historical trends repeat, this could mean that Bitcoin might see a significant drop, potentially reaching around $36,200, which could potentially represent the low point of the bearish cycle for the cryptocurrency. On the other hand, there are analysts who retain a bullish outlook. 

BTC Bottom In Sight? 

Market researcher and analyst Miles Deutscher expressed a confident sentiment, stating he believes there is a 91.5% likelihood that the Bitcoin price has hit its bottom, based on his analysis of key developments. 

He noted that recent weeks have been dominated by negative news stories, including concerns surrounding Tether (USDT) and the implications of China’s actions on crypto, which he asserts often mark local price bottoms.

Moreover, Deutscher pointed out a shift in market flows from predominantly bearish to bullish. He explained that the trading environment has recently seen a resurgence in buying momentum, with large investors, or “OG whales,” ceasing their selling. This change has been reflected in the order books, indicating a possible stabilization in market sentiment.

Additionally, the liquidity landscape appears to be shifting, with market conditions tightening in recent months. The potential appointment of a new Federal Reserve chair known for dovish policies, coupled with the official end of quantitative tightening (QT), could further influence market dynamics in favor of buyers.

Deutscher concluded by emphasizing that given the extreme levels of fear, uncertainty, and doubt (FUD) in the market, combined with improvements in trading flows, he believes that the odds favor the notion that the Bitcoin price has indeed reached its bottom.

Featured image from DALL-E, chart from TradingView.com 

Bitcoin Treasury Company Is About To List on The New York Stock Exchange

On 3rd December, official filings and press releases announced Twenty One Capital’s upcoming debut on the New York Stock Exchange (NYSE), positioning the company as one of the largest Bitcoin treasury firms ever to enter public markets. The listing brings a dedicated Bitcoin balance sheet into Wall Street’s core ecosystem, signaling a structural shift in how institutional investors can gain long-term BTC exposure.

A Bitcoin Treasury Giant Steps Onto The NYSE Stage

Twenty One Capital’s NYSE entry is anchored by its business combination with Cantor Equity Partners (CEP), the SPAC serving as the public-market vehicle for the transaction. CEP shareholders have already approved the merger, and the deal is expected to close around December 8. Once completed, the combined entity will operate as Twenty One Capital, Inc. and begin trading on December 9 under the ticker XXI. 

The original announcement, released through official press channels and SEC-related filings, emphasized CEP’s central role in enabling the listing and establishing the company’s public-market structure. CEO Jack Mallers also highlighted the milestone on X, noting the company’s readiness for its debut.

According to this press announcement, Twenty One Capital will debut with an estimated 43,500 BTC, a reserve valued near $4 billion at recent market levels. This immediately places it among the top corporate Bitcoin treasuries globally. Unlike companies that hold Bitcoin as a secondary reserve, Twenty One is specifically engineered around a Bitcoin-native model. The firm intends to report “Bitcoin-per-share,” providing investors a transparent look at how much BTC each equity unit represents. It also pledges full, on-chain proof-of-reserves, positioning itself as a high-transparency asset custodian at launch.

This model effectively transforms Twenty One into a regulated balance-sheet wrapper for Bitcoin. It lowers operational friction for institutional allocators who want direct BTC exposure without the complexities of crypto custody, self-storage, or exchange-based acquisition. By listing on the NYSE rather than relying on ETFs or derivatives, Twenty One creates a regulated public equity vehicle that holds, safeguards, and transparently tracks Bitcoin for institutional and retail investors alike.

Wall Street’s New On-Ramp To Institutional BTC Exposure

The market impact of Twenty One’s listing reflects the accelerating integration of Bitcoin into mainstream financial architecture. The company’s backers—including Tether-linked entities, Bitfinex-aligned interests, SoftBank-connected capital, and Cantor’s public-markets network—provide a cross-sector foundation aimed at bridging crypto-native philosophies with institutional liquidity channels. 

Under this structure, Twenty One aims to become a long-term institutional treasury vessel—a regulated balance sheet that accumulates BTC and gives investors an equity-linked way to participate in Bitcoin’s upside without engaging directly with crypto custody or trading infrastructure.

As the NYSE debut approaches, Twenty One Capital embodies a pivot point where BTC’s role in capital markets shifts from speculative asset to institutional treasury instrument. If XXI attracts sustained flow, it could set a new blueprint for how corporate entities engage with Bitcoin—anchoring Wall Street’s next phase of digital-asset adoption.

Bitcoin price chart from Tradingview.com

Binance Founder Crushes Bitcoin Critic In Game-Changing BTC Vs. Gold Debate

The Binance Blockchain Week event in Dubai became the center of a high-stakes showdown between traditional and digital innovation, with Bitcoin and gold going head-to-head. Investors, tech enthusiasts, and financial experts watched closely as Binance founder Changpeng Zhao expertly debated renowned Bitcoin critic Peter Schiff, making a compelling argument for why Bitcoin is better than gold. 

Binance Founder Dominates Bitcoin And Gold Debate

During the Binance Blockchain Week in Dubai, Schiff and CZ faced off in a high-profile debate over the value of Bitcoin versus Gold. Schiff defended gold as a safe, stable, and tangible asset while the Binance founder made a compelling case for Bitcoin’s adoption, utility, value, and global reach. 

Throughout the debate, which lasted over an hour, CZ consistently demonstrated the practical advantages of Bitcoin, leaving Schiff’s gold argument largely on the defensive. The Binance founder emphasized Bitcoin’s transparent and predictable supply and its role in the modern financial systems. He pointed to hundreds of millions of users who rely on Bitcoin for payments, savings, and transfers. 

Schiff argued that Bitcoin lacks inherent value and is mainly driven by hype and faith that its price will rise. He stated that gold remains tangible, centuries old, scarce, and valuable in industry, making it superior to BTC. He further asserted that “nobody needs” Bitcoin and that the cryptocurrency is “backed by nothing.”

Practical demonstrations played a key role in the debate between Schiff and CZ. The Binance founder explained how Bitcoin and crypto payments already improve financial efficiency, especially in emerging markets. Schiff questioned whether these transactions truly count as money, since merchants ultimately receive traditional currency. CZ’s response highlighted the importance of adoption and network effects, noting that people who use BTC directly for payments give it real-world significance.

The debate also considered the preferences of younger generations. CZ asked Schiff whether millennials and Gen Z favoured Bitcoin or gold. The Bitcoin critic responded sharply, suggesting that they would choose gold. He pointed out that, with many young investors losing money on BTC, gold offers a safer, more appealing alternative. The Binance founder countered that younger people understand digital value more intuitively and prefer mobile, borderless, and censorship-resistant assets. 

Digital Value And The Future Of Money

The debate between CZ and Schiff also highlighted the changing definition of money. Bitcoin functions as a decentralized network that enables instant settlement and transparent verification. Its adoption has also helped evolve the financial economy, facilitating faster and more seamless cross-border payments. Schiff argued that gold’s scarcity and industrial demand preserve its value and make it a reliable hedge against economic uncertainty. 

Tokenization also became a point of agreement during the discussion, with Schiff emphasizing that gold can be digitized and tokenized for easier ownership and distribution without moving the physical metal. CZ contended that Bitcoin offers similar advantages while also enabling global financial inclusion. They also discussed the supply of both assets, with the Binance founder noting that Bitcoin has a visible supply, while gold doesn’t. 

They also talked about the performance of both assets over the years. Schiff argued that gold had outperformed BTC over the past four years. CZ contended that Bitcoin has far outpaced gold over the last 8 years, and since its launch in 2009, it has skyrocketed from a few cents to an ATH above $126,000. He concluded his debate, predicting that Bitcoin’s growth will outpace gold over time.

Bitcoin

Is The Bitcoin Bottom In? Top Analyst Assigns 91.5% Probability

Crypto analyst Miles Deutscher has issued one of the most forceful bottom calls of this cycle, assigning a 91.5% probability that Bitcoin’s low is already in. In a X thread on December 4, he wrote: “F*ck it. I’m putting my neck on the line here. I’m 91.5% certain that the BTC bottom is in. And if it is, A LOT of people are about to be caught offside.”

Is The Bitcoin Bottom In?

Deutscher bases his conviction on four “pillars”: market reaction to news, the historical behaviour of FUD events, a shift in flows, and an improving global liquidity backdrop. Each pillar is scored in an internal model that culminates in a 91.5/100 bullish reading.

He starts with price behaviour versus headlines. Over recent days, he notes, the market has digested an “influx of bad news” – including renewed Tether FUD, another round of “China banning crypto,” MicroStrategy scrutiny and concerns around a Bank of Japan–driven yen carry trade unwind.

“Despite all this bad news, price rallied,” he writes, calling this “the first time since the major selloff began” that Bitcoin has responded positively to a destructive news cycle. He underscores an old trading adage: “The reaction to news is more important than the news itself. This tells you everything you need to know.”

The second pillar is a systematic look at whether such FUD clusters tend to coincide with local lows. Deutscher says he backtested “every single time Tether, China, BOJ, and Microstrategy FUD entered the market” in a similar way. His conclusion is stark: “Every single time, these FUD events marked a local bottom. Tether FUD = bottom.

China ‘banning’ crypto = bottom. Bank of Japan/carry trade concerns = bottom. Microstrategy FUD = bottom.” On this basis, his AI model assigns the maximum score of 28/28 to this pillar. He cautions that “in isolation, this factor doesn’t matter much,” but argues that, combined with the first pillar, it “starts to paint a convincing bull case.”

The third pillar is flows, which he calls “the most critical factor (net buy/sell pressure).” For the past weeks, flows were “aggressively negative” with OG whales selling and ETFs dumping. Recently, he argues, this picture has changed. ETF inflows are “starting to stabilise & uptick,” treasury-company holdings remain stable, and “OG whales have stopped relentlessly dumping (this is clear on the orderbooks).” This earns a 22.5/25 score in his model. He adds one key caveat: as long as DATs exist, “there are material risks.”

The fourth pillar is the liquidity and macro environment. Deutscher notes that market liquidity had been tightening for months, but now “things are shifting back toward increased market liquidity,” with global financial conditions “reloosened to near highs.” He highlights “macro tailwinds” and adds that a new, potentially more dovish Fed chair is coming and “QT has now officially ended.” This set of factors receives a 9/10 score in his framework.

Aggregating all four pillars leads to the headline figure: “With all four market pillars taken into account, we arrive at a final score of 91.5/100.”

Deutscher, however, explicitly lists caveats. He points out that US markets “have been on a massive run” and may need to cool off, that DATs “are still seeing some short-term pressure,” and that ETF flows “can flip negative at any time.” His conclusion is probabilistic rather than absolute: “Markets are a game of probabilities, and I think the odds are in favour of the bottom being in – given the extreme FUD we’ve had and the market’s reaction to it.”

At press time, Bitcoin traded at $91,035.

Bitcoin price

Here’s Why Bitcoin Volatility Sparks Fresh Attention On MicroStrategy

The Bitcoin price volatility is once again drawing attention to MicroStrategy, the company whose strategy has become a major market reference point, with billions in accumulated BTC and a track record of aggressive buying during downturns. As traders search for stability in a shaky market, Strategy’s stance is being watched closely for what it might signal about the next phase of BTC’s trend.

Why MicroStrategy’s Next Move Could Redirect Market Momentum

Bitcoin’s recent volatility has put MicroStrategy (MSTR), the largest corporate holder of BTC, in the limelight. Walter Bloomberg has revealed on X that analysts are watching closely to see if the company could influence the cryptocurrency’s price if it sells some of its holdings.

According to JPMorgan, Strategy can avoid forced sales as long as its enterprise value-to-BTC holdings ratio stays above 1.0, which currently stands at 1.13 BTC. However, analysts continue to debunk these claims, accusing JPMorgan of spreading misinformation about market manipulation and the company.

Walter stated that if the ratio remains above this level, BTC markets may stabilize and ease recent market pressure. Due to the market pressure, the firm has slowed its BTC purchases, adding 9,062 BTC last month compared to 134,480 BTC a year ago, reflecting a more cautious accumulation approach amid a broader crypto downturn. Its stock has dropped roughly 42% over the past three months.

Additionally, challenges include the potential exclusion from MSCI indices, which could trigger $8.8 billion in passive fund outflows if index funds are forced to divest. However, MicroStrategy holds a $1.4 billion reserve for dividends and interest, helping it avoid selling its BTC even if the price falls further. In the meantime, there is no proof that MicroStrategy is in danger of liquidation.

How Institutional Behavior Builds A Higher Floor For Bitcoin

In a market speculation, Bitcoin is currently experiencing one of the most significant capital migrations in its history, fueled by institutional adoption. Analyst Matthew noted that the current BTC market cycle from 2022 to 2025 has already absorbed an unprecedented amount of new capital, surpassing all previous BTC cycles. This growth is a reflection of the market’s maturity and the ecosystem’s innovative approach to liquidity through regulated instruments.

Bitcoin

Furthermore, the network has incorporated more than $732 billion in fresh capital in the current cycle, surpassing the $388 billion that was injected during the 2018 to 2022 cycle. At that time, the surge helped push BTC market capitalization to an all-time high record of $1.1 trillion, a metric that indicates a much higher aggregate cost base for new institutional investors.

Related Reading: Why Bitcoin Traders Fear A Repeat Of July 2024’s Crash Next Week

Meanwhile, the total settlement volume in the decentralized BTC protocol was approximately $6.9 trillion in just 90 days. Despite this, the number of active on-chain entities dropped from 240,000 to 170,000 per day, which is a reflection of liquidity migration of capital flows into spot ETFs.

Bitcoin

The $13.5 Billion Liquidity Injection That Could Send Bitcoin And Crypto Prices Flying

Bitcoin has been struggling to build momentum in recent weeks, and the return of cash into the system is raising questions about whether this could be the moment that changes the tone of the crypto market. That growing sense of anticipation has already started to show up in prices, with the total crypto market cap climbing more than $250 billion from its $3.016 trillion low on December 2.

What Happened: The Liquidity Injection And Why It Matters

After officially bringing its multi-year quantitative tightening (QT) program to an end, the central bank followed up with a $13.5 billion overnight repo operation, funneled through the New York Fed. Banks brought $13.5 billion in Treasuries to the Fed, the Fed accepted all of it, and instantly injected $13.5 billion of fresh reserves into the system.

The move, which is the second-largest liquidity injection since the COVID-19 crisis, effectively puts an end the steady shrinkage of bank reserves that has persisted for years, easing pressure on short-term funding markets and signaling a more accommodative liquidity environment.

The crypto market responded almost instantly. A handful of major assets began turning green within hours of the injection, with Bitcoin leading the charge with an instant break above $92,000.

The influx was visible at a macro level as well: the total crypto market cap climbed from a December 2 low of $3.016 trillion to $3.269 trillion by December 4. A gain of more than $250 billion in under 48 hours

What Investors Should Watch Next

Ending QT leads to better liquidity and often create a bullish environment for equities and other riskier investments like cryptocurrencies. However, although a single liquidity event does not guarantee a sustained multi-month rally, this injection stands out not just for its size but for what it represents. 

Related Reading: 4 Bitcoin Indicators That Led To Market Rallies In The Last 2 Years Have Returned

In a CNBC interview, Fundstrat’s Tom Lee stated that the Fed’s decision to stop QT will be a turning point for the cryptocurrency market. Lee pointed out that the last time the Fed ended QT, the market rose about 17% within three weeks.

The previous time the Fed brought quantitative tightening to a stop was in July 2019, roughly a year after it began reducing its balance sheet. In the three weeks that followed, the S&P 500 climbed about 5%. Bitcoin’s also initially rallied in the same period, but its strongest reaction came months after, towards late 2019 and early 2020.

Bitcoin

Bitcoin’s Latest Drop Isn’t Just Another Correction, But A Clear Capitulation Event – Here’s Why

After a brief moment of bullish performance in Bitcoin, the price experienced a sudden pullback due to a broader market shakedown, which caused BTC to revisit the $90,000 threshold. While this pullback has sparked a frenzy in the cryptocurrency community, on-chain data has revealed a shocking trend about the sudden pullback.

True Capitulation, Not A Routine Bitcoin Pullback

The market was rocked by a recent decline in the price of Bitcoin, but this pullback comes with an extra layer. Alphractal, an advanced investment and on-chain data analytics platform, has shed crucial insights about the decline using several key indicators to determine the unseen trend.

After carrying out its research, the on-chain platform revealed that the latest Bitcoin drop was not just another correction, but a clear instance of a capitulation event. This abrupt turnaround seems to have embodied all the characteristics of a full-scale capitulation event. These include an emotional flush-out when panic selling, forced liquidations, and intense dread came together in one dramatic moment.

Alphractal’s reading is backed by three major signals that rarely show up together, suggesting a pivotal moment for BTC. Such a trend may be the turning point that reshapes the short-term trajectory of the crypto king.

The first signal highlighted by the platform comes from the Bitcoin Hash Rate, which has witnessed a steady decline over the last 30 days. Presently, miners are turning off their machines, triggering heightened pressure on the ecosystem. When miners begin to lose money, it typically implies that the market might have reached its peak.

Another signal is coming from the BTC price drawdown. After a fast, violent drop, the metric is hitting extreme levels beyond the historical median. This is not just a technical drop, but it’s pain, triggered by forced selling and liquidation.

A Rare Trend And A Good Entry Opportunity

Finally, the last signal is the recent spike in active supply as those holding BTC for months or years have begun spending their coins. A behavior of this kind only unfolds when investors exhibit heightened caution, causing sentiment to drop. 

An interesting aspect about this trend is that when these 3 signals flash in unison, the Capitulation Oscillator tends to rise. This is a moment that nearly always denotes the conclusion of a downward trend or a leveling phase, as was the case in 2021.

Bitcoin

While it has played out in previous scenarios, it is not a guarantee of an immediate bottom. However, moments like these have historically been uncommon and frequently present opportunities that only occur once or twice every cycle, especially for those rooted in on-chain data.

Joao Wedson, the founder of Alphractal, also confirms these signals, which point to real capitulation. According to Wedson, the recent correction was the most severe capitulation event since 2022. 

Nonetheless, this has traditionally led to the formation of long accumulation regions before the price makes its next macro direction. In other words, Wedson noted that the highest probability scenario is that 2025 will end in a broad sideways range; a classic phase of accumulation or redistribution.

Bitcoin

Could Strategy Be Forced To Sell Its Bitcoin? Bitwise CIO Says No

Bitwise Chief Investment Officer Matt Hougan is pushing back against one of the loudest bearish narratives around bitcoin treasury company Strategy (MSTR, formerly MicroStrategy): that it could be forced into a liquidation of its roughly $60 billion bitcoin stack. In his latest CIO memo, Hougan writes bluntly that “Michael Saylor and Strategy selling bitcoin is not one of” the real risks in crypto.

Will Strategy Sell Its Bitcoin?

The immediate trigger for market anxiety is MSCI’s consultation on whether to remove so-called digital asset treasury companies (DATs) like Strategy from its investable indexes. Nearly $17 trillion in assets tracks those benchmarks, and JPMorgan estimates index funds might have to sell up to $2.8 billion of MSTR if it is excluded.

MSCI’s rationale is structural: it views many DATs as closer to holding companies or funds than operating companies, and its investable universes already exclude holding structures such as REITs.

Hougan, a self-described “deep index geek” who previously spent a decade editing the Journal of Indexes, says he can “see this going either way.” Michael Saylor and others are arguing that Strategy remains very much an operating software company with “complex financial engineering around bitcoin,” and Hougan agrees that this is a reasonable characterization. But he notes that DATs are divisive, MSCI is currently leaning toward excluding them, and he “would guess there is at least a 75% chance Strategy gets booted” when MSCI announces its decision on January 15.

He argues, however, that even a removal is unlikely to be catastrophic for the stock. Large, mechanical index flows are often anticipated and “priced in well ahead of time.” Hougan points out that when MSTR was added to the Nasdaq-100 last December, funds tracking the index had to buy about $2.1 billion of stock, yet “its price barely moved.”

He believes some of the downside in MSTR since October 10 already reflects investors discounting a probable MSCI removal, and that “at this point, I don’t think you’ll see substantial swings either way.” Over the long term, he insists, “the value of MSTR is based on how well it executes its strategy, not on whether index funds are forced to own it.”

The more dramatic claim is the so-called MSTR “doom loop”: MSCI exclusion leads to heavy selling, the stock trades far below NAV, and Strategy is somehow forced to sell its bitcoin. Here Hougan is unequivocal: “The argument feels logical. Unfortunately for the bears, it’s just flat wrong. There is nothing about MSTR’s price dropping below NAV that will force it to sell.”

He breaks the problem down to actual balance sheet constraints. Strategy, he says, has two key obligations: about $800 million per year in interest payments and the need to refinance or redeem specific debt instruments as they mature.

Smaller DATs Are The Bigger Problem

On interest, the company currently has approximately $1.4 billion in cash, enough to “make its dividend payments easily for a year and a half” without touching its bitcoin or needing heroic capital markets access. On principal, the first major maturity does not arrive until February 2027, and that tranche is “only about $1 billion—chump change” compared with the roughly $60 billion in bitcoin the company holds.

Governance further reduces the likelihood of forced selling. Michael Saylor controls around 42% of Strategy’s voting shares and is, in Hougan’s words, a person with extraordinary “conviction on bitcoin’s long-term value.” He notes that Saylor “didn’t sell the last time MSTR stock traded at a discount, in 2022.”

Hougan concedes that a forced liquidation would be structurally significant for bitcoin, roughly equivalent to two years of spot ETF inflows dumped back into the market. He simply does not see a credible path from MSCI index mechanics and equity volatility to that outcome “with no debt due until 2027 and enough cash to cover interest payments for the foreseeable future.” At the time of writing, he notes, bitcoin trades around $92,000, about 27% below its highs but still 24% above Strategy’s average acquisition price of $74,436 per coin. “So much for the doom.”

Hougan ends by stressing that there are real issues to worry about in crypto—slow-moving market structure legislation, fragile and “poorly run” smaller DATs, and a likely slowdown in DAT bitcoin purchases in 2026. But on Strategy specifically, his conclusion is direct: he “wouldn’t worry about the impact of MSCI’s decision on the stock price” and sees “no plausible near-term mechanism that would force it to sell its bitcoin. It’s not going to happen.”

At press time, BTC traded at $92,086.

Bitcoin price

Why Bitcoin Traders Fear A Repeat Of July 2024’s Crash Next Week

Bitcoin is again trading under the shadow of a potential yen carry-trade shock as markets head into the 9–10 December FOMC meeting and a likely hawkish turn from the Bank of Japan at the December 18-19 meeting. The setup echoes last summer’s episode, when a policy shift in Tokyo triggered rapid deleveraging across risk assets, including crypto.

Will The Bitcoin Price Crash Next Week?

Analyst Benjamin Cowen explicitly links today’s environment to that July shock. He reminded followers that “in July 2024, the Fed cut rates while the BOJ raised rates, leading to the unwind of the carry trade. Bitcoin capitulated into it, and found a low 1 week later.” He added, “Good chance this happens again on December 10th (Fed cuts, BOJ raises rates). So maybe Bitcoin finds a low mid-Dec?”

The precise sequencing last year was more nuanced – markets aggressively priced Fed easing while the BoJ surprised with a hike – but the core mechanism Cowen highlights is the same: when US policy is moving toward looser conditions just as Japan tightens, the long-running yen carry trade becomes unstable and high-beta assets sell off hard.

Truflation’s thread lays out why this matters for Bitcoin and the wider crypto market. Large institutions and commercial banks “borrow money in Yen where interest rates are historically and famously low, and use that money to invest in the US.” They can park the funds in interest-bearing instruments to “earn healthy 3–4%” on the spread, or “more often, they invest in stocks and bonds to get way more.” This is reinforced by a BoJ policy of keeping the yen cheap against the dollar.

The danger arises when stocks fall and the yen starts to rise or is expected to rise. Then “institutional and Commercial borrowers may exit, so as not to get stuck with significant losses on their Yen debts.” They “sell whatever assets they purchased in the US and get back into Yen to pay back their loans in Japan, resulting in a cascade of US asset sales and Yen purchases.” After “years of Yen carry trade being a relatively safe way for big banks and institutional investors to make easy money,” even a modest normalization can force broad, mechanical de-risking — and Bitcoin, as a liquid, leveraged risk asset, sits directly in that firing line.

Crypto trader Kevin (@Kev_Capital_TA) underscores how tight the current window is. He notes that “we have the Fed’s preferred measure to track inflation via the Core PCE inflation and then the FOMC all in the next six days,” followed by a BoJ press conference on 19 December that will be “massive for Dollar, short end and long end of the yield curve not to mention Yen carry trade fears.” In a separate post, he stresses that “the JP10Y continues to make new highs. Pretty big deal folks,” highlighting that Japanese yields are grinding higher into that meeting and increasing pressure on the BoJ to act.

A few days ago, BitMEX founder Arthur Hayes connected that macro repricing directly to Bitcoin’s latest leg down. “BTC dumped cause BOJ put Dec rate hike in play. USDJPY 155–160 makes BOJ hawkish,” he argues, framing the sell-off as a funding shock rather than a crypto-native event.

Into December, futures and economist surveys put the probability of a Fed cut at roughly 80–87% for the 9–10 December meeting, even as the committee remains divided. At the same time, the BoJ is openly signalling it will “consider the pros and cons” of a hike at its 18–19 December meeting, with markets now pricing a high likelihood of tightening and 10-year JGB yields near multi-decade highs.

That combination — Fed easing expectations plus BoJ tightening risk — is exactly the configuration that threatens the yen carry and makes a repeat of July 2024’s pattern plausible: a sharp flush in Bitcoin and other risk assets, followed by a bottom once forced deleveraging runs its course.

At press time, BTC traded at $92,235.

Bitcoin price

Bitcoin Signals Bear Market: One Thing Could Flip It, Says CryptoQuant CEO

Bitcoin may be sliding into a new bear phase unless fresh macro liquidity – particularly through spot ETFs – returns to the market, according to CryptoQuant CEO Ki Young Ju.

Bitcoin Bear Market Incoming?

Sharing a composite on-chain dashboard overlaid on the BTC price, Ju wrote on X: “Most Bitcoin on-chain indicators are bearish. Without macro liquidity, we enter a bear cycle.” The chart stacks ten CryptoQuant metrics behind the price in a red-to-green heatmap from 2021 to 2025, highlighting how regime shifts in prior cycles coincided with clusters of bearish readings.

The indicators in the panel include the MVRV Z-score, CryptoQuant P&L Index, the Bull-Bear Cycle Indicator, Inter-Exchange Flow Pulse, Network Activity Index, Stablecoin Liquidity, Bitcoin Demand Growth, Trader On-chain Profit Margin, Trader Realized Price and a Technical Signal metric. When the majority are bullish, the backdrop turns light green; when they flip bearish, it shifts to red. In the latest section of the chart, as BTC has pulled back from its highs, red once again dominates – the visual basis for Ju’s warning.

Bitcoin Bull Score Modell

For the next major move, Ju argues that on-chain data is now subordinate to macro conditions and ETF flows. Quoting his own post, he wrote: “It is simple. If you think macro gets better next year, you buy. Otherwise, you sell. I’m not a macro expert, so find macro bros. New ETF inflows are the key.”

That line pinpoints what he believes can “save” Bitcoin from a deeper drawdown: renewed demand from spot ETFs as a conduit for institutional capital. In earlier stages of the cycle, rising ETF inflows coincided with strong price appreciation; more recently, slowing or negative flows have mirrored the loss of upward momentum.

Ju frames the current environment as one that demands flexible scenario management rather than rigid forecasts. “At this stage, it is more about being reactive than predictive. Set your scenarios and trade accordingly,” he told followers. The composite chart is designed for exactly that purpose, showing how past bull tops and bear markets aligned with persistent stretches of red across profit, valuation and liquidity metrics.

Despite the bearish tilt, Ju does not foresee a repeat of the 2022 collapse, when Bitcoin fell roughly 65% from peak to trough. He cites the behaviour of Michael Saylor led Strategy as a stabilizing factor. “If Strategy holds its 650K BTC this cycle (or sells only a little), we would not see another -65% drawdown like in 2022,” he wrote. In his view, that supply remaining largely off the market reduces the probability of a violent deleveraging event.

Ju characterizes the current pullback as substantial but not extreme in historical context. “We are about -25% from ATH now, and even if a bear cycle comes, the downside would likely be smaller and look more like a broad sideways range,” he argued, suggesting that prolonged consolidation is more likely than a single dramatic crash.

His message to long-term investors is explicitly calming. “Long-term holders should avoid panic selling,” he advised. While cyclical on-chain indicators flash red, he insists the structural backdrop has improved: “Bitcoin has more liquidity channels now, so the long-term outlook is obviously strong, imo.” Those channels include ETFs and a deeper institutional market structure than in prior cycles.

At press time, Bitcoin traded at $92,494.

Bitcoin price

Reversal Loading? Bitcoin, Ethereum, And Solana Build Powerful High-Time-Frame Structures

In the volatile theatre of the cryptocurrency market, Bitcoin, Ethereum, and Solana are showing signs of a potential high-time-frame reversal. After weeks of stress and price compression, each of the top assets is now stabilizing at key structural support levels. The multiple leading cryptocurrencies are flashing similar recovery setups at the same time.

The current crypto landscape may be setting up one of the most powerful high-time-frame reversals across Bitcoin, Ethereum, and Solana. An investor and trader known as MacroCRG on X highlighted that yesterday, all three assets printed a bullish engulfing candle, a strong signal that buyers are stepping back in with intent.

Market Leaders Hint At A Shift Before Smaller Assets Follow

On the weekly chart, each asset is showing the early stages of an inside-week breakout paired with a false breakdown. MacroCRG pointed out that a similar structure on the ES (S&P 500 futures) chart from April, where the breakdown of inside-week structure led to a breakout that never looked back when the bull secured the weekly close.

Related Reading: Institutions Exit Bitcoin In Large Tranches, Ethereum, Solana And XRP See Massive Buy-Ins

For this setup to take hold, these prices need to close the week above the key highlighted highs on the chart. However, there’s still a long way to go before the weekly close will confirm the breakout, and the bulls need to follow through with conviction and remove any doubt.

The founder of the ProMintClub investment community, ProMint, has spotted a high-conviction whale trader aggressively building long positions across the crypto market. Currently, the trader is leading the Lighter leaderboard with over $64 million in profit and loss, while maintaining an 83% long bias. His Lighter account has the highest profit and loss with over $8 million. These are insane numbers compared to everyone else on the leaderboard.

Bitcoin

Data shows that the trader has made five deposits into his Lighter account, which total around $6 million in capital. His positions are spread across BTC, ETH, SOL, AAVE, along with smaller plays such as PAXG and PUMP, consistently entering at strong timing points and riding momentum higher.

Even though funding costs have flipped heavily negative, he is not backing down. Presently, this is the top-performing account on Lighter, and this is serious capital deployed with conviction.

How Increased Partners Drive Sustained Volume Demand

According to Chainflip Labs, November marked one of the strongest performance months in the protocol’s history, clearing over $583 million in swap volume, which is the second-best month ever for the network. 

Demand remained sustained across BTC, ETH, and SOL routes, and more partners are routing flow through the network than ever before. The trend clearly shows that Chainflip will continue to scale.

Bitcoin

A Bitcoin Parabolic Rally Is Coming: Eric Trump Shares Why First Family Is Pro-Crypto

Bitcoin’s trajectory is becoming a central theme in the first family’s business interests, with Eric Trump explaining why he believes the market is setting up for a dramatic surge. His comments, made in a YouTube interview with Grant Cardone, offered a rare look into how American Bitcoin Corp (ABTC) approaches the crypto industry and why the Trumps consider BTC one of the most important financial opportunities of the decade.

Eric Trump Thinks Parabolic Rally Is Coming For Bitcoin

Eric Trump made it clear that ABTC operates on the conviction that Bitcoin is gearing up for a powerful upward acceleration. American Bitcoin is a publicly traded BTC mining and accumulation company co-founded by Eric Trump in partnership with Hut 8 Corp.

According to Eric Trump, the company is structured to maximize its BTC holdings ahead of that move rather than dilute resources on heavy management costs or constant liquidations. In his words, the comparison with other miners is straightforward because ABTC wants to hold the asset it believes will appreciate sharply instead of turning mined Bitcoin into daily operating cash.

His reasoning is a departure from the traditional mining business model, which typically sells a significant share of its Bitcoin to cover operational costs. Trump insists that ABTC is deliberately positioning itself differently because “we want to be buying the asset that we believe is going to appreciate.”

Eric Trump said BTC’s surge is not limited to ordinary crypto investors but is also driven by the quiet entry of sovereign funds, family offices, and major institutions. He also contrasted Bitcoin with real estate, noting that he now spends more time in crypto because it grows in ways traditional property cannot. 

Real estate is slow and tied to limited cash flow, while Bitcoin scales globally and appreciates far faster. That difference is one of the reasons he expects BTC to reach around $500,000 in the long term, a prediction he offered without hesitation.

ABTC’s Unique Model: Building BTC Per Share

Ashet Genoot, CEO of Hut 8 Corp., expanded on the company’s internal philosophy by explaining how ABTC measures value differently from other publicly traded firms. Instead of focusing on earnings per share, he said their model centers on “Bitcoin per share,” which is a metric that reflects how much BTC each shareholder indirectly controls through the company.

Genoot explained that the question they ask every day is simple: how do we grow the amount of Bitcoin per share? He described their system as a constant pursuit of increasing BTC reserves through multiple channels, whether mining coins at scale or buying them whenever conditions favor accumulation. 

The goal is for every ABTC shareholder to benefit from a rising quantity of BTC over time, turning the company into a long-term accumulator rather than a miner that immediately sells its output to cover expenses.

According to regulatory filings, ABTC operates tens of thousands of ASIC miners under Hut 8’s infrastructure and has accumulated more than 4,000 BTC as of late 2025.

Bitcoin

Bitcoin Market Signals A Pivotal Turning Point – Here Are The Main Drivers Behind It

Several key Bitcoin metrics are beginning to exhibit bullish action once again alongside the renewed upward traction in the asset’s price. With this kind of trend that points to growing momentum, the crypto king appears to be gearing up for a pivotal shift driven by newfound appetite from investors.

A Key Market Shift Unfolding For Bitcoin

Bitcoin has experienced a rebound as the crypto landscape turns bullish again, sending its price back above the $90,000 mark. Following the bounce on Wednesday, the BTC market appears to have reached a critical junction as it hints at an impending shift in the current trend.

Delving into the market performance, Darkfost, an author at CryptoQuant and market expert, has outlined the key driver behind the unfolding shift. In the research shared on the X platform, the expert revealed that the market today is heavily driven by derivatives. In addition to the derivatives-driven market, 2025 has been the most speculative year Bitcoin has ever seen in its existence.

Bitcoin

Another key driver highlighted by the market expert is the actions of investors in the United States and the renewed demand at the institutional level. Darkfost’s research hinges on a critical Bitcoin metric, one that shows the average evolution of the Coinbase Premium Gap in the monthly timeframe and the Spot Bitcoin Exchange-Traded Funds (ETFs) netflows.

Specifically, this metric is the Bitcoin ETF – Netflow USD Vs. Coinbase Premium. It is worth noting that the Coinbase Premium Gap calculates the pricing difference between Coinbase Pro and Binance. This helps illustrate the behavior of different groups of investors. While Coinbase Pro is typically used by institutions and whales, Binance, which has the largest volume, is available to everyone.

The Coinbase Premium Gap decreased from +$109 to -$40 since October 16, when Bitcoin was valued at almost $113,000. Such a drop suggests that institutional investors sharply decreased their positions. 

BTC ETFs Netflows Impact On The Market

Interestingly, the trend was also observed in ETF netflows, which also flipped negative. During the period, BTC fell from $113,000 to $80,000, reflecting how much the US and institutional demand influence the market

As seen in the past, large negative swings have frequently indicated market bottoms, provided that the trend thereafter begins to turn. A trend of this kind is what is playing out in the market today.

However, current data reveals that the Coinbase Premium Gap has bounced back to -$13 while the average ETF netflow is valued at around -$100 million. This comeback in both sectors indicates that in the near term, the situation seems to be improving, and BTC’s price is reacting appropriately to the crucial shift. 

As a result, Darkfost predicts that a new all-time high for BTC may happen quickly if this pattern continues in the long run. The ongoing shift may be subtle, but it is noticeable as the market appears to be preparing for a phase that might largely change the course of Bitcoin.

Bitcoin

Making History With Bitcoin: What’s Going On With MicroStrategy And Wall Street?

Market expert Shanaka recently explained how a historical event is unfolding with MicroStrategy and its Bitcoin strategy. This comes as the company faces a negative valuation from Wall Street while MSCI considers whether to remove MSTR from its indices. 

MicroStrategy’s Market Cap Drops Below the Value Of Bitcoin Holdings

In an X post, Shanaka noted that MicroStrategy, which is the world’s largest corporate Bitcoin holder, is now worth less than its BTC holdings. The company currently holds 650,000 BTC, valued at around $60 billion, while the MSTR stock has a market cap of $55 billion. The expert noted that Wall Street is valuing the company at a negative based on this. 

He further remarked that this is the sustained NAV inversion since MicroStrategy began the Bitcoin model in 2020. Shanaka noted that the company has created a $1.44 billion emergency reserve to pay dividends. This came after the CEO Phong Le admitted that they might have to sell BTC to fund dividend payments if the mNAV drops below 1. 

MicroStrategy’s woes could deepen as MSCI will decide by January whether to expel the company from global stock indices. MSCI is considering whether companies that hold Bitcoin should be regarded as funds or trusts rather than as companies. JPMorgan estimates the company could see $8.8 billion in outflows if other index providers make a similar move.

Shanaka described the math as “merciless,” noting that MicroStrategy has $8.2 billion in debt, $7.8 billion in preferred stock, and $16 billion in total obligations against a $45.7 billion shell. Meanwhile, the company currently holds its BTC at an average cost of $74,436, which the expert noted is 15% above breakeven. As such, he remarked that one sustained drop erases every gain since 2020. 

Shanaka stated that MicroStrategy’s current situation is not just about one company but about whether corporations can hold sound money without being destroyed by the very system they sought to escape. He added that the largest experiment in corporate Bitcoin adoption is breaking in real time. 

Saylor Confirms Talks With MSCI Over Potential Exclusion

According to a Reuters report, Michael Saylor confirmed that MicroStrategy is in talks with MSCI over a potential exclusion from their indices. MSCI is expected to decide by January 15 whether to remove digital-asset treasury companies that buy Bitcoin and other crypto assets, amid concerns that they are classified as investment funds.  

Saylor opined that MicroStrategy’s potential exclusion from MSCI indices won’t make any difference. He explained that his company is currently leveraged by a multiple of 1.11 and could survive a 95% Bitcoin crash. Meanwhile, it is worth noting that Phong Le has stated that it is unlikely they will sell any BTC over the next three years following the creation of the USD reserves, which should be sufficient for dividend payments during this period.

Bitcoin

The MicroStrategy Of Asia: Japanese Company Announces Plan For Bitcoin And XRP Treasury

Bitcoin and XRP have become central to a bold corporate shift in Japan, with AltPlus announcing that both digital assets will be formally incorporated into its long-term treasury strategy. The publicly listed company disclosed the move in its recent shareholder filing, outlining a multi-layered plan that positions cryptocurrencies as foundational components of its future financial and operational framework.

Bitcoin And XRP Lead Treasury

According to a post by “BankXRP” on X (formerly Twitter), AltPlus is expected to purchase and hold Bitcoin and XRP through a newly established cryptocurrency purchase and management division. The company frames this step as part of a long-horizon capital strategy supported by blockchain transparency, expanding global regulatory clarity, and the growing institutional acceptance of digital assets. In the filing, Bitcoin and XRP are highlighted for their scarcity, decentralization, predictability, and fast, low-cost transactional capabilities—attributes AltPlus expects will contribute to long-term value growth and broader financial-market utility.

Moreover, the treasury initiative is designed to strengthen the company’s financial base, diversify revenue streams, and establish a stable earnings engine through staking-based income. AltPlus presents the move as a structured method to enhance capital efficiency and reinforce corporate value over time. The company notes that holding both Bitcoin and XRP aligns its balance-sheet strategy with emerging global trends in digital-asset management and institutional-grade treasury practices.

AltPlus also outlines its risk-management system to address crypto-market volatility, liquidity risks, cybersecurity threats, regulatory changes, and speculative trading patterns. The company plans to implement investment-scale limits, a controlled holding-ratio strategy, and a proprietary internal asset-management system to govern acquisition, custody, tracking, and treasury integration. These measures are designed to maintain governance discipline, ensure compliance, and safeguard digital-asset operations as part of the broader corporate structure.

AltPlus’ Web3 And Digital-Asset Expansion

Beyond treasury allocation, AltPlus frames Bitcoin and XRP as key elements in a broader transition into digital-asset operations and Web3-enabled business development. The filing situates this shift within a global context, noting that major financial institutions and listed companies worldwide are increasingly incorporating crypto assets into holding, settlement, and capital-management functions.

Building on this trend, AltPlus plans to integrate blockchain infrastructure into its Entertainment and Solutions business. This includes exploring Web3 functionality, token-based engagement models, and digital-asset utilities across its gaming and IP ecosystem. These initiatives are intended to unlock new business models, enhance operational flexibility, and develop internal expertise for a digital-native market environment.

The company’s decision to include XRP directly in its treasury strategy is one of the standout elements of the announcement. AltPlus positions XRP as a long-term corporate asset alongside Bitcoin, marking a notable step forward for institutional crypto adoption in Japan. Through treasury transformation, staking-driven income generation, and Web3 ecosystem expansion, AltPlus is creating a strategic framework similar to the high-conviction treasury approach seen at MicroStrategy. At the same time, it is establishing a distinctly Japanese model focused on utility, diversification, and forward-looking corporate innovation.

Bitcoin price chart from Tradingview.com (XRP)

Bitcoin Reclaims $93,000: Could Altcoins Rebound Amid Predictions Of An Upcoming Bear Market?

Bitcoin (BTC) has continued its relief rally since the start of the week, successfully reclaiming the significant $93,000 mark on Wednesday afternoon. This uptick in the cryptocurrency’s price has sparked mixed sentiments among experts regarding its future direction.

Analysts Warn Of Resistance Ahead For Bitcoin

IG analyst Chris Beauchamp highlighted the cautious optimism among Bitcoin enthusiasts, who are wary after witnessing numerous false recoveries in recent months. He noted that there appears to be a shift in risk appetite within the stock market, which is gradually spilling over into the cryptocurrency space. 

However, he pointed out that while last week’s bounce faltered at the $93,000 level, the recent climb above this threshold on Wednesday instills a sense of hope for a more sustained upward movement.

Despite this positivity, analysts warn that more resistance levels are likely to emerge as Bitcoin rallies. Jeff deGraaf from Renaissance Macro Research outlined two significant resistance points to watch: the psychological $100,000 threshold and the $107,000 mark, both amplified by descending moving averages. 

Adding another layer to the Bitcoin discourse, market analyst CryptoBullet has suggested that the Bitcoin cycle top may already be in place, reached last month above $126,000. 

Will Altcoins Bounce Back?

In a social media post, CryptoBullet pointed out that the performance of altcoins, measured against Bitcoin, indicates a bottoming out. This scenario, while concerning, is not unprecedented. 

CryptoBullet recalled a similar situation in September 2019 when Bitcoin was consolidating about 30% below its top following an intense seven-month rally after a bear market low. At that time, altcoins also reached their cycle low.

In the current context, Bitcoin’s rally has lasted significantly longer—35 months compared to the previous seven-month span. Additionally, altcoins have been on a downward trajectory for over four years, effectively more than doubling the duration of their last bear market. 

Looking ahead, CryptoBullet anticipates a challenging correction for Bitcoin in 2026, suggesting a bear market could be on the horizon. In the next two to three months, he predicts a potential bounce for altcoins, signaling a liquidity rotation and possibly a “mini altseason” during what he terms a “Dead Cat Bounce” for Bitcoin. 

This mirrors the events of 2019-2020, when altcoins experienced a relief rally while Bitcoin was on a downward trend. CryptoBullet indicates that a significant altseason is expected in the next cycle, projected for 2027-2029.

Bitcoin

At the time of writing, the price of BTC is trading just above $93,000, marking gains of 2% and 3% in the 24-hour and seven-day time frames, respectively. 

Featured image from DALL-E, chart from TradingView.com 

❌