Reading view

There are new articles available, click to refresh the page.

From Top To Bottom: Bitcoin’s Largest & Smallest Hands Both Now Accumulating

Data shows distribution on the Bitcoin network has dropped off, with both the largest of whales and small retail hands taking to accumulation.

Bitcoin Accumulation Trend Score Shows Shift Toward Buying

As explained by Glassnode analyst Chris Beamish in an X post, Bitcoin investors have been showing a lot less distribution at the recent price levels. The on-chain indicator of relevance here is the “Accumulation Trend Score,” which tells us about whether BTC holders are buying or selling.

The metric tracks investor behavior using not just the changes happening in their wallet balance, but also accounting for the size of their wallets. This means that larger entities have a higher influence on the score.

When the value of the Accumulation Trend Score is greater than 0.5, it means the investors are displaying a net trend of accumulation. On the other hand, it being under the threshold suggests the dominance of distribution.

Now, here is the chart shared by Beamish that shows how the Accumulation Trend Score has changed for the different Bitcoin investor segments over the last few years:

Bitcoin Accumulation Trend Score

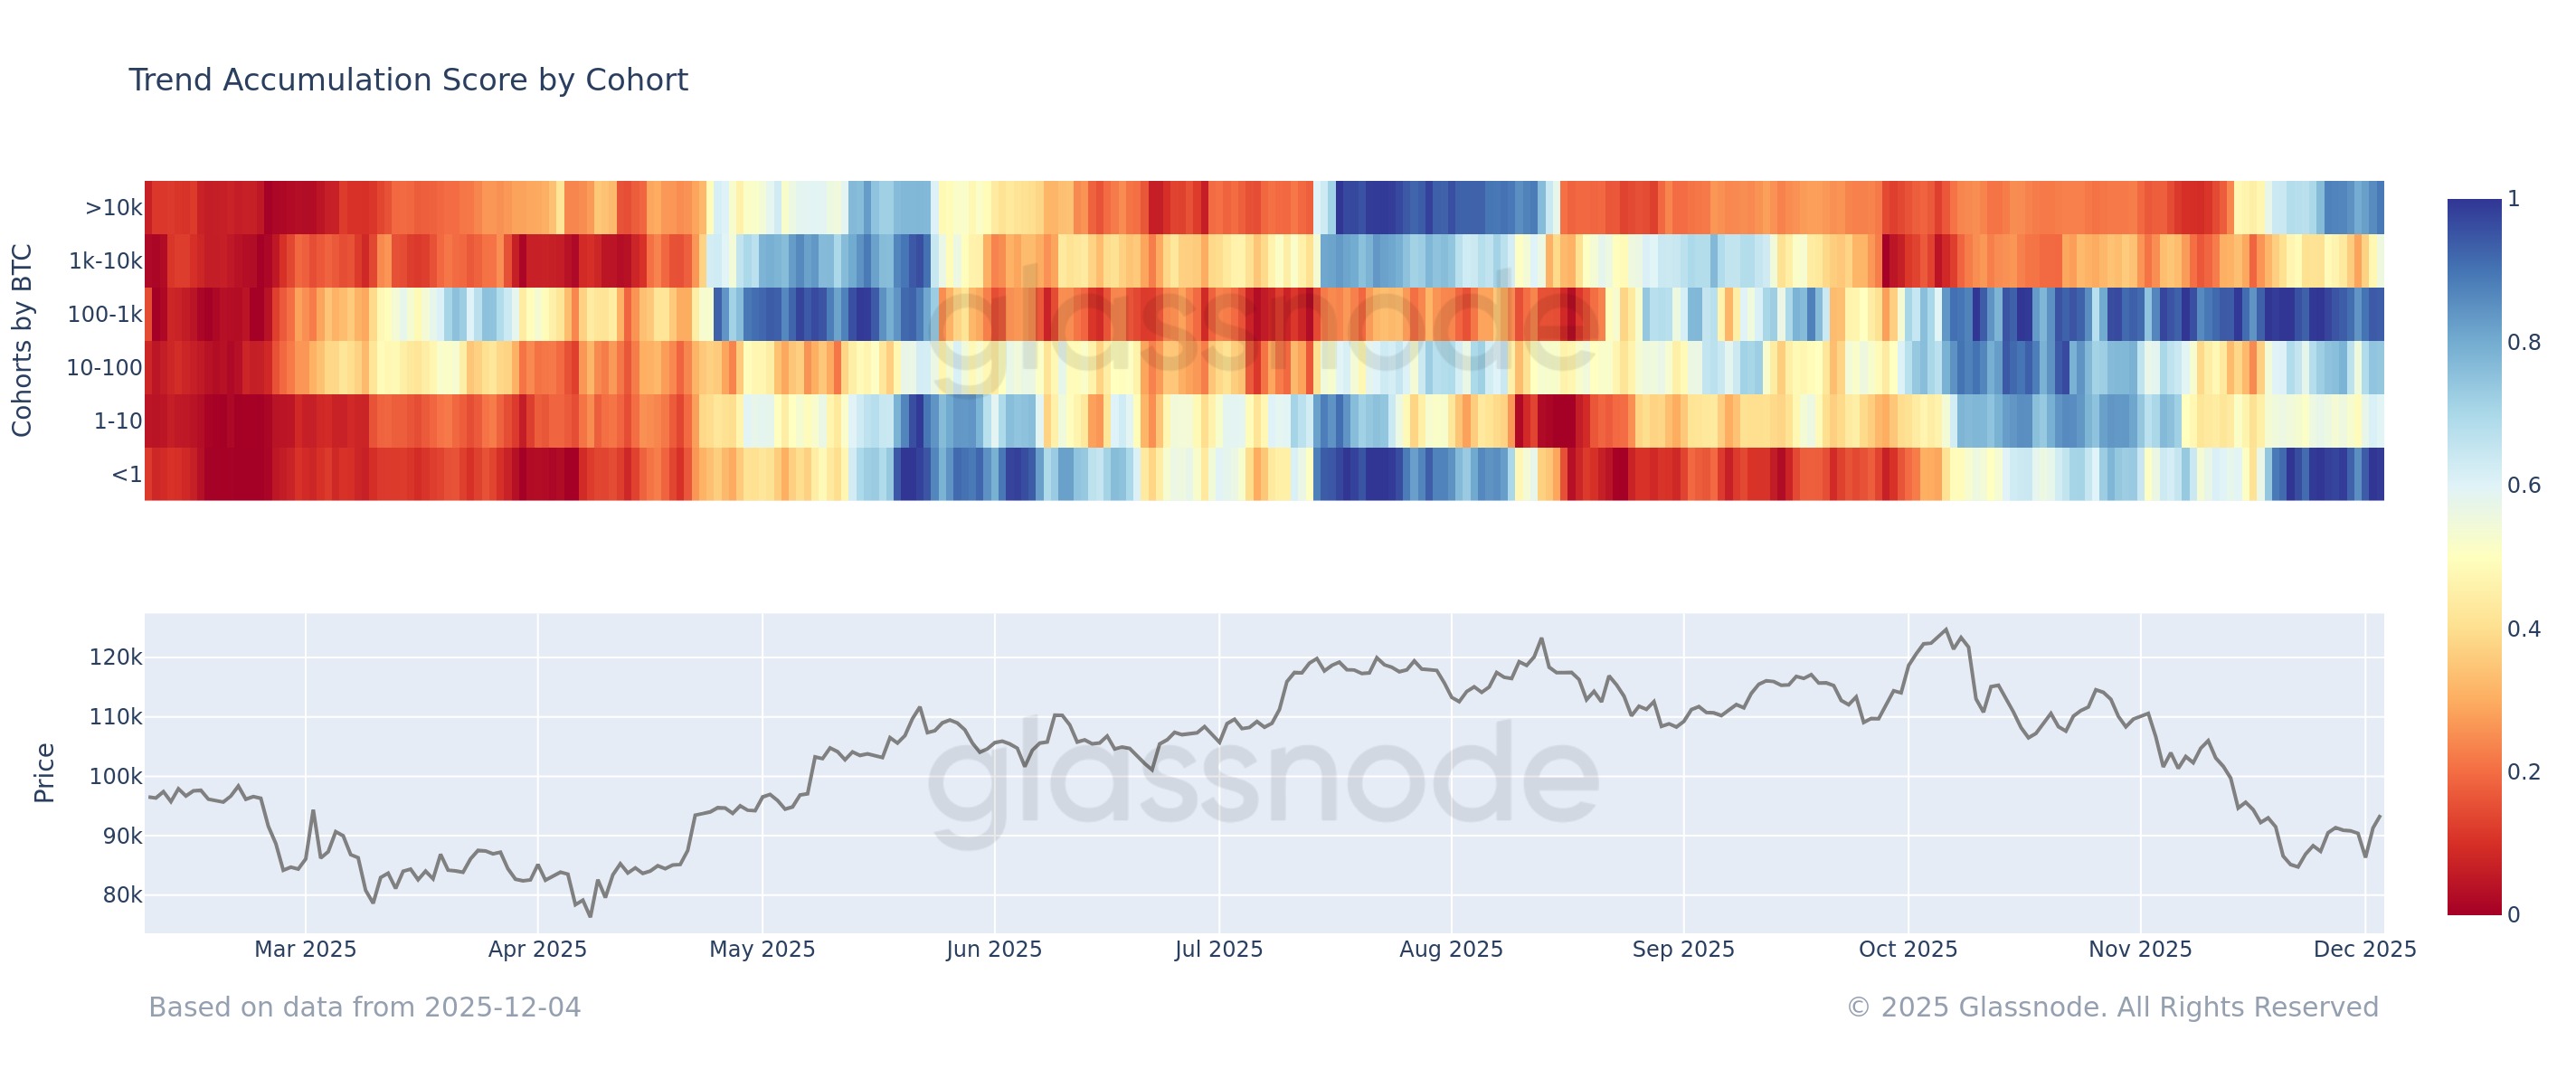
As displayed in the above graph, the Bitcoin Accumulation Trend Score has reflected a varied behavior for the different investor segments during the last couple of months, but very recently, a uniform picture has started to develop.

The smallest of investors in the market, those holding less than 1 BTC, started participating in aggressive accumulation around the time of BTC’s low in November and have since maintained the indicator nearly at a perfect value of 1. This suggests that retail investors have been buying the dip.

Meanwhile, the 100 to 1,000 BTC traders, popularly called the sharks, have been accumulating throughout the drawdown that has followed since the early October peak, indicating that these investors haven’t lost conviction despite the deep decline.

The story is a bit different for the whale cohorts, however. The 10,000+ BTC holders, corresponding to the largest of hands on the network, were in a phase of distribution between August and November, but they have finally started accumulating since the price low, although the Accumulation Trend Score isn’t as high as the retail investors in their case.

The 1,000 to 10,000 BTC whale group didn’t stop distributing even after the bottom, but very recently, their score has just breached the 0.5 mark. With this, a uniform behavior has begun to appear on the Bitcoin blockchain, with investors as a whole opting to expand their wallet balance.

It now remains to be seen how long this trend of accumulation will continue.
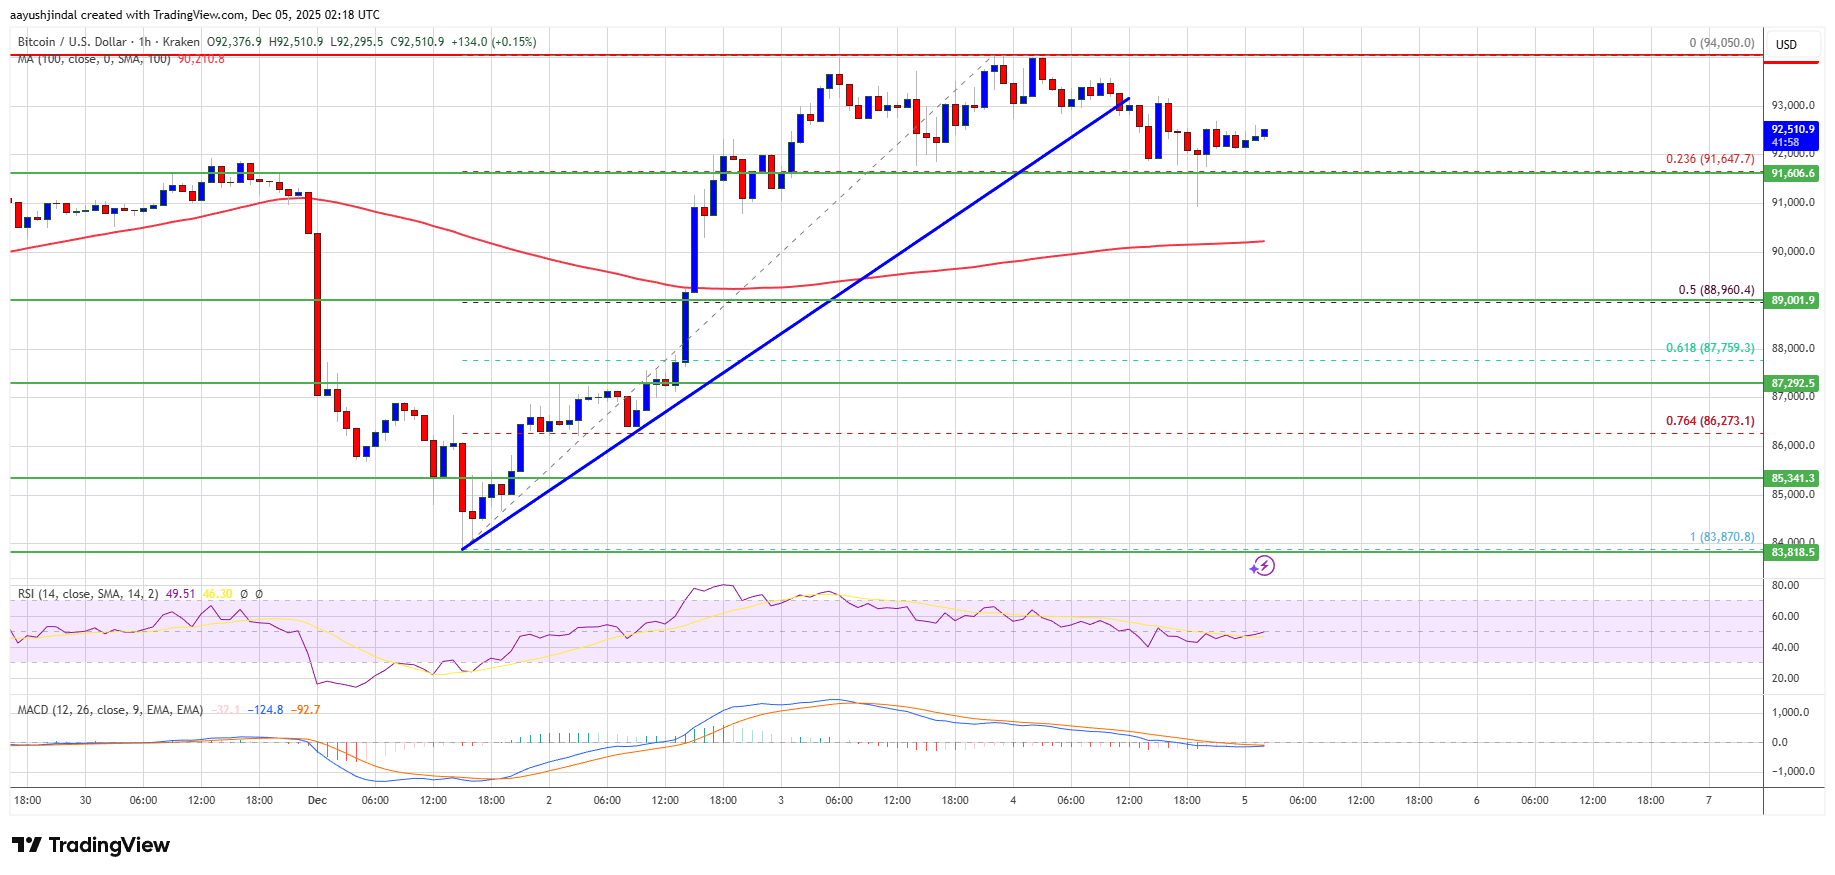
BTC Price

Bitcoin has faced a drop of more than 3% over the last 24 hours that has taken its price to $89,300.

Bitcoin Price Chart

Bitcoin Bull Run Set To Last Until 2027, Analysts Highlight Influential Factors

Many in the crypto space have echoed a familiar sentiment over recent months: “The four-year crypto market cycle is dead.” Experts from the Bull Theory assert that while the four-year cycle may have come to an end, the Bitcoin bull run itself is merely delayed and could stretch until 2027.

Why The Four-Year Cycle May Be Ending

In a recent post on social media platform X, formerly known as Twitter, the Bull Theory analysts noted that the concept of Bitcoin adhering to a neat four-year cycle is weakening. 

They highlighted that significant price movements over the last decade weren’t solely driven by Halving events; rather, they were influenced by shifts in global liquidity. 

The analysts pointed to the current landscape of stablecoin liquidity, which remains high despite recent downturns, indicating that larger investors are still engaged in the market, poised to invest when appropriate macroeconomic conditions arise.

In the US, Treasury policies are emerging as pivotal catalysts. The recent buybacks are notable, but the analysts emphasize that the larger narrative lies in the Treasury General Account (TGA) balance, which is currently around $940 billion—almost $90 billion above its normal range. 

This surplus cash is likely to flow back into the financial system, enhancing financing conditions and adding liquidity that typically gravitates toward risk assets.

Globally, the trends appear even more promising. China has been injecting liquidity for several months, while Japan recently announced a stimulus package worth approximately $135 billion, alongside efforts to simplify cryptocurrency regulations. 

Canada is also moving toward easing its monetary policy, and the US Federal Reserve (Fed) has officially halted its quantitative tightening (QT) measures—a historical precursor to some form of liquidity expansion.

Political And Monetary Factors Align To Create Bullish Condition

The analysts explained that when major economies adopt expansive monetary policies simultaneously, risk assets like Bitcoin tend to respond more rapidly than traditional stocks or broader markets. 

Additionally, potential policy tools, such as the Supplementary Leverage Ratio (SLR) exemption—implemented in 2020 to allow banks more flexibility in expanding their balance sheets—could return, resulting in increased credit creation and overall market liquidity.

There is also a political dimension to consider. President Trump has discussed potential tax reforms, including abolishing income tax and distributing $2,000 tariff dividends. 

Furthermore, the likelihood of a new Federal Reserve chair who supports liquidity assistance and is constructive toward cryptocurrency could bolster conditions for economic growth.

Extended Bitcoin Uptrend

Historically, whenever the Institute for Supply Management’s Purchasing Managers’ Index (ISM PMI) surpasses 55, it has been followed by periods of altcoin season. The probability of this occurring in 2026 appears high, according to the Bull Theory.

The convergence of rising stablecoin liquidity, the Treasury’s injection of cash back into markets, global quantitative easing, the cessation of QT in the US, potential bank-lending relief, pro-market policy shifts in 2026, and major players entering the crypto sector suggests a very different scenario than the old four-year halving model. 

The analysts concluded that if liquidity expands concurrently across the US, Japan, China, Canada, and other significant economies, Bitcoin is unlikely to move counter to that trend.

Therefore, rather than experiencing a sharp rally followed by a prolonged bear market, the current environment indicates a more extended and broader uptrend that could span through 2026 and into 2027.

Bitcoin

Featured image from DALL-E, chart from TradingView.com

Bitcoin Price Slides Below $90,000 – Is A Retest Of The November Lows Near?

Bitcoin (BTC) is retesting a crucial support area after its price slid 5% from the recent highs and fell below the $90,000 barrier. Some analysts have suggested that the cryptocurrency’s structure remains intact, but warned that it must bounce quickly or risk retesting the November lows.

Bitcoin Retests $88,000 After Rejection

On Friday, Bitcoin lost the recently reclaimed $90,000 level, falling to a key support area before stabilizing. The flagship crypto has been attempting to recover from the November market correction, which sent its price to a seven-month low of $80,600.

Since reaching its local lows two weeks ago, the cryptocurrency has traded within a macro re-accumulation range, between $82,000 and $93,500, attempting to break out of this zone on Wednesday, when it reached a multi-week high of $94,150.

However, as the first week of December approaches its end, BTC has lost the upper area of its local range again, falling below its monthly open and tapping the $88,000 support.

Amid the drop, Analyst Ted Pillows noted that BTC has been struggling to reclaim the $94,000 resistance, adding that price “wants to go lower here before another breakout attempt.”  Therefore, he suggested that a bounce back from the $88,000-$89,000 support zone is likely.

Altcoin Sherpa affirmed that the ongoing retest would confirm whether the recent bounce was “just lower highs and price is going lower or if we actually have any juice to bounce to like 100k or something.”

The analyst outlined two potential outcomes. In the first scenario, the flagship crypto would retrace to the $87,000-$89,000 area and bounce above the $93,000-$94,000 resistance levels.

In the second scenario, Bitcoin would continue to move sideways below the local resistance before eventually sliding to the November lows and potentially lower levels. Per the analysis, the leading cryptocurrency must bottom quickly, or it will risk the second outcome.

BTC Shows Shallowing Pullback Tendency

Analyst Rekt Capital also pointed out that Bitcoin continues to face rejection from the range high resistance. However, he considers that investors should not worry as long as the pullback isn’t as big as the previous ones.

If “the rejection is shallower than the previous two, then this resistance will continue to weaken until eventually breached,” he explained, adding that “as long as this weakening continues, BTC should be able to finally breach this resistance over time & try to challenge the multi-week Downtrend above.”

Earlier this week, the analyst affirmed that BTC’s consolidation structure will remain intact as long as Bitcoin closes the week above the range lows. He also noted that its Macro Downtrend, which “has been dictating resistance throughout this phase of the cycle,” remains the dominant structural barrier and the level to break.

As the price stabilized between the $88,500-$89,350 area, the analyst added that today’s retracement “continues to be a shallower pullback than the previous two,” which keeps the range “‘retrace shallowing’ tendency” intact.

He noted that Bitcoin could technically drop into the ascending two-week support trendline, or tap the $86,000 level and still perform a shallower correction than the recent 10% drop.

As of this writing, Bitcoin is trading at $89,400, a 2.9% decline in the daily timeframe.

Bitcoin, btc, btcusdt

Bitcoin Price Faces Potential 60% Decline As Expert Warns Of ‘Major Bull Trap’

Despite the Bitcoin price recovery above the crucial $90,000 threshold—a level that has historically served as a supportive floor for the cryptocurrency—the market is exhibiting signs that a further correction may be imminent. 

Bitcoin Price Recovery At Risk?

Market expert Rekt Fencer recently shared insights on social media platform X, formerly known as Twitter, suggesting that the Bitcoin price might be forming what he calls a “massive bull trap.” 

This term refers to a deceptive bullish signal in which the price briefly surpasses a resistance level, in this case, the $90,000 mark, only to reverse into a decline. Such movements can entrap investors who bought in during the peak, leading to significant losses.

Fencer pointed out a troubling pattern reminiscent of early 2022 when Bitcoin reclaimed its 50-week moving average (MA)—currently positioned above $102,300—before experiencing a severe decline of roughly 60%, plummeting below $20,000 by June of that year. 

Bitcoin price

He indicated that the recent price recovery following major drops to $84,000 should not be interpreted as a signal of near-term success, especially since the Bitcoin price is currently trading under the 50-week MA.

If historical trends repeat, this could mean that Bitcoin might see a significant drop, potentially reaching around $36,200, which could potentially represent the low point of the bearish cycle for the cryptocurrency. On the other hand, there are analysts who retain a bullish outlook. 

BTC Bottom In Sight? 

Market researcher and analyst Miles Deutscher expressed a confident sentiment, stating he believes there is a 91.5% likelihood that the Bitcoin price has hit its bottom, based on his analysis of key developments. 

He noted that recent weeks have been dominated by negative news stories, including concerns surrounding Tether (USDT) and the implications of China’s actions on crypto, which he asserts often mark local price bottoms.

Moreover, Deutscher pointed out a shift in market flows from predominantly bearish to bullish. He explained that the trading environment has recently seen a resurgence in buying momentum, with large investors, or “OG whales,” ceasing their selling. This change has been reflected in the order books, indicating a possible stabilization in market sentiment.

Additionally, the liquidity landscape appears to be shifting, with market conditions tightening in recent months. The potential appointment of a new Federal Reserve chair known for dovish policies, coupled with the official end of quantitative tightening (QT), could further influence market dynamics in favor of buyers.

Deutscher concluded by emphasizing that given the extreme levels of fear, uncertainty, and doubt (FUD) in the market, combined with improvements in trading flows, he believes that the odds favor the notion that the Bitcoin price has indeed reached its bottom.

Featured image from DALL-E, chart from TradingView.com 

Bitcoin Treasury Company Is About To List on The New York Stock Exchange

On 3rd December, official filings and press releases announced Twenty One Capital’s upcoming debut on the New York Stock Exchange (NYSE), positioning the company as one of the largest Bitcoin treasury firms ever to enter public markets. The listing brings a dedicated Bitcoin balance sheet into Wall Street’s core ecosystem, signaling a structural shift in how institutional investors can gain long-term BTC exposure.

A Bitcoin Treasury Giant Steps Onto The NYSE Stage

Twenty One Capital’s NYSE entry is anchored by its business combination with Cantor Equity Partners (CEP), the SPAC serving as the public-market vehicle for the transaction. CEP shareholders have already approved the merger, and the deal is expected to close around December 8. Once completed, the combined entity will operate as Twenty One Capital, Inc. and begin trading on December 9 under the ticker XXI. 

The original announcement, released through official press channels and SEC-related filings, emphasized CEP’s central role in enabling the listing and establishing the company’s public-market structure. CEO Jack Mallers also highlighted the milestone on X, noting the company’s readiness for its debut.

According to this press announcement, Twenty One Capital will debut with an estimated 43,500 BTC, a reserve valued near $4 billion at recent market levels. This immediately places it among the top corporate Bitcoin treasuries globally. Unlike companies that hold Bitcoin as a secondary reserve, Twenty One is specifically engineered around a Bitcoin-native model. The firm intends to report “Bitcoin-per-share,” providing investors a transparent look at how much BTC each equity unit represents. It also pledges full, on-chain proof-of-reserves, positioning itself as a high-transparency asset custodian at launch.

This model effectively transforms Twenty One into a regulated balance-sheet wrapper for Bitcoin. It lowers operational friction for institutional allocators who want direct BTC exposure without the complexities of crypto custody, self-storage, or exchange-based acquisition. By listing on the NYSE rather than relying on ETFs or derivatives, Twenty One creates a regulated public equity vehicle that holds, safeguards, and transparently tracks Bitcoin for institutional and retail investors alike.

Wall Street’s New On-Ramp To Institutional BTC Exposure

The market impact of Twenty One’s listing reflects the accelerating integration of Bitcoin into mainstream financial architecture. The company’s backers—including Tether-linked entities, Bitfinex-aligned interests, SoftBank-connected capital, and Cantor’s public-markets network—provide a cross-sector foundation aimed at bridging crypto-native philosophies with institutional liquidity channels. 

Under this structure, Twenty One aims to become a long-term institutional treasury vessel—a regulated balance sheet that accumulates BTC and gives investors an equity-linked way to participate in Bitcoin’s upside without engaging directly with crypto custody or trading infrastructure.

As the NYSE debut approaches, Twenty One Capital embodies a pivot point where BTC’s role in capital markets shifts from speculative asset to institutional treasury instrument. If XXI attracts sustained flow, it could set a new blueprint for how corporate entities engage with Bitcoin—anchoring Wall Street’s next phase of digital-asset adoption.

Bitcoin price chart from Tradingview.com

Binance Founder Crushes Bitcoin Critic In Game-Changing BTC Vs. Gold Debate

The Binance Blockchain Week event in Dubai became the center of a high-stakes showdown between traditional and digital innovation, with Bitcoin and gold going head-to-head. Investors, tech enthusiasts, and financial experts watched closely as Binance founder Changpeng Zhao expertly debated renowned Bitcoin critic Peter Schiff, making a compelling argument for why Bitcoin is better than gold. 

Binance Founder Dominates Bitcoin And Gold Debate

During the Binance Blockchain Week in Dubai, Schiff and CZ faced off in a high-profile debate over the value of Bitcoin versus Gold. Schiff defended gold as a safe, stable, and tangible asset while the Binance founder made a compelling case for Bitcoin’s adoption, utility, value, and global reach. 

Throughout the debate, which lasted over an hour, CZ consistently demonstrated the practical advantages of Bitcoin, leaving Schiff’s gold argument largely on the defensive. The Binance founder emphasized Bitcoin’s transparent and predictable supply and its role in the modern financial systems. He pointed to hundreds of millions of users who rely on Bitcoin for payments, savings, and transfers. 

Schiff argued that Bitcoin lacks inherent value and is mainly driven by hype and faith that its price will rise. He stated that gold remains tangible, centuries old, scarce, and valuable in industry, making it superior to BTC. He further asserted that “nobody needs” Bitcoin and that the cryptocurrency is “backed by nothing.”

Practical demonstrations played a key role in the debate between Schiff and CZ. The Binance founder explained how Bitcoin and crypto payments already improve financial efficiency, especially in emerging markets. Schiff questioned whether these transactions truly count as money, since merchants ultimately receive traditional currency. CZ’s response highlighted the importance of adoption and network effects, noting that people who use BTC directly for payments give it real-world significance.

The debate also considered the preferences of younger generations. CZ asked Schiff whether millennials and Gen Z favoured Bitcoin or gold. The Bitcoin critic responded sharply, suggesting that they would choose gold. He pointed out that, with many young investors losing money on BTC, gold offers a safer, more appealing alternative. The Binance founder countered that younger people understand digital value more intuitively and prefer mobile, borderless, and censorship-resistant assets. 

Digital Value And The Future Of Money

The debate between CZ and Schiff also highlighted the changing definition of money. Bitcoin functions as a decentralized network that enables instant settlement and transparent verification. Its adoption has also helped evolve the financial economy, facilitating faster and more seamless cross-border payments. Schiff argued that gold’s scarcity and industrial demand preserve its value and make it a reliable hedge against economic uncertainty. 

Tokenization also became a point of agreement during the discussion, with Schiff emphasizing that gold can be digitized and tokenized for easier ownership and distribution without moving the physical metal. CZ contended that Bitcoin offers similar advantages while also enabling global financial inclusion. They also discussed the supply of both assets, with the Binance founder noting that Bitcoin has a visible supply, while gold doesn’t. 

They also talked about the performance of both assets over the years. Schiff argued that gold had outperformed BTC over the past four years. CZ contended that Bitcoin has far outpaced gold over the last 8 years, and since its launch in 2009, it has skyrocketed from a few cents to an ATH above $126,000. He concluded his debate, predicting that Bitcoin’s growth will outpace gold over time.

Bitcoin

Here’s Why Bitcoin Volatility Sparks Fresh Attention On MicroStrategy

The Bitcoin price volatility is once again drawing attention to MicroStrategy, the company whose strategy has become a major market reference point, with billions in accumulated BTC and a track record of aggressive buying during downturns. As traders search for stability in a shaky market, Strategy’s stance is being watched closely for what it might signal about the next phase of BTC’s trend.

Why MicroStrategy’s Next Move Could Redirect Market Momentum

Bitcoin’s recent volatility has put MicroStrategy (MSTR), the largest corporate holder of BTC, in the limelight. Walter Bloomberg has revealed on X that analysts are watching closely to see if the company could influence the cryptocurrency’s price if it sells some of its holdings.

According to JPMorgan, Strategy can avoid forced sales as long as its enterprise value-to-BTC holdings ratio stays above 1.0, which currently stands at 1.13 BTC. However, analysts continue to debunk these claims, accusing JPMorgan of spreading misinformation about market manipulation and the company.

Walter stated that if the ratio remains above this level, BTC markets may stabilize and ease recent market pressure. Due to the market pressure, the firm has slowed its BTC purchases, adding 9,062 BTC last month compared to 134,480 BTC a year ago, reflecting a more cautious accumulation approach amid a broader crypto downturn. Its stock has dropped roughly 42% over the past three months.

Additionally, challenges include the potential exclusion from MSCI indices, which could trigger $8.8 billion in passive fund outflows if index funds are forced to divest. However, MicroStrategy holds a $1.4 billion reserve for dividends and interest, helping it avoid selling its BTC even if the price falls further. In the meantime, there is no proof that MicroStrategy is in danger of liquidation.

How Institutional Behavior Builds A Higher Floor For Bitcoin

In a market speculation, Bitcoin is currently experiencing one of the most significant capital migrations in its history, fueled by institutional adoption. Analyst Matthew noted that the current BTC market cycle from 2022 to 2025 has already absorbed an unprecedented amount of new capital, surpassing all previous BTC cycles. This growth is a reflection of the market’s maturity and the ecosystem’s innovative approach to liquidity through regulated instruments.

Bitcoin

Furthermore, the network has incorporated more than $732 billion in fresh capital in the current cycle, surpassing the $388 billion that was injected during the 2018 to 2022 cycle. At that time, the surge helped push BTC market capitalization to an all-time high record of $1.1 trillion, a metric that indicates a much higher aggregate cost base for new institutional investors.

Related Reading: Why Bitcoin Traders Fear A Repeat Of July 2024’s Crash Next Week

Meanwhile, the total settlement volume in the decentralized BTC protocol was approximately $6.9 trillion in just 90 days. Despite this, the number of active on-chain entities dropped from 240,000 to 170,000 per day, which is a reflection of liquidity migration of capital flows into spot ETFs.

Bitcoin

The $13.5 Billion Liquidity Injection That Could Send Bitcoin And Crypto Prices Flying

Bitcoin has been struggling to build momentum in recent weeks, and the return of cash into the system is raising questions about whether this could be the moment that changes the tone of the crypto market. That growing sense of anticipation has already started to show up in prices, with the total crypto market cap climbing more than $250 billion from its $3.016 trillion low on December 2.

What Happened: The Liquidity Injection And Why It Matters

After officially bringing its multi-year quantitative tightening (QT) program to an end, the central bank followed up with a $13.5 billion overnight repo operation, funneled through the New York Fed. Banks brought $13.5 billion in Treasuries to the Fed, the Fed accepted all of it, and instantly injected $13.5 billion of fresh reserves into the system.

The move, which is the second-largest liquidity injection since the COVID-19 crisis, effectively puts an end the steady shrinkage of bank reserves that has persisted for years, easing pressure on short-term funding markets and signaling a more accommodative liquidity environment.

The crypto market responded almost instantly. A handful of major assets began turning green within hours of the injection, with Bitcoin leading the charge with an instant break above $92,000.

The influx was visible at a macro level as well: the total crypto market cap climbed from a December 2 low of $3.016 trillion to $3.269 trillion by December 4. A gain of more than $250 billion in under 48 hours

What Investors Should Watch Next

Ending QT leads to better liquidity and often create a bullish environment for equities and other riskier investments like cryptocurrencies. However, although a single liquidity event does not guarantee a sustained multi-month rally, this injection stands out not just for its size but for what it represents. 

Related Reading: 4 Bitcoin Indicators That Led To Market Rallies In The Last 2 Years Have Returned

In a CNBC interview, Fundstrat’s Tom Lee stated that the Fed’s decision to stop QT will be a turning point for the cryptocurrency market. Lee pointed out that the last time the Fed ended QT, the market rose about 17% within three weeks.

The previous time the Fed brought quantitative tightening to a stop was in July 2019, roughly a year after it began reducing its balance sheet. In the three weeks that followed, the S&P 500 climbed about 5%. Bitcoin’s also initially rallied in the same period, but its strongest reaction came months after, towards late 2019 and early 2020.

Bitcoin

Large-Scale Bitcoin Outflow: Matrixport Removes $352.5M From Binance

Bitcoin is holding firmly above the $92,000 level after several days of relief and a stronger-than-expected rebound across the market. Yet despite the positive price action, analysts remain deeply divided. Some interpret this move as a classic relief rally within a broader downtrend, warning that the macro structure still favors a deeper correction.

Others see the recent recovery as the first sign that Bitcoin may be stabilizing and preparing for another bullish phase. The uncertainty reflects the conflicting signals coming from both derivatives and spot markets.

Adding fuel to the discussion, new on-chain data from Arkham shows that Matrixport withdrew 3,805 BTC—worth approximately $352.5 million—from Binance within the last 24 hours. This is a significant development, as Matrixport is one of Asia’s largest crypto financial service platforms, founded by Jihan Wu, the co-founder of Bitmain. The firm provides institutional-grade investment products, lending, trading, and asset management solutions to high-net-worth clients and funds across the region.

Maxiport Bitcoin Withdrawals | Source: Arkham

Large withdrawals from exchanges by institutions like Matrixport often signal accumulation, reduced selling pressure, or repositioning for custody and long-term holding. Combined with Bitcoin’s stabilization above $92K, this data adds an important layer of complexity to the current market outlook.

Institutional Positioning and a Changing Macro Landscape

Matrixport’s withdrawal of 3,805 BTC from Binance signals a potentially meaningful shift in institutional positioning. Large entities rarely move this size of capital without intention. Such withdrawals typically imply reduced selling pressure and a preference for custody over exchange liquidity, often interpreted as quiet accumulation.

For a firm managing billions in client assets, reallocating Bitcoin off exchanges suggests growing confidence in medium-term price stability or an expectation of improving market conditions.

This move arrives at a pivotal moment in the global macro environment. The Federal Reserve has ended Quantitative Tightening (QT), marking a major transition from liquidity withdrawal to a more accommodative stance. Historically, the end of QT has preceded periods of asset reflation, as systemic liquidity begins to stabilize.

At the same time, Japanese bond yields have surged, signaling stress in one of the world’s most influential funding markets. A spike in Japanese yields often triggers global liquidity adjustments, particularly through the carry trade, which can ultimately redirect capital toward risk assets—including Bitcoin.

Additionally, markets expect the Federal Reserve to cut interest rates soon, further easing financial conditions. Lower rates weaken the dollar, reduce funding costs, and typically stimulate inflows into alternative and high-beta assets.

In this environment of softening monetary policy and rising liquidity, Matrixport’s aggressive Bitcoin accumulation could reflect growing institutional conviction that the worst of the downturn is behind us—and that Bitcoin may be entering a more favorable macro phase.

BTC Price Analysis: Testing Recovery Momentum

Bitcoin’s daily chart shows the market attempting to stabilize after the sharp decline that pushed price toward the mid-$80,000s. The rebound into the $91K–$93K zone marks the first meaningful recovery attempt, but the structure still reflects caution.

BTC testing critical demand level | Source: BTCUSDT chart on TradingView

BTC remains below the 50-day and 100-day SMAs, which have both started to slope downward, signaling that the broader trend has not yet shifted back in favor of the bulls. Until Bitcoin reclaims these moving averages with strong volume, the market will likely see this move as a relief rally rather than a confirmed reversal.

Price is currently consolidating above the 200-day SMA, a level that often acts as a long-term trend gauge. Holding this region is essential; losing it would risk a deeper drop toward earlier support zones near $82K–$84K. Volume activity during the bounce shows some improvement, yet it remains far below the levels seen during the late-October peak, suggesting that buyers are cautious and large players are not fully engaged.

The chart also shows a clear lower-high structure forming since September, confirming the bearish pressure that has dominated the last several weeks. For sentiment to shift decisively, BTC must break above $95K and rebuild momentum toward the psychological $100K mark. Until then, volatility and hesitation remain the defining features of this recovery.

Featured image from ChatGPT, chart from TradingView.com

Bitcoin Must Break $97K To Restore Confidence Among Youngest Long-Term Holders – Details

Bitcoin is trading around $91,000 after a minor dip earlier today, and uncertainty continues to dominate sentiment. The market sits at a crossroads: a small but vocal group of analysts argues that the recent correction served as a healthy reset before a continuation of the broader uptrend, while the majority of traders believe the first leg of a new bear market is already underway. With price action still showing hesitation, the debate grows louder by the day.

According to top analyst Darkfost, a critical threshold will help determine Bitcoin’s next major direction. He highlights the importance of the Realized Price of the youngest Long-Term Holder (LTH) band, which currently sits at $96,956. This metric marks the transition point between short-term and long-term holders and is viewed as a psychological and structural barrier for market stability.

Reclaiming this level would push these young LTHs back into a comfortable profit zone, reducing their incentive to sell and helping to restore confidence across the market. Until Bitcoin closes decisively above $97K, Darkfost warns that caution is warranted, as volatility remains high and the risk of further downside persists.

Why the $97K Threshold Matters for Bitcoin’s Next Major Move

Darkfost emphasizes that the $96,956–$97,000 zone plays a crucial role in shaping Bitcoin’s next phase. This level represents the Realized Price of the youngest Long-Term Holder band, meaning it reflects the average cost basis of investors who recently transitioned from short-term to long-term holding behavior. When Bitcoin trades below this threshold, these holders sit at an unrealized loss, increasing the likelihood of panic selling and adding pressure to the market.

Bitcoin Realized Price UTXO Age Bands

Breaking above this zone would flip sentiment for this group almost immediately. Darkfost explains that reclaiming $97K would place these investors back into a comfortable profit position, restoring their confidence and expectations of potential gains. Once this psychological weight lifts, these holders typically choose to keep accumulating rather than selling, which naturally brings more stability to the market.

However, he cautions that Bitcoin’s failure to close above $97,000 keeps the risk tilted to the downside. As long as the price remains below this band, the market stays vulnerable, and volatility may continue.

Even if BTC successfully reclaims $97K, Darkfost reminds that this is only the first step. The market would still need stronger structural confirmation—such as reclaiming key moving averages and rebuilding demand—to validate a true bullish reversal that could eventually lead to a new all-time high.

BTC Weekly Structure Shows Early Signs of Stabilization

Bitcoin’s weekly chart reflects a market trying to stabilize after a sharp multi-week correction that dragged the price from above $115,000 down toward the mid-$80,000s. The latest weekly candle shows a firm rebound from the 100-week moving average (green line), now acting as dynamic support around the $84,000–$86,000 region. This level historically attracts long-term buyers, and the strong wick rejection confirms renewed demand.

BTC consolidates around key level | Source: BTCUSDT chart on TradingView

BTC is currently trading near $91,300, sitting just below the 50-week moving average (blue line), which now acts as resistance. A clean reclaim of this moving average—currently positioned around $95K–$97K—would significantly improve the technical outlook and align with on-chain signals calling for a recovery. Until then, the trend remains neutral-to-bearish on higher timeframes.

Volume during the recent bounce stands out, showing one of the strongest buying reactions since early 2025. This suggests that long-term holders and institutional buyers may be stepping in as the price approaches key value zones.

However, Bitcoin is not out of danger. Failures to break above $97K would leave the structure vulnerable to another leg down, potentially retesting $86K or even deeper liquidity pockets around $80K.

Featured image from ChatGPT, chart from TradingView.com

Bitcoin’s Latest Drop Isn’t Just Another Correction, But A Clear Capitulation Event – Here’s Why

After a brief moment of bullish performance in Bitcoin, the price experienced a sudden pullback due to a broader market shakedown, which caused BTC to revisit the $90,000 threshold. While this pullback has sparked a frenzy in the cryptocurrency community, on-chain data has revealed a shocking trend about the sudden pullback.

True Capitulation, Not A Routine Bitcoin Pullback

The market was rocked by a recent decline in the price of Bitcoin, but this pullback comes with an extra layer. Alphractal, an advanced investment and on-chain data analytics platform, has shed crucial insights about the decline using several key indicators to determine the unseen trend.

After carrying out its research, the on-chain platform revealed that the latest Bitcoin drop was not just another correction, but a clear instance of a capitulation event. This abrupt turnaround seems to have embodied all the characteristics of a full-scale capitulation event. These include an emotional flush-out when panic selling, forced liquidations, and intense dread came together in one dramatic moment.

Alphractal’s reading is backed by three major signals that rarely show up together, suggesting a pivotal moment for BTC. Such a trend may be the turning point that reshapes the short-term trajectory of the crypto king.

The first signal highlighted by the platform comes from the Bitcoin Hash Rate, which has witnessed a steady decline over the last 30 days. Presently, miners are turning off their machines, triggering heightened pressure on the ecosystem. When miners begin to lose money, it typically implies that the market might have reached its peak.

Another signal is coming from the BTC price drawdown. After a fast, violent drop, the metric is hitting extreme levels beyond the historical median. This is not just a technical drop, but it’s pain, triggered by forced selling and liquidation.

A Rare Trend And A Good Entry Opportunity

Finally, the last signal is the recent spike in active supply as those holding BTC for months or years have begun spending their coins. A behavior of this kind only unfolds when investors exhibit heightened caution, causing sentiment to drop. 

An interesting aspect about this trend is that when these 3 signals flash in unison, the Capitulation Oscillator tends to rise. This is a moment that nearly always denotes the conclusion of a downward trend or a leveling phase, as was the case in 2021.

Bitcoin

While it has played out in previous scenarios, it is not a guarantee of an immediate bottom. However, moments like these have historically been uncommon and frequently present opportunities that only occur once or twice every cycle, especially for those rooted in on-chain data.

Joao Wedson, the founder of Alphractal, also confirms these signals, which point to real capitulation. According to Wedson, the recent correction was the most severe capitulation event since 2022. 

Nonetheless, this has traditionally led to the formation of long accumulation regions before the price makes its next macro direction. In other words, Wedson noted that the highest probability scenario is that 2025 will end in a broad sideways range; a classic phase of accumulation or redistribution.

Bitcoin

Crypto-TradFi Link Deepens: Kraken & Deutsche Börse Partner Up

Kraken and Deutsche Börse has announced a strategic partnership that will integrate crypto with traditional market infrastructure.

Kraken And Deutsche Börse Have Partnered Up

As announced in a press release, US-based digital asset exchange Kraken has teamed up with Deutsche Börse Group to bridge crypto and traditional finance and deliver institutional investors access across asset classes.

Headquartered in Frankfurt, Deutsche Börse Group is one of the biggest financial market infrastructure providers in the world. It operates the Frankfurt Stock Exchange, which ranks the 12th largest in market cap globally.

In the first phase of the partnership, Kraken will integrate directly with 360T, a subsidiary of the German multinational corporation that provides foreign-exchange trading services. This integration will provide Kraken clients access to the latter’s foreign-exchange liquidity.

The partnership will go the other way, as well. Via Crypto Finance, another Deutsche Börse subsidiary, and Kraken, Deutsche Börse Group clients will be able to trade cryptocurrencies and derivatives.

The two firms also plan to leverage Kraken Embed, the crypto trading infrastructure solution created by Kraken, to provide institutions in Deutsche Börse Group’s network with digital asset access.

The press release noted:

Together, the companies will develop advanced white-label solutions enabling banks, fintechs, and other financial institutions to offer secure, compliant crypto trading and custody services to clients across Europe and the U.S.

Another thing Kraken and Deutsche Börse Group are collaborating on is integration of xStocks in the ecosystem of 360X, Deutsche Börse’s tokenized trading venue. xStocks is a stock tokenization standard that has been gaining adoption. Kraken announced the acquisition of Backed, the company behind xStocks, just this Tuesday.

Arjun Sethi, Kraken Co-CEO, said:

By linking traditional and digital markets across a wide range of asset classes, we’re building a holistic foundation for the next generation of financial innovation: defined by efficiency, openness, and client access.

The companies are also looking to make derivatives listed on Deutsche Börse Group’s Eurex, the largest futures and options marketplace in Europe, available on Kraken, if regulators provide the nod.

Stephan Leithner, Deutsche Börse CEO, noted:

This collaboration with Kraken is a great strategic fit for Deutsche Börse Group. It underscores our ongoing commitment to shaping the future of financial markets by combining the trust and resilience of our regulated infrastructure with the innovation of the digital asset ecosystem.

Back in October, the German organization also announced another crypto partnership, this one with USDC issuer Circle. The collaboration aimed to integrate the latter’s USD and EUR stablecoins in the former’s infrastructure to boost stablecoin adoption in Europe.

Bitcoin Price

At the time of writing, Bitcoin is trading around $92,500, up 1% over the last week.

Bitcoin Crypto Price Chart

New Crypto Bank Launches In The US – CEO’s Remarks And Contrasts With Signature Bank

A new player has emerged in the world of cryptocurrency banking, with a team of former executives from the collapsed Signature Bank at the helm. The establishment of N3XT comes nearly three years after Signature Bank’s downfall in March 2023, which significantly impacted the crypto industry.

Former Signature Bank Leaders Establish N3XT

According to a report by Reuters, the newly founded blockchain-based bank aims to facilitate instant US dollar payments around the clock, led by Scott Shay, who served as the founder and chairman of the Signature Bank. Jeffrey Wallis, the former director of digital assets at Signature, will take on the role of CEO at N3XT.

Per the report, N3XT will operate under a special-purpose bank charter in Wyoming and has decided to avoid typical lending activities, which were at the heart of the collapsed Signature Bank. 

“Every dollar of deposits will be backed by cash or short-term U.S. Treasuries,” Wallis explained, noting that the bank will publish its reserve holdings daily. 

This sets N3XT apart from its predecessor, Signature Bank, especially given that its reserves will be held with custodial partners, though Wallis did not disclose their names. 

Importantly, N3XT will not be insured by the Federal Deposit Insurance Corporation (FDIC) since Wyoming special-purpose banks are not required to obtain such insurance.

The collapse of Signature Bank, along with the failures of Silvergate Bank and Silicon Valley Bank, pointed to a troubling trend among banks with significant uninsured deposits and ties to the cryptocurrency sector. Rising interest rates and a loss of depositor confidence culminated in bank runs that led to their downfall.

Solutions For Crypto Clients 

Addressing concerns about the safety of client assets, Wallis reassured potential customers in the crypto industry, stating, “We do not lend against our balance sheet, so clients always have confidence that their capital is available to them and is never at risk.” 

He emphasized that the newly established  bank is designed to offer a new and “unique banking structure,” ensuring that clients’ liquidity is readily accessible according to their economic needs.

Wallis further distinguished N3XT’s approach to risk management from that of Signature Bank, which was criticized for “poor management” and a focus on “rapid, unrestrained growth” with little attention to risk. 

“We are not making any lending decisions with the balance sheet,” Wallis reiterated. “We are keeping our clients’ assets in full liquid form.” N3XT will reportedly focus on catering to crypto clients, many of whom Wallis mentioned are already in the onboarding process.

Crypto

As of this writing, Bitcoin (BTC), the market’s leading crypto, is trading at $92,834. It has consolidated above the key $90,000 support level for the past few days, sparking new hopes for a potential recovery above $100,000 by the end of the year. 

Featured image from DALL-E, chart from TradingView.com 

Bitcoin Market Structure Echoes 2022 Bear Start, Glassnode Warns

On-chain analytics firm Glassnode has pointed out how the current Bitcoin market is reminiscent to the structure from the first quarter of 2022.

Bitcoin Dynamics Are Currently Looking Similar To Early 2022 Bear Market

In its latest weekly report, Glassnode has discussed about how the broader Bitcoin market structure is starting to resemble Q1 2022. First, the analytics firm has shared the data of its Supply Quantiles Cost Basis Model, highlighting price levels that correspond to a certain degree of investor profitability.

Bitcoin Supply Quantiles

In the chart, three supply quantiles are listed: 0.75, 0.85, and 0.95. If Bitcoin trades at the first of these levels, 75% of the supply will be in profit. Similarly, the latter two correspond to 85% and 95% profitability, respectively.

It’s visible in the graph that Bitcoin has recently fallen below all three of these levels, indicating more than 25% of the cryptocurrency’s supply is now underwater. “This creates a fragile balance between the risk of top-buyer capitulation and the potential for seller exhaustion to form a bottom,” explained Glassnode.

BTC similarly broke below the 0.75 quantile back during the sideways market of early 2022. Another indicator that reinforces the resemblance is the Total Supply in Loss, which measures, as its name suggests, the amount of the Bitcoin circulating supply that’s being held at some net unrealized loss.

Below is a chart showing the 7-day moving average (MA) trend in the metric.

Bitcoin Supply in Loss

As displayed in the graph, the 7-day MA Bitcoin Total Supply in Loss hit a high of 7.1 million BTC last week, which is the highest that it has been since September 2023, more than two years ago.

The analytics firm noted:

The current scale of supply in loss, ranging between 5M–7M BTC, is strikingly similar to the early-2022 sideways market, further reinforcing the resemblance noted above.

Finally, the Bitcoin long-term holder Spent Output Profit Ratio (SOPR) also implies that the current market structure is mirroring Q1 2022. This metric tells us, in short, whether the Bitcoin investors holding since more than 155 days ago are selling their coins at a profit or loss.

Bitcoin LTH SOPR

The Bitcoin long-term holder SOPR has witnessed a sharp decline recently, but its value is still above 1, indicating the long-term holders are selling at some net profit. With its current value of 1.43, however, there has been a notable shrinkage in the profit margins of the cohort.

It now remains to be seen whether the trends in these indicators mean that the cryptocurrency is on the cusp of a bear market transition like in early 2022, or if a rebound will come before long.

BTC Price

Bitcoin has seen a slight pullback during the past day as its price has dropped to $91,800.

Bitcoin Price Chart

Bitcoin Inflows Now At $732 Billion This Cycle, Report Reveals

A new report has revealed that a total of $732 billion in capital has flowed into Bitcoin this cycle, more than all other cycles combined.

Bitcoin Has Seen Historic Growth In Realized Cap This Cycle

On-chain analytics firm Glassnode has released its Q4 2025 Digital Assets Report in collaboration with crypto investment firm Fasanara Digital, shedding light on how the market landscape has developed in the fourth quarter of 2025.

One of the things the report has talked about is the trend in the Realized Cap of Bitcoin. This capitalization model calculates the total value of the cryptocurrency by assuming the the value of each individual token is equal to the price at which it was last transacted on the blockchain.

The last transaction of any token is likely to represent the last time it changed hands, so the price at its time could be considered as its current cost basis. As such, the Realized Cap is a sum of the acquisition values of all coins in circulation. In other words, the model represents the total amount of capital that the investors used to purchase the asset’s supply. Considering this, changes in the indicator naturally correspond to the netflow of capital.

Below is a chart that shows how the Bitcoin Realized Cap has fluctuated over the last few years.

Bitcoin Realized Cap

As displayed in the graph, the monthly change in the Bitcoin Realized Cap has remained positive over the last couple of years, indicating that the network has been enjoying a sustained expansion in stored capital.

The rate of inflows has varied a lot over the cycle, however, accelerating to high levels during rallies and slowing down during flat or bearish periods. Most recently, the monthly increase in the metric hit a high of $39.8 billion in October, but the bearish momentum since then has meant a cooldown to $15 billion.

Following the continued rise in the Realized Cap, its value has reached a new all-time high (ATH) of $1.1 trillion. The report noted that this marks “a historic milestone that underscores Bitcoin’s continued evolution as a globally held, high-liquidity asset.”

The Realized Cap has clearly witnessed a significant amount of growth this cycle. But how does it stack up against the capital inflows of the past cycles? Here is another chart, this one comparing the cumulative Realized Cap change for each cycle:

Bitcoin Cycles

In total, the current cycle has attracted over $732 billion in capital. The last cycle saw $388 billion in inflows, and the two cycles before that about $90 billion combined. Thus, the latest cycle has not only outpaced each of the past cycles, but it has in fact seen a higher Realized Cap increase than all of them combined.

BTC Price

Bitcoin’s latest recovery has so far been holding as its price is trading around $92,800.

Bitcoin Price Chart

Bitcoin Coils Near Highs as Bulls Defend Gains Ahead of Resistance

Bitcoin price started a fresh increase above $92,500. BTC is now consolidating gains and might attempt an upside break above $93,500.

  • Bitcoin started a fresh increase above the $92,500 zone.
  • The price is trading above $92,000 and the 100 hourly Simple moving average.
  • There was a break below a bullish trend line with support at $93,000 on the hourly chart of the BTC/USD pair (data feed from Kraken).
  • The pair might continue to move up if it settles above the $93,000 zone.

Bitcoin Price Faces Resistance

Bitcoin price managed to stay above the $90,000 zone and started a fresh increase. BTC gained strength for a move above the $90,500 and $91,500 levels.

There was a clear move above the $93,000 resistance. A high was formed at $94,050 and the price is now consolidating gains. There was a minor drop to test the 23.6% Fib retracement level of the upward move from the $83,870 swing low to the $94,050 high.

There was a break below a bullish trend line with support at $93,000 on the hourly chart of the BTC/USD pair. Bitcoin is now trading above $92,000 and the 100 hourly Simple moving average.

Bitcoin Price

If the bulls remain in action, the price could attempt another increase. Immediate resistance is near the $92,800 level. The first key resistance is near the $93,000 level. The next resistance could be $94,000. A close above the $94,000 resistance might send the price further higher. In the stated case, the price could rise and test the $95,000 resistance. Any more gains might send the price toward the $95,500 level. The next barrier for the bulls could be $96,200 and $96,450.

Downside Break In BTC?

If Bitcoin fails to rise above the $94,000 resistance zone, it could start another decline. Immediate support is near the $91,650 level. The first major support is near the $90,500 level.

The next support is now near the $88,950 zone or the 50% Fib retracement level of the upward move from the $83,870 swing low to the $94,050 high. Any more losses might send the price toward the $87,750 support in the near term. The main support sits at $87,200, below which BTC might accelerate lower in the near term.

Technical indicators:

Hourly MACD – The MACD is now losing pace in the bullish zone.

Hourly RSI (Relative Strength Index) – The RSI for BTC/USD is now below the 50 level.

Major Support Levels – $91,650, followed by $90,500.

Major Resistance Levels – $93,000 and $94,000.

Bitcoin Enters New Adoption Phase: Vanguard, Schwab, and Japan Fuel BTC Recovery

Bitcoin has climbed back above $93,000 after enduring days of intense selling pressure, heightened volatility, and widespread market uncertainty. The recovery marks a significant shift in sentiment, but according to a new report from CryptoQuant, one signal stands out as the primary driver behind the rebound: institutional capital is quietly flowing back into the market.

The analysis highlights a key metric— the Coinbase Premium Index, long regarded as a reliable proxy for US institutional demand. Throughout November’s steep correction, the premium plunged deep into negative territory, revealing a stark imbalance: US spot buyers were far weaker than their offshore counterparts.

During this phase, as Bitcoin slid below $90,000, the sharp drop in the premium reflected clear risk-off positioning among US-regulated investors, many of whom stepped back or took profits amid rising macro uncertainty.

Now, with Bitcoin recovering key levels, the data shows early signs of renewed accumulation from US-based institutions. This subtle but meaningful shift suggests that the most conservative segment of the market—professional and regulated capital—may be positioning again after the correction. If this trend continues, the rebound above $93K could evolve into a much broader shift in market structure.

Institutional Catalysts Drive Bitcoin Coinbase Premium Higher

According to the CryptoQuant report, the narrative has shifted decisively. The Coinbase Premium Index has climbed back into positive territory, signaling renewed accumulation from US-based institutional and regulated investors. This shift coincides with a wave of major developments reshaping the global investment landscape.

Bitcoin Coinbase Premium Index | Source: CryptoQuant

Most notably, Charles Schwab, a $12 trillion asset manager, announced plans to offer Bitcoin and Ethereum trading in early 2026. This follows Vanguard’s market-moving reversal that opened access to spot crypto ETFs for more than 50 million conservative investors. These firms are not speculative players—they are the backbone of American retirement wealth.

At the same time, a powerful but less publicized catalyst is emerging overseas: Japan is moving toward formal approval of Bitcoin ETFs. Given the size of Japanese investment trusts, pension-linked products, and retail participation, early adoption could inject $3–10 billion of fresh demand. While no single region drives Bitcoin’s valuation alone, combined flows from the US, Europe, and Japan could easily deliver a mid-single-digit percentage uplift to BTC in the early phases of this expansion.

The broader takeaway is unmistakable: Bitcoin is transitioning from a niche risk asset into a globally standardized investment product. The return of a positive Coinbase Premium may be the market’s earliest confirmation that institutions—especially the most conservative ones—are positioning ahead of 2026.

Weekly Structure Shows Early Signs of Recovery

Bitcoin’s weekly chart shows a decisive rebound, with price pushing back above $93,000 after weeks of aggressive selling pressure. The recent wick down toward the green 100-week moving average (100W MA) marked a key moment: buyers stepped in precisely at long-term dynamic support, preventing a deeper breakdown toward the $80,000–$82,000 region.

This reaction confirms that long-term holders and institutional buyers are protecting this level, aligning with the recent return of positive signals from the Coinbase Premium Index.

BTC HoldingKkey Weekly Support | Source: BTCUSDT chart on TradingView

Despite the rebound, the chart still shows Bitcoin facing overhead resistance. The 50-week MA sits just above the price, creating a supply zone between $97,000 and $102,000. This has historically acted as a trend-determining range; reclaiming it would shift momentum decisively back to the bulls. Until then, the market remains in a mid-cycle consolidation.

Volume behavior also supports the recovery narrative. The huge sell-volume spikes seen in November marked capitulation-like behavior, which often precedes trend reversals. The recent green weekly candle forming on rising buy volume suggests that demand is returning, aligning with improving liquidity conditions on major US and global exchanges.

Featured image from ChatGPT, chart from TradingView.com

Reversal Loading? Bitcoin, Ethereum, And Solana Build Powerful High-Time-Frame Structures

In the volatile theatre of the cryptocurrency market, Bitcoin, Ethereum, and Solana are showing signs of a potential high-time-frame reversal. After weeks of stress and price compression, each of the top assets is now stabilizing at key structural support levels. The multiple leading cryptocurrencies are flashing similar recovery setups at the same time.

The current crypto landscape may be setting up one of the most powerful high-time-frame reversals across Bitcoin, Ethereum, and Solana. An investor and trader known as MacroCRG on X highlighted that yesterday, all three assets printed a bullish engulfing candle, a strong signal that buyers are stepping back in with intent.

Market Leaders Hint At A Shift Before Smaller Assets Follow

On the weekly chart, each asset is showing the early stages of an inside-week breakout paired with a false breakdown. MacroCRG pointed out that a similar structure on the ES (S&P 500 futures) chart from April, where the breakdown of inside-week structure led to a breakout that never looked back when the bull secured the weekly close.

Related Reading: Institutions Exit Bitcoin In Large Tranches, Ethereum, Solana And XRP See Massive Buy-Ins

For this setup to take hold, these prices need to close the week above the key highlighted highs on the chart. However, there’s still a long way to go before the weekly close will confirm the breakout, and the bulls need to follow through with conviction and remove any doubt.

The founder of the ProMintClub investment community, ProMint, has spotted a high-conviction whale trader aggressively building long positions across the crypto market. Currently, the trader is leading the Lighter leaderboard with over $64 million in profit and loss, while maintaining an 83% long bias. His Lighter account has the highest profit and loss with over $8 million. These are insane numbers compared to everyone else on the leaderboard.

Bitcoin

Data shows that the trader has made five deposits into his Lighter account, which total around $6 million in capital. His positions are spread across BTC, ETH, SOL, AAVE, along with smaller plays such as PAXG and PUMP, consistently entering at strong timing points and riding momentum higher.

Even though funding costs have flipped heavily negative, he is not backing down. Presently, this is the top-performing account on Lighter, and this is serious capital deployed with conviction.

How Increased Partners Drive Sustained Volume Demand

According to Chainflip Labs, November marked one of the strongest performance months in the protocol’s history, clearing over $583 million in swap volume, which is the second-best month ever for the network. 

Demand remained sustained across BTC, ETH, and SOL routes, and more partners are routing flow through the network than ever before. The trend clearly shows that Chainflip will continue to scale.

Bitcoin

A Bitcoin Parabolic Rally Is Coming: Eric Trump Shares Why First Family Is Pro-Crypto

Bitcoin’s trajectory is becoming a central theme in the first family’s business interests, with Eric Trump explaining why he believes the market is setting up for a dramatic surge. His comments, made in a YouTube interview with Grant Cardone, offered a rare look into how American Bitcoin Corp (ABTC) approaches the crypto industry and why the Trumps consider BTC one of the most important financial opportunities of the decade.

Eric Trump Thinks Parabolic Rally Is Coming For Bitcoin

Eric Trump made it clear that ABTC operates on the conviction that Bitcoin is gearing up for a powerful upward acceleration. American Bitcoin is a publicly traded BTC mining and accumulation company co-founded by Eric Trump in partnership with Hut 8 Corp.

According to Eric Trump, the company is structured to maximize its BTC holdings ahead of that move rather than dilute resources on heavy management costs or constant liquidations. In his words, the comparison with other miners is straightforward because ABTC wants to hold the asset it believes will appreciate sharply instead of turning mined Bitcoin into daily operating cash.

His reasoning is a departure from the traditional mining business model, which typically sells a significant share of its Bitcoin to cover operational costs. Trump insists that ABTC is deliberately positioning itself differently because “we want to be buying the asset that we believe is going to appreciate.”

Eric Trump said BTC’s surge is not limited to ordinary crypto investors but is also driven by the quiet entry of sovereign funds, family offices, and major institutions. He also contrasted Bitcoin with real estate, noting that he now spends more time in crypto because it grows in ways traditional property cannot. 

Real estate is slow and tied to limited cash flow, while Bitcoin scales globally and appreciates far faster. That difference is one of the reasons he expects BTC to reach around $500,000 in the long term, a prediction he offered without hesitation.

ABTC’s Unique Model: Building BTC Per Share

Ashet Genoot, CEO of Hut 8 Corp., expanded on the company’s internal philosophy by explaining how ABTC measures value differently from other publicly traded firms. Instead of focusing on earnings per share, he said their model centers on “Bitcoin per share,” which is a metric that reflects how much BTC each shareholder indirectly controls through the company.

Genoot explained that the question they ask every day is simple: how do we grow the amount of Bitcoin per share? He described their system as a constant pursuit of increasing BTC reserves through multiple channels, whether mining coins at scale or buying them whenever conditions favor accumulation. 

The goal is for every ABTC shareholder to benefit from a rising quantity of BTC over time, turning the company into a long-term accumulator rather than a miner that immediately sells its output to cover expenses.

According to regulatory filings, ABTC operates tens of thousands of ASIC miners under Hut 8’s infrastructure and has accumulated more than 4,000 BTC as of late 2025.

Bitcoin

Bitcoin Market Signals A Pivotal Turning Point – Here Are The Main Drivers Behind It

Several key Bitcoin metrics are beginning to exhibit bullish action once again alongside the renewed upward traction in the asset’s price. With this kind of trend that points to growing momentum, the crypto king appears to be gearing up for a pivotal shift driven by newfound appetite from investors.

A Key Market Shift Unfolding For Bitcoin

Bitcoin has experienced a rebound as the crypto landscape turns bullish again, sending its price back above the $90,000 mark. Following the bounce on Wednesday, the BTC market appears to have reached a critical junction as it hints at an impending shift in the current trend.

Delving into the market performance, Darkfost, an author at CryptoQuant and market expert, has outlined the key driver behind the unfolding shift. In the research shared on the X platform, the expert revealed that the market today is heavily driven by derivatives. In addition to the derivatives-driven market, 2025 has been the most speculative year Bitcoin has ever seen in its existence.

Bitcoin

Another key driver highlighted by the market expert is the actions of investors in the United States and the renewed demand at the institutional level. Darkfost’s research hinges on a critical Bitcoin metric, one that shows the average evolution of the Coinbase Premium Gap in the monthly timeframe and the Spot Bitcoin Exchange-Traded Funds (ETFs) netflows.

Specifically, this metric is the Bitcoin ETF – Netflow USD Vs. Coinbase Premium. It is worth noting that the Coinbase Premium Gap calculates the pricing difference between Coinbase Pro and Binance. This helps illustrate the behavior of different groups of investors. While Coinbase Pro is typically used by institutions and whales, Binance, which has the largest volume, is available to everyone.

The Coinbase Premium Gap decreased from +$109 to -$40 since October 16, when Bitcoin was valued at almost $113,000. Such a drop suggests that institutional investors sharply decreased their positions. 

BTC ETFs Netflows Impact On The Market

Interestingly, the trend was also observed in ETF netflows, which also flipped negative. During the period, BTC fell from $113,000 to $80,000, reflecting how much the US and institutional demand influence the market

As seen in the past, large negative swings have frequently indicated market bottoms, provided that the trend thereafter begins to turn. A trend of this kind is what is playing out in the market today.

However, current data reveals that the Coinbase Premium Gap has bounced back to -$13 while the average ETF netflow is valued at around -$100 million. This comeback in both sectors indicates that in the near term, the situation seems to be improving, and BTC’s price is reacting appropriately to the crucial shift. 

As a result, Darkfost predicts that a new all-time high for BTC may happen quickly if this pattern continues in the long run. The ongoing shift may be subtle, but it is noticeable as the market appears to be preparing for a phase that might largely change the course of Bitcoin.

Bitcoin

❌