Solana (SOL) Slips Further As Bears Target Deeper Support Zones
Solana failed to settle above $132 and extended losses. SOL price is now consolidating losses below $130 and might struggle to start a recovery wave.
- SOL price started a fresh decline below $132 and $130 against the US Dollar.
- The price is now trading below $130 and the 100-hourly simple moving average.
- There is a key bearish trend line forming with resistance at $126 on the hourly chart of the SOL/USD pair (data source from Kraken).
- The price could start a recovery wave if the bulls defend $118 or $115.
Solana Price Dips Further
Solana price failed to remain stable above $132 and started a fresh decline, like Bitcoin and Ethereum. SOL declined below the $130 and $126 support levels.
The price gained bearish momentum below $122. A low was formed at $117, and the price is now consolidating losses. The price recovered a few points and climbed above the 23.6% Fib retracement level of the downward move from the $132 swing high to the $117 low.
Solana is now trading below $130 and the 100-hourly simple moving average. On the upside, immediate resistance is near the $125 level or the 50% Fib retracement level of the downward move from the $132 swing high to the $117 low.
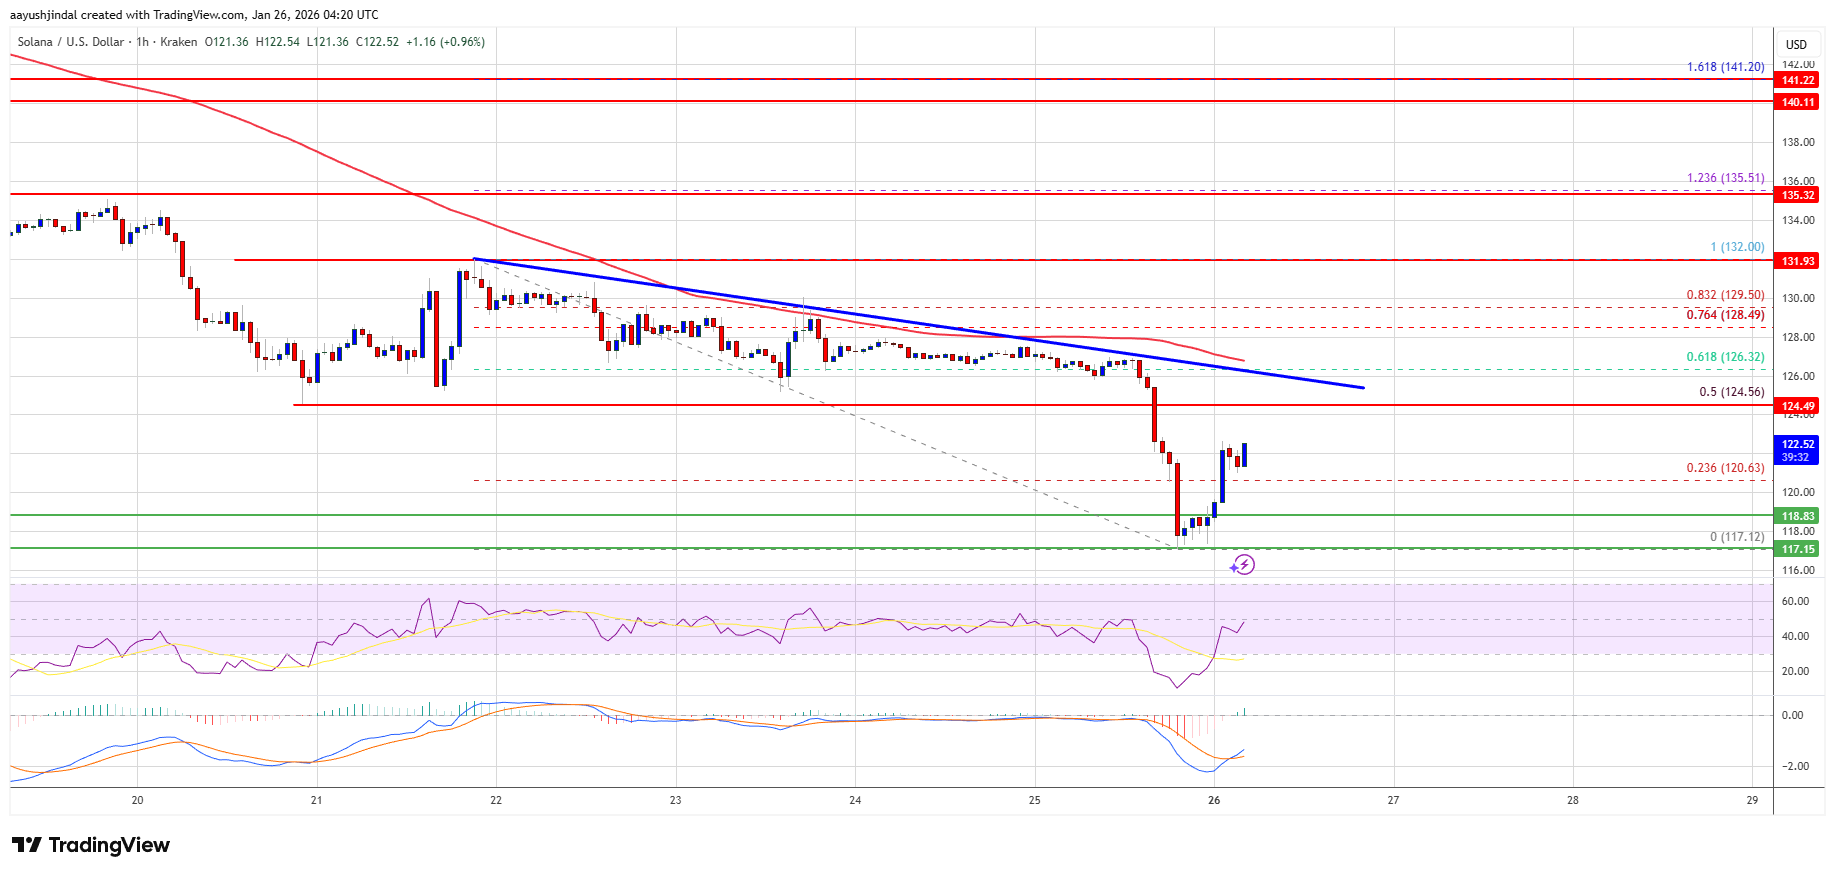
The next major resistance is near the $126 level. There is also a key bearish trend line forming with resistance at $126 on the hourly chart of the SOL/USD pair. The main resistance could be $132. A successful close above the $132 resistance zone could set the pace for another steady increase. The next key resistance is $140. Any more gains might send the price toward the $144 level.
Another Drop In SOL?
If SOL fails to rise above the $126 resistance, it could continue to move down. Initial support on the downside is near the $119 zone. The first major support is near the $117 level.
A break below the $117 level might send the price toward the $115 support zone. If there is a close below the $115 support, the price could decline toward the $102 support in the near term.
Technical Indicators
Hourly MACD – The MACD for SOL/USD is losing pace in the bearish zone.
Hourly Hours RSI (Relative Strength Index) – The RSI for SOL/USD is below the 50 level.
Major Support Levels – $117 and $115.
Major Resistance Levels – $126 and $132.