Reading view

There are new articles available, click to refresh the page.

Expert Who Nailed The Bitcoin Top Now Says Buy At These Levels

Chris Burniske, cofounder of Placeholder VC and former crypto lead at Ark Invest, is mapping out where he would consider stepping back into Bitcoin if the market keeps sliding, after earning fresh credit on X for calling major turning points this cycle. His framework lands in the mid-$80,000s down to the low-$50,000s, while a separate technical view from analyst Aksel Kibar points to a broader “base building” process with support clustered in the mid-$70,000s.

Price Levels Where To Buy Bitcoin

Burniske wrote that he is “not a buyer yet,” but outlined several price areas he’s monitoring. In his view, roughly $80,000 matters as the November 2025 low and a local trough of the current downswing. Below that, he highlighted roughly $74,000, tying it to the April 2025 low and describing it as the “Tariff Tantrum” bottom; he also noted it sits just under Strategy’s (MSTR) stated Bitcoin cost basis of around $76,000.

He then pointed to around $70,000 as the top of the prior $50,000–$70,000 band near the 2021 high, before shifting to a more structural level near $58,000. That zone, he wrote, aligns with the 200-week simple moving average and an on-chain cost basis, with RV around $56,000. Finally, he flagged $50,000 and below as a psychological line, arguing that a break under it would likely revive “death of BTC” narratives.

I’m not a buyer yet, but if I were to be a buyer, imo the areas to watch for $BTC are:

~$80K: Nov ’25 low, local low of this “bear” ~$74K: April ’25 low, Tariff Tantrum low, just below $MSTR‘s cost basis (~$76K) ~$70K: Top of $50-70K range, near ’21 high ~$58K: 200W SMA &…

— Chris Burniske (@cburniske) January 25, 2026

Burniske’s posture is deliberately non-committal on timing. “Importantly, I don’t care what happens,” he wrote, adding that if Bitcoin rallies he will “ride what I have and diversify,” while a deeper unwind would have him buying more Bitcoin and “select crypto assets.”

The thread also touched altcoins. Asked how he thinks about alts versus Bitcoin, Burniske said it’s “best imo to buy alts after you think btc is near bottom,” reinforcing that he’s treating BTC’s downside process as the key gating factor for broader risk-taking. On positioning, he said he is sitting “in treasuries, where yield > inflation,” and when asked about an upside level that would force him back in, he replied that he “wouldn’t chase,” preferring to hold existing exposure rather than re-risk at higher prices.

Burniske’s renewed attention followed praise from Anthony Pompliano, who told him: “You nailed the SOL bottom and the BTC top over this cycle.” Burniske’s reputation for calling tops is partly tied to an October 2025 post in which he argued the market had likely been structurally damaged after a sharp selloff.

“We can always get another weak bounce, but I’ve taken action accordingly,” he wrote at the time. “I’ll likely get interested in the market again when I see BTC $75K or lower.”

Breakdown Or Bottoming Phase?

Separately, veteran technician Aksel Kibar posted a BTCUSD daily chart on Sunday without additional commentary. When asked directly about a breakout or breakdown, Kibar cautioned against overweighting diagonal formations: “Not giving too much weight to diagonal short-term patterns breakout/breakdown. I think this is part of the base building, searching for a bottom.”

Bitcoin price analysis

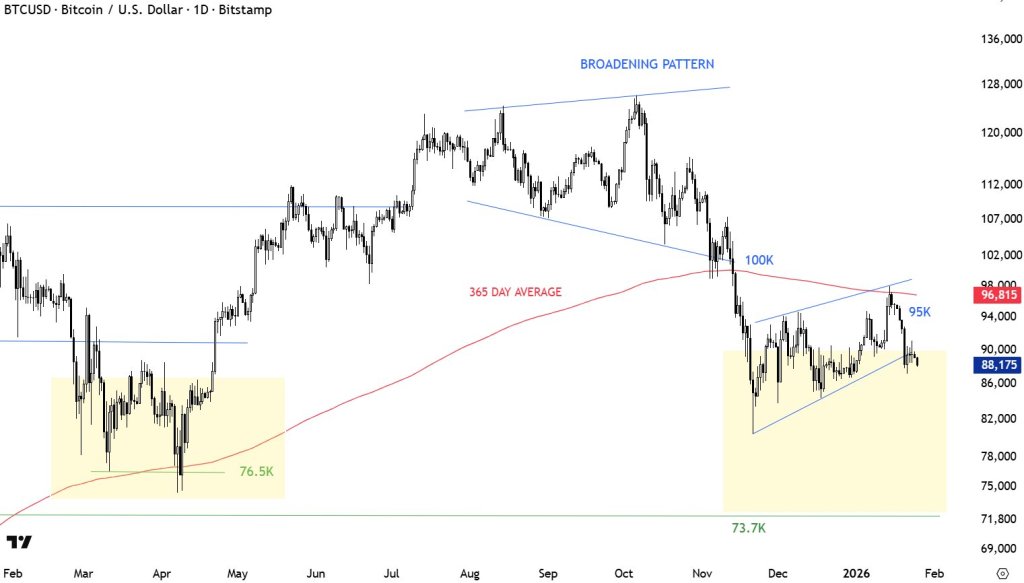
Kibar had previously framed “technical support” as being “lower between 73.7K and 76.5K,” suggesting that if Bitcoin is indeed in a basing phase, the market may need time and repeated tests of those lower bands before a more durable trend reasserts itself.

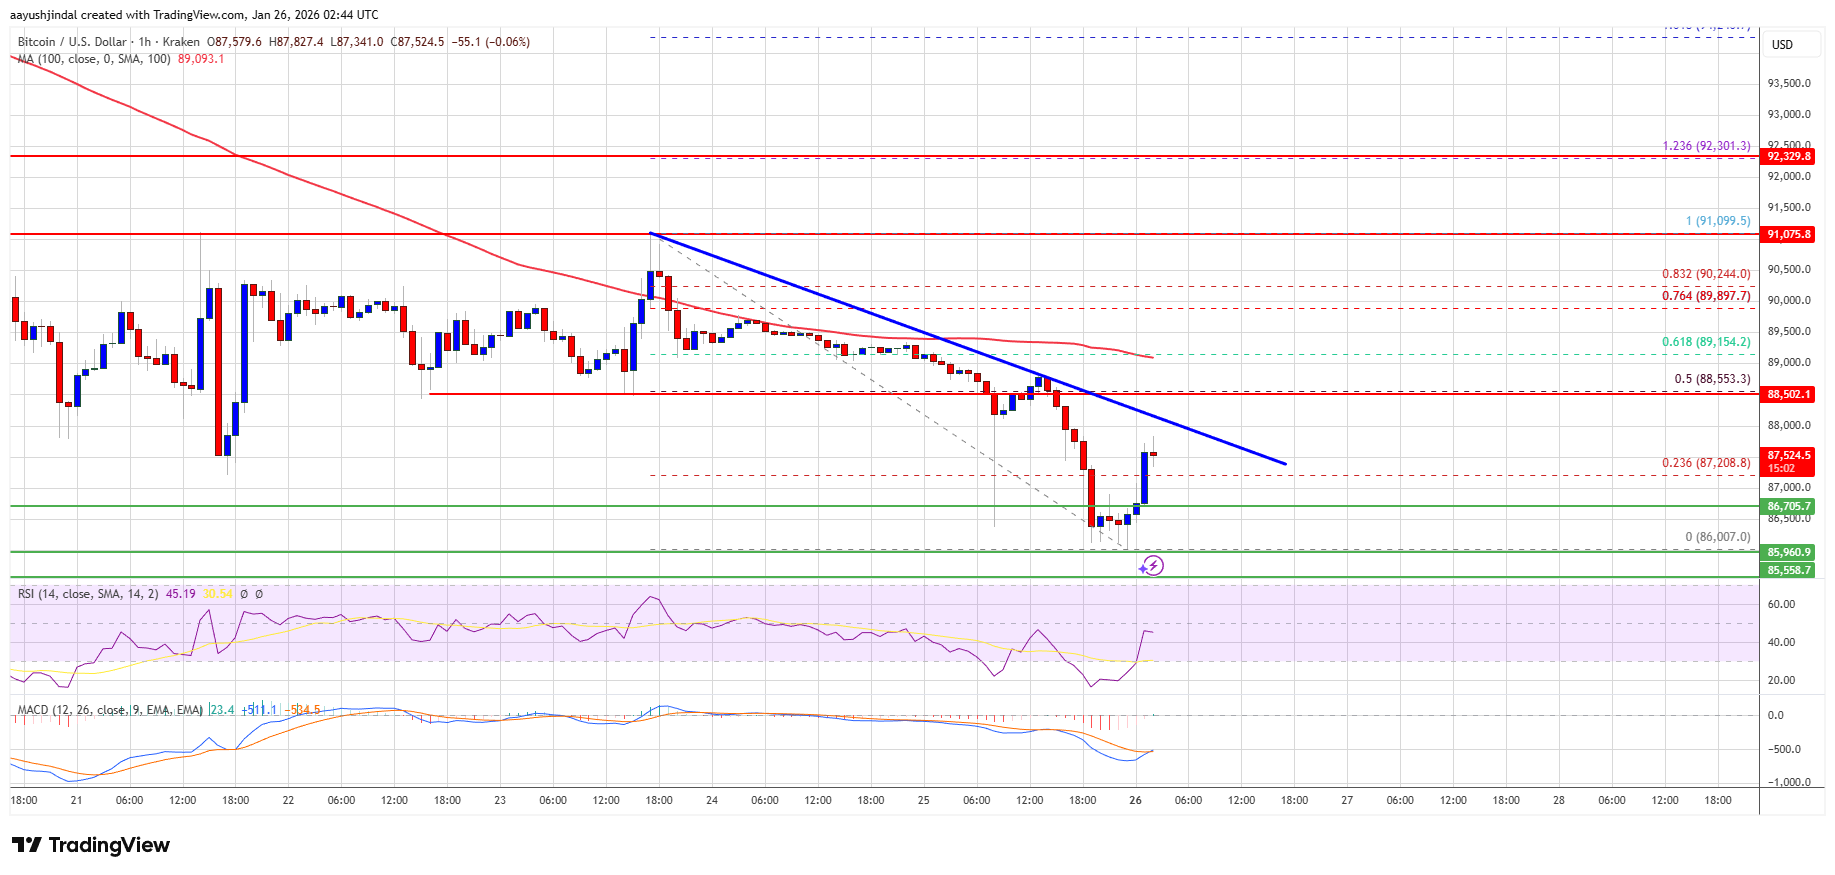
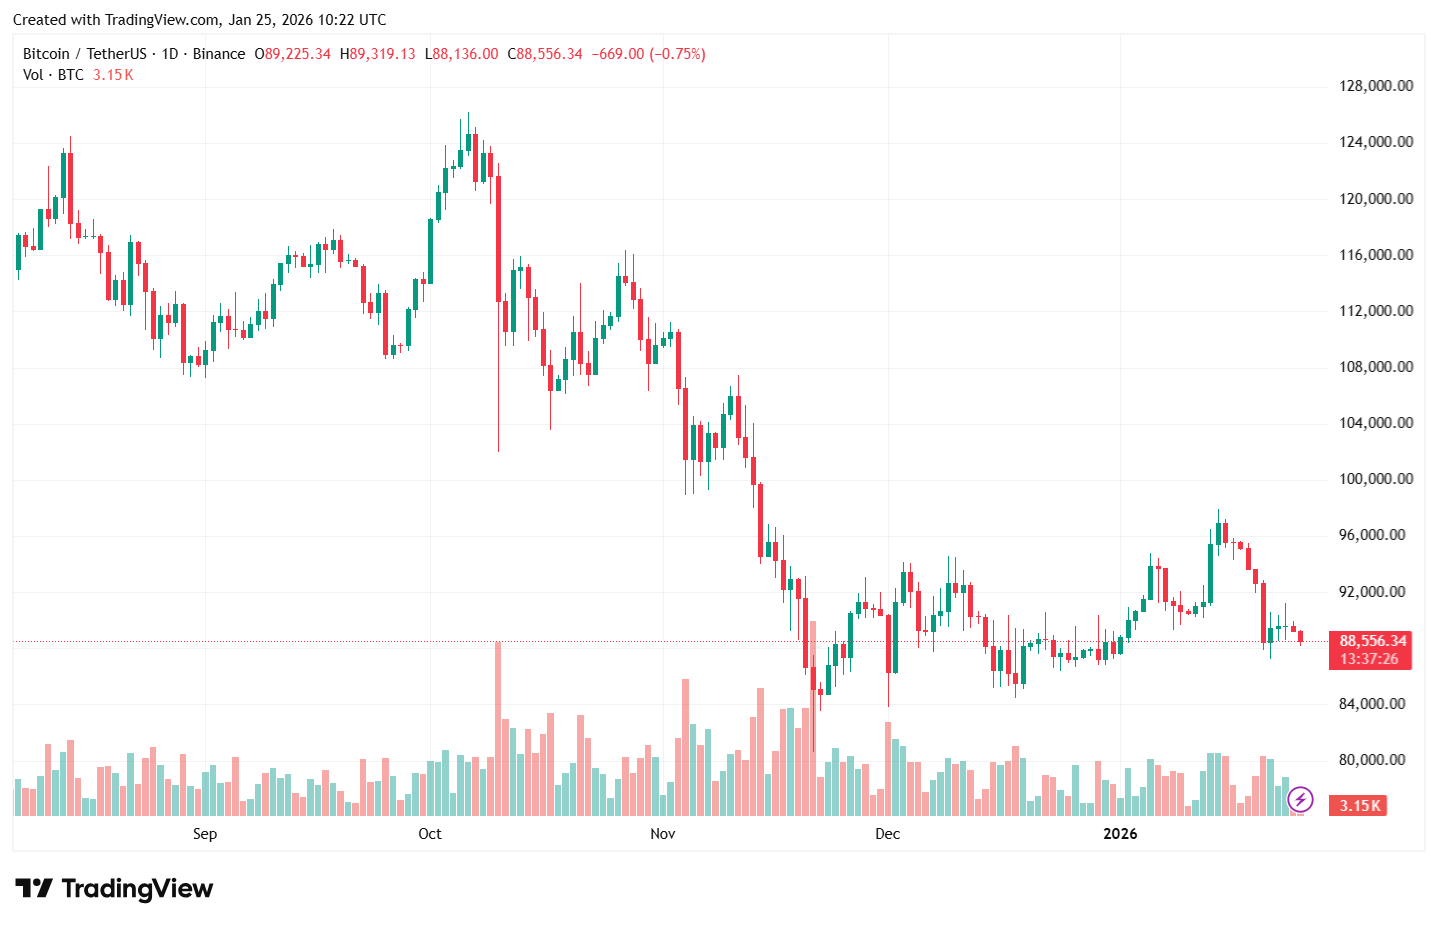
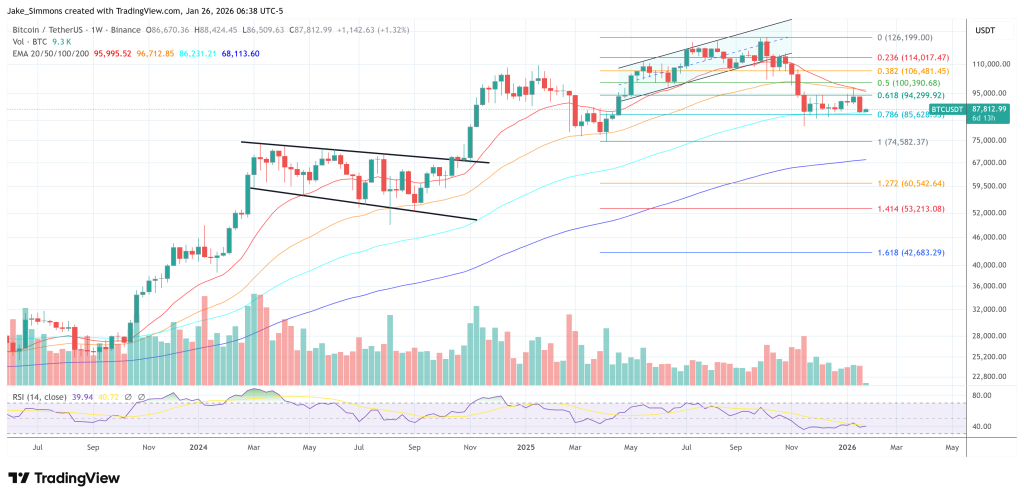
At press time, BTC traded at $87,812.

Bitcoin price chart

Ethereum Stalls In A Critical Zone As Breakout Structures Wait For Confirmation

Ethereum remains under pressure in a key support zone, teetering between a potential rebound and further decline. While bullish patterns like the cup-and-handle and ascending triangle are shaping up, confirmation is required before any decisive move.

Last Defense Zone: $2,274–$2,104 And The Libra Reversal Setup

Kamile Uray shared that Ethereum is currently trying to hold above the critical support zone between $2,775 and $2,623. This area has become a key battleground for bulls and bears, with buyers attempting to defend it to prevent further downside. If this support continues to hold, ETH could regain short-term stability and make another attempt to move higher.

On the upside, a sustained bounce from this zone could allow Ethereum to revisit the pink box resistance around the $3,445 level. A clean breakout above this resistance would activate bullish structures such as a cup-and-handle or an ascending triangle, signaling growing bullish momentum and opening the path toward the $3,894 level. However, this becomes possible if ETH manages to close above the $3,661 peak, confirming the formation of the first major high.

Ethereum

The $3,894 level carries technical significance, as it represents the 0.618 Fibonacci retracement of the most recent downward wave. A decisive close above this level would suggest continuation of the recovery. Failure to hold above it, however, could trigger renewed selling pressure and lead to another corrective move lower.

On the downside, if Ethereum loses the $2,623 support, a deeper decline toward the pink box zone between $2,274 and $2,104 would become likely. This area is notable for the potential formation of a bullish Libra pattern. Should reversal confirmation emerge from this zone, ETH could attempt another recovery phase, with the broader objective of retesting its previous highs.

Waiting For Confirmation: ETH’s Next Move Depends On Price Action

Ethereum is currently following the trajectory outlined by Crypto Candy in a recent update on X. As predicted, the asset dipped into the lower support range between $2,600 and $2,700 and is now attempting to stage a recovery from the zone. Should this upward momentum persist, the immediate objective for bulls is a return to the $3,070 level.

However, for Ethereum to firmly re-enter bullish territory and shift the broader market structure, it must close decisively above the $3,070 threshold. This level serves as the primary gateway for any sustained recovery beyond the current relief rally. Until that breakout occurs, the prevailing market bias remains firmly bearish, as the failure to reclaim and hold above $3,070 suggests that the path of least resistance is still to the downside, with lower price points remaining the primary expectation for the short term.

Ethereum

Crypto Traders Share Odds Of XRP Price Rising 40% This Year, Can It Still Rally?

Retail traders are increasingly optimistic about XRP, even though the cryptocurrency’s price is currently struggling to keep up above $1.90. Despite the recent lack of follow-through in price action, different data shows confidence is building beneath the surface. 

Data from prediction markets by Robinhood shows traders are actively pricing in the possibility of a sizable upside move for XRP’s price action this year, with odds pointing toward a rally of roughly 40% from current levels.

How Prediction Market Pricing Is Reflecting Bullish Expectations

Data from prediction markets hosted on Robinhood shows that traders are actively trading contracts tied to XRP reaching specific price levels in 2026. Notably, the data shows that the contract for XRP trading at $2.75 in 2026 is currently quoted with a bid of $0.66 and an ask of $0.73. 

An ask of $0.73 means that the Robinhood prediction platform believes the likelihood of XRP reaching or exceeding $2.75 is high enough to demand a significant premium. Although this does not represent a guaranteed probability, it suggests that traders offering liquidity see that outcome as more likely than not, placing implied odds in the 73% range based on current pricing.

That same optimism is present as price targets move higher, though more measured. The contract tied to XRP crossing $3.00 is priced around 50 cents. This implies the market views that level as a roughly even chance and a 50% scenario that the XRP price breaks above $3 again in 2026. The ask price drops to 44 cents for an XRP price bet of $3.25, which means there is a 44% chance XRP reaches this level.

Can XRP Still Rally While Near $1.90?

Recent price action has seen XRP now back to trading around support at $1.9. At the time of writing, XRP is trading at $1.88, down by 5% in the past seven days. This decline is part of an extended correction move after XRP’s rally in early January was rejected around $2.41 on January 6. 

The entire crypto industry is now back to a mood of fear, according to CoinMarketCap’s Fear & Greed Index. The index shows that the overall market sentiment is currently sitting at a Fear reading of 29. Even so, this risk-off mood has done little to dampen bullish expectations among many XRP investors. Several forecasts published in January continue to point toward a move into new all-time price highs this year.

Standard Chartered’s analysts, for example, have projected that XRP could reach $8 in 2026 if sustained ETF inflows and clearer regulation are able to increase institutional interest. Another price outlook echoed the idea that a new all-time high above $5 is possible before the year ends based on the current trend of XRP outflows from crypto exchange reserves.

XRP

Gold Hits Record $5K While Bitcoin Struggles To Keep Pace

Gold shone brightly today, racing to a new high while crypto took the back seat, and the gap between the two assets opened wide.

On Monday, the precious metal moved past the $5,000 mark, registering a price point market sentinels had not witnessed before. Bitcoin, by contrast, failed to keep pace and traded well below its recent highs.

Gold Hits Record Levels

Safe-haven demand pushed gold sharply higher. Prices were up above $5k an ounce and inked roughly $5,110 at the peak. Silver, for its part, did not go unnoticed, jumping to fresh peaks near $107/ounce.

Traders pointed to simmering geopolitical friction and talk of tougher trade moves led by US President Donald Trump as fuel for the rally.

A weaker greenback made metals more attractive to customers overseas, and central bank buying provided steady backing. Liquidity in some corners were thin as investors rushed to shift cash into things that feel stable when risk elevates.

Bitcoin Falls Behind

Market numbers show Bitcoin hovering in the mid-$80,000s range, retreating from peaks seen late last year. Reports note the alpha crypto is roughly 30% below the highest level it hit reached in October 2025, leaving some holders quite jittery.

Volatility was another factor. Where bullion is being sought for safety, Bitcoin is viewed more as a growth or speculative play, and that difference in investor application becomes clear when markets tighten. Some funds slashed their crypto exposure, signaling a short reroute away from high-risk gambits.

Why Investors Are Shifting

Analysts and traders described a simple choice: shelter or swing for gains. When headlines push worry, money flows into assets that are widely trusted across markets and governments.

Metals fit that ticket. Based on market chatter, fears of a US government funding clash and fresh tariff announcements stacked pressure on stocks and added a sense of urgency to safe-haven acquisition.

Options and futures trading hinted at a more cautious perpective, with volatility indexes rising and bond yields behaving in ways that made the yellow metal look more appealing by comparison.

What Traders Are Watching

Market watchers said eyes will be glued on a few key metrics: The dollar’s path, moves by major central banks, and any sign that US politics escalates could keep metals elevated.

For Bitcoin, network activity, large wallet flows, and regulatory headlines will likely set the tone. Some traders expect swings both ways. Others caution that when risk appetite is back, crypto may bounce hard, but that outcome is not a sure thing and will be dependent on a string of policy and macro moves.

Featured image from Unsplash, chart from TradingView

XRP Ledger Congestion Could Burn 1 Billion Coins A Year, Developer Claims

Software Engineer and founder of various AI start ups Vincent Van Code (@vincent_vancode) argues on X that most XRP burn projections are understated because they assume today’s low transaction fees persist even under heavy network usage. In his framing, sustained congestion on the XRP Ledger (XRPL) could push fees higher via the protocol’s load-scaling mechanics, potentially destroying on the order of one billion XRP annually.

XRPL Load Factor Could Turn Fees Into A Major XRP Burn

In a thread titled “The ‘Supply Meltdown’ Simulation,” Vincent Van Code claimed “everyone is calculating the XRP burn wrong,” starting with the premise that the commonly cited base fee of 0.00001 XRP only reflects a quiet network. “But what happens if the world actually starts using the XRPL at its 3,400 TPS limit?” he wrote, positioning load-driven fee escalation as the pivotal variable rather than raw throughput alone.

Van Code’s simulation walks through multiple fee regimes at the same headline activity rate, emphasizing that burn changes dramatically when the ledger is full and the “Load Factor” increases fees to deter spam. “As the ledger fills up, the Load Factor kicks in to stop spam,” he wrote. “Fees don’t just stay low; they scale exponentially.”

He anchored the thread with four scenarios and daily burn estimates, starting with what he called a “standard day” of 1.2 million transactions and roughly 450 XRP burned per day. From there, he modeled “global adoption” at the stated 3,400 TPS ceiling, translating to about 293 million transactions per day at base fee and an estimated 2,937 XRP burned daily.

The more aggressive claims come when he holds transaction volume constant at that 293 million-per-day level but lifts the effective fee via congestion. In his “congestion hike” case, he assumes the load-scaled fee rises to 0.001 XRP, implying about 293,760 XRP burned per day. In a “full gridlock” case at 0.01 XRP per transaction, he estimates 2,937,600 XRP burned daily.

The thesis leans on a structural feature of XRPL fees: they are not paid out to validators or any sponsoring entity, but removed from circulation. Van Code underscored that distinction directly. “The fees aren’t paid to miners. They aren’t paid to Ripple. They are destroyed forever.”

The “Supply Meltdown” Simulation 🌋 Headline: Everyone is calculating the $XRP burn wrong. 🧵 The “base fee” (0.00001 XRP) only exists when the network is quiet. But what happens if the world actually starts using the XRPL at its 3,400 TPS limit? The Congestion Math: As the…

— Vincent Van Code (@vincent_vancode) January 24, 2026

From that, he draws his headline conclusion: “Under extreme global utility, we aren’t burning a few hundred tokens. We could be wiping 1 BILLION $XRP out of existence every year,” framing network demand—and the congestion it creates—as “the ultimate deflationary engine.”

At press time, XRP traded at $1.88.

XRP price chart

Global Liquidity Says Bitcoin Is Extremely Undervalued – Here’s The ‘Real’ Figure

Crypto pundit Kyle Chassé has pointed to the rising global liquidity to prove that Bitcoin is currently undervalued. His comments come as fiat currencies like the Dollar and Yen continue to weaken amid concerns about governments’ fiscal policies. 

Global Liquidity Points To A Bitcoin Target Of $270,000

In an X post, Kyle Chassé shared an accompanying chart highlighting a Bitcoin target of $270,000 based on rising global liquidity. The pundit stated that the herd says that $90,000 BTC is expensive, but that the fiat ledger has reminded everyone why the digital ledger exists. This came as he revealed that the global M2 money supply has hit a record $98 trillion, driven by aggressive expansion from the U.S., the Eurozone, China, and Japan. 

Chassé further noted that year-to-date (YTD) global liquidity growth is now 6.2%, the fastest pace since the 2020 pandemic response. The pundit warned that in a system where the fiat denominator is permanently diluted, fixed-supply assets are not going up in price, but that cash is “loudly becoming worthless.” As such, he believes that BTC is a good hedge against currency debasement and potentially inflation. 

Bitcoin

The pundit’s comments notably come amid a decline in the dollar, with the DXY down since the start of the year. The yen is also down YTD, as these fiat declines are coming amid a push by the governments to increase spending. Increased government spending is considered bullish for Bitcoin, given its fixed supply compared to fiat currencies, which governments continue to print. BitMEX co-founder Arthur Hayes had also recently predicted that a rise in dollar liquidity would spark higher BTC prices. 

However, that is yet to be the case as Bitcoin continues to trade like a risk asset and has erased its year-to-date (YTD) gains amid political tensions in the U.S. A U.S. government shutdown is also looking more likely by January 31, sparking a BTC drop below $87,000 yesterday. 

BTC Will Rise Once Liquidity Returns

Crypto pundit Merlijn assured that Bitcoin will rise once liquidity comes back. In an X post, he urged market participants to zoom out and that the BTC pattern would become obvious. The pundit revealed that the flagship crypto has already recorded waves 1, 2, and 3 with lower highs, which signal trend fatigue. 

Now, Bitcoin is looking to form waves 4 and 5, which would signal a reset, absorption, and base building. Merlijn suggested that the bottom may not yet be in, but that once that happens, BTC could rally to as high as $124,000, bringing it close to its current all-time high (ATH) of $126,000. 

At the time of writing, the Bitcoin price is trading at around $87,700, down in the last 24 hours, according to data from CoinMarketCap.

Bitcoin

Bitcoin Price Prediction: Analyst Forecasts 72.86% Crash To $30,000

A new Bitcoin price prediction has been put forward following a long-term technical analysis shared on the social media platform X by crypto analyst Leshka.eth. The analysis compares Bitcoin’s current structure on the weekly timeframe to the 2021 market peak, showing how price behavior is repeating an identical pattern. 

Based on how Bitcoin has interacted with a rising multi-year channel in previous cycles, the analysis proposes a projection as to how Bitcoin could be setting up for a powerful corrective move that sends the price back to as low as $30,000.

Bitcoin Weekly Structure About To Break

Technical analysis of Bitcoin’s price action on the weekly candlestick timeframe chart shows that the leading cryptocurrency has been trading with higher highs and higher lows since 2018. Interestingly, this trend of higher highs has led to repeated interaction with a rising resistance trendline that has defined every major cycle top.

As shown in the chart below, Bitcoin pushes into this upper boundary during each bull market, only to be rejected once momentum fades. These rejection points are clearly marked across multiple cycles, including the 2017 and 2021 peaks. This repeated failure is a defining feature of Bitcoin’s macro cycles of exhaustion after prolonged upside expansion.

Bitcoin once again rallied into this same long-term trendline when it broke to new all-time highs in October 2025 before stalling and rolling over. Bitcoin’s price failed to hold above the trendline and has corrected by about 30% since then. The leading cryptocurrency is now trading below $90,000, and this technical outlook introduces the possibility that the current pullback is not yet complete and could extend further.

Bitcoin price

Bitcoin Weekly Candlestick Chart. Source: @leshka_eth on X

Bitcoin Crash Extension To $30,000?

The chart also highlights the depth of prior bear market declines once Bitcoin was rejected at this long-term structure. After the 2017 cycle top, Bitcoin fell roughly 84.99% from peak to trough. Following the 2021 high, Bitcoin once again declined by about 77.47% before finding a bottom near the lower boundary of the broader rising channel. 

Based on the current setup, the projected downside move marked on the chart measures approximately 72.86%. Applying a drawdown of that magnitude from the recent cycle high places Bitcoin’s potential bottom around $30,000.

Interestingly, Grok AI offered a more optimistic interpretation of Bitcoin’s near-term outlook based on responses to questions under the same technical post. According to Grok, aggregated views from sources such as CNBC, Reddit, and Forbes suggest that the probability of Bitcoin dropping into the $30,000 to $40,000 range is relatively low, estimated at around 15% to 25% by bearish cycle models.

On the other hand, many analysts instead expect higher price floors, often above $50,000. Some long-term projections extend over $200,000, with names like Binance co-founder Changpeng Zhao predicting $200,000 and Tom Lee predicting $250,000 in 2026.

Bitcoin price chart from Tradingview.com

Solana (SOL) Slips Further As Bears Target Deeper Support Zones

Solana failed to settle above $132 and extended losses. SOL price is now consolidating losses below $130 and might struggle to start a recovery wave.

  • SOL price started a fresh decline below $132 and $130 against the US Dollar.
  • The price is now trading below $130 and the 100-hourly simple moving average.
  • There is a key bearish trend line forming with resistance at $126 on the hourly chart of the SOL/USD pair (data source from Kraken).
  • The price could start a recovery wave if the bulls defend $118 or $115.

Solana Price Dips Further

Solana price failed to remain stable above $132 and started a fresh decline, like Bitcoin and Ethereum. SOL declined below the $130 and $126 support levels.

The price gained bearish momentum below $122. A low was formed at $117, and the price is now consolidating losses. The price recovered a few points and climbed above the 23.6% Fib retracement level of the downward move from the $132 swing high to the $117 low.

Solana is now trading below $130 and the 100-hourly simple moving average. On the upside, immediate resistance is near the $125 level or the 50% Fib retracement level of the downward move from the $132 swing high to the $117 low.

Solana Price

The next major resistance is near the $126 level. There is also a key bearish trend line forming with resistance at $126 on the hourly chart of the SOL/USD pair. The main resistance could be $132. A successful close above the $132 resistance zone could set the pace for another steady increase. The next key resistance is $140. Any more gains might send the price toward the $144 level.

Another Drop In SOL?

If SOL fails to rise above the $126 resistance, it could continue to move down. Initial support on the downside is near the $119 zone. The first major support is near the $117 level.

A break below the $117 level might send the price toward the $115 support zone. If there is a close below the $115 support, the price could decline toward the $102 support in the near term.

Technical Indicators

Hourly MACD – The MACD for SOL/USD is losing pace in the bearish zone.

Hourly Hours RSI (Relative Strength Index) – The RSI for SOL/USD is below the 50 level.

Major Support Levels – $117 and $115.

Major Resistance Levels – $126 and $132.

XRP Price Bearish Continuation Confirmed As Downside Pressure Builds

XRP price extended losses and traded below $1.880. The price is now consolidating and might decline further if it remains below $1.920.

  • XRP price started a fresh decline below the $1.90 zone.
  • The price is now trading below $1.90 and the 100-hourly Simple Moving Average.
  • There is a key bearish trend line forming with resistance at $1.885 on the hourly chart of the XRP/USD pair (data source from Kraken).
  • The pair could continue to move down if it stays below $1.90.

XRP Price Dips Further

XRP price failed to stay above $1.950 and started a fresh decline, like Bitcoin and Ethereum. The price declined below $1.920 and $1.90 to enter a short-term bearish zone.

The price even spiked below $1.850. A low was formed at $1.810, and the price is now consolidating losses. There was a recovery wave above $1.850. The price cleared the 23.6% Fib retracement level of the downward move from the $1.963 swing high to the $1.810 low, but the bears remained active.

The price is now trading below $1.90 and the 100-hourly Simple Moving Average. If there is a fresh upward move, the price might face resistance near the $1.8850 level and the 50% Fib retracement level of the downward move from the $1.963 swing high to the $1.810 low. There is also a key bearish trend line forming with resistance at $1.885 on the hourly chart of the XRP/USD pair.

XRP Price

The first major resistance is near the $1.90 level. A close above $1.90 could send the price to $1.950. The next hurdle sits at $2.00. A clear move above the $2.00 resistance might send the price toward the $2.050 resistance. Any more gains might send the price toward the $2.120 resistance. The next major hurdle for the bulls might be near $2.20.

Downside Break?

If XRP fails to clear the $1.90 resistance zone, it could start a fresh decline. Initial support on the downside is near the $1.840 level. The next major support is near the $1.820 level.

If there is a downside break and a close below the $1.820 level, the price might continue to decline toward $1.780. The next major support sits near the $1.750 zone, below which the price could continue lower toward $1.70.

Technical Indicators

Hourly MACD – The MACD for XRP/USD is now gaining pace in the bearish zone.

Hourly RSI (Relative Strength Index) – The RSI for XRP/USD is now near the 50 level.

Major Support Levels – $1.840 and $1.820.

Major Resistance Levels – $1.8850 and $1.90.

Ethereum Price Sinks To $2,800, Raising Fresh Downside Fears

Ethereum price extended losses and traded below the $2,865 zone. ETH is now consolidating losses and might aim for a recovery if it clears $2,920.

  • Ethereum remained in a bearish zone and traded below $2,950.
  • The price is trading below $2,900 and the 100-hourly Simple Moving Average.
  • There is a bearish trend line forming with resistance at $2,920 on the hourly chart of ETH/USD (data feed via Kraken).
  • The pair could start a fresh increase if it stays above the $2,800 zone.

Ethereum Price Dips Further

Ethereum price failed to remain stable above $2,950 and extended losses, like Bitcoin. ETH price declined below $2,880 and $2,865 to enter a bearish zone.

The bears even pushed the price below $2,840. The price finally tested $2,800 and is currently consolidating losses. There was a minor upside above the 23.6% Fib retracement level of the downward wave from the $3,067 swing high to the $2,784 swing low.

Ethereum price is now trading below $2,900 and the 100-hourly Simple Moving Average. If the bulls can protect more losses below $2,800, the price could attempt another increase.

Immediate resistance is seen near the $2,920 level. There is also a bearish trend line forming with resistance at $2,920 on the hourly chart of ETH/USD. The first key resistance is near the $2,960 level or the 61.8% Fib retracement level of the downward wave from the $3,067 swing high to the $2,784 swing low. The next major resistance is near the $3,000 level. A clear move above the $3,000 resistance might send the price toward the $3,065 resistance.

Ethereum Price

An upside break above the $3,065 region might call for more gains in the coming days. In the stated case, Ether could rise toward the $3,120 resistance zone or even $3,150 in the near term.

More Losses In ETH?

If Ethereum fails to clear the $2,920 resistance, it could start a fresh decline. Initial support on the downside is near the $2,840 level. The first major support sits near the $2,800 zone.

A clear move below the $2,800 support might push the price toward the $2,780 support. Any more losses might send the price toward the $2,720 region. The main support could be $2,650.

Technical Indicators

Hourly MACDThe MACD for ETH/USD is losing momentum in the bearish zone.

Hourly RSIThe RSI for ETH/USD is now below the 50 zone.

Major Support Level – $2,800

Major Resistance Level – $2,920

Bitcoin Price Breakdown Risk Grows As Bears Aim For $85K

Bitcoin price extended losses and traded below $88,500. BTC is consolidating losses and might attempt a recovery wave if it clears $88,500.

  • Bitcoin started a minor recovery wave from the $86,000 level.
  • The price is trading below $88,200 and the 100 hourly Simple moving average.
  • There is a new bearish trend line forming with resistance at $88,000 on the hourly chart of the BTC/USD pair (data feed from Kraken).
  • The pair might recover if it manages to settle above $86,200 and $86,000.

Bitcoin Price Dips Further

Bitcoin price failed to stay above the $89,000 support and extended losses. BTC declined sharply below the $88,500 and $87,000 support levels.

The bears even pushed the price below $86,500. A low was formed at $86,007, and the price is now attempting a recovery wave. There was a move above the 23.6% Fib retracement level of the downward move from the $91,099 swing high to the $86,007 low.

Bitcoin is now trading below $88,500 and the 100 hourly Simple moving average. If the price remains stable above $86,500, it could attempt a fresh increase. Immediate resistance is near the $88,000 level. There is also a new bearish trend line forming with resistance at $88,000 on the hourly chart of the BTC/USD pair.

The first key resistance is near the $88,500 level since it is close to the 50% Fib retracement level of the downward move from the $91,099 swing high to the $86,007 low.

Bitcoin Price

A close above the $88,500 resistance might send the price further higher. In the stated case, the price could rise and test the $89,200 resistance. Any more gains might send the price toward the $90,000 level. The next barrier for the bulls could be $91,000 and $91,500.

More Losses In BTC?

If Bitcoin fails to rise above the $88,500 resistance zone, it could start another decline. Immediate support is near the $86,700 level. The first major support is near the $86,200 level.

The next support is now near the $85,500 zone. Any more losses might send the price toward the $83,500 support in the near term. The main support sits at $82,500, below which BTC struggle to recover in the near term.

Technical indicators:

Hourly MACD – The MACD is now losing pace in the bearish zone.

Hourly RSI (Relative Strength Index) – The RSI for BTC/USD is now below the 50 level.

Major Support Levels – $86,700, followed by $86,000.

Major Resistance Levels – $88,500 and $89,200.

Altcoins Don’t Move Slowly: 6-Week Window Can Rewrite Years Of Price Action

Crypto traders often assume that meaningful gains need long timelines to take place, and they often give up during the wait and silence. However, crypto has a habit of shattering that belief without warning. History shows that when conditions line up, altcoins do not grind higher over years. They release and erase multiple years of drawdowns in a matter of weeks. 

That memory was highlighted by a crypto commentator known as Waterman on the social media platform X, who noted a familiar seasonal window between February and late April to early May for an altcoin explosion.

Speed Matters More Than Time

The most notable example of an altcoin rally season was in 2021, when the entire altcoin market went on a rally to new all-time highs, many of which are still unbroken for some cryptocurrencies. 

The 2021 cycle delivered some of the clearest reminders of just how fast capital can rotate once momentum takes hold. Solana moved from roughly $20 to $200 in about 50 days, a clean tenfold run. Although Solana has since broken above this peak to register a new all-time high of $293 in January 2025, this was still Solana’s most explosive rally to date.

Dogecoin followed an even sharper trajectory, climbing from $0.07 to a peak of $0.73 in under a month due to speculative interest that flowed into other memecoins like Shiba Inu. Unlike Solana, Dogecoin is yet to reclaim or surpass this peak price.

Avalanche went further, rallying from around $3 to $60 in less than 40 days, a twentyfold expansion that unfolded faster than most long-term projections ever anticipate. None of these moves required years of development or prolonged accumulation.

A Timeframe To Watch Closely

Notably, February through late April or early May has more often than not been the period where altcoin performance increases the most. If that pattern repeats, the coming weeks may matter far more than the years that came before them.

At the time of writing, the notion of an altcoin season is still impeded by strong Bitcoin dominance. Much of that comes down to how the entire crypto industry ecosystem has changed massively since 2021, especially after the launch of crypto-based ETFs. That steady demand has kept capital inflows concentrated around Bitcoin and slowed the usual rotation into altcoins.

Meme coins like Dogecoin and Shiba Inu have struggled to keep up in terms of price action, even with the launch of Dogecoin ETFs. Although the ETF has boosted visibility, it has not yet resulted into sustained upside.

At the same time, investors have become more selective, favoring cryptocurrencies tied to clearer utility. As a result, many crypto communities have been working to create utility for their meme coins.

Nonetheless, as noted by Waterman, you only need about four to six weeks for an altcoin to wipe out three to four years of suffering. You don’t need one to two years for altcoins to make massive gains.

Featured image from YouHodler, chart from TradingView

XRP Enters Phase 4 In Long-Term Chart Structure: Road To $21.5 Now Open

Technical analysis of XRP’s price action on the 3-week candlestick timeframe chart shows that the cryptocurrency is about to play out a road to the double-digit threshold based on its long-term structure. 

The analysis, which was shared on the social media platform X alongside a multiyear chart, points to XRP trading in what is labeled Phase 4. At the center of this setup is a clear technical target of a break above the previous all-time high and a run to at least $21.5

XRP Price Action In Phases

Technical analysis of XRP price action shows that the cryptocurrency has been trading in a series of four phases for more than a decade. One full sequence of four phases unfolded between mid-2013 and mid-2017 as the foundation for XRP’s first rally to price peaks. Since then, a second set of four phases has been developing and following a similar pattern. 

XRP transitioned into a new phase 1 and phase 2 sequence that led to a 2018 peak for phase 1 and then a pullback for phase 2 between 2018 and 2020. This was followed by an unusually long p3 that stretched from 2019 to mid-2024, visible on the chart as a broad, multi-year consolidation with converging trendlines of lower highs and higher lows. During this time, XRP’s price action was trapped inside the compression structure, just like the behavior seen during phase 3 of the first cycle.

XRP Price Chart. Source: @amonyx On X

Phase 4 Returns: XRP To Double Digits

According to the technical analysis, phase 4 began in 2025, when XRP finally broke above the compression range in mid-2024. This breakout was the same structural transition seen in mid-2017, when XRP exited consolidation and entered expansion. 

Phase 4 has already been in progress for several months and includes the period when XRP rallied to new all-time highs in mid-2025, eventually topping out at $3.65 in July. Since that peak, however, XRP’s price action has been playing out a corrective downward trend and is down by roughly 48% at the time of writing. 

Despite the ongoing correction, the projection is that XRP is still in phase 4 and is going to break into new all-time highs soon. This shows that phase 4 could unfold over an extended period and not with a single impulse move. The current all-time high of $3.65 is the first major technical hurdle, and a break above it will serve as confirmation that XRP is back into price discovery.

Based on this technical analysis, past expansion ratios from the previous cycle are applied and a 6.618 Fibonacci extension is measured from the phase 3 support low. This points to a projected price level near $21.5. At the time of writing, XRP is trading at $1.89, meaning a move to that level would represent an increase of roughly 1,040% from current prices.

Featured image from Pexels, chart from TradingView

Is Bitcoin Supercycle Truly On The Horizon? Analyst Predicts $31K Bottom In 2026

The calls of a potential Bitcoin supercycle in 2026 intensified over the past week after former Binance CEO Changpeng ‘CZ’ Zhao — yet another prominent voice in crypto — laid out his predictions for the new year. However, a popular analyst on the social media platform X has released an opposing view, predicting a deep bottom for the BTC price this year.

BTC Price At Risk Of Further 65% Decline

In a January 25th post on the X platform, prominent crypto trader Ali Martinez said, in a sarcastic tone, that “the super cycle is super cycling.” In what seemed like a response to the buzz around CZ’s Bitcoin supercycle projection, the market pundit tempered the expectations with a $31,000 price bottom call for the premier cryptocurrency in 2026.

This bearish prediction is based on the appearance of price fractals on the BTC chart. For context, fractals are repeating patterns in price charts that can help map and project potential price movements for a particular cryptocurrency (Bitcoin, in this scenario).

Bitcoin

As observed in the chart above, the price of BTC is currently following a similar movement pattern as in 2022. The premier cryptocurrency, after initially setting a then all-time high around $67,000 in early 2021, witnessed a nearly 55% correction to just above the $30,000 level by mid-July.

While the price of Bitcoin recovered and went back to set a record high of above $69,000 by the end of 2021, the market leader spent the majority of the following year in a downward trend. Exacerbated by the various bearish events of 2022, BTC ended the year at a low of around $15,500.

Martinez believes that the Bitcoin price is undergoing a similar movement pattern, having experienced an over 32% decline before climbing to the current all-time high of $126,080. The market pundit postulates that the premier cryptocurrency is currently witnessing the extended decline that saw its price reach $15,500 in 2022.

However, it is worth mentioning that the target this time around lies at $31,800, nearly 65% drop from the current price point. Hence, if the historical patterns highlighted by Martinez are to go by, there seems to be a higher likelihood of the Bitcoin price embarking on an extended downward trend rather than a supercycle.

Bitcoin Price At A Glance

As of this writing, the price of BTC stands at around $88,528, reflecting an over 1% decline in the past 24 hours.

Bitcoin

XRP Charts Flash Familiar Signal As Analyst Calls For $11, Then $70

A growing number of chart watchers are pointing to a long stretch of sideways trading for XRP and saying this setup has come before big rallies. According to a widely followed analyst known as CryptoBull, the current price action echoes earlier runs in the token’s history.

The signal is simple: long quiet periods sometimes lead to sharp moves when buying pressure returns. That does not mean a jump is guaranteed. Markets can stay quiet for a long time, and timing is uncertain.

Pattern Mirrors Prior Cycles

Based on reports, XRP’s weekly structure shows a stretch of range trading after strong breakouts from earlier years. The comparison reaches back several cycles. In past examples, long ranges eventually gave way to impulsive runs that pushed the price far above prior highs.

The next impulse will take #XRP to $11 and the last wave to $70. The price pattern is copying the previous bullrun, only difference is time, which makes sense, as we need longer accumulation for higher prices. pic.twitter.com/WJxzYDVRKT

— CryptoBull (@CryptoBull2020) January 23, 2026

CryptoBull argues the present consolidation has lasted longer than previous ones, which, he says, could compress price action and build fuel for a larger expansion when momentum flips. The idea rests on history repeating itself in broad strokes, not in exact moves.

Longer Accumulation Could Support Bigger Targets

Some analysts see a sixfold move as plausible if the same pattern plays out. That kind of rise would put XRP near $11, a figure being discussed by multiple commentators. There is also talk of a further, final wave lifting the token much higher in a later stage — talk that reaches $70 in extreme scenarios.

A bottom test—where price revisits support to confirm strength before a new push—has appeared in a few past cycles and is being watched closely now.

The presence of such tests can either validate a base or warn that the range has more work to do. Timelines are vague, and a long accumulation period can stretch for years before any decisive breakout.

RLUSD Rumors Fuel Speculative Calls

Reports that BlackRock may use Ripple’s RLUSD stablecoin have added fuel to the fire. News like that has pushed sentiment upward and sparked fresh technical calls, with some forecasts ranging from $6 to $14 in near- to mid-term scenarios.

Other voices go far beyond, naming targets that would imply market caps so large they would be hard to reconcile with today’s market size.

These more extreme numbers should be treated with caution, because they assume near-perfect conditions and massive capital flows that may never arrive. Still, adoption whispers can tilt sentiment and speed up moves when buyers pile in.

Featured image from Unsplash, chart from TradingView

Bitcoin Whale Demand Hits Extreme Levels As Next Rally Loads Up

The Bitcoin price action has been muted over the past few days, trading within the $90,000 and $88,000 levels. Classically, consolidation periods often precede major moves either to the upside or downside of the market.

As such, questions on the next trajectory of the flagship cryptocurrency are being asked. A latest on-chain evaluation has offered a positive prognosis on the next direction for the Bitcoin price. 

Accumulation Demand Metric Surges To All-Time-High 

In a Quicktake post on CryptoQuant, on-chain analyst CoinNiel hypothesized that the Bitcoin price could be at the beginning of a bullish trend. The market quant based this prognosis on two metrics — the Accumulator Address Demand and the Liquidity Inventory Ratio (month). 

The Accumulator Address Demand metric monitors the net buying pressure coming from addresses that buy Bitcoin consistently, and without any significant selling. This behavior (of buying and rarely selling) is typical of the large-scale Bitcoin holders, commonly known as the whales. 

Notably, CoinNiel also pointed out that when major withdrawals from exchanges occur, they are rarely ever incited by retailers, but by whales. As such, when the Bitcoin whales withdraw their holdings from exchanges, their buying pressure translates into an increase in the Accumulator Address Demand. 

Bitcoin

From the chart above, the indicator has reached an all-time high level. According to the crypto pundit, this could be a sign that the whales are currently experiencing, on intense levels, the “fear of missing out.”

The second metric, the Liquidity Inventory Ratio (Month), also reinforces CoinNiel’s bullish outlook. This metric tracks and compares existing Bitcoin demand to the supply available on exchanges, showing whether demand can overwhelm available supply

When this ratio rises sharply, it is usually a sign that demand is absorbing newly created supply. From the data shared by the analyst, the Liquidity Inventory Ratio has also reached an extreme value of 3.8.

However, this extreme reading is only a reflection of what is happening on US exchanges. Hence, CoinNiel implied that, for the first time in years, US exchanges are recording exceptionally high demand relative to the coins available.

In theory, a 3.8 reading implies the imminence of a supply shock in the scenario where current conditions prevail. But, the analyst highlighted that it may not necessarily happen, as a 3.8 reading is more a sign of intensified whale demand than a surefire means to predict supply shocks. 

The big picture, especially when these two metrics are looked at together, appears to be distinctly bullish. This is because available data points out that the whales are likely positioning for what could be a resumed bullish trajectory for the Bitcoin price.

Bitcoin Price At A Glance

As of this writing, Bitcoin is valued at $88,520, reflecting an over 1% decline in the past 24 hours.

Bitcoin

Ethereum Open Interest Declines Across Exchanges, Binance Stands Out — Details

For most of the week, the Ethereum price has remained in a range-bound spell, putting in no significant movement outside of the $3,000 and $2,880 price boundaries. Amid rising speculations, an on-chain analysis has recently been put out, which provides an answer to the question.

Open Interest Across Exchanges Falls To $17 Billion

In their latest QuickTake post on CryptoQuant, analytics platform Arab Chain reveals that there has been a fall in active Ethereum derivatives contracts across major exchanges, as indicated by data from the Ethereum: Open Interest-All Exchanges, All Symbol metric. Typically, rising Open Interest (OI) across exchanges indicates that more traders are entering leveraged positions. On the other hand, falling OI reflects more exits of leveraged positions, and by extension, reduced aversion to risk.

In the Quicktake post, Arab Chain highlights that open interest across exchanges has dipped to about $16.9 billion, marking the lowest level reached since mid-December last year. This, in turn, reflects an overall reduction in risk appetite across the Ethereum derivatives market. Because there is less speculative activity, there are also reduced risks of liquidations. Hence, the Ethereum price stands a higher chance of consolidating.


Bitcoin

What’s Happening On Binance?

While exchanges in general are recording significant pull-outs from the derivatives market, Binance has shown an outlier performance. Arab Chain highlights that the world’s largest exchange by trading volume has instead recorded about $7.5 billion in Open Interest. Interestingly, this reading slightly exceeds the December average range of $6.8–$7.4 billion. 

The divergence between the Open Interest values across all exchanges and that of Binance suggests that, while market participants are reducing their risk exposure, there is still liquidity in the derivatives market. Rather than a blatant exit, it has been repositioned toward the deeper and more liquid venue.

Arab Chain also explains that this behavior indicates a change in market operations from a higher-risk trading environment to one more price and risk efficient. In conclusion, the large traders are yet to make their exits but are merely reducing their exposure, while holding high-quality positions on Binance.

In addition, Ethereum’s proximity to the $3,000 price — especially as OI declines — shows that the market has been absorbing the deleveraging events while showing little selling pressure. Ultimately, Binance’s OI retaining levels above December’s support the idea that the market still has strong derivatives backing. Hence, the broader picture remains bullish. As of this writing, Ethereum trades at $2,958, reflecting a 0.33% growth since the past day, according to CoinMarketCap data.

Ethereum

Featured image from Pexels, chart from Tradingview.com

Money Keeps Leaving: Bitcoin ETFs Shed $1.72 Billion In Just 5 Sessions

US-based spot Bitcoin exchange-traded funds pulled funds for a fifth straight trading day, and the totals added up quickly. According to Farside data, about $103.5 million left on Friday, bringing the five-day sum to roughly $1.72 billion.

Bitcoin was trading near $89,160 at the time of these reports — still well below the $100,000 mark it last reached on November 13. This movement has sent a clear signal: many investors are stepping back right now.

ETF Flows And Who Is Selling

Reports note that ETF flows are often on the radar as a quick read on investor mood, but the picture is not always simple. Large outflows can reflect institutional rebalancing or tactical moves by funds, not only mass retail selling.

The US market had a four-day trading week because of Martin Luther King Jr. Day on Monday, which may have concentrated trades into fewer sessions and amplified the numbers. Still, losing more than a billion dollars in a few days will get attention.

Market Mood And Metals

The wider mood has soured. The Crypto Fear & Greed Index registered an Extreme Fear score of 25, and sentiment trackers have been flashing caution. Reports say Santiment believes retail traders are pulling back while attention drifts toward more traditional assets.

Meanwhile, metals have been strong. Reports disclose that with gold trading near $5,000 and silver approaching $100, some market players feel Bitcoin has been left out of a rally that lifted metals, which has weighed on confidence in the crypto market.

Bitcoin Price Action

Bitcoin has struggled to find a steady rhythm over the past week. Prices slipped below the $89,000 to $90,000 range as traders reacted to fresh geopolitical tension and renewed trade worries, before stabilizing as nerves eased.

This was driven higher after some soft political indicators around tariff threats, only to substantiate the idea that markets rarely react to conflict but rather to changes in tone and expectations.

Signals That Could Matter

These movements illustrate how Bitcoin behaves more like a risk asset rather than an asset shelter, falling in tandem with equities when unexpected financial shocks hit the globe, before rebounding when the fever subsides to gather fresh buyers.

Current price patterns indicate caution, where traders are weighing short-term political risks against medium- and long-term macro patterns, as well as institutional interests.

There are some quieter indications that the rout could be losing steam. To this effect, there are assertions suggesting that supply distribution on-chain and social chatter can be circumstantial evidence showing there is less selling pressure.

Featured image from Money; Shutterstock, chart from TradingView

Bitcoin Bears Record Fall In Market Strength — Is A Trend Reversal On?

In the past three days, the price of Bitcoin has moved between $88,000 to $90,000, indicating a rather stable market with little volatility. This ongoing price consolidation comes after the leading cryptocurrency suffered a significant setback in its goal to reclaim its psychological six-figure valuation.

During the week, Bitcoin prices fell from around $96,000 to below $88,000, establishing a new yearly low for 2026. However, amid this discouraging price action, the underlying on-chain data suggests a developing exhaustion among market bears, thus hinting at a highly-anticipated trend reversal.

Market Optimism Despite Negative Reading

In a recent QuickTake post, popular analyst Burak Kesmeci shares insight on a potential bullish reversal in the Bitcoin market following recent changes in the Growth Rate Difference – an on-chain metric that measures variation between the asset’s market cap growth rate and realized cap growth rate. 

For context, the market cap reflects the total market value of an asset, determined by price and circulating supply. Therefore, it’s often a speculative indicator. Conversely, the realized cap measures the actual capital inflows to an asset. It’s a slow-moving, structural metric, and it’s best for ascertaining capital commitment and the underlying market strength.

When the Bitcoin Growth Rate Difference is positive, it indicates a bull market, as speculative demand exceeds actual capital inflows. On the other hand, a negative value suggests that price growth is slower than real money inflows, which are characteristic of a bearish or consolidatory market.


Bitcoin

According to Kesmeci, the Bitcoin Growth Rate Difference has been negative since October 30, suggesting investors have been in a bear market over the last three months. During this time, prices have famously crashed by over 17%. 

However, the Growth Rate Difference has also increased from -0.0013 on November 22nd to -0.0009 on January 24, suggesting a budding resurgence in speculation and price growth. Moreover, this development also indicates that bearish fatigue is setting in, paving the way for a bullish market rebound. Nevertheless, a clean break above the 0 midline to confirm entry into bull territory and on-chain support for upside momentum.

Bitcoin Price Overview

At press time, Bitcoin is valued at $89,223, reflecting a minor loss of 0.25% in the last day. Meanwhile, the daily trading volume is down by 58.72,% indicating that most market participants are less willing to engage the market at the moment, thus explaining the sluggish price action. 

Bitcoin

Analyst Says You’re Not Bullish Enough On Ethereum – What Does He Mean?

A growing number of analysts believe Ethereum’s current price action is being misunderstood. Although frustration is growing due to Ethereum’s inability to hold above $3,000, some technical analysts are quick to point out that the structure forming beneath the surface tells a very different story. According to one analyst, the real risk right now is not being bullish on Ethereum and trying to short in anticipation of a downside breakout.

Higher Lows And A Structure That Keeps Tightening

The analyst’s technical view on Ethereum is focused less on short-term momentum and more on the structure developing on the chart, which he argues is even clearer than what is currently visible on Bitcoin’s chart.

Notably, Ethereum’s price action is carving out a series of higher lows on the daily candlestick timeframe chart to form a tightening triangular pattern since December 2025. This kind of behavior shows that each pullback is being absorbed at progressively higher levels, which is how strong trends reset before continuation.

Ethereum needs to avoid a breakdown below key support zones in order for this trend continuation setup to still be valid. According to the analyst, a dip under $2,860 would begin to weaken the pattern, while a close below $2,780 would invalidate the higher-low structure. 

At the time of writing, Ethereum is trading around $2,950, which is dangerously close to the lower boundary of this setup. Therefore, some traders will be tempted to short Ethereum at this level, but the analyst called it the dumbest thing to do here.

As long as those levels ($2,860 and $2,780) hold, the analyst sees no technical justification for betting against ETH, especially near the lower boundary of the channel where buyers have repeatedly stepped in. 

If support holds, the next move would be a gradual return to the upper trendline of the channel, which is just below $3,340. A move into that region would bring price back into direct contact with overhead resistance and set the stage for a breakout if buying pressure continues to increase.

Ethereum Price Chart. Source: @Tryrexcrypto on X

The Bigger Picture Behind Ethereum’s Price Action

Ethereum is entering 2026 without clear bullish momentum, a reality that has dampened sentiment across the spot and derivatives markets. Spot ETF inflows into Ethereum and Bitcoin have slowed down, and issuers have been highlighted with consistent days of outflows.

Nonetheless, major asset managers are still holding huge amounts of Ethereum and are working on diversifying their activities on Ethereum. BlackRock, for example, filed with the SEC in December to launch a staked Ethereum exchange-traded fund, a move that will bring in more institutional investors into the Ethereum ecosystem.

Speaking of staking, BitMine Technologies recently amped up its ETH staking to over $5.71 billion worth of Ethereum. On-chain data from Arkham Intelligence shows that the firm has staked an additional 171,264, worth $503.2 million, pushing its total stake to over 1.94 million ETH.

Featured image from Unsplash, chart from TradingView

❌