Reading view

There are new articles available, click to refresh the page.

Analyst Maps Shiba Inu Roadmap With 1,800% Upside If Altseason Plays Out

Crypto analyst Quantum Ascend has published a weekly-chart “roadmap” for Shiba Inu (SHIB) in a new video, laying out three upside targets for a potential altcoin cycle, while warning that SHIB’s deep multi-year drawdown could cap the move if macro conditions deteriorate.

The Base Case For Shiba Inu Price

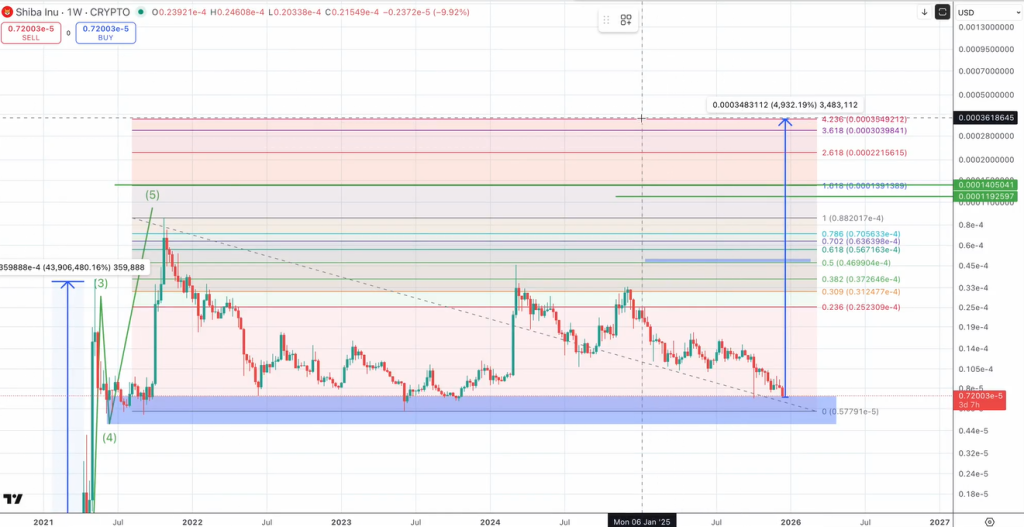
In his X post, Quantum Ascend listed “Altseason Targets” as a conservative level (“$0.47 e-8,” as written), a “Primary” target of $0.00014, and a “Blow-Off” target of $0.00035. In the video, the analyst anchored the roadmap to Elliott Wave-style structure and Fibonacci extensions, and emphasized that the bullish path is conditional, not guaranteed.

Starting from SHIB’s 2021 peak and the subsequent collapse, the analyst said the drawdown returned price to a historically meaningful zone: “Count out the five wave moves there pretty cleanly, but since then, nothing but a drawdown… Came back down right into this wave four low.”

From that setup, Quantum Ascend argued the decline can be read as a “crashing pattern” that often resolves with a reversal back toward prior highs.

“So you have your five waves down, and typically what’ll happen, price will roll back up to the fourth wave, and then what it does is it’s going to come take out this fifth wave. This is six, come take out that fifth wave, even if it’s just a little for a wave seven, then it’s done and it turns back the other direction, right? So when we’re looking at it from this perspective, we can see pretty textbook for the level it went to,” the analyst said.

Shiba Inu price analysis

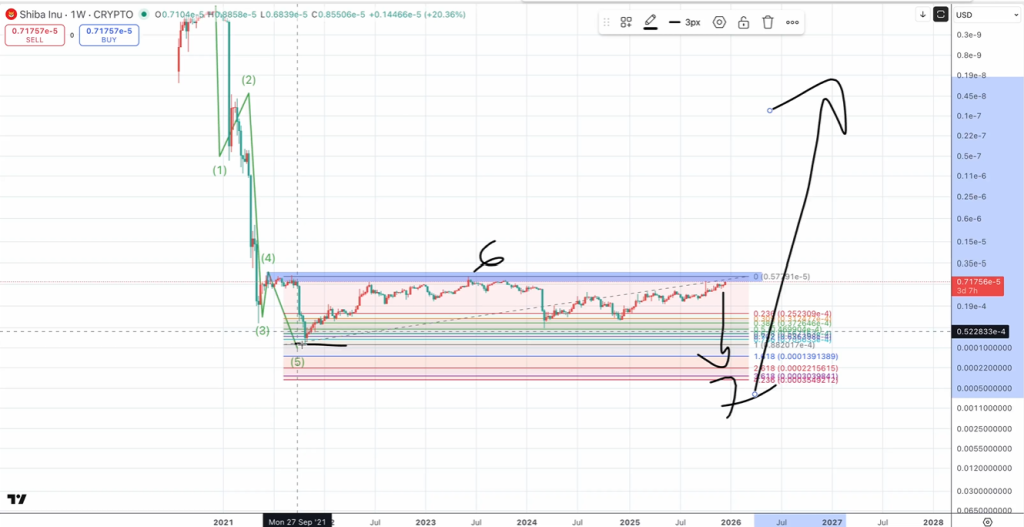
“So now that you see the case for a new high… we got to start taking these fibs into play here and figure out, all right, where’s some logical price levels for this thing to end up.”

Quantum Ascend then flagged the biggest constraint: SHIB’s magnitude of drawdown relative to prior-cycle behavior. “The one thing that’s stopping me from saying, yep, 100%, we’re going to see new highs, is going back to 2021, price is down 93% at the worst and right now down 92%,” the analyst said.

“Back in 2021, coins that set their highs in 2017 and had a 90% plus drawdown did not set new highs in the 2021 cycle… So this is a four-year range down 90 plus percent. It fits the parameter of some of those other coins that never ended up going off into a new all-time high.”

If that historical analog holds, the analyst said SHIB could be tracing a larger corrective structure rather than a fresh impulse. “If that’s the case, then this count would be five waves up and then we have an A, B into the retracements, and then C would start taking us much lower. That coincides with a recession-depression type feel,” the analyst said, adding: “And I do believe that that is the base case moving forward here… It’s just really important to understand the broader macro climate. Like this Shiba isn’t going unless everything else is lined up.”

The Bullish Case For SHIB Price

Even so, Quantum Ascend laid out upside zones using confluence between broader and nearer-term Fibonacci ranges. The analyst’s stated primary target for an “altseason environment” is the 1.618 Fibonacci extension at roughly $0.00014 which translates to a 1,800% rally from the current price. He added: “My blow-off is going to be a full 4.236 extension here of this range.” The blow-off scenario hits $0.00035, but was presented by him as technically possible but unlikely.

Shiba Inu Fibonacci analysis

Market-cap math was used as a reality check. “The thing I’ll say about SHIB is it’s at a $4.2 billion market cap right now. That’s pretty big, especially for what it is,” the analyst said, estimating that a move to the conservative area would imply roughly a $25 billion valuation and that the most extreme scenario would push into triple-digit billions. “That is massive getting up there… That’s like a 50x from where we’re at. And at that point, you’re talking 200 billion for a coin that doesn’t really do anything… In no way, shape, or form is this my base case.”

$SHIB | @Shibtoken 📽

Macro Structure Points to New Highs ↗

Altseason Targets🎯 ➤➤ Conservative: $0.47 e-8 ➤➤ Primary: $0.00014 ✅ ➤➤ Blow-Off: $0.00035

Here’s the Roadmap👇 pic.twitter.com/nWxQsVtLvv

— Quantum Ascend (@quantum_ascend) December 18, 2025

Despite publishing upside targets, Quantum Ascend stressed exit discipline over maximal upside capture, noting he does not hold SHIB. “I don’t own this coin, but if I did, I would be layered out all in this area [from the 0.5 Fibonacci level at $0.00004699] … I’d be done by the time it got up to that 1.618 Fibonacci at $0.00014,” the analyst said, arguing that “dollar cost averaging both in and out is a great strategy” in a meme-coin trade that ultimately depends on broader liquidity and risk appetite.

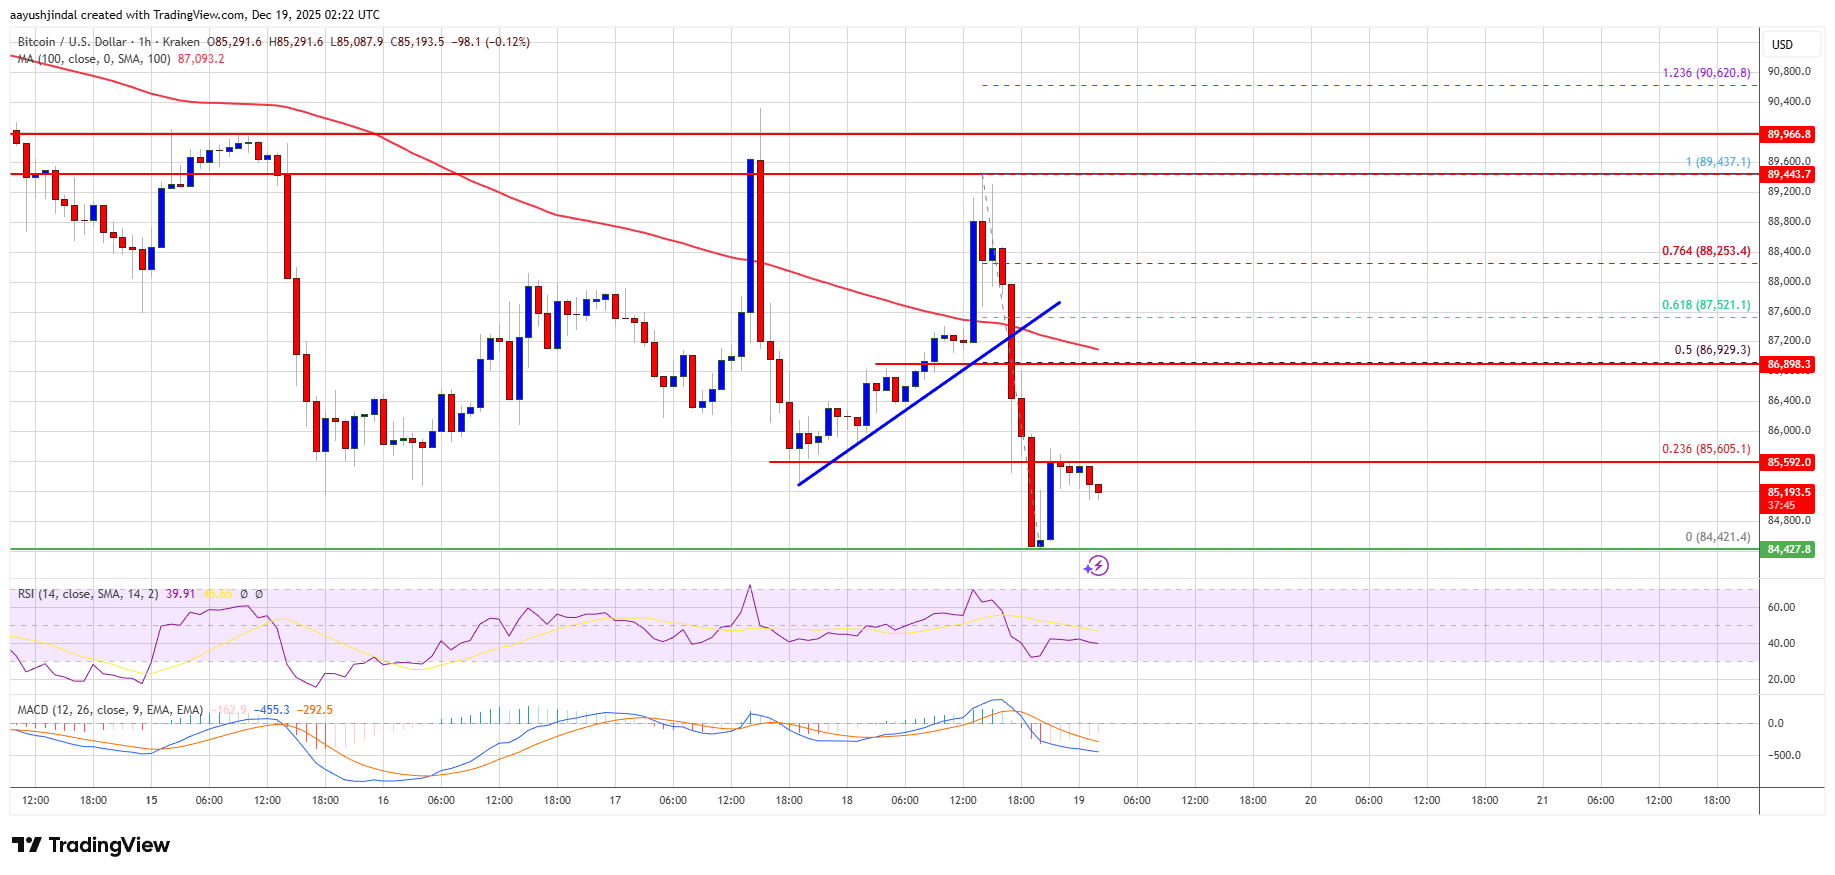
At press time, SHIB traded at $0.00000738.

Shiba Inu price chart

Dogecoin Holds The Floor, But Momentum Says Otherwise — A Critical Standoff Unfolds

Dogecoin is showing resilience at key support, with buyers repeatedly stepping in to absorb downside pressure. However, momentum indicators and the broader structure continue to favor the bears, keeping the short-term trend under stress. This tug-of-war sets the stage for a decisive move, as the next reaction will determine whether DOGE stabilizes or slides deeper.

DOGE Stuck In A Prolonged Corrective Phase

According to a recent update by More Crypto Online, Dogecoin’s price action remains stuck in a corrective phase that has been in place since November 2024. The sharp flash crash on October 10 added complexity to the broader structure, making the chart harder to interpret. However, the core scenarios outlined in earlier analyses are still valid, with the short-term trend clearly leaning to the downside.

Although the “yellow” scenario allows for the possibility of one more push higher, downside momentum is still currently in control. Until DOGE shows a decisive reaction at a major support level, or at least manages to stabilize before slipping below the 9.6-cent level that marks the October 10 low, further weakness should be expected.

Dogecoin

Initial support sits at 9.6 cents, followed by deeper levels at 8.0 cents and then 5.4 cents. Whether price eventually reaches these lower targets is still uncertain, but for now, there are no technical signals suggesting that a local bottom has formed.

Overall momentum remains negative, with DOGE still trading within a local downtrend. While a bullish reversal could develop at some point, current conditions do not justify adopting a bullish bias. Trying to anticipate a reversal ahead of confirmation carries increased risk in this environment, making caution the prudent approach for now.

Bears Press, But Dogecoin Refuses To Break

Crypto analyst Broke Doomer revealed that DOGE is displaying significant resilience, as bears have attempted to push the price lower multiple times without success. Despite the persistent downward pressure, the price continues to hold its ground, suggesting that the current support level is much firmer than sellers anticipated.

The analyst noted that every dip into this specific zone is being bought up relatively quickly, a clear indication that strong bids are still stepping in whenever weakness is shown. This aggressive “buy-the-dip” behavior suggests that institutional or large-scale buyers are likely positioning themselves within this consolidation range, preventing a deeper breakdown.

Given this ongoing battle between supply and demand, the focus has now shifted to the longevity of this base. Broke Doomer raised the question of how long this support will hold before buyers finally seize full control of the momentum.

Dogecoin

Here’s How Much % Of Bitcoin Supply Is Currently Sitting In Losses

On-chain analytics platform Glassnode has revealed the number of Bitcoin supply that is currently sitting at a loss. This comes as the BTC price continues to trade below the psychological $90,000 level following its crash, which began last month. 

Here’s The Amount Of Bitcoin Supply At A Loss

In a report, Glassnode revealed that the Bitcoin supply in loss has risen to 6.7 million BTC, marking the highest level of loss-bearing supply observed in this cycle. The analytics platform further noted that this represents 23.7% of the circulating supply, which is currently underwater. 10.2% of this supply is held by long-term holders and 13.5% by short-term holders. 

Glassnode stated that this distribution suggests that, much like in prior cycle transitions into deeper bearish regimes, the loss-bearing Bitcoin supply accumulated by recent buyers is gradually maturing into the long-term cohort.

Bitcoin

Meanwhile, the analytics platform noted that the 6-7 million range, which has been at a loss since mid-November, mirrors early transitional phases of prior cycles, where mounting investor frustration came before a shift toward more bearish conditions and intensified capitulation at lower Bitcoin prices

Notably, the Bitcoin price has dropped to levels last seen in 2024, erasing its year-to-date (YTD) gains. Glassnode stated that this has left behind a dense supply cluster accumulated by top buyers in the $93,000 to $120,000 range. The resulting supply distribution is said to reflect a top-heavy market structure where recovery attempts are capped by heavy overhead sell pressure, especially in the early stages of a bearish phase

Glassnode declared that as long as the Bitcoin price remains below this range and fails to reclaim key thresholds, most notably the Short-Term Holder Cost Basis at $101,500, the risk of further corrective downside persists.

BTC Spot Demand Is Unstable  

Glassnode revealed that the Bitcoin spot market flows continue to reflect an uneven demand profile across major venues. The Cumulative Volume Delta bias is said to show periodic bursts of buy-side activity, but has failed to develop into sustained accumulation, especially during the recent BTC price pullbacks

The on-chain analytics platform noted that the Coinbase spot CVD remains relatively constructive, indicating steadier participation from US-based investors. On the other hand, Binance and aggregate Bitcoin flows remain choppy and largely directionless. Glassnode stated that these dispersion points point to selective engagement rather than coordinated spot demand. 

Meanwhile, the platform alluded to recent Bitcoin price declines, which it pointed out have not triggered decisive expansion in positive CVD. Glassnode noted that this suggests dip-buying remains tactical and short-term. In the absence of sustained accumulation across all venues, Bitcoin’s price action continues to rely more on activity in the derivatives market and liquidity conditions rather than organic spot demand. 

At the time of writing, the Bitcoin price is trading at around $86,800, up in the last 24 hours, according to data from CoinMarketCap.

Bitcoin

XRP Holders Are In For More Pain As There’s ‘Not A Single Support Holding’

XRP holders could be facing another prolonged stretch of downside pressure as the cryptocurrency continues to lose ground in a weakening market. XRP’s performance this period has been underwhelming enough that analysts have seemingly given up hope of the price challenging higher resistance levels in the near term. They revealed that XRP has slipped below key support zones, leaving few technical barriers to slow further declines. 

XRP Faces Further Decline As All Support Fails

A crypto market analyst who goes by the name ‘Guy on the Earth’ on X has shared a rather bleak outlook on XRP’s near-term prospects. In his post on Thursday, the analyst revealed that XRP looks set for more pain as the market structure continues to deteriorate. He noted that price action is now threatening to lose its Descending Channel, signaling overall weakness rather than stabilization. 

According to the expert, the probability of XRP reclaiming the $1.95 level by the weekly close is incredibly low. However, losing this consolidation range that has contained price since November 2024 opens the door to a technical downside target near $0.90. He also pointed out that a confirmation from the monthly timeframe aligns with the two-week chart, which is fast approaching its close in just a few days. 

Guy on the Earth stated there was little optimism left in the current price setup. He emphasized that no meaningful support levels are holding, and the market demand appears thin, leaving XRP vulnerable to continued selling pressure and potential declines. The analyst’s review of the cryptocurrency’s performance was blunt, suggesting that the market “is what it is” at this stage. 

XRP Price

Looking at the chart shared alongside the analysis, XRP is clearly trading within a well-defined downward channel that has guided price lower for several months now. Each bounce attempt has been capped by descending resistance, reinforcing the cryptocurrency’s bearish trend. Recent candles also show price drifting toward the lower boundary of the Descending Channel, increasing the risk of a correction

Momentum indicators at the bottom of the chart also reflect ongoing pressure. XRP’s Relative Strength Index (RSI) sits near the lower end of its range, showing persistent weakness as price fails to recover.

Analyst Weighs Short-Term Hope For XRP

When asked by a crypto community member if a daily close back inside the Descending Channel could temporarily save XRP from an extended downturn, Guy on the Earth acknowledged the possibility. He stated that such a move could help in the short term but described it as a “trivial” development compared to larger structural levels.

The crypto analyst’s focus remains on the $1.95 level on the two-week close, highlighting it as the most critical area to watch. He pointed out that this structure has remained intact for the past 13 months, making it a defining support zone for XRP. While bouncing back to the channel would not erase the broader bearish trend, the expert revealed that it would at least suggest that XRP still has a chance to grow. 

XRP price chart from Tradingview.com

Bitcoin Feels The Weight Of Quantum Risk Concerns, Industry Leaders Warn

Concerns over quantum computing are weighing on Bitcoin’s price and slowing some investment flows, amid a sharp divide between developers and many investors.

Developers Call Threat Distant

According to Bitcoin developer Adam Back of Blockstream, quantum machines remain far from able to break Bitcoin’s protections. He said the tech is still “ridiculously early” and that research hurdles persist.

Back expects no real threat within the next decade and argued that even if parts of Bitcoin’s cryptography were compromised, the network would not automatically be emptied.

Security, he noted, does not rest solely on encryption in a way that would allow mass theft on the blockchain.

i think the risks are short term NIL. this whole thing is decades away, it’s ridiculously early and they have massive R&D issues in every vector of the required applied physics research to even find out if it’s possible at useful scale. but it’s ok to be “quantum ready” and

— Adam Back (@adam3us) December 18, 2025

The Risk That Keeps Some Awake

Other voices in the community disagree. Jameson Lopp, a well-known Bitcoin engineer, has warned about the worst-case outcome if quantum advances allowed attackers to break the ECDSA signature scheme that secures many wallets.

In that scenario, forged signatures could be used to move funds, and user confidence might erode quickly. That warning has been repeated as a technical possibility, not as something imminent.

How should we treat quantum vulnerable coins in a future where quantum computing becomes a threat? This panel from the Presidio Quantum Bitcoin Summit features myself, @theblackmarble, and @cryptoquick.https://t.co/jhr6hjLXru

— Jameson Lopp (@lopp) September 14, 2025

Investors Worry, Capital Shifts

Nic Carter, a partner at Castle Island Ventures, told observers that it is “extremely bearish” when influential developers appear to dismiss any quantum risk outright.

He said the gap between investor concern and developer assessment is large. Reports have disclosed that some capital is being held back while large holders consider spreading risk into other assets.

Craig Warmke of the Bitcoin Policy Institute added that perceived quantum risk has already pushed some holders to reduce their Bitcoin positions.

Quantum risk is stemming the flow of capital into bitcoin, and encouraging large holders to diversify out of bitcoin.

When non-technical people express concerns, they sometimes use technically incorrect language. It’s frustrating to see technical people dismiss concerns with an… https://t.co/MtSNY7Ivg3

— Craig Warmke (@craigwarmke) December 18, 2025

Current Technology Falls Short

Most cryptographers agree quantum computers today are not powerful enough to crack Bitcoin’s cryptography. That assessment is widely reported by analysts who follow both fields.

Metaculus’s median date for when quantum computers will break modern cryptography is 2040:https://t.co/Li8ni8A9Ox

Seemingly about a 20% chance it will be before end of 2030.

— vitalik.eth (@VitalikButerin) August 27, 2025

Still, the timeline is debated. Based on reports from researchers and public comments from industry figures like Vitalik Buterin, there is a measurable chance — about ~20% — that a machine capable of breaking today’s crypto could exist by 2030. That estimate has prompted calls for proactive steps.

Calls For Preparedness Grow

Financial institutions and national programs, the reports say, are investing heavily in quantum work, and tools like AI are accelerating research in the field. As a result, many in the crypto world argue contingency plans should be ready well before any practical threat appears.

Suggestions include moving to quantum-resistant signature schemes and improving wallet practices so funds are not left exposed while upgrades take place. Some experts point out that banks and other big targets may face attacks earlier, which could give the crypto sector time to respond.

Featured image from Shutterstock, chart from TradingView

$415 Million Bitcoin Gamma Flush Looms: The Next 8 Days Are Crucial, Says Analyst

Bitcoin’s options market has a new obsession: Christmas week. In a post Thursday, energy-sector managing partner David Eng argued the next eight days (December 19 through December 26) could define the near-term cycle for BTC, not because of a macro headline or some sudden ETF stampede, but because a large chunk of dealer gamma exposure is scheduled to roll off the board in two shots.

At press time, bitcoin traded around $86,928, after swinging between roughly $84,461 and $89,230 intraday. Eng’s framing is blunt and very “options people”: the market is being mechanically pinned, and the pin has an expiry date

The Hidden Force Holding Back Bitcoin Price?

“The narrative isn’t just about tomorrow. We are staring down the barrel of a ‘Double-Barreled’ Liquidity Event that will wipe 67% of the entire derivatives board clean by December 26th,” Eng wrote. “Bitcoin is trading at $88,752, deep in the -25% Value Zone (Trend Value: $118k). The spring is coiled, but two massive structural weights are holding the lid down.”

Those “weights,” in his telling, are two expiries with meaningful gamma attached: roughly $128 million tied to Dec. 19 (21% of the total he tracks) and another $287 million at Dec. 26, which he calls the “boss level” ceiling. He labels the combined $415 million a coming “Gamma Flush,” arguing that once it clears, the hedging drag that’s been compressing spot price action should ease.

The practical point is less mystical than it sounds. If dealers are sitting on meaningful gamma around a tight cluster of strikes, their delta-hedging can dampen volatility and keep spot gravitating around certain levels until that exposure decays or expires — the kind of “why does this tape feel glued?” frustration traders know too well.

Eng’s map is built around very specific lines in the sand: $85k–$90k as the “mud” zone where hedging pressure keeps snapping price back, and $90,616 as the flip level he’s watching around the Dec. 19 expiry.

“Stage 1: The Spark (Tomorrow, Dec 19) — $128 Million in Gamma expires tomorrow (21% of total). This is the ‘Appetizer.’ It removes the immediate suppression pinning us below $90k,” he wrote. “Watch the $90,616 flip level. If we clear this, the intraday shackles fall off.”

But Eng is clearly more focused on the week after. “Stage 2: The Floodgate (Next Friday, Dec 26) — $287 Million in Gamma expires next week,” he continued. “A staggering 46.2% of all dealer gamma exposure sits on this single date… Dealers have a quarter-billion-dollar incentive to keep volatility crushed and price pinned near $85k-$90k through Christmas to harvest this premium.”

The claim, basically: pre-Dec. 26 is “thick mud,” post-Dec. 26 is the tape suddenly breathing again. “When you combine these two dates, $415,000,000 of gamma — two-thirds of the entire market structure — evaporates in the next 8 days,” Eng wrote. “Before Dec 26: The market is fighting through thick mud… After Dec 26: The mud dries up. The suppression mechanism is gone. The Power Law gravity ($118k) takes over without the dealer counter-flow.”

He also tossed out a provocative ratio that’s been circulating in derivatives circles all year: dealer mechanics versus ETF demand. “Dealer Gamma forces are currently ~13x stronger than ETF Flows,” he wrote. “Dealer ~$507.6M, ETF ~$38M. This is why the market is obeying the technical gamma levels ($85k/$90k) and ignoring the ETF volume.”

Dealer Gamma forces are currently ~13x stronger than ETF Flows

Dealer ~$507.6M ETF ~$38M

This is why the market is obeying the technical gamma levels ($85k/$90k) and ignoring the ETF volume.

— David 🇺🇸 (@david_eng_mba) December 18, 2025

And when critics in the replies questioned whether “$287M” is even meaningful, Eng clarified what the figure is — and what it isn’t. “The $287M figure refers to dealer gamma exposure (GEX), not total options size,” he wrote. “GEX measures how much spot Bitcoin dealers may need to buy or sell to stay delta-neutral as price moves. It reflects hedging pressure, not notional value.”

So the tradeable implication of Eng’s thesis is straightforward: expect the pinning games into Christmas, then watch whether a post-expiry regime shift actually shows up in realized volatility — and in price’s ability to stop bouncing off the same levels like it’s hitting invisible glass.

At press time, Bitcoin traded at $87,953.

Bitcoin price chart

Solana (SOL) Support Shattered, Potential $100 Test Looms, Says Analyst

Solana (SOL) is currently one of the poorest performers among the top ten largest cryptocurrencies in the market, experiencing a sharp 13% decline over the past week. 

Bearish Patterns Emerge For Solana

This downturn comes as the cryptocurrency has broken below the critical support level of $120, which had acted as a pivotal floor since the start of the month and previously prevented further drops.

The situation appears even more dire for investors with bullish sentiments, as recent data from CoinGecko indicates that Solana has retraced nearly 60% from its all-time high of $293, reached back in January of this year. 

Year-to-date, the token has experienced a significant loss of 40%, which raises additional concerns among top analysts about its near-term stability.

Experts are cautioning that unless conditions change, the Solana price may soon retest the $100 mark—an area not seen since April. Should this scenario materialize, it would imply an additional drop of approximately 15.9%. 

Some analysts, like market commentator EddieTradezz, have pointed to a bearish “head and shoulders” pattern formed in SOL’s daily chart, suggesting that Solana is on the brink of a substantial decline. 

He notes that it is now breaking through strong long-term resistance, with April’s lows around $95 potentially being a more realistic target than $100.

Adding to the bearish sentiment, fellow expert ColdBloodShill has indicated that Solana may be heading toward a price point of $80, which would result in a drastic additional drop of 32%. However, as EddieTradezz mentioned, the possibility for recovery would largely depend on market-wide conditions and investor sentiment.

Institutional Interest Grows As SOL ETFs See Major Inflows

Despite the prevailing bearish indicators, there has been a noteworthy development on the institutional front. Recently approved Solana exchange-traded funds (ETFs) in the US have seen impressive uptake, amassing $63.9 million in net inflows over the past week. 

This suggests that institutions are beginning to accumulate Solana, potentially viewing it as a long-term investment opportunity. However, this positive news has been overshadowed by heavy selling pressure in spot markets. 

Increased volatility has led to a rise in liquidations for leveraged positions, dampening Solana’s price reaction to the overall positive developments in institutional interest.

Ultimately, Solana’s future remains uncertain. While institutional interest may offer some hope, the immediate outlook is clouded by increased selling pressure and the inability to regain capital in the broader market, which has recently dropped below the $2.90 trillion mark in total market capitalization.

Solana

Featured image from DALL-E, chart from TradingView.com

Trump-Linked World Liberty Backs USD1 With Treasury-Fueled Expansion

World Liberty Financial has put forward a proposal to tap a portion of its token treasury to grow USD1, the dollar-pegged stablecoin linked with the project. The plan would free up about $120 million to back listings, liquidity programs and partner incentives.

Treasury Move Could Add Firepower To USD1

Based on reports, WLFI’s proposal would unlock roughly 5% of its unlocked treasury — a fund slice drawn from a multi-billion dollar reserve — for strategic use to expand USD1’s reach. The move has split the community, with some holders supporting rapid expansion and others warning about tokenomics and governance risks.

According to the stablecoin’s custodial partners, USD1 is backed by short-term US government treasuries, US dollar deposits and other cash equivalents and is redeemable at one-for-one for US dollars. Independent pages from the custodian outline monthly attestation reporting and a conservative reserve mix.

Reports have disclosed that USD1 has grown quickly since launch and sits among the larger USD-pegged tokens, with circulating supply and market cap figures showing meaningful traction on trading platforms. Exchange listings and deeper integrations have raised visibility, and some market trackers put USD1’s market cap in the multi-billion dollar range.

Political Links Add A Layer Of Scrutiny

World Liberty Financial is widely described in news reporting as a project backed by the Trump family, and that political link has drawn extra attention from regulators, lawmakers and media. Coverage has noted how the family’s involvement makes governance decisions more visible and politically sensitive.

The proposal is now subject to a WLFI governance vote. Supporters argue the $120 million allocation could accelerate integrations with both centralized exchanges and decentralized finance venues, improving liquidity and on-ramp options for users.

Opponents point to the size of the spend and question whether deploying a large treasury sum for adoption incentives could push short-term token price moves that do not reflect long-term utility.

What To Watch Next

Observers will track the governance tally, any formal rollout plans for the funds, and reserve attestations tied to USD1. Market metrics such as circulating supply and exchange flows will also offer clues about how the push affects liquidity and peg stability. Recent exchange pages already show USD1 circulating supply figures and listing details that analysts use to measure adoption.

In short, the proposal could widen USD1’s footprint quickly if approved. But it raises clear governance and market questions that WLFI holders and outside watchers now want answered before any large sums are moved.

Featured image from Unsplash, chart from TradingView

Bitcoin Mirrors Q1 2025 Playbook, Is It Headed To $70,000 Before Year’s End?

As the market volatility continues, Bitcoin (BTC) has failed to hold its short-lived momentum and reclaim a key resistance level for the second time this week. Some market watchers have affirmed that the flagship crypto may continue to have a disappointing end-of-year rally and potentially reach new lows before the pain is over.

New Lows Before A 2026 Recovery?

On Thursday, Bitcoin attempted to break past a crucial level after surging 2.9% from its daily opening. The cryptocurrency has been unable to reclaim $89,000-$90,000 area since the start-of-week correction, which sent the price to a two-week low of $85,145.

Notably, the flagship crypto retested the crucial resistance area twice in the past 24 hours but has been rejected, falling back to the local lows. Market observer Ted Pillows highlighted that BTC has been holding above the $85,000 support zone despite the volatility, which could lead to another retest of the key $90,000-$92,000 zone if it holds.

However, if price break below local support zone, Bitcoin would likely see a retest of the November lows, around the $80,000 mark. Ted also pointed out that the cryptocurrency may be mirroring its Q1 2025 price action, which suggests that a price drop below the recent lows could happen.

Per the chart, BTC briefly bounced in March from its early 2025 correction before recording a lower low in the next few weeks. This was then followed by the Q2 and Q3 recovery rallies that propelled the price to its latest all-time high (ATH) of $126,000.

bitcoin

Now, Bitcoin displays a similar performance, currently recovering from the initial corrective phase. If history repeats, the flagship crypto could see a 10%-15% drop to the $74,000-$76,000 area in the coming weeks before kicking off a rally toward new highs in 2026, the analyst suggested.

Bitcoin To Continue With ‘No Direction’

Similarly, Ali Martinez affirmed that the cryptocurrency is at an inflection point and risks dropping up to 20% if the $87,000 support doesn’t hold. He explained that BTC is breaking out of a bear flag, which could target the $70,000 level if selling pressure spikes.

Meanwhile, another analyst considers that “sentiment [is] flipping based on every last daily candle colour.” Daan Crypto Trades pointed out that Bitcoin has been trading within the $84,000-$93,500 for the past four weeks, “moving up and down in a choppy fashion, while trading in between these two larger levels.”

To the trader, the next few weeks will continue to be “generally very choppy and lack direction” due to lower liquidity and trading volume during the holiday season. “I don’t think you’d be missing much if you log off and come back somewhere early January,” he added.

On the contrary, analyst Crypto Jelle affirmed that despite the low-timeframe struggles, Bitcoin “still flat out refuses to drop lower, no matter how hard bears try.” He noted that price still sits “on a clear weekly support level” that has held since April, explaining that as long as this area holds, price can still reclaim the monthly opening, around the $90,300 area.

As of this writing, BTC trades at $86,138 a 5.3% decline in the weekly timeframe.

bitcoin, btc, btcusdt

Crypto Payments Firm MoonPay Set For $5 Billion Valuation With NYSE Owner’s Backing

Crypto payment platform MoonPay is poised to receive a significant fundraising boost as recent reports suggest that Intercontinental Exchange (ICE), the owner of the New York Stock Exchange (NYSE), is exploring an investment in the company. 

According to a Bloomberg report, which cited sources familiar with the discussions, MoonPay is close to finalizing this fundraising round and is targeting a valuation around $5 billion.

New Regulatory Approval And Investment Talks

Based in New York, MoonPay specializes in simplifying the trading of cryptocurrencies through various payment methods, including PayPal, Apple Pay, and Venmo. The platform also offers tools for users to send, receive, and manage stablecoins. 

Notably, MoonPay recently obtained a Limited Purpose Trust Charter from the New York Department of Financial Services (NYDFS), a significant regulatory approval that complements its existing BitLicense. 

This charter enables MoonPay to expand its custody and other crypto services within New York, placing the company in league with established players like Coinbase (COIN) and PayPal, which also operate under the state’s strict digital asset regulations.

The momentum for MoonPay continues to build, particularly with news that Caroline Pham, the acting chair of the Commodity Futures Trading Commission (CFTC), plans to join the firm as its chief legal and administrative officer. 

CFTC Chair Caroline Pham to Join MoonPay

Pham has been a notable figure in the regulatory landscape, having served on the CFTC’s board since April 2022 and becoming acting chair in January 2025. 

She announced her intention to return to the private sector once a permanent chair was confirmed, which is expected to happen this week with Mike Selig’s anticipated confirmation.

Under Pham’s leadership, the CFTC expedited several initiatives focused on cryptocurrencies, including the allowance for spot crypto trading on futures exchanges and the launch of a digital assets pilot program permitting the use of assets like Bitcoin (BTC) and Ethereum (ETH) in derivatives markets. 

Additionally, Pham implemented various operational changes within the CFTC, reportedly leading to nearly $50 million in annual savings by enhancing governance and accountability.

Pham articulated that her agenda as acting chair concentrated on executing a range of presidential executive orders aimed at promoting regulatory clarity and efficiency across government agencies. 

Reflecting on her decision to join MoonPay, she emphasized the importance of people in her career choices, stating that meaningful connections guide her decisions.

Her connection to MoonPay began through a dinner hosted by Christie’s Art + Tech in 2023, where she met MoonPay’s president, Keith Grossman. A conversation that started at the dinner evolved into a friendship and later professional discussions as Pham considered her options post-government.

Grossman expressed confidence in Pham’s capabilities, stating, “MoonPay has really matured, and Caroline is the exact type of leader with the exact type of big bank and regulatory experience that’s needed for us to be able to move to the next level.”

MoonPay

Featured image from DALL-E, chart from TradingView.com

Dogecoin (DOGE) Sinks Further Into Red as Momentum Turns Sharply Bearish

Dogecoin started a fresh decline below the $0.1250 zone against the US Dollar. DOGE is now consolidating losses and might face hurdles near $0.1235.

  • DOGE price started a fresh decline below the $0.1250 level.
  • The price is trading below the $0.1220 level and the 100-hourly simple moving average.
  • There is a key bearish trend line forming with resistance at $0.1300 on the hourly chart of the DOGE/USD pair (data source from Kraken).
  • The price could extend losses if it stays below $0.1280 and $0.1300.

Dogecoin Price Dips Further

Dogecoin price started a fresh decline after it closed below $0.1300, like Bitcoin and Ethereum. DOGE declined below the $0.1280 and $0.1250 support levels.

The price even traded below $0.1220. A low was formed near $0.1198, and the price is now showing bearish signs. It is consolidating below the 23.6% Fib retracement level of the downward move from the $0.1305 swing high to the $0.1198 low.

Dogecoin price is now trading below the $0.1280 level and the 100-hourly simple moving average. If there is a recovery wave, immediate resistance on the upside is near the $0.1235 level. The first major resistance for the bulls could be near the $0.1280 level or the 76.4% Fib retracement level of the downward move from the $0.1305 swing high to the $0.1198 low.

Dogecoin Price

The next major resistance is near the $0.1300 level. There is also a key bearish trend line forming with resistance at $0.1300 on the hourly chart of the DOGE/USD pair. A close above the $0.1300 resistance might send the price toward the $0.1350 resistance. Any more gains might send the price toward the $0.1372 level. The next major stop for the bulls might be $0.1400.

More Losses In DOGE?

If DOGE’s price fails to climb above the $0.1300 level, it could continue to move down. Initial support on the downside is near the $0.1200 level. The next major support is near the $0.1195 level.

The main support sits at $0.1150. If there is a downside break below the $0.1150 support, the price could decline further. In the stated case, the price might slide toward the $0.1050 level or even $0.10 in the near term.

Technical Indicators

Hourly MACD – The MACD for DOGE/USD is now gaining momentum in the bearish zone.

Hourly RSI (Relative Strength Index) – The RSI for DOGE/USD is now above the 50 level.

Major Support Levels – $0.1280 and $0.1250.

Major Resistance Levels – $0.1340 and $0.1350.

XRP Price Turns Lower as a Familiar Pattern Reappears Again

XRP price failed to gain pace above $1.920 and trimmed gains. The price is now struggling and faces resistance near the $1.820 level.

  • XRP price started a fresh decline below the $1.850 zone.
  • The price is now trading below $1.850 and the 100-hourly Simple Moving Average.
  • There is a bearish trend line forming with resistance at $1.920 on the hourly chart of the XRP/USD pair (data source from Kraken).
  • The pair could continue to move down if it settles below $1.780.

XRP Price Dips To New Weekly Lows

XRP price attempted a recovery wave above $1.90 but failed to continue higher, like Bitcoin and Ethereum. The price started a fresh decline below $1.880 and $1.850.

There was a move below the $1.820 support level. A low was formed at $1.7707, and the price is now showing bearish signs below the 23.6% Fib retracement level of the downward move from the $1.9331 swing high to the $1.7707 low.

The price is now trading below $1.850 and the 100-hourly Simple Moving Average. There is also a bearish trend line forming with resistance at $1.920 on the hourly chart of the XRP/USD pair.

If there is a fresh upward move, the price might face resistance near the $1.810 level. The first major resistance is near the $1.8520 level or the 50% Fib retracement level of the downward move from the $1.9331 swing high to the $1.7707 low. A close above $1.8520 could send the price to $1.880.

XRP Price

The next hurdle sits at $1.920 and the trend line. A clear move above the $1.920 resistance might send the price toward the $1.9650 resistance. Any more gains might send the price toward the $2.00 resistance. The next major hurdle for the bulls might be near $2.050.

More Losses?

If XRP fails to clear the $1.8520 resistance zone, it could start a fresh decline. Initial support on the downside is near the $1.780 level. The next major support is near the $1.7620 level.

If there is a downside break and a close below the $1.7620 level, the price might continue to decline toward $1.720. The next major support sits near the $1.70 zone, below which the price could continue lower toward $1.680.

Technical Indicators

Hourly MACD – The MACD for XRP/USD is now gaining pace in the bearish zone.

Hourly RSI (Relative Strength Index) – The RSI for XRP/USD is now below the 50 level.

Major Support Levels – $1.780 and $1.7620.

Major Resistance Levels – $1.8520 and $1.920.

Bitcoin & Ethereum Diverge: Longs Dominate BTC, While ETH Shorts Rise

Data shows Bitcoin and Ethereum have formed a divergence in the Funding Rate indicator, with traders going long on BTC, short on ETH.

Bitcoin & Ethereum Funding Rates Are Showing Opposite Values

In a new post on X, on-chain analytics firm Santiment has talked about how the Funding Rate has developed for Bitcoin and Ethereum amid the latest market volatility.

Bitcoin and other cryptocurrencies saw some sudden price swings during the past day, with BTC’s price first rallying to $90,300 in a blink, but then crashing back toward $86,000 just as quickly. The coin’s decline later extended to $85,300.

While BTC returned to about the same levels as before the flash surge, the same wasn’t true about Ethereum. After its rally to $3,000, ETH plummeted to $2,830, before another leg down to about $2,790. Before the volatility storm, the cryptocurrency was trading around $2,920.

The difference in price action could be a potential factor behind the divergence that has formed in the derivatives market sentiment as gauged by the Funding Rate.

The Funding Rate keeps track of the periodic amount of fees that derivatives traders are paying on all centralized exchanges. A positive value on the indicator is a sign that long investors are paying the short ones, while a negative one implies bearish positions outweigh the bullish ones.

Now, here is the chart shared by Santiment that shows how the Funding Rate has changed for Bitcoin and Ethereum over the past month:

Bitcoin & Ethereum Funding Rate

As displayed in the above graph, the Bitcoin Funding Rate has been positive for the last few days, indicating that a bullish mentality has been dominant among the traders. This sentiment has been maintained even after the price volatility.

Ethereum was also observing a positive value on the Funding Rate prior to the volatility, but unlike for BTC, the trend didn’t last. Since ETH has gone through its quick surge and flash crash, the indicator has turned red, a sign that shorts have started outpacing longs.

The fact that bullish sentiment around ETH has weakened, however, may not actually be negative. According to Santiment, highly leveraged long positions have historically led to sharp liquidation events and volatility. This trend was also seen during some recent tops and pullbacks.

Thus, considering that the Funding Rate is negative for Ethereum now, the risk of volatility may be lower. That said, Bitcoin’s long-heavy market could still be relevant for the cryptocurrency.

As Santiment explains, “all assets will still move with Bitcoin, meaning Bitcoin’s funding rates must stay neutral or go negative in order to justify a clear path back to $100K and for altcoins to rebound.”

BTC Price

Bitcoin has recovered back to $87,100 following its plunge on Wednesday.

Bitcoin Price Chart

Ethereum Price Sinks Again—Are Bulls Running Out of Defenses?

Ethereum price failed to stay above $2,950 and declined again. ETH is now consolidating and might soon aim to attempt another recovery wave if it clears $2,850.

  • Ethereum started a fresh decline below the $2,920 zone.
  • The price is trading below $2,900 and the 100-hourly Simple Moving Average.
  • There is a connecting bearish trend line forming with resistance at $2,925 on the hourly chart of ETH/USD (data feed via Kraken).
  • The pair could continue to move down if it settles below the $2,800 zone.

Ethereum Price Faces Renewed Selling Pressure

Ethereum price attempted a fresh increase but struggled above $2,950, like Bitcoin. ETH price dipped below $2,920 and $2,900 to enter a bearish zone.

The bears even pushed the price below $2,820. A low was formed at $2,775 and the price is now consolidating losses well near the 23.6% Fib retracement level of the downward move from the $2,993 swing high to the $2,775 low.

Ethereum price is now trading below $2,870 and the 100-hourly Simple Moving Average. Besides, there is a connecting bearish trend line forming with resistance at $2,925 on the hourly chart of ETH/USD.

If there is another upward move, the price could face resistance near the $2,850 level. The next key resistance is near the $2,880 level and 50% Fib retracement level of the downward move from the $2,993 swing high to the $2,775 low. The first major resistance is near the $2,925 level and the trend line.

Ethereum Price

A clear move above the $2,925 resistance might send the price toward the $3,000 resistance. An upside break above the $3,000 region might call for more gains in the coming days. In the stated case, Ether could rise toward the $3,080 resistance zone or even $3,120 in the near term.

Downside Continuation In ETH?

If Ethereum fails to clear the $2,850 resistance, it could start a fresh decline. Initial support on the downside is near the $2,800 level. The first major support sits near the $2,775 zone.

A clear move below the $2,775 support might push the price toward the $2,720 support. Any more losses might send the price toward the $2,640 region. The next key support sits at $2,620.

Technical Indicators

Hourly MACDThe MACD for ETH/USD is losing momentum in the bearish zone.

Hourly RSIThe RSI for ETH/USD is now below the 50 zone.

Major Support Level – $2,775

Major Resistance Level – $2,880

Flight To Metals? Gold And Silver Hit Records While Bitcoin Drops

Gold and silver hit fresh highs on Tuesday while Bitcoin slid back under $89,000, sending a clear message that some investors are favoring metal over riskier bets.

According to Reuters and market data, gold traded above $4,330 an ounce and silver pushed past $66 an ounce in what market participants called a strong run for bullion. Reports have disclosed that silver’s rally has lifted local prices in India to about ₹2.06 lakh per kilogram.

Metals Rally, Hit New Highs

Silver’s advance has been dramatic. It is up roughly 120-130% year-to-date, a jump that outpaces gold by a wide margin.

Traders point to a mix of stronger industrial demand from solar and electronics, tighter supplies, and flows into safe assets as reasons behind the move.

Gold buyers have also been encouraged by signs that US inflation may cool and by shifting expectations for central bank policy, which tends to support non-yielding assets when real yields fall.

JUST IN 🚨: Silver soars to $66 for the first time in history 📈🥳🫂 pic.twitter.com/YGCrB5VDPH

— Barchart (@Barchart) December 17, 2025

Safe Haven Demand And Industrial Use

Some investors are treating metals as a hedge. Others want exposure linked to real economy needs. Both forces are at work. Analysts say silver’s dual role — as an industrial metal and as a store of value — is amplifying moves.

Energy prices and supply reports have added pressure on markets, and that has upped demand for physical metal in several trading hubs.

Bitcoin Slips Under Key Level

Bitcoin fell below $89,000 and was trading nearer to $88,450 in mid-session, giving back gains from earlier months. Based on reports and market feeds, BTC is about 7% lower year-to-date and roughly 30% below its October 2025 peak above $126,000.

Some crypto funds recorded outflows recently, and several traders described market tone as risk-off, which has weighed on digital assets this week.

Liquidity, ETF Flows And Sentiment

ETF flows played a role. Where money leaves ETFs, prices can feel the impact quickly. Margin calls, profit taking after a volatile run, and investors moving to what they see as safer stores of value have all been cited by sources watching the tape.

Technical levels near $84,000 to $85,000 are now being watched for support, while resistance sits close to $90,000 to $92,000.

Markets Eye Data And Policy Moves

Economic reports and central bank signals are next on traders’ calendars. US inflation prints and comments from global central banks have been flagged as possible triggers for fresh moves in both metals and crypto.

Investors also noted that equity weakness, especially in some large tech names, has nudged money toward hard assets and away from riskier positions.

Several market strategists said that policy shifts overseas, including from the Bank of Japan, could further change global liquidity and investor choices.

Featured image from Unsplash, chart from TradingView

Bitcoin Price Retests Support—Is the Market Bracing for Volatility?

Bitcoin price attempted to start a fresh increase but failed at $89,500. BTC is now struggling below $86,500 and might continue to move down.

  • Bitcoin started a fresh decline below the $86,500 zone.
  • The price is trading below $86,500 and the 100 hourly Simple moving average.
  • There was a break below a bullish trend line with support at $87,250 on the hourly chart of the BTC/USD pair (data feed from Kraken).
  • The pair might continue to move down if it settles below the $85,000 zone.

Bitcoin Price Dips Again

Bitcoin price attempted a fresh recovery wave above $88,000 and $88,500. BTC tested the $89,500 resistance zone and reacted to the downside. There was a sharp decline below $88,000.

There was a break below a bullish trend line with support at $87,250 on the hourly chart of the BTC/USD pair. The price even spiked below the $85,000 support. However, the bulls were active near the $84,500 zone. A low was formed at $84,421 and the price is now consolidating losses below the 23.6% Fib retracement level of the downward move from the $89,437 swing high to the $84,421 low.

Bitcoin is now trading below $87,000 and the 100 hourly Simple moving average. If the bulls remain in action, the price could attempt more gains. Immediate resistance is near the $86,600 level. The first key resistance is near the $87,000 level and the 50% Fib retracement level of the downward move from the $89,437 swing high to the $84,421 low.

Bitcoin Price

The next resistance could be $88,000. A close above the $88,000 resistance might send the price further higher. In the stated case, the price could rise and test the $88,800 resistance. Any more gains might send the price toward the $89,500 level. The next barrier for the bulls could be $90,000 and $90,500.

More Losses In BTC?

If Bitcoin fails to rise above the $87,000 resistance zone, it could start another decline. Immediate support is near the $85,000 level. The first major support is near the $84,500 level.

The next support is now near the $83,200 zone. Any more losses might send the price toward the $82,500 support in the near term. The main support sits at $80,500, below which BTC might accelerate lower in the near term.

Technical indicators:

Hourly MACD – The MACD is now gaining pace in the bearish zone.

Hourly RSI (Relative Strength Index) – The RSI for BTC/USD is now below the 50 level.

Major Support Levels – $85,000, followed by $84,500.

Major Resistance Levels – $87,000 and $88,000.

Bitcoin Faces Elevated Downside Risk: Loss Selling Takes Hold As STH SOPR Falls Below 1

Bitcoin has been under intense selling pressure in recent sessions, leaving market participants increasingly cautious about near-term direction. On Wednesday, BTC briefly surged from the $86,000 area toward $90,000, offering short-term investors a moment of relief after weeks of downside volatility.

That rebound, however, proved short-lived. Price quickly retraced back to the $86,000 level, once again stalling bullish momentum and reinforcing the perception that sellers remain firmly in control.

This failed recovery attempt has weighed heavily on sentiment, particularly among short-term holders who entered positions at higher levels during the previous consolidation range. According to a report by Axel Adler, on-chain data reveals that this cohort has entered a clear stress regime. Bitcoin’s price has fallen below the average purchase price of short-term holders, a condition that historically increases the probability of reactive selling behavior.

The stress is further reflected in the Short-Term Holder Spent Output Profit Ratio (STH-SOPR, 30-day), which has declined to 0.98. This reading indicates that short-term holders are, on average, realizing losses when they sell. Such environments often coincide with deteriorating confidence and heightened sensitivity to further downside moves.

Bitcoin Short-Term Holder SOPR | Source: CryptoQuant

With BTC unable to hold recent relief rallies and short-term participants increasingly underwater, the market enters a fragile phase. The coming days will be critical in determining whether this pressure evolves into deeper capitulation or stabilizes into a base-building process.

Short-Term Holders Under Stress as Loss-Taking Accelerates

Adler explains that the Short-Term Holder Spent Output Profit Ratio (STH-SOPR 30D) is a critical gauge of short-term market stress, as it measures whether recent coin sales are occurring at a profit or a loss. Values above one indicate that short-term holders are selling profitably, while readings below one signal loss realization.

Historically, sustained periods below one reflect deteriorating confidence and raise the risk of further downside, as loss-taking behavior can cascade into additional sell pressure. A continued decline in SOPR would likely intensify this dynamic and open the door to new local lows.

By contrast, a meaningful recovery would require the metric to reclaim and hold above the one level, signaling that selling pressure is being absorbed and losses are no longer dominant.

This stress is reinforced by the Short-Term Holders Positive vs Negative Sentiment chart. The indicator classifies holders based on whether they are in profit or at a loss. Over the past five weeks, sentiment has shifted decisively toward the orange and purple zones, representing negative positioning.

Bitcoin Short-Term Holders Positive vs Negative Sentiment | Source: CryptoQuant

The growing dominance of underwater holders increases the probability of panic-driven selling. Together, both charts deliver a consistent message: short-term participants are under pressure, and the current environment remains fragile until clear signs of relief emerge.

Bitcoin Tests Critical Support as Bears Persist

Bitcoin continues to trade under pressure, with the chart showing price consolidating around the $87,000 area after a sharp corrective move from the October highs near $125,000. The rejection from the upper range marked a clear shift in market structure, as BTC lost the 50-day and 100-day moving averages and failed to reclaim them on subsequent rebounds. The blue moving average has now turned downward, reinforcing the short- to medium-term bearish bias.

BTC facing critical support | Source: BTCUSDT chart on TradingView

Price is currently hovering just above the 200-day moving average, plotted in red, which sits near the $86,000–$88,000 zone. This level represents a critical area of long-term demand and structural support. Historically, sustained closes below the 200-day average tend to coincide with deeper corrective phases or prolonged consolidation.

Volume dynamics add to the cautious outlook. Selling pressure expanded significantly during the breakdown in October and November, while recent rebound attempts have occurred on relatively muted volume. This suggests that short-covering and tactical buying, rather than strong spot demand, are driving price stabilization.

Structurally, Bitcoin is forming lower highs since the peak, keeping the broader trend vulnerable. A recovery scenario would require BTC to reclaim the $95,000–$100,000 region and hold above the declining moving averages. Until then, the chart favors continued consolidation or further downside risk around the long-term support zone.

Featured image from ChatGPT, chart from TradingView.com

XRP Ledger Upgrade Locks Out Almost Half Of Outdated Nodes

XRP Ledger operators are staring down a familiar kind of “deadline drama” on Thursday, after one community tracker warned that a large chunk of XRPL servers are about to get amendment blocked, basically pushed to the sidelines until they upgrade.

“In about ~10 hours 418 (!!) out of 999 XRPL servers will go DOWN as they become amendment blocked!” wrote X user Krippenreiter, adding that amendment-blocked rippled servers can’t “determine the validity of a ledger,” “submit transactions,” “process transactions,” or “participate in the consensus process.”

XRP validator and node upgrade status

Will This Impact The XRP Ledger?

That sounds catastrophic if you’ve never watched XRPL governance do its thing. But the important nuance is right there in the name: amendment blocking is a safety feature, not a network failure mode. When new protocol rules activate, old software can’t reliably interpret ledgers anymore, so the network forces those servers into a non-participating state rather than letting them guess.

So does “almost half the servers” going amendment-blocked matter if activity spikes? “Not at all,” Krippenreiter replied to one user. “All dUNL validators are safe, so all ‘trusted’ validators will continue to validate as expected. (and behave under load)… For everything else there is ‘FeeEscalation’.” The point he’s making: consensus comes from a trusted validator set, and fee escalation is designed to push transaction costs higher as the ledger gets busy, throttling spam and overload attempts.

Other XRPL watchers mostly treated it as routine maintenance, not an existential moment. “Is this unusual or dangerous? No. This happens almost every amendment cycle,” another user wrote, listing prior change windows and noting that lagging nodes typically upgrade later. The XRPL amendment process itself is built around a long lead time: an amendment needs sustained supermajority support from trusted validators for two weeks before it flips on.

Still, the optics aren’t nothing. Having hundreds of public servers fall behind at once can be a real-world nuisance for wallets, explorers, and businesses that lean on third-party infrastructure. Even if consensus is fine, fewer up-to-date nodes can mean less redundancy at the edges — more brittle public endpoints, more support tickets, more “why is my transaction not going through?” posts.

And there is a concrete upgrade path. XRPL.org’s release notes for rippled 2.6.2 describe a new fixDirectoryLimit amendment plus a critical bug fix — the kind of stuff you don’t want to procrastinate on if you run production infrastructure.

The short version: no, XRPL isn’t “going down.” But if you’re still running old rippled in late 2025, the network is about to remind you that upgrades aren’t optional.

At press time, XRP traded alongside the broader market wide sentiment, down -1.5% over the past 24 hours.

XRP price chart

Legendary Bitcoin OG Deepens Ethereum Bet Despite Losses Exceeding $70 Million

Ethereum is facing renewed selling pressure as the broader market struggles with fear, uncertainty, and growing bearish expectations. After weeks of weakness, many analysts are now openly calling for a prolonged bear market stretching into 2026, arguing that Ethereum remains below key structural levels and lacks strong momentum.

Bulls are attempting to defend the $2,800 mark, a level that has become critical for maintaining short-term confidence, but price action continues to reflect hesitation rather than conviction. Volatility remains elevated, and market sentiment is dominated by caution rather than optimism.

Against this fragile backdrop, on-chain data reveals a notable divergence between price action and behavior from experienced market participants. According to data from Hyperdash, the Bitcoin OG, known for shorting the market during the October 10 crash, has once again increased his exposure to Ethereum.

This trader, widely followed for his high-conviction and well-timed positioning, just added another 12,406 ETH to his long positions, signaling confidence at current price levels despite the prevailing bearish narrative.

While retail sentiment weakens and analysts debate deeper downside scenarios, strategic accumulation by seasoned players suggests that Ethereum may be approaching a decisive phase. Whether this marks early positioning ahead of a recovery or a high-risk bet in a deteriorating market remains the key question ahead.

A High-Conviction Bet Under Pressure

Lookonchain reports that the Bitcoin OG continues to hold substantial, high-conviction positions across multiple assets, despite the ongoing market weakness. According to the latest data, his current exposure includes 203,341 ETH valued at approximately $577.5 million, 1,000 BTC worth around $87 million, and 250,000 SOL valued near $30.7 million. This level of concentration highlights a willingness to endure significant volatility rather than reduce risk in an increasingly uncertain environment.

Bitcoin OG Crypto Positions | Source: Hyperdash

That conviction, however, has come with meaningful drawdowns. The wallet is now down more than $70 million from its peak. At one point, unrealized profits exceeded $120 million, but recent price declines have reduced that figure to less than $30 million. The swing illustrates how quickly market conditions can shift, even for traders with a strong track record and well-timed entries in the past.

From a broader market perspective, this positioning reflects a sharp contrast between sentiment and behavior. While many participants have turned defensive and analysts debate the likelihood of a prolonged bear market, this wallet remains heavily exposed, suggesting a belief that current levels may still offer asymmetric upside. At the same time, the drawdown serves as a clear reminder that size and conviction do not remove risk in a structurally fragile market.

Ethereum Tests Structural Support Amid Growing Pressure

Ethereum’s weekly chart highlights a clear loss of momentum after the rejection near the $4,800–$5,000 region, followed by a sharp retracement toward the $2,800–$2,900 zone. Price is currently trading below the 50-week moving average and hovering near the 100-week MA, a level that historically acts as an important inflection point for medium-term trend direction. The failure to hold above the short-term averages confirms that sellers have regained control of the structure.

ETH consolidates around critical demand | Source: ETHUSDT chart on TradingView

From a trend perspective, ETH remains above the rising 200-week moving average, which continues to define the long-term bullish framework. However, the widening gap between the faster and slower averages has started to compress, signaling a transition phase rather than trend continuation. Volume has expanded on down weeks, reinforcing the idea that recent downside moves are driven by active distribution rather than passive consolidation.

The $2,800 area now represents a critical demand zone. A sustained hold above this level would suggest that the correction is a controlled pullback within a broader range. Conversely, a weekly close below it would expose ETH to a deeper retracement toward the $2,400–$2,500 region, where the 200-week MA and prior consolidation converge.

Overall, the chart reflects a market caught between long-term structural support and short-term bearish momentum. Ethereum needs a decisive reclaim of the 50-week moving average to neutralize downside risk and restore confidence in trend continuation.

Featured image from ChatGPT, chart from TradingView.com

Solana Value Proposition Extends Beyond Tech Into Economic Infrastructure

In the evolving landscape of blockchain technology, Solana has rapidly emerged as a platform not merely defined by its technical capabilities but by its broader implications for economic infrastructure. By enabling the class of decentralized applications, SOL is positioning itself as a high-performance blockchain and a foundational layer for the next-generation economic activity. 

Why Infrastructure That Enables Continuous Markets

In an X post, crypto analyst Vibhu mentioned that Solana is no longer just a piece of financial technology, but a fully functioning economy. What exists on SOL today has gone beyond transactions and smart contracts. 

According to the expert, there are dollars and native currencies, real-world assets, metals and rare minerals, energy market, information markets, manufacturing primitives, and global trade rails all operating in real-time on-chain. SOL also has politics, governance processes, divided factions, and ongoing debates about the leading network’s future.

At this point, we are witnessing the birth of a country that lives entirely on the internet. Measured through economic output, SOL would rank around the 157th largest country in the world by GDP (Gross Domestic Product), comparable in size to nations such as Eswatini or Fiji. However, SOL is globally integrated by default, and from a forex and asset-flow perspective, it punches above its weight, integrating with the largest banks and financial institutions across the globe.

Furthermore, SOL has withstood sustained network attacks from nation-state actors, defending itself with systems engineers instead of armies. Economically, SOL is already engaged in trade with countries like Bhutan, ranked 164, the Isle of Man, ranked 154, and even Kazakhstan, which ranks 49 in global economic standings. “Solana is a digital country, and I am proud to be a citizen,” Vibhu noted.

Why Real-Time On-Chain UX Finally Works On Solana

Solana continues to see key updates and integration that tend to bolster the network capabilities. Co-founder of TeamElevenX1 and Ambassador at Solflare, Kristofer_Sol, has highlighted that MagicBlock is quietly doing some of the most important work in the Solana ecosystem, pushing real-time SOL closer to true production scale. 

At the center of this shift is the deep integration of compressed accounts into the Light Protocol inside Ephemeral Rollups, reducing rent costs by up to 200 times, while still functioning like a normal account for developers. The compression demo is already live, and real applications are actively using it today. Others like Rush Trade deliver faster trades, and Pixels achieve smooth, real-time pixel updates. 

Kristofer_Sol stated that this is what a scalable on-chain user experience actually looks like. With low-cost reduction and speed improvements happening without forcing developers to rewrite everything, MagicBlock is quietly removing the friction that has held back games, social apps, and consumer products on SOL.

Solana

❌