Despite the recent crash that saw the XRP price fall below $2, many analysts claim that the cryptocurrency could still skyrocket to $100 by the end of the year. However, one expert has thoroughly dismissed these projections, urging investors to temper expectations and warning that those who believe such predictions need a “reality check.”
Why XRP Can Never Reach $100 By Year’s End
Crypto market expert Zach Humphries has delivered a detailed assessment of XRP, calling out extreme price predictions and overly optimistic expectations, especially during the current downtrend. In a video on X, he warns that claims suggesting XRP will reach $100 by the end of 2025 are unrealistic and potentially misleading for investors and traders.
Humphries emphasized that while he supports XRP and believes in its long-term potential, the spread of exaggerated price targets in the crypto space is harmful. He explained that many investors assume that owning 100 XRP tokens will make them wealthy quickly, holding on to false hope and unrealistic financial expectations.
The analyst points out the need for realism in the crypto space, arguing that viral hype posts and overinflated price forecasts can hoodwink people into making genuine financial decisions that could lead to losses. He noted that investors need to understand market structure and the underlying math behind XRP’s price action before believing in any extreme predictions.
Humphries stated a $100 XRP price would imply a $5 trillion market capitalization, surpassing the size of Apple, Microsoft, and even the entire crypto market at some historical peaks. He noted that reaching this seemingly impractical price target would require XRP achieving overnight global adoption, full-scale replacement of existing payment rails, and massive sustained institutional inflows.
The analyst also highlighted a common misunderstanding about liquidity. Humphries explained that for XRP to reach $100, it would require substantial global liquidity. He noted that despite XRP Spot ETFs recording over $1 billion in inflows recently, the cryptocurrency’s price did not rise; instead, it declined further. He highlighted that this is because institutional investors prioritize stability, deep liquidity, and predictability over volatile, high-risk payment assets.
Although his statements may seem like a critique of XRP’s outlook, Humphries emphasized that the cryptocurrency has genuine strengths, including robust cross-border payment capabilities, strong enterprise relationships, and liquidity. He pointed out that, ironically, the more XRP succeeds as a payment rail, the less explosive its price becomes.
Analyst Says XRP Could Still Outperform Many Assets
In his video, Humphries stated that XRP has survived many market cycles, making it one of the rare resilient cryptocurrencies. Under the right conditions, he believes that the XRP price could outperform many digital assets, which is why it remains a top altcoin in his portfolio.
The analyst emphasized the importance of realistic growth driven by gradual institutional adoption, ETF integration, regulatory clarity, and steady price increases tied to actual usage and utility. He highlighted that these factors could help XRP perform very well, potentially reaching new all-time highs.
According to reports, Coinbase has launched regulated futures linked to Shiba Inu, opening the token to trading on a US derivatives venue.
The new products include perpetual-style contracts and monthly futures tied to what Coinbase calls the 1k SHIB index (a 1,000 token index), with trading scheduled to run 24/7.
The rollout began on December 5, 2025, as part of a broader push by the exchange to add altcoin derivative listings under US rules.
Regulated Futures Hit The Market
Reports have disclosed that the perpetual contracts operate like offshore swaps in form but are offered through Coinbase’s regulated platform and are designed to include a funding-rate mechanism to keep prices close to spot.
Now live: Trade US Perpetual-Style Futures for all altcoins on Coinbase Derivatives, available 24/7.
Monthly contracts were made available as an initial phase. Clearing and settlement are handled inside systems compatible with US oversight, and the products are described as compliant with Commodity Futures Trading Commission frameworks.
What Traders And Institutions Might Do
Market participants say having regulated futures can change who trades a token. Institutional desks and some large funds often need regulated venues and clearer custody paths before they increase exposure.
Added liquidity and round-the-clock pricing may attract more active traders, and that could raise volume. At the same time, access to futures also makes it easier to bet against the token, which can push volatility up. Reports note that immediate moves in spot markets have been mixed, showing that access to derivatives does not automatically lift the token’s price.
Because SHIB has regulated futures on Coinbase (“1k Shib Index”), it qualifies for spot ETF consideration under the same SEC pathway Bitcoin and Ethereum followed.
The big picture for SHIB
•SHIB now joins the “ETF-watchlist club” with other futures-backed cryptos.
•If/when… pic.twitter.com/cZPxUWWhBn
Coinbase’s decision follows steps the exchange has taken to grow its derivatives arm. Company filings and public letters in 2025 framed derivatives growth as a strategic priority, and the firm has pursued deals and product launches to expand those capabilities.
One notable deal disclosed earlier involved an agreement valued at close to $3 billion to strengthen derivatives know-how and infrastructure. This background helps explain why Coinbase is offering altcoin futures that trade continuously, under a regulated roof.
Featured image from Gemini, chart from TradingView
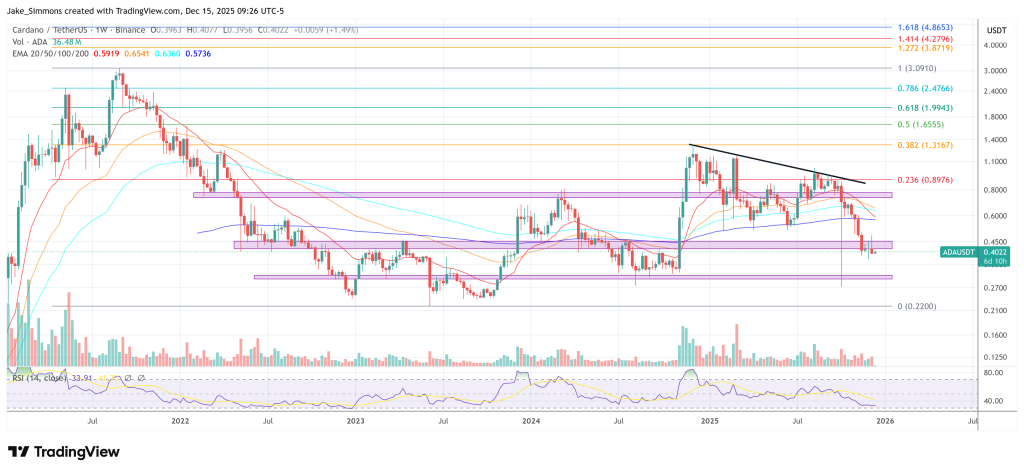
Cardano’s ADA token has returned to a familiar but uncomfortable zone. After months of lower highs and failed recovery attempts, the price has slid back toward long-term support levels that have defined its structure for more than two years.
The move comes amid a broader market pullback, as risk appetite weakens across equities and crypto, but ADA’s decline is also being shaped by internal technical signals that traders are finding hard to ignore.
ADA currently trades near $0.38–$0.39, down approximately 5.57% over the past 24 hours. That drop places the token close to a multi-year ascending support trend line that has held for nearly 900 days.
Derivatives and Positioning Point to Caution
Market data indicate that traders are stepping back rather than leaning into the decline. Futures open interest in ADA has decreased by approximately 11% to around $670 million, indicating that positions are being closed rather than expanded.
Funding rates have also softened, with more than 55% of tracked positions now skewed to the short side. Together, these metrics point to reduced confidence in a near-term rebound and a market that is positioning defensively.
This caution is not isolated to Cardano. Altcoins across the board have come under pressure as investors adopt a risk-off stance ahead of key U.S. macroeconomic data, including inflation and labor reports, and as concerns surrounding the AI sector spill over into correlated assets like cryptocurrency.
Technical Structure Near a Breaking Point
On the charts, ADA’s structure remains fragile. The token recently lost the $0.53 horizontal support, confirming a bearish shift on higher timeframes.
Momentum indicators reflect that change. The RSI is below 50, and the MACD remains in a negative position. Recent price action looks corrective rather than impulsive, suggesting the latest bounce may already have run its course.
ADA is still hovering near its long-term diagonal support, but a clean breakdown would likely alter the outlook materially. Some analysts warn that, if this trend line fails, the price could retrace much deeper, potentially toward levels last seen during the previous bear market.
Long-Term Targets Contrast With Short-Term Risk
Despite the weak near-term picture, longer-term projections remain divided. One technical analyst has argued that ADA’s current consolidation resembles a prolonged corrective phase similar to the setup seen before its 2020 breakout, outlining upside targets ranging from the $5 area to above $10 in a full bull scenario.
However, those views hinge on the market first stabilizing and reclaiming key resistance zones. For now, ADA’s focus is simpler. The token is at a critical phase, with long-term support under pressure and sentiment cautious. Whether this level marks a base or a breakdown will likely shape Cardano’s trajectory into 2026.
Cover image from ChatGPT, ADAUSD chart from Tradingview
Ethereum’s price action has weakened further over the past 24 hours, with the cryptocurrency falling below $3,000 and shedding about 6.8% in the last 24 hours alone.
The immediate price action points to reclaiming this $3,000 support, but a longer-term technical view suggests the current decline may be part of a much larger and more defined price framework. A macro analysis shared by crypto analyst Dona examines Ethereum’s behavior over the past two years with a structured range that suggests that the cryptocurrency might bottom at $2,187.
Ethereum’s Two-Year Range Still Defines The Bigger Picture
According to the analysis, Ethereum has largely traded within a broad horizontal range for close to two years, aside from two notable fakeouts: one below resistance in the first half of 2025 and one above resistance in the second half of the year, which led to a new price high of $4,946 in August. On the weekly timeframe, price has repeatedly respected an upper boundary around $4,000 to $4,100, while finding consistent demand near the lower range support just above $2,100.
This price action has resulted in a structure that resembles an inverse head and shoulders pattern on a macro scale. Instead of signaling immediate upside, however, the formation shows how price has oscillated between these defined trendlines, with mid-range reactions often determining whether Ethereum pushes to resistance or slips back toward support.
At the time of writing, Ethereum is trading within the mid-range of the two-year range. Based on this context, the recent bearish move can be viewed less as a breakdown and more as a rotation towards the lower trendline within the same long-standing range.
Why $2,187 Stands Out As A Critical Downside Target
The chart accompanying the analysis places particular emphasis on the lower boundary of the range near $2,187. This level has repeatedly acted as a bounce floor during prior downtrends in 2024 and another one in July 2025.
If Ethereum continues to trade below the mid-range support currently around $3,000, then the price could follow a familiar range rotation path toward this lower boundary. This move will see Ethereum fall to as low as $2,187.
At the time of writing, Ethereum is trading at $2,928, and is still a 25% decline away from $2,187. Although this would be tragic for bullish traders, such a move would not necessarily invalidate the broader structure. Instead, it will complete another cycle within the range, similar to previous declines that eventually transitioned into a bounce for a rally phase.
One of the more notable aspects of the outlook from Dona is the expectation for subdued activity in the near term. Aside from range-bound trades, taking directional positions may be less attractive as liquidity thins into the end of the year. From this perspective, the next major move is more likely to arrive in January 2026.
A private investment firm has outlined why XRP constitutes the largest share of its portfolio. The firm explains that its investment rationale is anchored in XRP’s Proven operational performance and functional utility rather than aspirational projections, community momentum, or speculative price expectations. As a result, the position reflects a deliberate focus on infrastructure value, reinforcing XRP’s status as a core long-term holding rather than a tactical crypto trade.
Why XRP Aligns With A Function-First Investment Approach
The investment firm’s reasoning positions XRP as a natural fit for a portfolio strategy that prioritizes function over narrative. According to the firm, its heavy allocation is the byproduct of a disciplined evaluation of how well an asset performs its intended role. In this framework, concentration is justified only when an asset demonstrates clear operational strengths, and XRP is presented as having earned that status through its design and execution.
Building on that premise, the firm points to XRP’s specialization as a settlement-oriented digital asset as the primary driver of its allocation decision. The network is structured to deliver rapid and definitive transaction completion, eliminating the uncertainty that can complicate value transfer on many blockchain systems. This reliability is reinforced by consistently low transaction costs that remain stable regardless of usage levels, enabling predictable large-scale transfers without exposure to fee volatility. As transaction volume increases, XRP’s ability to maintain high throughput without congestion further supports its suitability for continuous, real-world payment activity.
These technical attributes also connect directly to the firm’s broader investment thesis around institutional usability. By operating without a proof-of-work mechanism, the ledger avoids the inefficiencies and regulatory friction often associated with energy-intensive networks.
In the firm’s assessment, this design choice enhances operational clarity and aligns more closely with the compliance and efficiency standards expected by financial institutions. Taken together, these factors explain why the firm views XRP less as a speculative vehicle and more as functional infrastructure, reinforcing its alignment with a function-first investment approach and justifying its central role within the portfolio.
Positioning For Institutional Adoption And Market Repricing
The firm frames its investment thesis around how markets evolve under regulatory pressure. As digital asset regulation advances, financial institutions are expected to prioritize reliability, compliance, and operational efficiency over popularity or community momentum. Adoption is therefore driven less by attention and more by seamless integration into existing financial frameworks.
This perspective also informs how digital assets may be valued. The firm expects a gradual shift from narrative-based pricing toward metrics such as transaction throughput, liquidity efficiency, and real-world demand. Assets able to move value at scale will likely be repriced as usage rises and speculative excess fades. In the firm’s assessment, XRP is one of the few assets already meeting these standards, and by concentrating its portfolio in XRP, it positions itself ahead of this transition.
Dogecoin’s (DOGE) latest selloff has forced traders to confront a question that has followed the meme coin since its peak years. Is this another temporary washout, or a deeper reset in how the market values DOGE?
Over the past 24 hours, Dogecoin slipped sharply below levels that had held through weeks of consolidation, erasing a sense of stability that many participants had grown accustomed to. The move unfolded without a single defining catalyst, instead reflecting broader weakness across higher-beta crypto assets.
At the same time, DOGE’s highly visible online presence has remained active, creating a contrast between weakening price action and persistent cultural relevance.
Breakdown Below Key Support Shifts Short-Term Structure
In the past 24 hours, Dogecoin (DOGE) fell about 5.5%, sliding from roughly $0.1367 to near $0.129, and briefly trading as low as $0.1266.
The drop pushed the price below the $0.1370 and $0.1300 support zones, levels that had defined the lower boundary of its recent range. Trading volume surged to around 1.36 billion tokens, more than 180% above average, suggesting the move was driven by active selling rather than gradual drift.
Technically, DOGE is now trading below its 100-hour simple moving average, with a bearish trend line forming near $0.1340. Attempts to reclaim $0.1300 have so far failed, reinforcing that level as immediate resistance.
Market participants note that once intermediate supports gave way, bid depth appeared thin, allowing the DOGE price to move lower with limited pauses.
Sentiment Signals Clash With Weak Dogecoin Price Action
Despite the selloff, Dogecoin remains a popular online presence. The official Dogecoin ecosystem account recently acknowledged renewed public endorsements, including comments from a high-profile entrepreneur, and resurfaced cultural callbacks tied to DOGE’s 2021 run.
From a positioning standpoint, Dogecoin remains significantly below its all-time high and has declined sharply on a year-to-date basis. Open interest has also declined significantly from earlier 2025 peaks, pointing to reduced speculative participation.
For some traders, this is evidence of capitulation; for others, it signals a quieter phase where excess leverage and hype are being flushed out.
Levels That Now Matter for Traders
In the near term, market focus is centered on the $0.1290–$0.1280 zone. Holding above this area could allow DOGE to consolidate, while a sustained break lower may expose support near $0.1250 and potentially the $0.1200 region.
On the upside, a reclaim of $0.1300 would be the first indication that downside momentum is easing, though former supports above $0.1340 remain key hurdles.
Whether this move marks the end of an era or a broader reset remains to be seen. For now, Dogecoin remains in a fragile stabilization phase, where confirmation, rather than conviction, is driving trading decisions.
Cover image from ChatGPT, DOGEUSD chart from Tradingview
Crypto analyst Erick Crypto has highlighted a Dogecoin price squeeze, which is currently playing out. Based on this, he mentioned two possible scenarios that could play out for the largest meme coin by market cap.
Two Possible Scenarios as Dogecoin Price Squeezes
In an X post, Erick Crypto stated that the Dogecoin price is squeezing hard, with a descending triangle and strong horizontal support around $0.136. He added that DOGE is compressing at the apex, which means that a breakout ot breakdown is imminent. The pundit warned that there is high volatility ahead of the meme coin.
Meanwhile, the crypto analyst stated that the Dogecoin price could see more downside if it loses the $0.13 support. On the other hand, it could record a relief rally if it breaks the trendline. He urged market participants to trade the breakout and not the noise. Erick Crypto’s analysis comes amid the crypto market downturn, which has already sparked a massive crash for DOGE.
Notably, the Dogecoin price is down over 20% in the last month, since around when the Bitcoin price first crashed below the psychological $100,000 level. The meme coin has also failed to gain traction despite the launch of two DOGE ETFs during this period. Bitcoinist reported that these Dogecoin ETFs have so far underperformed and failed to gain interest from institutional investors.
Meanwhile, the Dogecoin price and the broader crypto market are at risk of further declines as the Bank of Japan (BOJ) is likely to raise interest rates this week. This could tighten liquidity in the market and also lead to a further unwinding of the yen carry trade, which is a negative for crypto assets, including DOGE.
DOGE Is At A Crossroad
Crypto analyst CryptoCeek stated that the Dogecoin price is at that “classic meme coin fork-in-the-road.” The analyst explained that if the bears push and hold the price under $0.13, the door opens for a full retest of $0.10, where buyers historically aggressively buy the dip. On the other hand, CryptoCeek stated that reclaiming the 20D EMA near $0.14 would scream a bear trap, with $0.19 on the cards for “one of those classic DOGE squeezes.”
Crypto analyst Master remarked that between $0.8 and $0.10 seems likely for the Dogecoin price. He added that the base case is that the meme coin trades sideways until 2028, when the next bull run may start. However, as CryptoCeek suggested, DOGE may bounce from around $0.10 as the bulls step in to accumulate more coins at that price level.
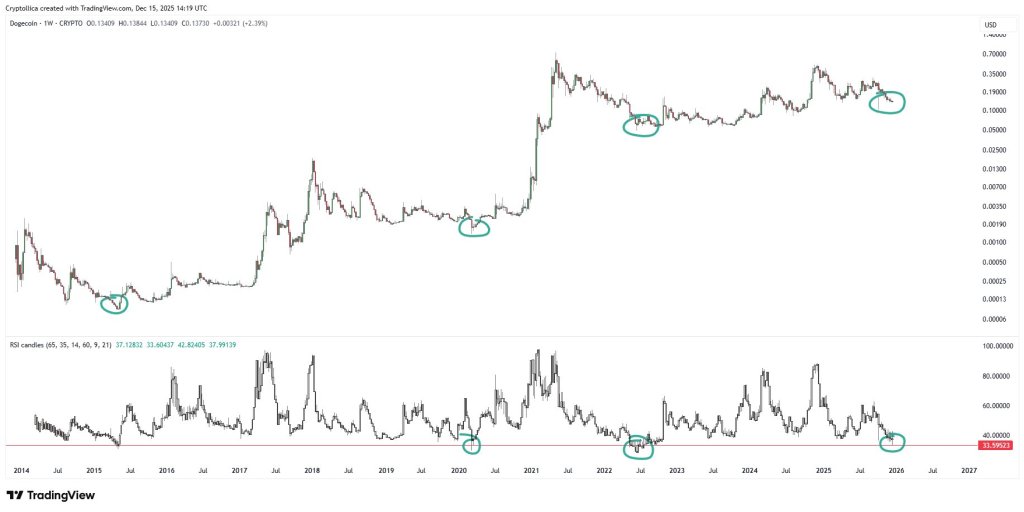
Dogecoin’s weekly price chart is revealing an interesting event of an important momentum indicator hitting a level that has always been a major turning point for the cryptocurrency. After spending the past several weeks falling lower into the $0.13 price region, Dogecoin’s Relative Strength Index on the weekly timeframe has reached levels that have only appeared a handful of times over the asset’s entire trading history. The observation, first highlighted by crypto analyst Cryptollica, revisits how Dogecoin has behaved the last few times this technical condition happened.
A Rare Weekly RSI Signal In Dogecoin’s History
Technical analysis indicates that Dogecoin’s weekly Relative Strength Index has dropped into a narrow zone around the 33 level, a condition that has appeared only four times over roughly eleven years of trading history. Each of those occasions aligned with periods where selling pressure had largely run its course, even though price action itself did not immediately reverse. Instead, these phases were marked by quiet accumulation.
The Dogecoin chart highlights these moments clearly, with pronounced RSI dips into the lower band during 2015, 2020, and 2022. In each case, price followed a similar script: extended basing ranges formed after the RSI reached this level, laying the groundwork for the next sustained advance. Now in late 2025, Dogecoin’s RSI is again exhibiting this same structural behavior, and this places the current price action in a way that might play out bullish.
Short-term oversold readings are relatively common as reversal indicators, but they often produce false starts. However, since this is on the weekly timeframe, this specific setup tends to emerge only during broader market resets and is much more reliable. During those resets, the RSI stabilized and rebounded from the 30 to 33 zone as price gradually transitioned from consolidation into a new uptrend.
What The Current RSI Setup Could Mean Going Forward
As of mid-December 2025, Dogecoin is trading in the low-$0.13 to mid-$0.14 range, having slipped back below $0.14 that had been acting as short-term support in recent weeks. This price area has been volatile, with moves between roughly $0.13 and about $0.15, reflecting an ongoing struggle between buyers and sellers and a lack of decisive bullish momentum. The sellers are winning right now, with Dogecoin trading at $0.13, down by 5% in the past 24 hours and about to lose this price level.
Nonetheless, the weekly RSI that’s currently at the usually significant zone adds additional context. It proposes a scenario where Dogecoin is about to reach a price bottom and buyers regain control in the coming weeks. However, considering that this is a weekly indicator, Dogecoin’s price action might continue to consolidate around this level for the next few weeks before any meaningful bounce takes place.
The weekly chart for Dogecoin shows a signal that could be of greater significance due to its rarity. Crypto analyst Cryptollica pointed to DOGE’s weekly RSI tagging roughly 33.6 and claimed that level has shown up only four times in 11 years. “DOGE WEEKLY RSI. 4 times in 11 years ..,” he posted.
What This Means For The Dogecoin Price
DOGE, for context, was trading around $0.129 at the time of writing, down roughly mid-single digits on the day.
The hook is simple: a weekly RSI that low usually means sellers have been in control for a while — and on a weekly timeframe, that kind of pressure tends to carry more weight than intraday noise. This isn’t “RSI brushed 30 on a 15-minute candle.” It’s slower, heavier, and tied to the bigger trend.
Still, it’s not quite as plug-and-play as the screenshot makes it look. Cryptollica’s point is that the same zone showed up around (1) early May 2015, (2) March 2020, (3) mid-June 2022, and (4) now. The post is the spark; what traders actually care about is what happened next. And this is where Dogecoin’s history gets… very Dogecoin.
On May 6, 2015, DOGE was quoted around $0.000087. Beyond the price being basically dust, the backdrop was messy: weeks earlier, Dogecoin co-founder Jackson Palmer said he was stepping away from the crypto community, calling out what he described as a “toxic” culture.
The bounce didn’t show up on schedule. DOGE drifted for a long time, then later caught the 2017–18 mania, briefly touching $0.017 on Jan. 7, 2018. From roughly $0.000087, that’s about +19,000% to that local-cycle high — a good reminder that “oversold” on a weekly chart can show up early and still end up pointing the right way.
In mid-March 2020 (peak COVID panic), DOGE traded around $0.001537. When the panic eased and liquidity returned to markets, DOGE went on to print its next cycle top at $0.7316 on May 8, 2021.
That’s roughly +47,000% from the March 2020 level to the 2021 high. It’s also the stretch where DOGE stopped being “just” a joke coin and started behaving like a retail risk-on barometer — with Musk-era attention pouring gasoline on it.
By mid-June 2022, the bear-market washout was in full effect. DOGE was around $0.053. The recovery came in waves: a late-2022 pop tied to Musk/Twitter speculation and broader risk-on bursts, then a bigger 2024 meme-led rip.
By March 28, 2024, DOGE was back around $0.220 — roughly +315% from the June 2022 level to the next notable local high. Not 2021-level insanity, but still a real multi-x.
And now, as of Tuesday, Dec. 16, 2025, Dogecoin was changing hands around $0.129. The “signal” crowd will look at that weekly RSI print and argue the market is back in the same psychological neighborhood as those prior exhaustion points.
The bullish case writes itself: if this weekly RSI zone has tended to show up near seller fatigue in the past, then seeing it again could mean risk/reward is quietly shifting. Not a promise — more like a reason to stop ignoring DOGE and start watching it.
But RSI isn’t a timing tool. Oversold can stay oversold. Weekly signals can hang around, whip traders around, or get flattened if broader risk keeps leaking.
For now, it’s a setup, not an outcome. If DOGE starts reclaiming levels and holding them, the “rare signal” crowd will take the victory lap. If it keeps bleeding, this gets filed under interesting, early, and painful — like a lot of trading ideas.
Crypto analyst Dark Defender has been one of the most vocal supporters of XRP, and this stance has not changed despite the altcoin’s current price action. If anything, the analyst believes that the current downtrend actually plays into the XRP long-term target, claiming that the cryptocurrency remains inherently bullish. If the analyst is right, then it means that the XRP price could be gearing up for another major uptrend that could send it to new peaks.
XRP Price Is Only In Wave 4, Not A Bear Market
In the post that was shared on X, Dark Defender explained that the XRP cryptocurrency was not in any kind of bear market. Instead, the current downtrend is only a result of the altcoin entering Wave 4 of the Elliot Wave, leading to the decline.
Given that Wave 4 is a historically bearish wave, it would explain why the XRP price has dropped so quickly. However, the crypto analyst explained that this wave did not just start, as it has been in play since February 2025. Hence, it would need to play out completely before the next wave can begin.
Going by this analysis, it would mean that the last and final wave of the theory is yet to play out, which is often the most bullish of all the waves. As a result, the analyst urges XRP investors not to panic as the price continues to play out according to plan. In the end, the target remains $5.85, according to Dark Defender, beating its previous all-time high of $3.8.
Price Could Be Rounding A Bottom
Another analyst also contributes that the XRP price is not in a bear market, and could, in fact, be putting in a bottom. STEPH IS CRYPTO points out that the XRP RSI is actually showing a rare bullish divergence on the daily chart, one of the few times that this has happened over the years.
This is significant because back in 2022, a similar bullish divergence had appeared on the daily chart ,and the result was a rapid rise once the distribution was done. As the crypto analyst explains, the fact that this bullish RSI divergence has appeared on the XRP daily chart again suggests that the sellers are actually running out of steam.
While there is no set target for where the XRP price is headed, the prediction suggests that a rally could be in the works. “Nothing is guaranteed — but from a technical perspective, this is one of the strongest early reversal signals you can get,” the analyst stated.
Data shows Bitcoin has witnessed a notable amount of gains during the US trading session in December so far, a shift compared to the November trend.
Bitcoin Has Performed The Best During US Trading Session This Month
As explained by CryptoQuant community analyst Maartunn in a new post on X, the American trading session has flipped for Bitcoin in December. Below is the chart shared by Maartunn, which compares the returns that BTC has achieved across the different trading sessions over the past month.
The trading sessions here have been divided based on when investors of a major market are typically active. Bitcoin and other blockchain-based assets run 24/7, so there naturally isn’t ever a time in any timezone where trading is inactive. However, investors do still tend to trade more actively during their daytime, which is what these sessions are based on.
From the chart, it’s visible that cumulative Bitcoin returns were negative for the American trading session during the last couple of weeks of November. Europe and Asia-Pacific didn’t perform much better, but they at least saw close to neutral returns.
Toward the end of November, though, a shift began to take shape, with returns during US hours going up. And in this month of December so far, the trading session has pulled away from the rest, with cumulative returns sitting at a positive 8%.
In contrast, Europe and Asia-Pacific have the metric at a level of around -4% or lower. Thus, if the cumulative returns during these sessions are anything to go by, it would appear that American investors have been participating in Bitcoin accumulation this month, while the others have been distributing or simply, not buying.
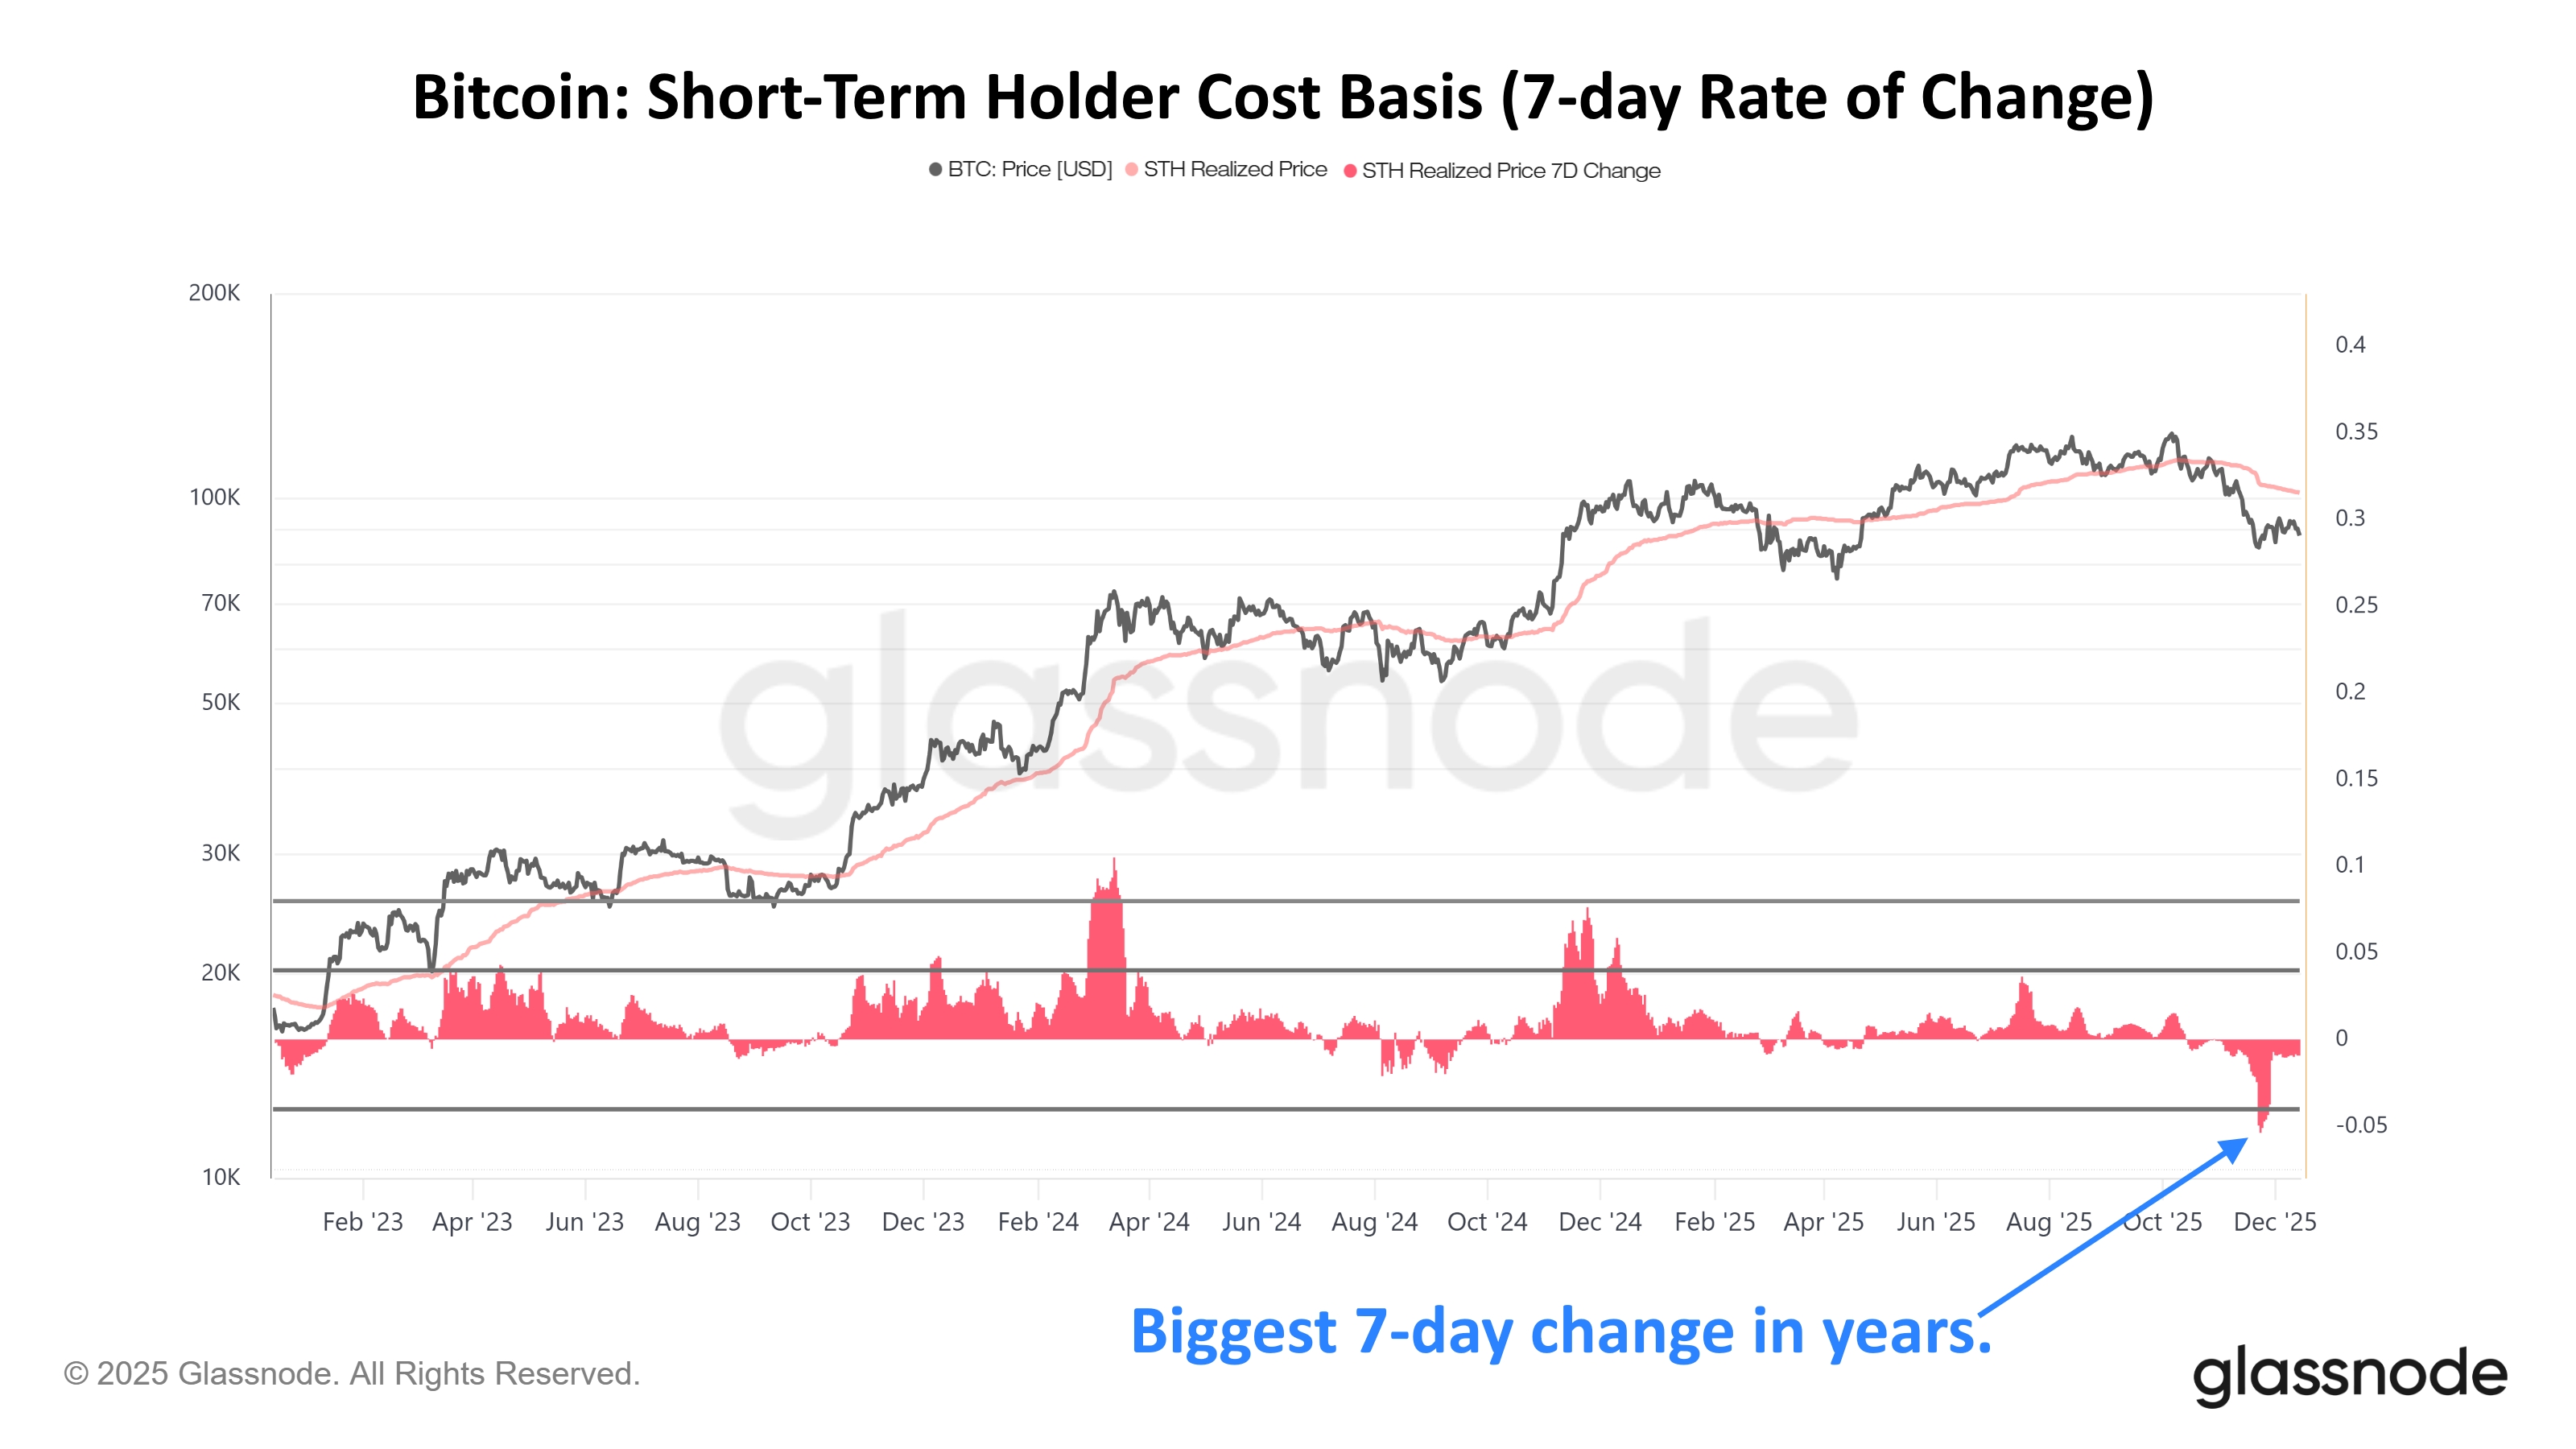
In some other news, the Bitcoin selloff last month caused a key on-chain indicator to go through its largest negative change in years, as quant Frank has pointed out in an X post.
The metric displayed in the chart is the Realized Price of the Bitcoin short-term holders. This indicator measures the average cost basis of investors on the BTC network. The version listed in the graph specifically tracks the cost basis of short-term holders (STHs), entities who entered the market over the last 155 days.
As is visible in the chart, the Bitcoin STH Realized Price saw a notable decline alongside the price crash in the cryptocurrency during November. This suggests investors who bought at higher levels panic capitulated, repricing their coins to the lower post-plunge levels.
This capitulation was so strong that the STH Realized Price saw its largest red 7-day change since the FTX crash back in November 2022.
BTC Price
Bitcoin has witnessed bearish price action during the past day as its price has come down to $85,800 following a drop of about 3.5%.
Bitcoin (BTC) has experienced a 4% drop, falling below the $86,000 mark on Monday, as market speculation grows regarding the cryptocurrency’s future following the Bank of Japan’s (BOJ) interest rate decision.
In a recent poll conducted from December 2 to 9, an overwhelming 90% of economists—63 out of 70—predicted that the BOJ would increase short-term interest rates from 0.50% to 0.75% at this week’s planned meeting.
Experts Warn Of Impact From BOJ Rate Hikes
Experts on social media have noted a concerning trend: during the last three rate hikes by the BOJ, Bitcoin has typically dropped significantly. The statistics reveal the following declines: a 23% drop in March 2024, a 26% decline in July 2024, and a 31% dip in January of this year.
Based on current prices just below $86,000, this would imply that if the cryptocurrency sees another 20% correction, it could drop all the way to 68,800. This would mean extending the gap compared to the all-time high of $126,000 by almost 46%.
The group of experts further highlighted that the dynamics at play in Japan significantly impact Bitcoin’s performance as Japan holds the largest amount of US debt of any nation.
When Japanese interest rates rise, capital tends to flow back to Japan, leading to reduced liquidity in dollars. This decrease in dollar liquidity often results in the selling of riskier assets like Bitcoin.
On November 30, a foreboding sign of this potential downturn appeared when confirmation of Japan’s impending rate hike caused Bitcoin to dip to around $83,000, erasing approximately $200 billion from the overall cryptocurrency market.
However, the bearish sentiment affecting Bitcoin is not solely the result of Japan’s actions. Market analyst known as NoLimit recently pointed to another critical factor: China’s renewed crackdown on Bitcoin mining.
China’s Mining Crackdown Spurs Bitcoin Sell-Off
The analyst recently asserted that China has tightened regulations, particularly affecting operations in Xinjiang, where a significant number of crypto mining setups were shut down in December. This led to the abrupt offline status of roughly 400,000 miners.
The repercussions of such a sudden shift in mining activity are already evident. The Bitcoin network hashrate has fallen by about 8%, indicating that fewer miners are actively contributing to the network.
NoLimit suggests that this sudden reduction creates immediate revenue-loss for miners, who may need to liquidate Bitcoin to cover operational costs or to relocate their equipment. Consequently, this generates actual selling pressure on the market, contributing to the downward price trend seen on Monday.
Despite the short-term pain this creates, the analysts clarified that it does not indicate a long-term bearish outlook for Bitcoin. Instead, he views it as a temporary supply shock driven by regulatory decisions rather than a shift in demand.
Historical patterns support this notion: when China has previously cracked down on miners, the cycle follows a familiar trajectory: miners are forced offline, hashrate dips occur, prices fluctuate, and eventually, the network adapts before Bitcoin moves forward again.
Featured image from DALL-E, chart from TradingView.com
Monday, 15 December 2025 – Bitcoin Hyper (HYPER) has reached $29.5 million in presale capital, driven by a strategy that addresses one of Bitcoin’s most persistent constraints without making any changes to Bitcoin itself.
With BTC dipping below $90,000, it’s becoming clearer that Bitcoin’s valuation has long been powered more by conviction than by real transactional use. That limitation is increasingly difficult to ignore. Bitcoin Hyper aims to remove that barrier by creating an environment where BTC can actually move, be used, and scale in real economic activity.
Rather than attempting to modify Bitcoin Hyperis built alongside it. Bitcoin remains unchanged as the ultimate settlement layer, while the functions it was never meant to handle are moved off-chain. Transaction execution takes place in a fast, flexible ecosystem, finally giving applications the space they need to operate efficiently.
This architecture is what’s driving investor interest in HYPER, the token positioned at the core of Bitcoin’s shift from a passive store of value into an active economic system.
That opportunity is still open for a limited time. HYPER is currently priced at $0.013425, but that price is only available for the next five hours before the following presale phase begins.
Six Figures Reveal Bitcoin’s Next Challenge
As 2025 approaches its end, the year is set to be remembered for the moment Bitcoin firmly crossed into six-figure price levels. However, the recent pullback has reignited a more uncomfortable debate: can Bitcoin’s role as a store of value alone continue to support further price growth?
That uncertainty is no longer limited to crypto circles and is beginning to appear in traditional financial markets. Strategy is facing mounting scrutiny as index providers review whether its substantial Bitcoin exposure still warrants inclusion in major benchmarks, including the MSCI indices.
Analysts at JPMorgan have cautioned that any potential removal could result in billions of dollars exiting through passive investment funds. Meanwhile, Strategy’s stock has declined significantly more than Bitcoin itself and is now trading much closer to the underlying value of its BTC holdings, rather than maintaining the premium that investors previously attributed to its treasury-focused approach.
MSCI $MSTR DE-LISTING FEAR MONGERING: THE $2.8 BILLION LIE
First: Strategy is at ZERO risk of being delisted from other indices. Second: J.P. Morgan says an MSCI delisting would trigger a $2.8 Billion forced sell off. They are banking on you not knowing the math.
Scarcity alone may no longer be sufficient to keep pushing Bitcoin’s price upward. For the market to reclaim and hold six-figure levels and eventually move beyond previous highs the network needs a new driver of demand.
Bitcoin’s base layer was deliberately engineered to be lean, cautious, and resistant to change. It functions as a neutral settlement layer, placing security and verifiability above every other consideration. That conservative design is exactly what has allowed Bitcoin to operate reliably for more than a decade.
However, this same philosophy also imposes a limitation. If Bitcoin must stay simple by design, then advanced execution and functionality must exist outside of it. There is effectively no alternative approach.
This is precisely the space Bitcoin Hyper is designed to occupy. Execution is handled in a separate ecosystem, while Bitcoin continues to serve as the ultimate source of settlement and truth.
Bitcoin’s Design Prioritized Simplicity by Choice
Bitcoin was built as a form of money that cannot be altered, diluted, or controlled by any government, corporation, or small group of actors. Achieving that goal required a system engineered to be resilient above all else, even if it meant giving up speed and adaptability.
This is why Bitcoin depends on the stark simplicity of SHA-256. It is a one-way cryptographic function that avoids complexity and specialization, yet performs its role with unmatched reliability. Verification is fast and straightforward, while reversal is effectively impossible and this imbalance is what underpins Bitcoin’s security model.
FUN FACT: Bitcoin runs on SHA256—a one-way cryptographic function.
It’s what secures your sats with trillions of hashes per second.
Think of Bitcoin as the foundation. You don’t drill into bedrock every time you want to expand a structure you build on top of it, because the strength underneath is what supports everything above.
From the beginning, Bitcoin’s base layer was deliberately kept simple and conservative. By minimizing moving parts, it reduced attack vectors, limited governance risk, and ensured the system could be verified by anyone without relying on complicated logic. That discipline is a key reason Bitcoin remains the most secure and decentralized network in the crypto space.
Still, bedrock isn’t meant to be lived in it’s meant to support what’s built above it. Advanced features were never intended to operate on Bitcoin’s base layer, and forcing them there would erode the very attributes that give Bitcoin its value.
This is exactly why Bitcoin Hyperexists. It adds a layer above Bitcoin where advanced functionality can operate without modifying the underlying chain.
That execution layer is powered by the Solana Virtual Machine (SVM), pulling execution away from Bitcoin’s slower base layer and placing it into an environment optimized for speed and scalability. Transactions become fast and inexpensive, and complexity is no longer a limiting factor.
The result is more than simple “hybrid applications” it represents a deeper structural change. Bitcoin is no longer static. BTC moves through DeFi, gaming, and real economic use cases at Solana-level speeds, while final settlement still resolves back on Bitcoin. Fast at the top, immutable at the core.
The Infrastructure Play Powering Bitcoin’s Next Phase: HYPER
The Bitcoin Hyperframework is built around a single objective that Bitcoin itself has never achieved at scale: enabling BTC to function in everyday economic use. Within the Bitcoin Hyper environment, applications are designed to use Bitcoin directly as the means of exchange. Participation requires BTC, not a substitute or wrapper.
That is where the dynamic begins to change. When applications depend on BTC to operate, demand shifts away from pure speculation or macro-driven narratives and becomes embedded in actual usage. Bitcoin starts to resemble an active currency circulating through an ecosystem, rather than idle collateral sitting on the sidelines.
However, Bitcoin Hyper is doing more than expanding BTC’s utility. It also introduces an economic layer reminiscent of the early opportunities that first-generation Bitcoin supporters experienced. This execution layer requires energy to operate, and that role is fulfilled by HYPER.
HYPER functions as the network’s gas token, enabling transactions across the system, while also serving as the staking asset that contributes to network security and the governance token that guides its long-term direction. It is the mechanism through which growth at the execution layer is captured.
This is why the presale has already attracted more than $29.5 million, with investors positioning themselves early around the infrastructure they believe Bitcoin will need to sustain its next phase of growth.
At the current presale price of $0.013425, many see HYPER as reflecting early-stage development risk rather than the valuation of a fully operational ecosystem.
How to Purchase HYPER
To acquire HYPER, visit the official Bitcoin Hyper website and complete your purchase using SOL, ETH, USDT, USDC, BNB, or a credit card.
Bitcoin Hyper also recommends using Best Wallet, a widely used crypto and Bitcoin wallet. HYPER is already listed in Best Wallet’s Upcoming Tokens section, allowing users to buy, monitor, and later claim their tokens once the launch goes live.
You can also join the wider Bitcoin Hyper community by following the project on Telegram and X.
JPMorgan Asset Management has introduced a tokenized money-market fund built on the Ethereum blockchain, according to company filings and industry reports.
The fund, called My OnChain Net Yield Fund (MONY), issues shares as digital tokens that live on the public Ethereum network and are aimed at qualified investors through the bank’s Morgan Money platform.
JPMorgan Issues Tokenized Fund On Ethereum
Based on reports, MONY holds familiar, low-risk instruments such as US Treasury securities and repurchase agreements fully backed by Treasuries.
The bank says the token shares represent direct ownership of the fund and can be held at blockchain addresses, opening up on-chain settlement and recordkeeping for a product that normally sits in traditional custody systems.
Seeded With $100 Million
Reports have disclosed that JPMorgan seeded MONY with $100 million of its own capital at launch. The move is meant to kickstart liquidity and show institutional seriousness about putting cash management products on-chain.
The tokenization work is being handled by internal teams tied to JPMorgan’s digital-assets efforts, and the bank has been testing ways to move conventional securities into token form for several years.
How The Tokens Work And Who Can Use Them
Investors receive tokenized fund shares that may be transferred or recorded on Ethereum. Based on reports, access is limited: the fund is offered only to qualified clients via Morgan Money, not to the general retail public.
The token structure mirrors traditional fund economics — holders are exposed to the same short-term instruments that underpin money-market products — but the record of ownership is stored on a public ledger.
Qualified Investors And Access
According to coverage, institutional clients with asset levels above $25 million and accredited individuals with at least $5 million are among those eligible, and the minimum initial investment sits at roughly $1 million.
That narrow access aligns with regulatory guardrails for tokenized securities and with the bank’s goal of serving big, sophisticated cash managers first.
Analysts say the launch is part of a broader push by big asset managers to experiment with tokenized share classes and on-chain settlement.
Other firms have run pilots with similar ideas, and some have already put cash-like products on Ethereum. Based on reports, the move points to an industry desire to test whether blockchain can speed up settlement, increase transparency, or create new on-chain liquidity for institutional cash flows.
Featured image from Unsplash, chart from TradingView
As the week began, the XRP price experienced a 4% decline, bringing it nearly 50% below its all-time highs. However, analysts forecast significant gains for one of the market’s leading altcoins in January 2026, citing three major catalysts that could reshape its market outlook.
A Major Step Towards Broader Access
In a recent analysis, Sam Daodu, a market expert from 24/7 Wall St., emphasized the importance of Vanguard’s decision to approve trading of XRP exchange-traded funds (ETFs).
Daodu emphasized that the real significance lies in the facilitation of distribution; with Vanguard’s advisors able to allocate XRP exposure through regulated ETFs without additional cumbersome processes.
He indicated that three interrelated factors are now at play: the influx of institutional capital through ETF investments, a reduction in supply, and the influence of Vanguard in altering the approach towards the asset.
Notably, the results of the token’s exchange-traded fund launch have already been notable, with XRP inflows hitting $1 billion within the first four weeks of trading, making it one of the fastest-growing crypto ETF launches to date.
Additionally, XRP’s market supply has contracted significantly, dropping by 45% from approximately 3.9 billion tokens at the beginning of 2025 to about 1.6 billion by December.
This contraction can be attributed to large holders refraining from distributing their tokens, leading to an accumulation in whale wallets and the removal of tokens from liquid markets due to ETF custody.
This decreased supply implies that smaller inflows now carry greater influence. With only 1.6 billion tokens available on exchanges, investments of $20-30 million in daily ETF purchases can have a substantive impact on market supply.
A Key Driver For Price Appreciation
The Vanguard XRP ETF launch is particularly significant in this context, as it locks tokens into regulated custody vehicles that are less likely to be sold frequently.
Unlike tokens held on exchanges that can be quickly moved in and out, ETF custody tends to encourage a buy-and-hold strategy, fostering conditions for gradual price appreciation fueled by sustained institutional demand amid a diminishing available supply.
Given that the decision to provide ETF access came late in the year, year-end trading typically focuses on maintaining existing allocations rather than creating new positions.
While the ETF adds credibility to XRP without causing immediate price pressure, its journey to a $3 valuation by January will depend on how swiftly advisory capital mobilizes, the durability of supply compression, and the overall stability of the markets.
XRP Price Path To $3
Three potential scenarios present themselves for XRP’s future. The most optimistic scenario sees advisory capital moving quicker than typical, perhaps allowing advisors to integrate small XRP allocations during January’s rebalancing.
In this case, XRP ETF inflows could remain robust, ranging from $40-60 million daily, while the locked-up supply on exchanges supports a price increase that could see the XRP price surpass $2.25, aim for $2.60, and potentially test $3 by the end of January.
The middle-ground perspective suggests a more conventional institutional timing. In this scenario, while the XRP ETF access will gain attention in December, actual allocations might ramp up gradually, leading to a daily influx of about $20-30 million instead of the earlier expected pace.
Here, the XRP price could establish higher lows and breach the $2.25 mark, facing resistance between $2.40 and $2.80. Price fluctuations would focus more on future adoption rather than immediate implications.
According to Daodu’s conclusions, and given these circumstances, the XRP price reaching $3 could take until the first or second quarter of 2026 rather than being an immediate milestone.
Featured image from DALL-E, chart from TradingView.com
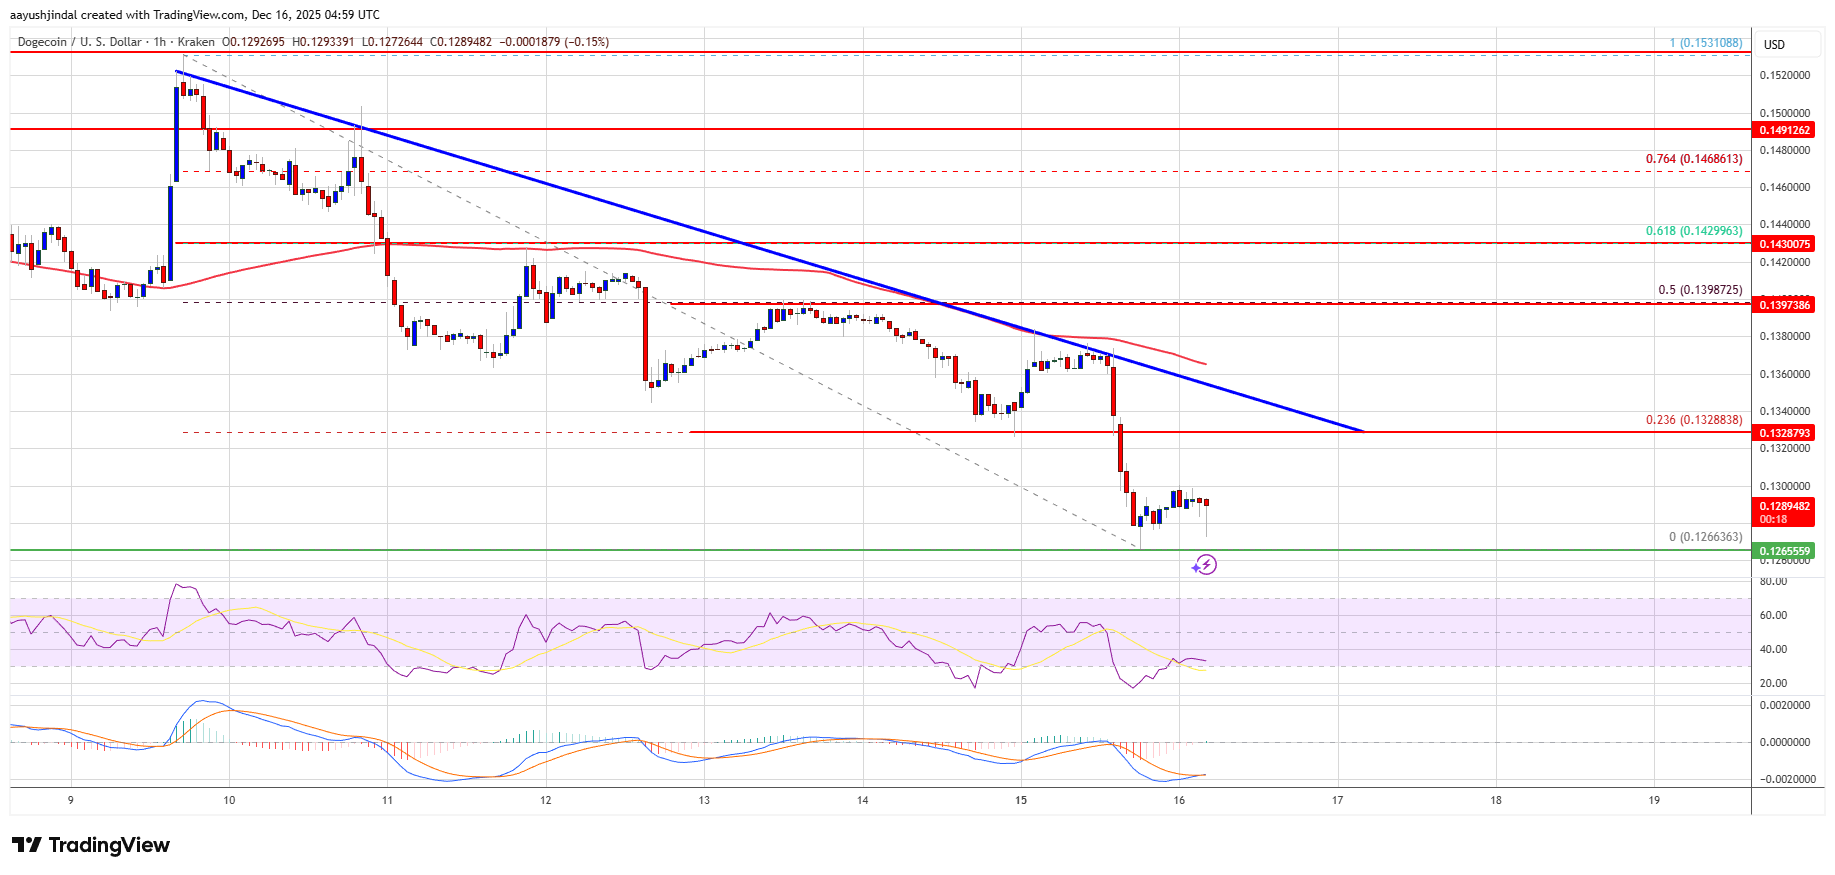
Dogecoin started a fresh decline below the $0.1320 zone against the US Dollar. DOGE is now consolidating losses and might face hurdles near $0.1350.
DOGE price started a fresh decline below the $0.1320 level.
The price is trading below the $0.1300 level and the 100-hourly simple moving average.
There is a key bearish trend line forming with resistance at $0.1340 on the hourly chart of the DOGE/USD pair (data source from Kraken).
The price could extend losses if it stays below $0.1340 and $0.1350.
Dogecoin Price Dips Again
Dogecoin price started a fresh decline after it closed below $0.1380, like Bitcoin and Ethereum. DOGE declined below the $0.1350 and $0.1340 support levels.
The price even traded below $0.130. A low was formed near $0.1266, and the price is now showing bearish signs. It is consolidating below the 23.6% Fib retracement level of the downward move from the $0.1530 swing high to the $0.1266 low.
Dogecoin price is now trading below the $0.1300 level and the 100-hourly simple moving average. If there is a recovery wave, immediate resistance on the upside is near the $0.1325 level. The first major resistance for the bulls could be near the $0.1340 level. There is also a key bearish trend line forming with resistance at $0.1340 on the hourly chart of the DOGE/USD pair.
The next major resistance is near the $0.1400 level and the 50% Fib retracement level of the downward move from the $0.1530 swing high to the $0.1266 low. A close above the $0.1400 resistance might send the price toward the $0.1450 resistance. Any more gains might send the price toward the $0.1500 level. The next major stop for the bulls might be $0.1550.
More Losses In DOGE?
If DOGE’s price fails to climb above the $0.1350 level, it could continue to move down. Initial support on the downside is near the $0.1280 level. The next major support is near the $0.1250 level.
The main support sits at $0.120. If there is a downside break below the $0.120 support, the price could decline further. In the stated case, the price might slide toward the $0.1050 level or even $0.10 in the near term.
Technical Indicators
Hourly MACD – The MACD for DOGE/USD is now gaining momentum in the bearish zone.
Hourly RSI (Relative Strength Index) – The RSI for DOGE/USD is now above the 50 level.
Solana (SOL) has emerged as the most popular blockchain ecosystem of 2025, securing its crown for the second consecutive year despite a significant decrease in chain-specific global interest compared to the previous year.
Solana Takes The Popularity Crown
On Monday, Solana was named the leading blockchain ecosystem by popularity in 2025 by crypto data aggregator CoinGecko. The study examined interest in blockchain ecosystems based on CoinGecko’s non-botted global web traffic from January 1 to December 14, 2025, only including ecosystems with actively listed coins and a non-zero percentage share of traffic.
As a result, a total of 62 blockchain ecosystems were included in the study. Out of the 62 blockchain ecosystems studied, the 20 most popular represented a majority of 95.60% of global interest in chain-specific narratives.
According to the report, the Solana ecosystem captured 26.79% of the global interest in chain-specific narratives this year, retaining its title as the most popular blockchain ecosystem for a second consecutive year.
The Base ecosystem followed in second place, accounting for 13.94% of global investor interest in chain-specific narratives this year, led by constructive developments and partnerships. However, its mindshare experienced a 2.9% decrease from the 16.81% recorded in 2024.
Similar to Solana and Base, the Ethereum ecosystem also retained its position from the 2024 list, ranking as the third most popular ecosystem with 13.43% of global interest. Meanwhile, Sui and BNB Chain moved up in the list, ranking 4th and 5th after more than doubling their mindshare in 2025.
Per the study, the Sui ecosystem recorded the largest mindshare growth, with a 6.9% year-over-year (YoY) increase to reach 11.77% of the total global interest in chain-specific narratives.
The BNB Chain ecosystem saw a 4.9% surge YoY to capture 9.05% in mindshare, fueled by the launch of Binance Alpha in May, which increased BNB Chain’s on-chain trading volumes, the report noted.
Notably, XRP Ledger, Bittensor & Hyperliquid lead new entrants into the top rankings, securing a spot in the top 10 this year.
SOL Memecoins Out Of Leading Narratives
Despite leading the popularity rankings, CoinGecko highlighted that the Solana ecosystem’s mindshare had significantly decreased from the 38.79% it had dominated in 2024.
According to the study, the ecosystem dropped by 12% this year, reflecting the blockchain’s “struggles to expand beyond its close association with meme coin speculation, as well as Solana’s range-bound price despite wider institutional adoption marked by the US ETFs launch.”
This resulted in the Solana ecosystem dropping out of the top leading narratives list this year. In a Friday analysis, CoinGecko reported that memecoin emerged as the most popular crypto narrative in 2025 with a combined 25.02% of global investor interest across the main meme coin category and 35 meme coin trends.
This represented a 5.65% decline from the 30.67% market share that the memecoin narrative held in 2024, suggesting that “the mania for purely speculative crypto may be subsiding.”
The Solana ecosystem lost its spot in the top five most popular crypto narratives, where it had ranked for the previous two years, after being overtaken by AI agents and the Made in USA narratives. Meanwhile, the Solana memecoin sector also dropped out of the top five narratives after a 3.08% decline in global investor interest from 2024.
Nonetheless, “it remains to be seen whether the Solana narrative will be able to ride on new catalysts next year, as momentum from its comeback story runs out,” CoinGecko added.
As of this writing, SOL is trading at $126, a 2.61% decline in the daily timeframe.
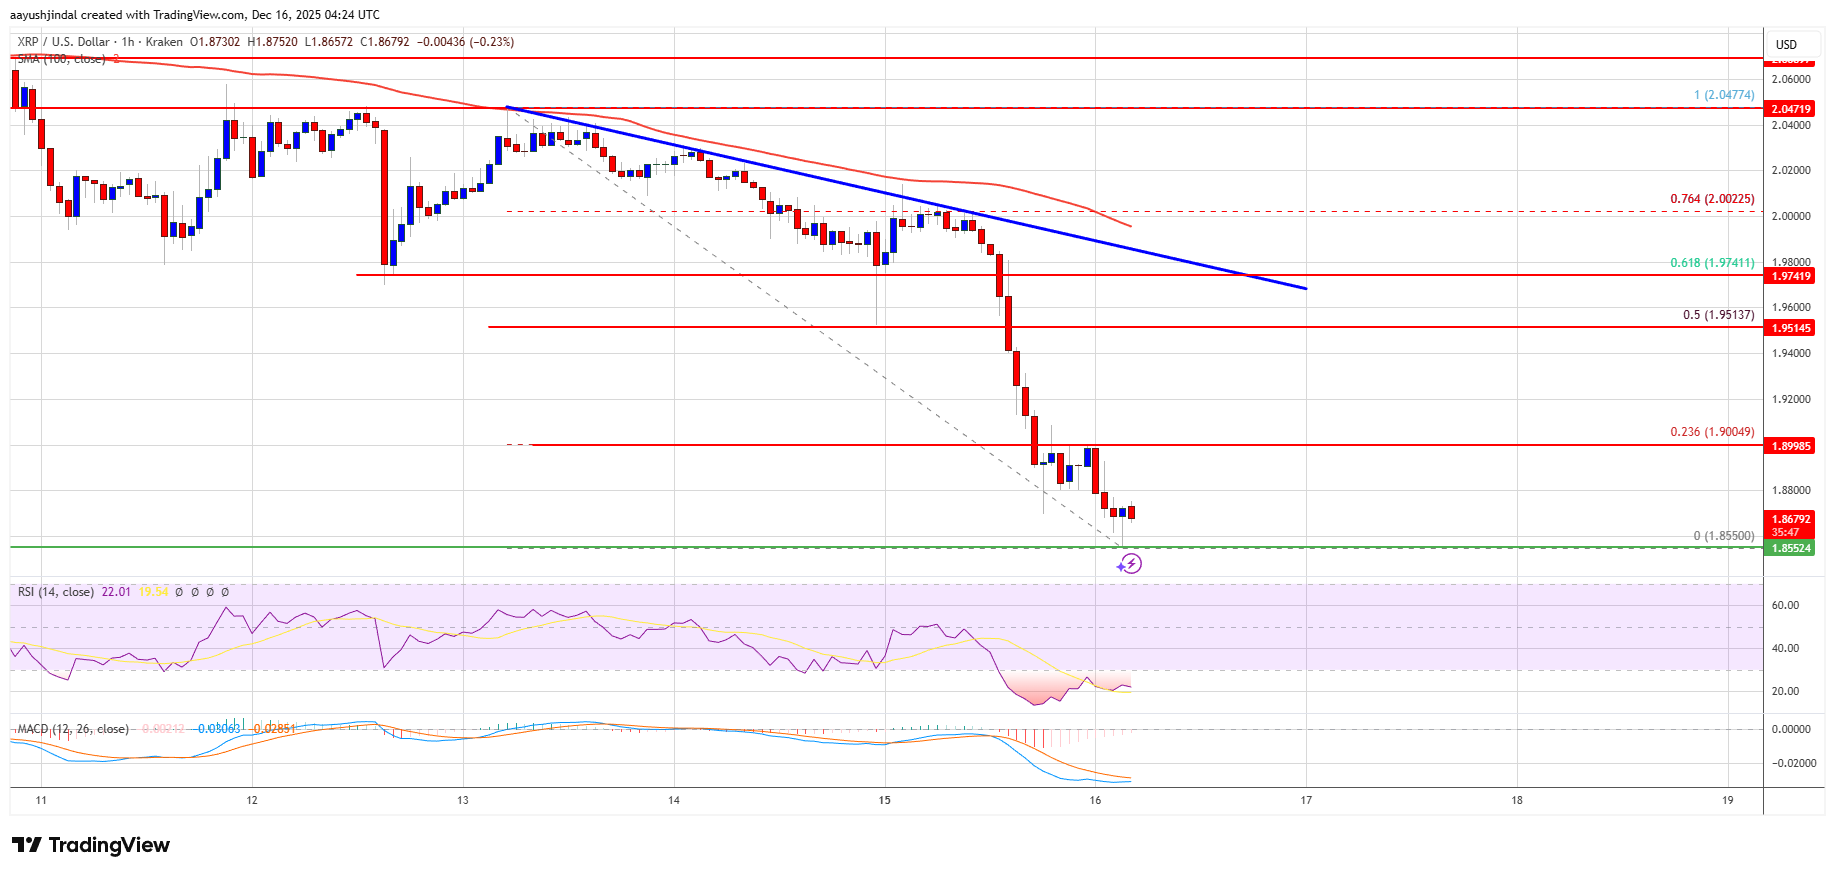
XRP price started a fresh decline below $1.950. The price is now struggling and faces resistance near the $1.920 resistance level.
XRP price started a fresh decline below the $1.950 zone.
The price is now trading below $1.90 and the 100-hourly Simple Moving Average.
There is a bearish trend line forming with resistance at $1.980 on the hourly chart of the XRP/USD pair (data source from Kraken).
The pair could continue to move down if it settles below $1.850.
XRP Price Dips Again
XRP price attempted a recovery wave above $2.020 but failed to continue higher, like Bitcoin and Ethereum. The price started a fresh decline below $2.00 and $1.950.
There was a move below the $1.920 support level. A low was formed at $1.8550, and the price is now showing bearish signs below the 23.6% Fib retracement level of the downward move from the $2.047 swing high to the $1.8550 low.
The price is now trading below $1.90 and the 100-hourly Simple Moving Average. There is also a bearish trend line forming with resistance at $1.980 on the hourly chart of the XRP/USD pair.
If there is a fresh upward move, the price might face resistance near the $1.90 level. The first major resistance is near the $1.920 level. A close above $1.920 could send the price to $1.950 or the 50% Fib retracement level of the downward move from the $2.047 swing high to the $1.8550 low.
The next hurdle sits at $1.980 and the trend line. A clear move above the $1.980 resistance might send the price toward the $2.050 resistance. Any more gains might send the price toward the $2.120 resistance. The next major hurdle for the bulls might be near $2.150.
More Losses?
If XRP fails to clear the $1.90 resistance zone, it could start a fresh decline. Initial support on the downside is near the $1.8550 level. The next major support is near the $1.820 level.
If there is a downside break and a close below the $1.820 level, the price might continue to decline toward $1.7650. The next major support sits near the $1.7320 zone, below which the price could continue lower toward $1.7050.
Technical Indicators
Hourly MACD – The MACD for XRP/USD is now gaining pace in the bearish zone.
Hourly RSI (Relative Strength Index) – The RSI for XRP/USD is now below the 50 level.
Cardano (ADA) is getting the “2020 blastoff” treatment again — at least if you ask Quantum Ascend, a technical analyst on X who says the chart is starting to rhyme with the setup that preceded ADA’s last major run.
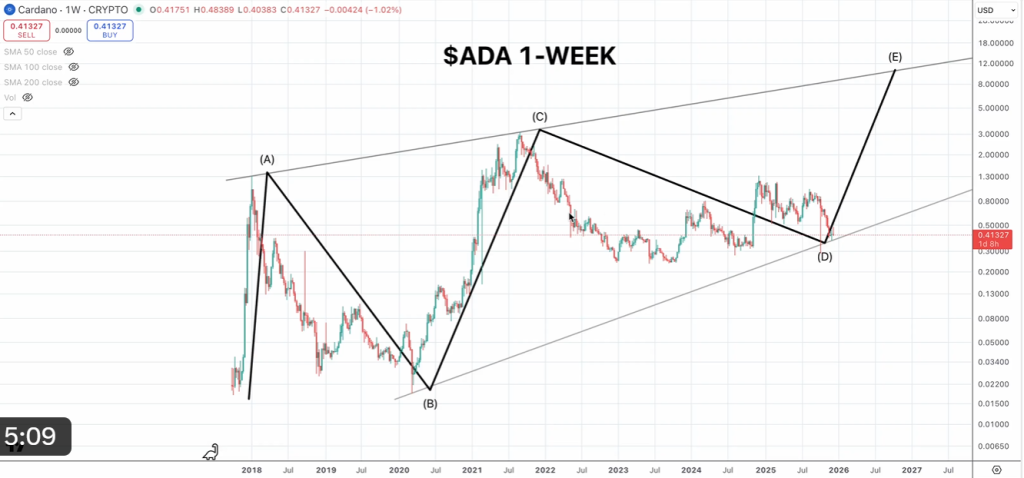
In a Dec. 13 video shared on X, Quantum Ascend (@quantum_ascend) told followers he’s been working through a longer-term weekly count and thinks the market may be grinding toward the end of a drawn-out corrective structure. The punchline: a “conservative” target zone around $4.88–$5.50, and a “primary” bull-run target of $10.40.
“Cardano Mirroring 2020 Blastoff Moment,” his post read, before laying out the two tiers: “Conservative: $4.88-$5.50” and “Primary: $10.40.”
The Framework Behind The Cardano Price Prediction
The framework he’s leaning on isn’t a clean five-wave impulse, he said. Instead, he framed it as something slower and messier — “more of like a large time-based macro correction here on the D-wave,” he said, describing what he believes is a triangle structure developing on the weekly chart.
“We’re creating a triangle structure,” he said. “So I am going to be looking for the E-wave. That’s what ends up coming next.”
A big part of the argument is confluence. Quantum Ascend walked through multiple measurements and trendlines, pointing to price zones where different tools cluster. One reference point was a prior A-to-B drawdown range that, in his view, still hasn’t been fully “closed out,” with a key level “up there at the $5.50 mark.”
Then he zoomed out to the bigger structure, highlighting how an upper trendline from a C-to-D drawdown “converges with the 3.618 [Fibonacci extension] up here,” which he suggested adds weight to the $10 area. “So some confluence for that $10 area,” he said, pointing at the chart level he called out around $10.62.
He also reached for a relative-performance comparison — not to Ethereum itself, but to Ethereum Classic.
“I have another video from the past that compares Ethereum Classic to ADA,” he said. “And if it ends up doing a similar move to Ethereum Classic, that also puts us up into the $10 range.”
Still, the near-term “safe” target he kept circling back to was the $5 region. After walking through a more recent drawdown “going back to the top of the Trump pump to where we’re at now,” he said a “full extension gets us pretty close… around $4.88,” adding that the $5 zone shows “a lot of different signs of confluence.”
“For me, I’m going to say my conservative estimate for ADA is going to be that $5 range,” he said. Then he went straight to the headline number: “I think ADA gets up there around 10 bucks during this bull run.”
To make the comparison feel less abstract, Quantum Ascend argued the current chop looks structurally similar to a prior period before ADA’s last breakout — a fractal-style read. “You guys notice the similarities here?” he asked, describing how both moves get “stopped out a little bit above the 0.5,” roll over, then revisit the lower trendline before pushing back to the top of the range.
And then he widened the lens beyond Cardano, tossing in a fairly aggressive macro view that sits underneath the bullish alt targets. “I honestly, guys, across the board right now, I believe that these corrections are coming to an end,” he said. “I think we have a blow off top in stock markets, in crypto and all of that coming.”
But he also stressed he’s not married to a long-duration “supercycle” narrative. “I am not a long-term bull,” he said. “I am not [predicting a] Bitcoin super cycle to $400K.” His current bitcoin top, he added, is $155,000 — and he expects alts to “severely outperform” in the final leg before “it’s all over.”
On the math side, Quantum Ascend framed $10.40 as big, but not absurd in a market that has already produced outsized multiples. “If we were to get that 1040, 25X, right?” he said, comparing it to prior cycles where ADA saw moves he pegged at “168X” and “75X.”
“So we’re just talking about a 25er,” he added. “Not that crazy when you put it into perspective.”
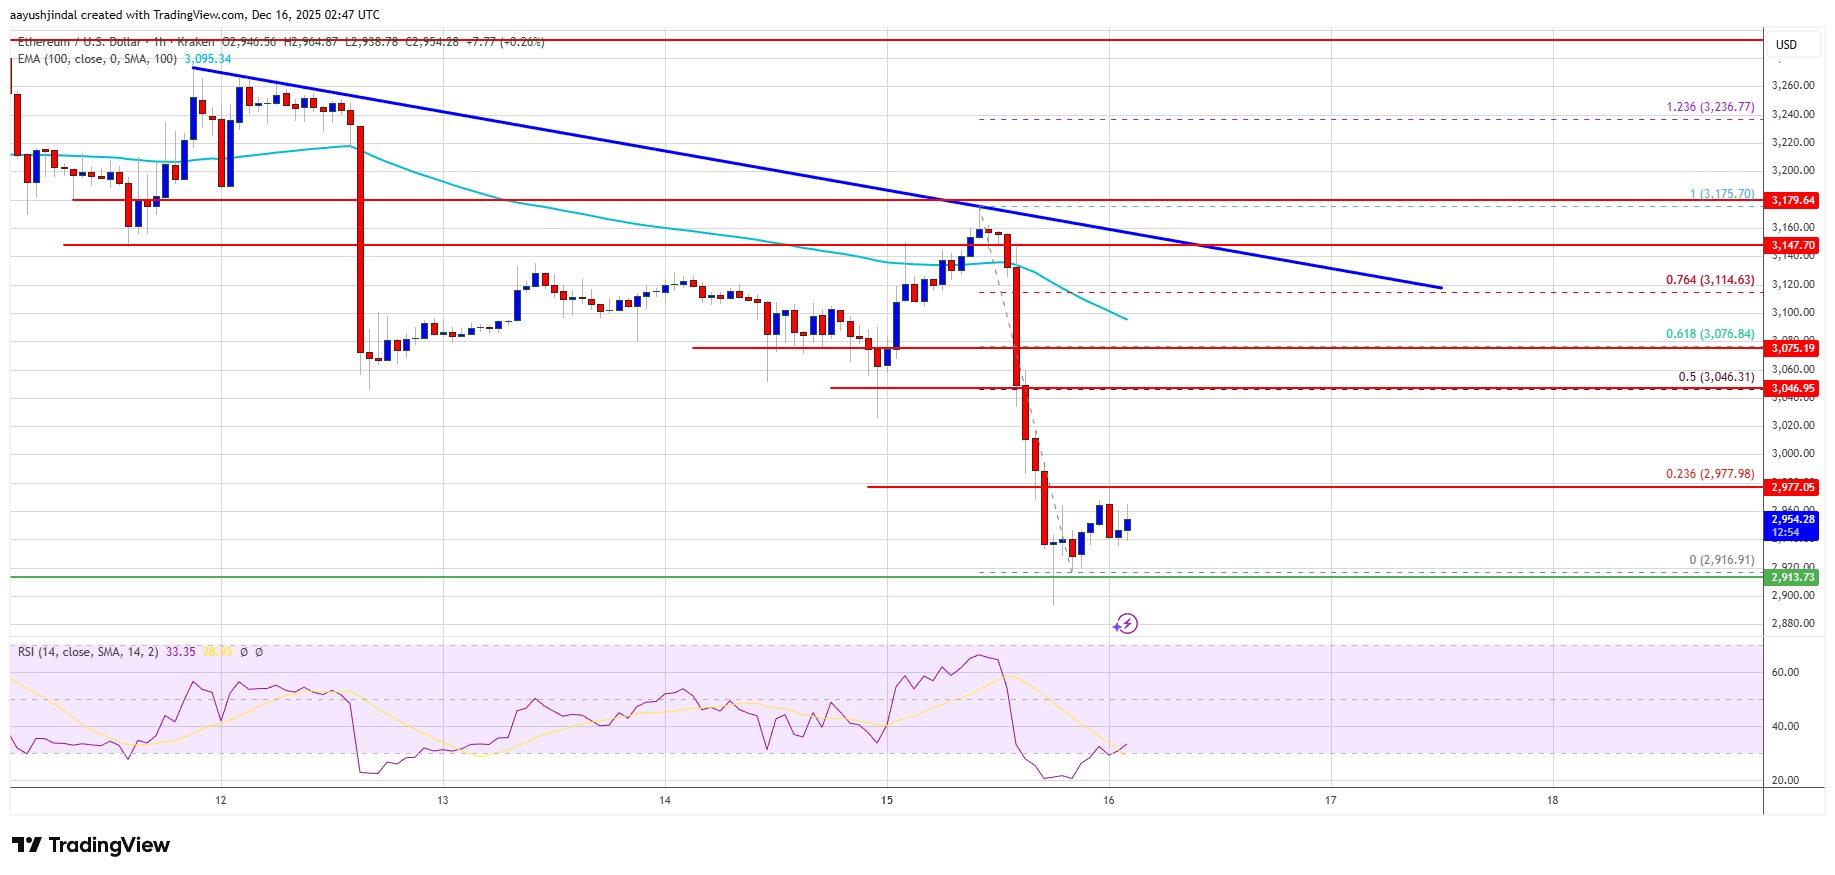
Ethereum price started a fresh decline below $3,000. ETH is now consolidating and might soon aim to start a recovery wave above $2,980.
Ethereum started a fresh decline from the $3,175 zone.
The price is trading below $3,000 and the 100-hourly Simple Moving Average.
There is a connecting bearish trend line forming with resistance at $3,120 on the hourly chart of ETH/USD (data feed via Kraken).
The pair could continue to move down if it settles below the $2,920 zone.
Ethereum Price Dips 5%
Ethereum price failed to stay above $3,150 and started a fresh decline, like Bitcoin. ETH price dipped below $3,120 and $3,050 to enter a bearish zone.
The bears even pushed the price below $3,000. A low was formed at $2,916 and the price is now consolidating losses below the 23.6% Fib retracement level of the downward move from the $3,175 swing high to the $2,916 low.
Ethereum price is now trading below $3,000 and the 100-hourly Simple Moving Average. Besides, there is a connecting bearish trend line forming with resistance at $3,120 on the hourly chart of ETH/USD.
If there is another upward move, the price could face resistance near the $2,980 level. The next key resistance is near the $3,050 level and the 50% Fib retracement level of the downward move from the $3,175 swing high to the $2,916 low. The first major resistance is near the $3,080 level. A clear move above the $3,080 resistance might send the price toward the $3,120 resistance. An upside break above the $3,120 region might call for more gains in the coming days. In the stated case, Ether could rise toward the $3,175 resistance zone or even $3,200 in the near term.
More Losses In ETH?
If Ethereum fails to clear the $2,980 resistance, it could start a fresh decline. Initial support on the downside is near the $2,950 level. The first major support sits near the $2,920 zone.
A clear move below the $2,920 support might push the price toward the $2,880 support. Any more losses might send the price toward the $2,840 region. The next key support sits at $2,800.
Technical Indicators
Hourly MACD – The MACD for ETH/USD is gaining momentum in the bearish zone.
Hourly RSI – The RSI for ETH/USD is now below the 50 zone.

 (@CoinbaseMarkets)