Reading view

There are new articles available, click to refresh the page.

XRP Price Must Defend This Level To Avoid 50% Breakdown, Analyst Warns

As the crypto market recovers from the latest pullback, XRP is attempting to climb up from its recent lows. Some analysts have suggested that the cryptocurrency must defend its current levels or risk a 50% drop to levels not seen since 2024.

XRP At Make-Or-Break Level

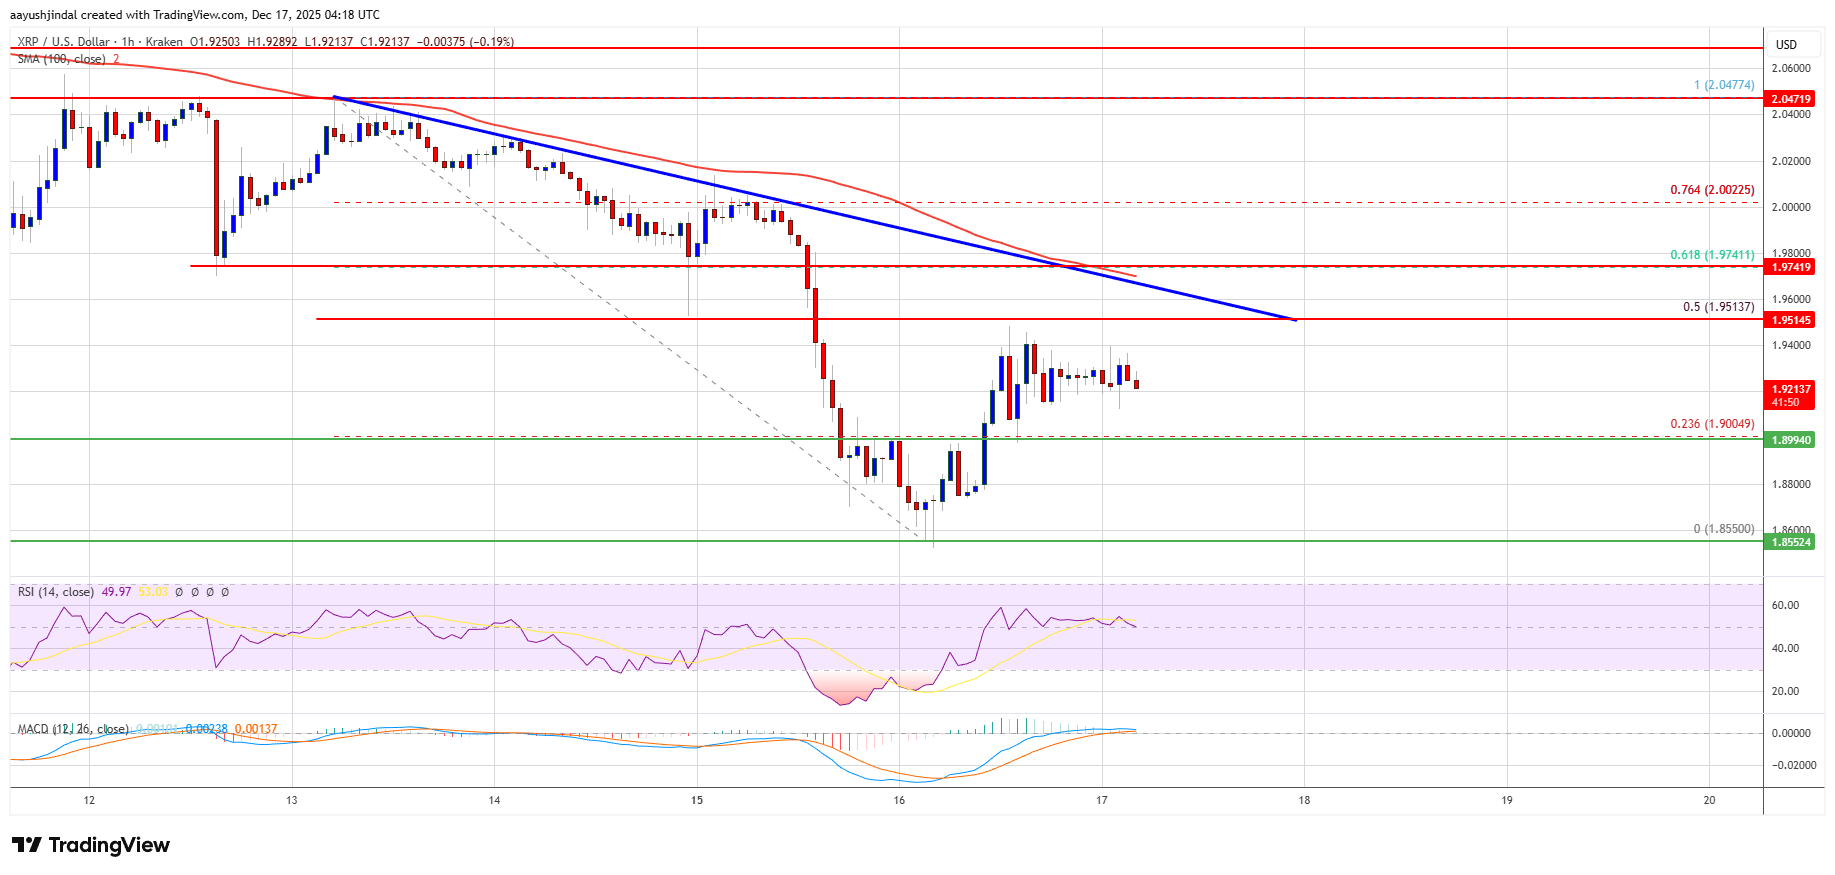
Amid the start-of-week market correction, XRP recorded a 6% drop toward its lowest level in weeks. The price lost $2.00 support on Monday morning and continued to lose key levels despite uninterrupted institutional interest.

The cryptocurrency has been trading within the $2.00-$2.25 price range over the past month, only losing its lower boundary during the late November pullback. Monday’s correction sent the altcoin below the range’s lower support again, hitting a multi-week low of $1.88 before bouncing around an area that has been crucial for the past year.

Notably, XRP has bounced from the $1.85-$1.90 support zone after every major correction since the November 2024 breakout, climbing back above the $2.00 level each time. However, some market observers have suggested that the price risks a significant correction if it is unable to hold the current levels.

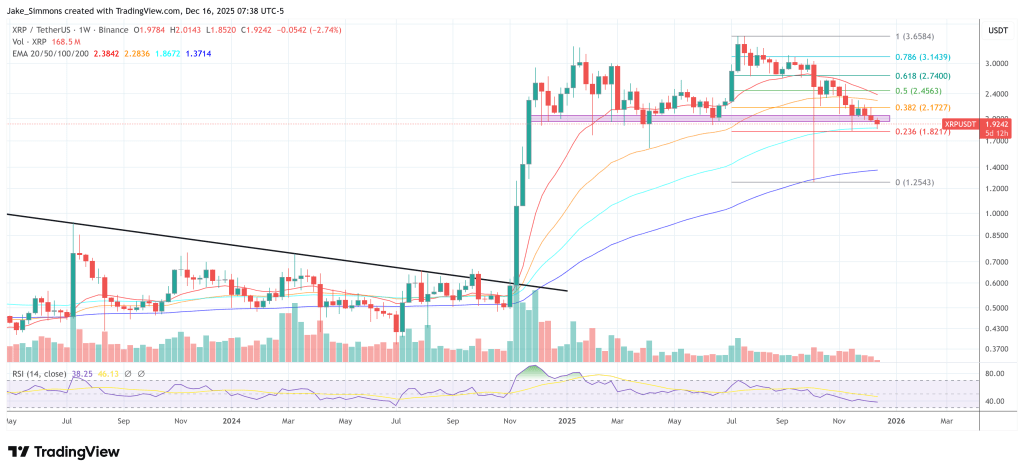
Ali Martinez pointed out that the cryptocurrency has fallen below its one-year price range, between the $1.92-$3.27 levels, which could lead to a 50% drop below this area. To the analyst, XRP’s price must secure a daily close above $1.92 to prevent a drop to the $1.00 support, which has not been seen in over a year.

Similarly, Cheds Trading affirmed that XRP is “flirting with a high time frame breakdown.” Per the chart, the altcoin appears to be forming a high-timeframe rounding top or double top pattern with a higher high.

The analyst noted that in the case of the latter, the M formation would be confirmed if the $1.88 level, where the pattern’s neckline is situated, is lost. This could lead to a “measured move to roughly [the] MA 200 area/$1.00 range.”

Price Ready For 2026 Markup Phase?

Despite the warnings, other market watchers shared a positive outlook for XRP in the coming months. Trader Niels affirmed that the leading altcoin is “looking good” at the current levels.

According to the post, the cryptocurrency is “sweeping the $1.8 support zone again” while showing a bullish divergence on the daily timeframe, which suggests that the price could soon move to higher levels.

To the trader, once XRP breaks above $2.20 resistance, it could surge 27%-37% towards the $2.80-$3.00 area “within a month.”

Meanwhile, analyst ChartNerd highlighted that XRP appears to be repeating its 2023-2024 price action, which led to its massive breakout in November 2024. The chart shows that the altcoin accumulated for a year and a half, bouncing between the range’s lower and upper boundaries before its markup phase in late Q4 2024.

Following this expansion period, the cryptocurrency is showing a similar accumulation range, leading the analyst to suggest that XRP may continue consolidating within its current range before another markup phase occurs.

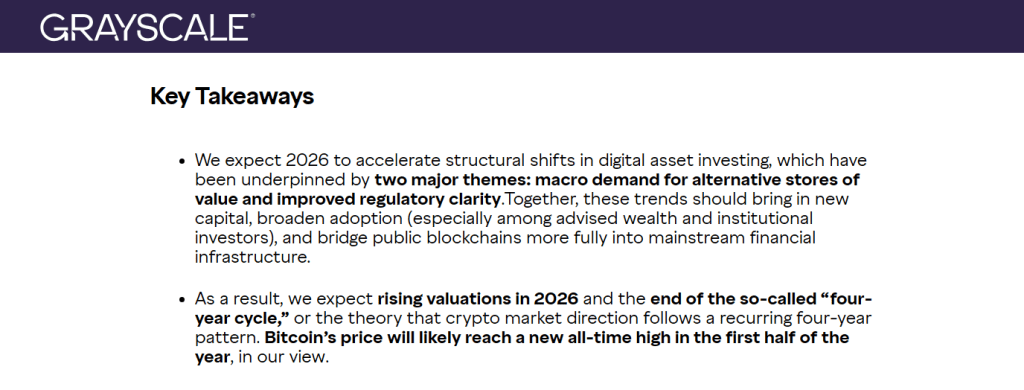
“Regardless of scenarios, or how ugly/beautiful it gets, a massive markup phase similar to November 2024 is likely between now and late 2026,” he stated.

As of this writing, XRP is trading at $1.92, a 1.65% increase in the daily timeframe.

XRP, XRPUSDT

SEC Wraps Up Investigation Into Aave Protocol, Confirms CEO Stani Kulechov

The US Securities and Exchange Commission (SEC) has officially concluded its investigation into the decentralized finance (DeFi) protocol Aave (AAVE), marking a significant development in the ongoing evolution of regulatory approaches within the cryptocurrency industry. 

Stani Kulechov, the founder and CEO of the Aave protocol, confirmed the end of the four-year investigation in a post on social media, expressing relief and optimism about the future of DeFi.

Aave Founder Celebrates End Of SEC Investigation

In his announcement, Kulechov emphasized the considerable effort and resources invested by the Aave team throughout this process. He stated, “We are finally ready to share that the SEC has concluded its investigation into the Aave Protocol.” 

Highlighting the impact of regulatory scrutiny on DeFi, he added, “This process demanded significant effort… to protect Aave, its ecosystem, and DeFi more broadly.” 

Kulechov expressed hope for a new chapter in which developers can freely innovate and contribute to the future of finance, asserting, “DeFi will win.”

This conclusion is notable against the backdrop of heightened regulatory pressure that DeFi projects have faced in recent years. Under the previous SEC chair, Gary Gensler, the agency made a concerted effort to enforce regulations in the crypto space. 

In 2021, the SEC initiated 19 enforcement actions related to cryptocurrency in just the first nine months. However, recent patterns reveal a substantial shift in the commission’s stance on crypto enforcement.

SEC Eases Crypto Enforcement Actions By Over 60% 

Since President Donald Trump returned to the White House, the SEC has reportedly eased enforcement actions in over 60% of ongoing cryptocurrency cases. 

A New York Times investigation published recently analyzed thousands of government documents and court records, revealing that the SEC has either dismissed, paused, or reduced penalties for a significant majority of active crypto cases since January 20, 2021. 

While Trump’s first term saw an average of one high-profile cryptocurrency case per month—including the notable action against Ripple Labs—the current landscape indicates a less aggressive regulatory approach for major players like Binance, Ripple, and Gemini. 

Following the administration shift, enforcement actions against these companies have either been withdrawn or significantly softened.

Paul S. Atkins, the newly appointed SEC chair under the Trump administration, has labeled this regulatory shift a “new day” for the cryptocurrency industry. 

Aave

At the time of writing, the protocol’s native token, AAVE, was trading at $187, having only surged by 1% following the announcement. However, on a year-to-date basis, the AAVE token has seen a significant 52% drop, with prices currently 72% down from the all-time high of $661 reached in May 2021.  

Featured image from DALL-E, chart from TradingView.com 

XRP’s Price Action Sends A Warning Despite Positive ETF Flows

Despite recent positive closes from spot XRP ETFs, the cryptocurrency’s price action is sending a clear warning to traders. Market structure remains weak, and without signs of a confirmed reversal, short-term risks persist. XRP’s current behavior highlights that bullish sentiment from ETFs alone isn’t enough to drive a sustained rally, making caution essential for anyone entering the market.

New Year Volatility Hits Crypto Markets Hard

Efloud, in a recent update, highlighted that with the start of the new year and continued uncertainty across the markets, cryptocurrencies have once again been among the hardest hit. Low trading volume and a lack of clear direction have kept pressure on the sector, and without an obvious reversal signal, altcoins continue to grind lower day by day.

Given this backdrop, caution remains essential. As emphasized in previous analyses, any attempt to trade against the prevailing trend at support levels should be backed by clear bullish breakout structures on lower timeframes. Without such confirmation, moves higher are more likely to be short-lived reactions rather than meaningful reversals.

XRP

From a technical standpoint, XRP’s price has now lost the “Daily Imb” zone, weakening the overall structure. If price dips below the most recent swing low and then attracts buying interest, the $1.98 area is expected to act as the first major resistance. As previously noted, the outlook remains negative unless the YO region is reclaimed.

Beyond $1.98, another key resistance lies within the red boxed zone. Together, $1.98, the YO area, and the red boxed region form three critical hurdles where price is likely to face selling pressure in the near term.

Price Action Still Outweighs ETF Optimism

According to Efloud, while spot XRP ETFs have posted positive closes for 18 consecutive days, this development alone does not outweigh what the chart itself is signaling. He emphasized that price action and market structure remain the most important factors. Until these begin to shift in a clearly bullish direction, any purchases are better seen as part of a gradual accumulation strategy rather than a confirmation of a trend reversal. 

From this perspective, these buys are primarily aimed at averaging down while the market searches for a more stable structure. Efloud added that if market suppression continues and a sharper correction unfolds, the area around $1.53 could emerge as a potential buy zone. However, this scenario depends on broader market behavior and is not a certainty.

Finally, the analyst clarified that the $1.53 level was illustrated as a hypothetical example. Efloud warned that entering positions at support zones or key levels without observing clear breakout or reversal structures carries added risk and should be approached with caution.

XRP

Solana (SOL) Loses Momentum—Could Sellers Take Control Again?

Solana started a recovery wave above the $126 zone. SOL price is now consolidating and faces hurdles near the $132 zone.

  • SOL price started a decent recovery wave above $126 and $128 against the US Dollar.
  • The price is now trading below $130 and the 100-hourly simple moving average.
  • There is a key bearish trend line forming with resistance at $132 on the hourly chart of the SOL/USD pair (data source from Kraken).
  • The price could continue to move up if it clears $130 and $132.

Solana Price Faces Resistance

Solana price remained stable and started a decent recovery wave from $124, like Bitcoin and Ethereum. SOL was able to climb above the $126 level.

There was a move above the 23.6% Fib retracement level of the downward move from the $136 swing high to the $124 low. The bulls even pushed the price above $130. However, the bears remained active near $130. There is also a key bearish trend line forming with resistance at $132 on the hourly chart of the SOL/USD pair

Solana is now trading below $130 and the 100-hourly simple moving average. On the upside, immediate resistance is near the $130 level, the 100-hourly simple moving average, and the 61.8% Fib retracement level of the downward move from the $136 swing high to the $124 low.

Solana Price

The next major resistance is near the $132 level. The main resistance could be $135. A successful close above the $135 resistance zone could set the pace for another steady increase. The next key resistance is $144. Any more gains might send the price toward the $150 level.

Another Decline In SOL?

If SOL fails to rise above the $132 resistance, it could continue to move down. Initial support on the downside is near the $126 zone. The first major support is near the $124 level.

A break below the $124 level might send the price toward the $116 support zone. If there is a close below the $116 support, the price could decline toward the $108 zone in the near term.

Technical Indicators

Hourly MACD – The MACD for SOL/USD is gaining pace in the bearish zone.

Hourly Hours RSI (Relative Strength Index) – The RSI for SOL/USD is below the 50 level.

Major Support Levels – $126 and $124.

Major Resistance Levels – $130 and $132.

Bitcoin, Ethereum Plunge Triggers Near-$600 Million Crypto Long Flush

Bitcoin, Ethereum, and other digital assets have witnessed a sharp retrace during the last 24 hours, which has resulted in a long squeeze on derivatives exchanges.

Crypto Long Liquidations Have Neared $600 Million During The Past Day

According to data from CoinGlass, the latest sharp price action in the cryptocurrency market has accompanied a huge amount of liquidations over at the derivatives side of the sector.

Liquidation” here naturally refers to the forceful closure that any open contract has to undergo after it has amassed losses of a certain degree. For long investors, this happens when the asset’s price drops, while for shorts, liquidation occurs after a surge.

How much the cryptocurrency will have to move in one direction to liquidate a specific position comes down to the percentage threshold defined by the platform and the amount of leverage that the trader has opted for. During sharp price swings, positions with high amounts of leverage attached are the first to go.

Bitcoin and other assets have faced some notable volatility during the past day, which has once again caught out traders on the derivatives market. As the table below shows, liquidations have crossed $650 million over the last 24 hours.

Bitcoin Liquidations

About $584 million of these liquidations involved long positions alone. That’s equivalent to almost 90% of the total, showcasing how disproportionate the price volatility has been during this period.

In terms of the individual symbols, the largest contributor to the liquidation event has been Ethereum, not Bitcoin, as is often the case.

Bitcoin Vs Ethereum Vs Other Cryptos

With over $235 million in contracts involved, Ethereum has notably outpaced Bitcoin, which has witnessed $186 million in liquidations. ETH facing more liquidations is likely due to the fact that its price drawdown has been stronger during the past day.

Out of the altcoins, Solana has come out on top with $37 million in positions flushed, ahead of XRP ($16 million) and Dogecoin ($12 million). Interestingly, SOL has outperformed the two despite its losses being more limited.

In some other news, the latest Bitcoin decline has meant that its price has fallen back under a key on-chain price level, as the chart shared by analytics firm Glassnode shows.

Bitcoin Price Models

The level in question is the Active Realized Price, corresponding to the cost basis of the active participants on the Bitcoin network. Currently, it’s located at $87,900, which is above the cryptocurrency’s spot price.

Thus, it would appear that the latest dip has put the active investors as a whole into a state of net unrealized loss.

Bitcoin Price

At the time of writing, Bitcoin is floating around $87,200, down more than 3% over the last seven days.

Bitcoin Price Chart

XRP Price Recovery Looks Fragile—Can Bulls Break the Cap?

XRP price started a recovery wave above $1.90. The price is now consolidating and might struggle to clear the $2.00 resistance.

  • XRP price started a recovery wave above the $1.9050 zone.
  • The price is now trading below $2.00 and the 100-hourly Simple Moving Average.
  • There is a bearish trend line forming with resistance at $1.9520 on the hourly chart of the XRP/USD pair (data source from Kraken).
  • The pair could continue to move up if it settles above $2.00.

XRP Price Faces Resistance

XRP price remained supported above $1.850 and started a recovery wave, like Bitcoin and Ethereum. The price was able to climb above $1.880 and $1.90 to enter a short-term positive zone.

There was also a move above the 23.6% Fib retracement level of the downward move from the $2.047 swing high to the $1.850 low. The bears defended a close above the $1.950 level and the price reacted to the downside. There is also a bearish trend line forming with resistance at $1.9520 on the hourly chart of the XRP/USD pair.

The price is now trading below $1.950 and the 100-hourly Simple Moving Average. If there is a fresh upward move, the price might face resistance near the $1.950 level and the trend line. It coincides with the 50% Fib retracement level of the downward move from the $2.047 swing high to the $1.850 low.

XRP Price

The first major resistance is near the $2.00 level. A close above $2.00 could send the price to $2.050. The next hurdle sits at $2.120. A clear move above the $2.120 resistance might send the price toward the $2.20 resistance. Any more gains might send the price toward the $2.220 resistance. The next major hurdle for the bulls might be near $2.250.

Another Drop?

If XRP fails to clear the $2.00 resistance zone, it could start a fresh decline. Initial support on the downside is near the $1.90 level. The next major support is near the $1.850 level.

If there is a downside break and a close below the $1.850 level, the price might continue to decline toward $1.820. The next major support sits near the $1.80 zone, below which the price could continue lower toward $1.7650.

Technical Indicators

Hourly MACD – The MACD for XRP/USD is now losing pace in the bearish zone.

Hourly RSI (Relative Strength Index) – The RSI for XRP/USD is now above the 50 level.

Major Support Levels – $1.90 and $1.850.

Major Resistance Levels – $1.950 and $2.00.

Why Ethereum Is Chosen As A Settlement Layer For New Money Market Fund

In a significant milestone for the evolution of on-chain finance, a new money market fund has selected Ethereum as its primary settlement layer toward blockchain-native infrastructure for traditional financial products. This decision reflects growing confidence in ETH security, scalability, ecosystem maturity, and qualities that institutional investors and asset managers increasingly demand when moving regulated financial instruments onto public blockchains.

How The New On-Chain Settlement Improves Operational Efficiency

The largest money whale in institutional finance just made its biggest move by launching a new money market fund on Ethereum, and it’s coming from J.P. Morgan Asset Management. According to an analyst known as Milk Road on X, the company oversees roughly $4 trillion in client assets, and seeds these funds with $100 million of its own capital before opening them up to the public. This fund is called My On-Chain Net Yield Fund (MONY), which is similar to a normal money market fund.

It is set to hold assets designed to preserve capital and remain liquid. A key difference between the fund and others is that shares are issued and tracked on ETH using JPMorgan’s Kinexys platform. The feature allows the fund to settle faster, issue and redeem shares continuously, and transfer ownership without waiting on the traditional clearing system.

Furthermore, this product is limited to large investors, individuals with at least $5 million investments, and institutions with $25 million, including a $1 million minimum to get started. The risk profile and purpose are familiar, and it’s a safe yield for investors. 

Meanwhile, for JPMorgan, this is a major operational upgrade offering faster cash transactions, tighter integration with treasury systems, and smoother collateral movement. Larger asset managers are starting by moving the safest, most conservative products on-chain first, because that’s where efficiency gains would show up immediately. “Adoption is accelerating,” Milk Road noted.

Why Ethereum Is More Than Just Technology

According to AdrianoFeria, the world’s greatest misunderstanding of Ethereum is viewing it solely as a technology. AdrianoFeria has pointed out that ETH is a network of economic actors coordinating around shared rules. It is also a social contract and a system that is designed to enable collaboration in the most adverse situations. 

At the core, ETH functions as a global and neutral arbitrator. Over time, it has proven itself to be the most long-standing, reliable, and trustworthy neutral arbitrator in the world. This arbitrator is the most valuable aspect of ETH, and any valuable model must account for it to have a chance of estimating realistic ETH price targets.

“If you are stuck with a cash flow-centric valuation for ETH, then it is time to sit down and study the system more deeply, and if you believe cash flow explains most of ETH’s value, you haven’t dug deep enough,” the expert mentioned.

Ethereum

Ethereum Price Ranges Under $3K—Is Direction About to Change?

Ethereum price started a fresh decline below $3,000. ETH is now consolidating and might soon aim to start a recovery wave if it clears $3,025.

  • Ethereum started a fresh decline below the $3,050 zone.
  • The price is trading below $3,000 and the 100-hourly Simple Moving Average.
  • There is a connecting bearish trend line forming with resistance at $3,110 on the hourly chart of ETH/USD (data feed via Kraken).
  • The pair could continue to move down if it settles below the $2,900 zone.

Ethereum Price Starts Consolidation

Ethereum price failed to stay above $3,050 and started a fresh decline, like Bitcoin. ETH price dipped below $3,020 and $3,000 to enter a bearish zone.

The bears even pushed the price below $2,920. A low was formed at $2,875 and the price is now consolidating losses. There was a minor recovery toward the 23.6% Fib retracement level of the downward move from the $3,175 swing high to the $2,875 low.

Ethereum price is now trading below $3,000 and the 100-hourly Simple Moving Average. Besides, there is a connecting bearish trend line forming with resistance at $3,110 on the hourly chart of ETH/USD.

If there is another upward move, the price could face resistance near the $2,975 level. The next key resistance is near the $3,025 level and the 50% Fib retracement level of the downward move from the $3,175 swing high to the $2,875 low. The first major resistance is near the $3,050 level.

Ethereum Price

A clear move above the $3,050 resistance might send the price toward the $3,110 resistance and the trend line. An upside break above the $3,110 region might call for more gains in the coming days. In the stated case, Ether could rise toward the $3,200 resistance zone or even $3,250 in the near term.

Another Decline In ETH?

If Ethereum fails to clear the $3,025 resistance, it could start a fresh decline. Initial support on the downside is near the $2,920 level. The first major support sits near the $2,900 zone.

A clear move below the $2,900 support might push the price toward the $2,840 support. Any more losses might send the price toward the $2,800 region. The next key support sits at $2,765.

Technical Indicators

Hourly MACDThe MACD for ETH/USD is losing momentum in the bearish zone.

Hourly RSIThe RSI for ETH/USD is now near the 50 zone.

Major Support Level – $2,920

Major Resistance Level – $3,025

Cantor Fitzgerald Projects Major Growth For Hyperliquid (HYPE) In Explosive New Report

Cantor Fitzgerald, one of the world’s leading asset management firms, has released an in-depth report highlighting the promising future of the decentralized exchange (DEX) Hyperliquid (HYPE). 

The 62-page analysis predicts significant growth for both the platform and its native token over the next decade, painting a bullish outlook for investors. 

Hyperliquid As ‘The Exchange Of All Exchanges’

As detailed in the report, Hyperliquid operates as a decentralized exchange specializing in trading perpetual futures and is built on a custom layer-1 blockchain. Currently, HYPE has a fully diluted market cap of approximately $15.8 billion. 

Year-to-date (YTD) 2025, the platform has generated an impressive $874 million in fees from a staggering $2.947 trillion in trading volume. 

A key feature that makes HYPE particularly attractive, and highlighted in the report, is its unique fee structure: approximately 99% of all fees generated by the protocol are allocated to repurchasing and burning the underlying token. 

This mechanism not only supports the value of HYPE but also reduces its circulating supply. In early 2025 alone, about 2.6% of all HYPE tokens expected to be in circulation, or roughly 5% of the current supply, were repurchased and burned. 

With the anticipation of new product launches, Cantor Fitzgerald views HYPE as “the exchange of all exchanges” and believes there’s a realistic path for annual fees to soar to $5 billion within the next decade.

Why Market Dynamics Favor HYPE

When it comes to the platform’s native token, HYPE has successfully captured considerable market share and emerged as one of the standout products in the cryptocurrency space over the past year. 

In addition to perpetual trading, Hyperliquid has launched spot trading and HIP-3 markets, enabling users to create new markets for a variety of assets including stocks and commodities.

Cantor Fitzgerald’s report emphasizes that the immediate determinant of HYPE’s market price will hinge on industry sentiment regarding competition. The ability of emerging rivals to challenge HYPE and affect its fee-generating capacity is paramount. 

However, the report argues that current fears surrounding competition may be overstated. It posits that “point tourists”—those who shift from platform to platform seeking incentives—are likely to return to the platform offering the deepest liquidity and best execution, which, according to Cantor Fitzgerald, is Hyperliquid.

A mere 1% increase in market share from CEX competitors in the perpetuals sector could translate to approximately $600 billion in trading volume. Based on existing perpetual fee rates, this could result in an additional $272 million in annual fees. 

By applying a conservative 25x valuation multiple to these fees, the potential market capitalization would rise to $6.8 billion.

HYPE Price To Reach $271?

Assuming moderate share gains over the next decade—projecting around 17% in perpetual trades and 18% in spot trading—Hyperliquid’s annual fees could surpass the $5 billion mark. 

A conservative valuation multiple of 25x, this would suggest a future market capitalization of approximately $125 billion. Given that nearly all generated fees will be used to repurchase HYPE tokens, a large portion of the circulating supply could potentially be bought back by the time the platform reaches these fee levels.

With a forecasted expansion of the fully diluted market cap from roughly $15.8 billion today to $125 billion in the future, combined with a declining supply of HYPE tokens, the projected share price is poised to increase at an even faster pace. 

If 20% of the Hyperliquid token float is repurchased—valued at around $3.5 billion today—the report suggests that the HYPE price could reach $271 at a fully diluted valuation of $125 billion.

The projections suggest that if HYPE captures just 1% of the market share annually and maintains consistent trading volumes from CEXs, the price of HYPE could grow substantially. 

By year 10, the asset manager believes that circulating supply could decrease from 577.2 million to approximately 144.9 million, while the market cap could remain around $16.1 billion based on conservative fee estimates excluding spot and HIP-3 revenues.

Hyperliquid

At the time of writing, Hyperliquid’s native token is trading at $26.49, having recorded major losses of almost 32% over the past month. This represents a 55% gap from the current trading levels and the all-time high of $59.30.

Featured image from DALL-E, chart from TradingView.com 

Bitcoin Price Regroups After Losses—Is Directional Break Near?

Bitcoin price declined further and traded below the $87,000 support zone. BTC is now consolidating and might struggle to clear the $89,350 zone.

  • Bitcoin started a fresh decline below the $87,500 zone.
  • The price is trading below $88,000 and the 100 hourly Simple moving average.
  • There is a bearish trend line forming with resistance at $88,500 on the hourly chart of the BTC/USD pair (data feed from Kraken).
  • The pair might continue to move up if it settles above the $89,350 zone.

Bitcoin Price Consolidates Losses

Bitcoin price struggled to stay above the $89,000 and $88,500 levels. BTC started a fresh decline and traded below the $88,000 support.

The price even spiked below the $86,500 support. However, the bulls were active near the $85,000 zone. A low was formed at $85,151 and the price recently started an upside correction. There was a move above the 23.6% Fib retracement level of the downward move from the $93,560 swing high to the $85,151 low.

The bears are active near $89,000. Bitcoin is now trading below $88,000 and the 100 hourly Simple moving average. If the bulls remain in action, the price could attempt more gains. Immediate resistance is near the $88,000 level. The first key resistance is near the $88,500 level. There is also a bearish trend line forming with resistance at $88,500 on the hourly chart of the BTC/USD pair.

Bitcoin Price

The next resistance could be $89,350 or the 50% Fib retracement level of the downward move from the $93,560 swing high to the $85,151 low. A close above the $89,350 resistance might send the price further higher. In the stated case, the price could rise and test the $90,000 resistance. Any more gains might send the price toward the $91,200 level. The next barrier for the bulls could be $92,000 and $92,500.

Another Drop In BTC?

If Bitcoin fails to rise above the $88,500 resistance zone, it could start another decline. Immediate support is near the $87,000 level. The first major support is near the $86,500 level.

The next support is now near the $85,500 zone. Any more losses might send the price toward the $85,000 support in the near term. The main support sits at $83,500, below which BTC might accelerate lower in the near term.

Technical indicators:

Hourly MACD – The MACD is now losing pace in the bearish zone.

Hourly RSI (Relative Strength Index) – The RSI for BTC/USD is now near the 50 level.

Major Support Levels – $85,500, followed by $85,500.

Major Resistance Levels – $88,500 and $89,350.

TechCrunch Founder Names XRP Among His Largest Crypto Positions

Michael Arrington, the founder of TechCrunch and CrunchBase, has placed XRP among his largest personal crypto holdings, according to a recent social post.

He listed XRP as one of his top five positions by dollar value, alongside Bitcoin, Ethereum, Solana and Immutable. The disclosure landed plenty of attention online and reignited debate about who is buying what and why.

Arrington’s Holdings And Community Reaction

Reports have disclosed that his post drew heavy engagement, with replies running the gamut from Bitcoin-only stances to more mixed portfolios.

Several industry figures echoed Arrington’s mix; Tony Edward, for example, listed XRP with BTC and ETH when discussing core positions.

The debate was loud and fast on social feeds. Some users framed the move as a vote of confidence. Others warned that one investor’s choices do not equal a market-wide shift.

Tell me your top five crypto holdings (by total dollar value).

Mine are XRP, BTC, ETH and IMX

— Michael Arrington 🏴‍☠️ (@arrington) December 13, 2025

Institutional Moves Follow

Based on reports, Arrington’s public support is tied to direct institutional activity. In October, Arrington Capital joined Ripple and SBI Holdings to back an initiative by Evernorth aimed at building a large institutional XRP treasury.

The project, which has been described in some circles as among the biggest of its kind, aims to increase institutional use of XRP and to support on-ledger activity such as decentralized finance and lending.

That involvement means Arrington is more than a vocal supporter; he is also tied to projects that could change how institutions use the token.

XRP Market Moves And Key Figures

XRP’s market picture has been mixed. As of December 16, 2025, the token was trading around $1.98, having held in a roughly $2.00 to $2.20 band in recent sessions.

There was a small daily lift of about 1.2% to roughly $2.08 on Monday, which helped the token cover some ground after early-December weakness.

The year has seen bigger swings: XRP peaked near $3.65 in July before giving back some gains. Activity in regulated derivatives has also grown.

Reports point to XRP futures on the CME reaching a record open interest of roughly $3 billion in late October 2025, a figure that market watchers say reflects rising institutional appetite for regulated exposure.

A Past Claim That No Longer Holds

Arrington has previously highlighted XRP’s strong performance. In March, he tweeted that XRP had been the best-performing major asset across multiple time frames — 90 days, 180 days, one year and three years.

That claim no longer lines up with current rankings. Performance metrics have shifted since then, and the statement has been overtaken by later results.

Featured image from Bitpanda Blog, chart from TradingView

Bitcoin Bottom Forecast: Top Expert Predicts $40,000 Target Next Year, Here’s The Analysis

Bitcoin (BTC) has been struggling to regain momentum in the market, failing to surpass its nearest resistance level of $94,000 for over a month. The cryptocurrency is currently trading within a broad range between $85,000 and $93,000, leading to growing concerns about further price corrections in the upcoming months.

Amid this uncertainty, market expert NoLimit recently expressed on social media platform X (formerly Twitter) that he anticipates Bitcoin could bottom out at around $40,000 sometime in 2026. This forecast implies a significant 54% decline from current levels, which are just above $87,860.

A Historical Perspective On Market Cycles

NoLimit’s analysis outlines several reasons for this predicted downturn. He points out that Bitcoin has a historical tendency to surprise investors, often when confidence in the market is high. While each price cycle may appear unique on the surface, NoLimit argues that the underlying mechanics remain largely unchanged.

He emphasizes the cyclical nature of Bitcoin, noting that it moves within a four-year cycle influenced by liquidity, leverage, and human behavior rather than mere sentiment. 

According to him, the market is currently late in this cycle, and Bitcoin has consistently followed a three-step process during past upward movements.

First, Bitcoin tends to surge in price following the Halving event. This is typically followed by an influx of maximum leverage and late-stage buyers. Finally, the cycle concludes with a sharp and often chaotic reset before the next significant price expansion occurs.

Historically, Bitcoin has experienced steep declines during these resets, such as an approximate 85% drop in 2013-2014, an 84% drop in 2017-2018, and a 77% drop during the 2021-2022 cycle. In each scenario, investors were convinced that the conditions were different, yet the outcomes remained consistent.

$40,000 As Foundation For Bitcoin’s Next Bull Run 

Considering the current market situation, NoLimit highlights several critical indicators. He notes that Bitcoin has already seen substantial price appreciation, with institutional interest and exchange-trade fund (ETF) approvals now part of the landscape. 

He also observes that many traders are over-leveraged, market volatility is compressed, and there exists widespread hope for further price increases. These factors often signal a heightened risk of downside movement in the market.

A potential drop toward the $40,000 range should not be viewed as an unforeseen disaster, according to NoLimit. He argues that significant price declines have historically preceded major upward movements. 

Additionally, this price target aligns well with several technical indicators, including previous resistance levels that have turned into support, long-term moving averages, and the liquidity gap created by ETF approvals. 

Such factors suggest that a move toward this region could exhaust forced sellers and provide a solid foundation for recovery.

Bitcoin

Featured image from DALL-E, chart from TradingView.com 

Bitcoin Could Break Records Again In 6 Months, Grayscale Says

According to a Grayscale outlook released Monday, the asset manager expects rising demand for alternatives and clearer rules in the US to push Bitcoin to a new all-time high in the first half of 2026.

The report lays out 10 key investing themes for 2026 and ties the Bitcoin call to two main forces: growing portfolio demand for stores of value and what Grayscale describes as improving regulatory clarity.

Spot-Bitcoin ETPs reached the market in 2024, the firm notes, and Congress passed the GENIUS Act in 2025, steps that the report says reduce barriers for big investors.

Macro Risks And Demand For Crypto

Grayscale frames its outlook around a simple macro point. Rising public debt and the risk that fiat currencies lose buying power are pushing some money toward Bitcoin and Ether, the report says.

That argument will sound familiar to many institutional buyers. It is also a broad claim. No exact price targets were offered for Bitcoin, only a view that valuations will climb in 2026 and that the so-called four-year cycle may be ending.

Stablecoins are another major theme. Grayscale expects stablecoin use to grow: cross-border payments, collateral on derivatives, even use on corporate balance sheets are all mentioned as likely developments.

Asset Tokenization And DeFi Growth

Reports have disclosed that Grayscale sees asset tokenization reaching an inflection point next year. Lending protocols and staking are singled out as areas where activity could expand.

The firm foresees practical outcomes: stablecoins in payment rails, more institutional access to staking, and tokenized assets showing up in trading and custody systems.

Grayscale also flags two narratives it does not expect to move markets in 2026 — quantum computing risk for crypto and digital asset treasuries — saying research will continue but valuations are unlikely to be affected this soon.

Over the past 3 months, the average return across nearly all crypto sectors has underperformed Bitcoin. This persistent relative weakness highlights a market environment where capital concentration favours BTC.

📊 https://t.co/rFisuVfSY7 https://t.co/lpXqEe9bbW pic.twitter.com/WNtKEKclX7

— glassnode (@glassnode) December 16, 2025

Onchain Data Suggests Quiet Caution

Meanwhile, data from onchain analytics group Glassnode was also cited in this context. Over the last three months, Glassnode reports, the average return across most crypto sectors has underperformed Bitcoin, indicating capital concentration in BTC.

That has not translated into strong faith in leadership. A separate institutional feed, Bitcoin Vector, said dominance fell in the second half of the year, with ETH rotations cutting into BTC’s lead and a weaker rebuild after deleveraging events. In short: funds appear to prefer holding Bitcoin, but are not placing big new bets.

Featured image from YourStory, chart from TradingView

XRP Liquidity Dries Up: Futures Buy Volume On Binance Falls from $5.8B to $250M

XRP has slipped below the $2 level, a psychologically important threshold, as broader market conditions continue to deteriorate and selling pressure weighs on risk assets. While Bitcoin dominates liquidity and investor attention, altcoins are struggling to attract sustained demand, and XRP is increasingly reflecting this imbalance.

According to a CryptoQuant report by Darkfost, the weakness in XRP is not an isolated event but part of a broader contraction across the altcoin market. Whether on spot markets or in derivatives, trading activity has been shrinking significantly over recent months. Liquidity is gradually drying up, signaling a clear retreat from speculative positioning as investors reduce exposure to higher-risk assets.

This trend is especially visible in XRP’s derivatives data. The Taker Buy Volume on Binance, which tracks aggressive buy orders in futures markets, has collapsed to its lowest levels of the year. After peaking above $5.8 billion in July, this metric has fallen to roughly $250 million, representing a sharp 95.7% decline.

XRP Ledger Taker Buy Volume on Binance | Source: CryptoQuant

Such a dramatic contraction highlights the near-total evaporation of buying pressure and underscores the lack of conviction among traders.

XRP Liquidity Compression Signals Downside Risk

According to Darkfost, the broader market context is a major factor amplifying XRP’s current weakness. Liquidations have been accumulating across crypto markets, confidence remains fragile, and many participants are still psychologically impacted by the October 10 event. This lingering stress has reduced risk tolerance, particularly among short-term traders who typically provide liquidity during corrective phases.

Beyond sentiment, altcoins are facing a clear structural headwind. Bitcoin continues to absorb the majority of available capital, both in spot and derivatives markets. As BTC dominance remains elevated, liquidity that would normally rotate into altcoins during recoveries is instead staying concentrated in Bitcoin. This leaves very limited room for a sustained rebound across the broader altcoin market, including XRP.

Within this environment, the sharp collapse in XRP’s Taker Buy Volume is not surprising. The signal becomes even more relevant given that it is unfolding on Binance, which still accounts for the largest share of global XRP trading activity. A sustained drop in aggressive buying on the dominant exchange highlights the depth of demand erosion.

At the same time, the Taker Buy Sell Ratio has remained negative for most of the period, confirming that sellers continue to dominate XRP’s derivatives market. Historically, such severe volume compression can precede volatility expansions.

XRP Ledger Taker Buy Sell Ratio on Binance | Source: CryptoQuant

However, in the current setup, the lack of meaningful buying pressure and persistent bearish positioning suggests downside risks remain elevated. Even ETF-related optimism has failed to offset these structural weaknesses.

XRP Price Struggles Below Key Moving Averages

XRP price action on the 3-day chart reflects a clear loss of bullish structure and growing downside pressure. After peaking above the $3.40–$3.60 zone earlier in the year, XRP has formed a sequence of lower highs and lower lows, confirming a medium-term downtrend. The recent breakdown below the psychological $2.00 level is particularly significant, as this zone previously acted as both support and consolidation.

XRP testing key demand level | Source: XRPUSDT chart on TradingView

From a technical perspective, XRP is now trading below its 50-day and 100-day moving averages, both of which have started to slope downward. This alignment reinforces bearish momentum and suggests that rallies are being sold rather than accumulated. The 200-day moving average, currently near the $1.70–$1.80 area, represents the next major structural support. A sustained move toward this level would not be surprising if selling pressure persists.

Volume dynamics further confirm weakness. Since the August high, volume has steadily declined, indicating fading participation and weak dip-buying interest. The sharp volatility spike in October was followed by distribution rather than continuation, often a sign of a local market top.

As long as XRP remains below $2.00 and fails to reclaim the declining moving averages, the path of least resistance remains to the downside. For any meaningful trend reversal, XRP would need to regain $2.30–$2.50 with expanding volume, signaling renewed demand rather than short-term relief rallies.

Featured image from ChatGPT, chart from TradingView.com

XRP Falls Below $2 As $721 Million Profit-Take Hits Market

One of the cleaner tells in crypto is when the old supply decides it’s time. Not “made a quick 20% and clipped it” time — years old.

That’s basically what Glassnode researcher CryptoVizArt flagged after an XRP wallet aged roughly 5–7 years (with a cost basis around $0.40) realized more than $721.5 million in profit on Dec. 11.

A single wallet doesn’t “break” a market on its own. But the timing is the point: this wasn’t profit-taking into a rip. It landed while XRP was showing weakness right at the $2.0 key level.

CryptoVizArt wrote via X: “On December 11th, a 5-7 year old XRP wallet address (with a cost basis of $0.4) realized over $721.5M in profit! A rare sizable profit-taking while the price shows weakness right at the $2.0 key level.”

XRP Realized Profit by Age

What This Means For XRP Price

That $2 handle matters for the usual reasons — round number, obvious chart magnet, psychological line in the sand — but also because the market’s been treating it like a live wire lately. Since early December last year, the support zone between $2 and $1.90 has been tested endless times. XRP bulls always managed to close above the zone on the weekly timeframe.

So what does the $721M print mean? It’s a reminder that supply overhang isn’t theoretical. A 5–7 year wallet taking profits can be read as “de-risking,” sure. But in tape terms, it’s also distribution that the market has to absorb while price is already leaning. If bids are deep, it’s a shrug. If bids are thin, it turns $2 into a trapdoor. And right now, “thin” is kind of the vibe across crypto, not just XRP.

CryptoVizArt’s broader framing from Dec. 13 is that the $80K–$90K Bitcoin consolidation is producing stress “comparable to late Jan 2022.” Via X, he wrote: “The current $80K–$90K consolidation range is generating a magnitude of stress comparable to late January 2022, with Relative Unrealized Loss approaching ~10% of market cap. This places the market in a regime where liquidity is constrained, and sensitivity to macro shocks is elevated, yet still below the levels typically associated with full bear-market capitulation.”

That backdrop matters because alts don’t trade in a vacuum. When the whole complex is jumpy, big sell events at key levels have more punch. Not because every XRP holder suddenly panics, but because market-makers and discretionary traders tend to pull risk at the same time. Spreads widen, depth thins, and “one-off” flows start to move price more than they should.

Still, it cuts both ways. A single, chunky realization can also be the market clearing a problem — old supply exiting, new demand stepping in, the kind of transfer that (eventually) makes a base sturdier. The trick is whether $2 holds while that handoff happens.

At press time, XRP was trading at $1.89, which could make Sunday’s weekly close another extremely important event.

XRP price

Who Really Sold The Dip? On-Chain Data Exposes Bitcoin’s True Sellers

Bitcoin has retraced to the $85,000 level, a critical support zone that bulls must defend to prevent a deeper breakdown. After failing to reclaim higher levels, price action has slowed and volatility has compressed, reinforcing a market environment dominated by apathy and fear.

Sentiment across the crypto space has deteriorated sharply, with a growing number of analysts openly discussing the possibility of a prolonged bear market extending into next year. In this context, understanding who is actually selling becomes far more important than the price move itself.

According to a recent CryptoQuant report, Bitcoin’s pullback from the ~$88.2K region toward ~$85K provides a clean on-chain read of market behavior beneath the surface. Exchange inflow data segmented by Short-Term Holders (STH) and Long-Term Holders (LTH) shows that the decline was not driven by structural distribution from long-term investors.

Historically, bear markets accelerate when long-term holders begin distributing supply. The absence of that behavior suggests the current drawdown reflects positioning adjustments and risk reduction rather than a collapse in long-term conviction. As Bitcoin tests $85K, the market is not only evaluating price support levels.

Short-Term Profit-Taking, Not Structural Distribution

The CryptoQuant report by Crazzyblockk provides a precise breakdown of who actually drove Bitcoin’s recent pullback. On December 15, when BTC traded near the $88.2K level, Short-Term Holders sent approximately 24.7K BTC to exchanges.

Crucially, 86.8% of this supply was realized in profit, while only 13.2% was sold at a loss. In dollar terms, profitable STH inflows exceeded $1.89 billion, vastly outweighing loss-driven selling. This profile clearly indicates that sellers were primarily near-term buyers exiting from strength, rather than panicked participants capitulating under stress.

Bitcoin Long-Term holder P/L Inflow Volume | Source: CryptoQuant

As the price moved lower on December 16 toward the $86K area, total STH inflows dropped sharply to just 3.9K BTC. Although this smaller flow was realized at a loss, its limited size signals exhaustion rather than an acceleration of selling pressure. While the percentage of loss realization increased, the absolute volume did not—an important nuance often overlooked in surface-level market analysis.

Long-Term Holder behavior reinforces this constructive interpretation. Across both days, LTH inflows remained muted, falling from roughly 326 BTC to just 50 BTC. There is no sign of capitulation or meaningful distribution from this cohort. Overall, the data shows a market cooling through short-term profit-taking, not breaking through structural sell pressure.

Bitcoin Weekly Price Structure and Key Support Dynamics

Bitcoin has retraced sharply from its cycle highs and is now consolidating around the $85K–$88K zone. This area is technically significant. Price is currently interacting with the rising 100-week moving average, which has acted as dynamic support throughout the broader uptrend since 2023. So far, buyers are attempting to defend this level, preventing a deeper weekly close below it.

BTC consolidates around key support level | Source: BTCUSDT chart on TradingView

Structurally, the market has shifted from strong impulsive expansion into a corrective phase. The loss of the 50-week moving average earlier in the pullback signaled a transition from momentum-driven price discovery to consolidation and mean reversion. However, the longer-term trend remains intact as long as Bitcoin holds above the 200-week moving average, currently well below the price.

Volume has declined during the retracement, suggesting that selling pressure is not accelerating aggressively. This supports the view that the move is corrective rather than distributive. From a risk perspective, failure to hold the $85K region would open the door to a deeper retrace toward the low-$70K range.

Conversely, reclaiming the $90K–$92K zone would be required to restore bullish structure and momentum on the weekly timeframe.

Featured image from ChatGPT, chart from TradingView.com

Bitcoin Under Pressure As Yen Carry Trade Unwind Hits Global Markets

The yen carry trade unwind has been hovering over markets lately — the kind of “plumbing” story that most people ignore right up until volatility spikes and everything suddenly feels connected. Graham Stephan put it into a Bitcoin and crypto-friendly frame yesterday.

In a Dec. 15 post, the popular YouTuber described the yen carry trade as Wall Street’s long-running “infinite money glitch” — and argued it’s breaking down just as the Fed is signaling a shift in its outlook for next year. “Wall Street found an ‘infinite money’ glitch 20 years ago. They called it the Yen Carry Trade. It just broke, right when the Fed announced its plans for next year,” Stephan wrote.

What The Yen Carry Trade Unwind Means For Bitcoin

He presented it as a straightforward trade that scaled because the size was big enough to matter. “For decades, the ‘Yen Carry Trade’ has been the secret engine behind global liquidity. The mechanics were simple enough that a child could understand them, but profitable enough to move trillions of dollars.”

Stephan then laid out the basic steps in plain English: borrow cheaply in Japan, rotate into higher-yield US assets, keep the spread. “Borrow Cheap: Investors borrowed money in Japan, where interest rates were effectively 0%… Invest Abroad: They took that ‘free money’ and bought US Treasuries paying 4-5%… Profit: They pocketed the difference without using any of their own money.”

His argument is that the setup turns toxic when the rate differential compresses and the currency leg moves the wrong way. He framed the timing as especially awkward for risk assets: Japan tightening to support the yen while the Fed eases. “Japan is finally raising rates to save its own currency right at the time when the Fed has started slashing rates. The gap between the rates is getting squeezed. The ‘free money’ isn’t free anymore.”

From there, he leaned into the mechanical consequence: when funding gets more expensive and the currency shifts, leveraged positions don’t get a long debate window — they get cut. “As Japanese rates rise, that trade flips. Investors are now being forced to sell their US assets to pay back their Yen loans. Instead of money flowing into the US markets, it is being sucked out to pay debts in Tokyo. This is a massive liquidity drain happening right under our noses.”

That’s also where his Bitcoin read comes in. Not “Bitcoin is broken,” but that Bitcoin is where risk appetite and leverage tend to show up early — and where forced selling can look brutal when it hits.

Stephan expanded on the same theme in a Substack post, pulling the Fed into the timeline more directly and warning readers to brace for turbulence. “You better get ready for a bumpy ride,” he wrote, claiming the Fed cut rates “for the third time this year,” and that the central bank “has officially ended ‘Quantitative Tightening’ and is quietly moving back toward printing money.”

He added a “pilot flying blind” angle as well, arguing the Fed cut “without any inflation data whatsoever” due to shutdown-related disruptions. He attached a specific interpretation of balance-sheet policy, too: “Finally, the most important news of the day: Quantitative Tightening (QT) is over… They even announced they will buy $40 billion of Treasuries over the next 30 days. The tightening era is dead. The ‘stimulus’ era is now being rebooted, and the money printer is being turned on.”

Taken together, his thesis ends up with Bitcoin sitting between two forces that don’t necessarily move on the same clock: a potentially sharp deleveraging impulse from carry unwinds, and a slower easing impulse if policy conditions loosen. One can hit price violently in a short window; the other can take time to express itself cleanly.

Stephan closed with a familiar Bitcoin-with-training-wheels framing: volatility is normal, drawdowns happen, and mining economics create a reference point. “Bitcoin isn’t broken. It’s just volatile, and this isn’t the first time this is happening. Statistically, Bitcoin has seen drastic crashes of 50% or more, but it has never dropped below its “electrical cost” (the cost to mine one coin), which sits around $71,000 today. If we get close to that number, history suggests it’s a strong buy zone,” he concluded.

At press time, BTC traded at $87,082.

Bitcoin price

XRP Price Is Not Going To $100 By End Of Year, ‘You Need A Reality Check’

Despite the recent crash that saw the XRP price fall below $2, many analysts claim that the cryptocurrency could still skyrocket to $100 by the end of the year. However, one expert has thoroughly dismissed these projections, urging investors to temper expectations and warning that those who believe such predictions need a “reality check.”

Why XRP Can Never Reach $100 By Year’s End

Crypto market expert Zach Humphries has delivered a detailed assessment of XRP, calling out extreme price predictions and overly optimistic expectations, especially during the current downtrend. In a video on X, he warns that claims suggesting XRP will reach $100 by the end of 2025 are unrealistic and potentially misleading for investors and traders. 

Humphries emphasized that while he supports XRP and believes in its long-term potential, the spread of exaggerated price targets in the crypto space is harmful. He explained that many investors assume that owning 100 XRP tokens will make them wealthy quickly, holding on to false hope and unrealistic financial expectations.

The analyst points out the need for realism in the crypto space, arguing that viral hype posts and overinflated price forecasts can hoodwink people into making genuine financial decisions that could lead to losses. He noted that investors need to understand market structure and the underlying math behind XRP’s price action before believing in any extreme predictions. 

Humphries stated a $100 XRP price would imply a $5 trillion market capitalization, surpassing the size of Apple, Microsoft, and even the entire crypto market at some historical peaks. He noted that reaching this seemingly impractical price target would require XRP achieving overnight global adoption, full-scale replacement of existing payment rails, and massive sustained institutional inflows.

The analyst also highlighted a common misunderstanding about liquidity. Humphries explained that for XRP to reach $100, it would require substantial global liquidity. He noted that despite XRP Spot ETFs recording over $1 billion in inflows recently, the cryptocurrency’s price did not rise; instead, it declined further. He highlighted that this is because institutional investors prioritize stability, deep liquidity, and predictability over volatile, high-risk payment assets. 

Although his statements may seem like a critique of XRP’s outlook, Humphries emphasized that the cryptocurrency has genuine strengths, including robust cross-border payment capabilities, strong enterprise relationships, and liquidity. He pointed out that, ironically, the more XRP succeeds as a payment rail, the less explosive its price becomes. 

Analyst Says XRP Could Still Outperform Many Assets

In his video, Humphries stated that XRP has survived many market cycles, making it one of the rare resilient cryptocurrencies. Under the right conditions, he believes that the XRP price could outperform many digital assets, which is why it remains a top altcoin in his portfolio. 

The analyst emphasized the importance of realistic growth driven by gradual institutional adoption, ETF integration, regulatory clarity, and steady price increases tied to actual usage and utility. He highlighted that these factors could help XRP perform very well, potentially reaching new all-time highs.

XRP

Shiba Inu Scores US Regulated Derivatives Entry Via Coinbase

According to reports, Coinbase has launched regulated futures linked to Shiba Inu, opening the token to trading on a US derivatives venue.

The new products include perpetual-style contracts and monthly futures tied to what Coinbase calls the 1k SHIB index (a 1,000 token index), with trading scheduled to run 24/7.

The rollout began on December 5, 2025, as part of a broader push by the exchange to add altcoin derivative listings under US rules.

Regulated Futures Hit The Market

Reports have disclosed that the perpetual contracts operate like offshore swaps in form but are offered through Coinbase’s regulated platform and are designed to include a funding-rate mechanism to keep prices close to spot.

Now live: Trade US Perpetual-Style Futures for all altcoins on Coinbase Derivatives, available 24/7.

→ Shiba Inu $SHIB → Avalanche $AVAX → Bitcoin Cash $BCH → Cardano $ADA → Chainlink $LINK → Dogecoin $DOGE → Hedera $HBAR → Litecoin $LTC → Polkadot $DOT → SUI $SUI →… pic.twitter.com/yjS2XsQ2jN

— Coinbase Markets 🛡 (@CoinbaseMarkets) December 15, 2025

Monthly contracts were made available as an initial phase. Clearing and settlement are handled inside systems compatible with US oversight, and the products are described as compliant with Commodity Futures Trading Commission frameworks.

What Traders And Institutions Might Do

Market participants say having regulated futures can change who trades a token. Institutional desks and some large funds often need regulated venues and clearer custody paths before they increase exposure.

Added liquidity and round-the-clock pricing may attract more active traders, and that could raise volume. At the same time, access to futures also makes it easier to bet against the token, which can push volatility up. Reports note that immediate moves in spot markets have been mixed, showing that access to derivatives does not automatically lift the token’s price.

Because SHIB has regulated futures on Coinbase (“1k Shib Index”), it qualifies for spot ETF consideration under the same SEC pathway Bitcoin and Ethereum followed.

The big picture for SHIB

•SHIB now joins the “ETF-watchlist club” with other futures-backed cryptos. •If/when… pic.twitter.com/cZPxUWWhBn

— 𝐋𝐔𝐂𝐈𝐄 (@LucieSHIB) September 18, 2025

Market Context And Exchange Strategy

Coinbase’s decision follows steps the exchange has taken to grow its derivatives arm. Company filings and public letters in 2025 framed derivatives growth as a strategic priority, and the firm has pursued deals and product launches to expand those capabilities.

One notable deal disclosed earlier involved an agreement valued at close to $3 billion to strengthen derivatives know-how and infrastructure. This background helps explain why Coinbase is offering altcoin futures that trade continuously, under a regulated roof.

Featured image from Gemini, chart from TradingView

ADA Enters Critical Phase as Cardano Price Slips Back to Multi-Year Support Levels

Cardano’s ADA token has returned to a familiar but uncomfortable zone. After months of lower highs and failed recovery attempts, the price has slid back toward long-term support levels that have defined its structure for more than two years.

The move comes amid a broader market pullback, as risk appetite weakens across equities and crypto, but ADA’s decline is also being shaped by internal technical signals that traders are finding hard to ignore.

ADA currently trades near $0.38–$0.39, down approximately 5.57% over the past 24 hours. That drop places the token close to a multi-year ascending support trend line that has held for nearly 900 days.

Cardano ADA ADAUSD ADAUSD_2025-12-16_11-14-12

Derivatives and Positioning Point to Caution

Market data indicate that traders are stepping back rather than leaning into the decline. Futures open interest in ADA has decreased by approximately 11% to around $670 million, indicating that positions are being closed rather than expanded.

Funding rates have also softened, with more than 55% of tracked positions now skewed to the short side. Together, these metrics point to reduced confidence in a near-term rebound and a market that is positioning defensively.

This caution is not isolated to Cardano. Altcoins across the board have come under pressure as investors adopt a risk-off stance ahead of key U.S. macroeconomic data, including inflation and labor reports, and as concerns surrounding the AI sector spill over into correlated assets like cryptocurrency.

Technical Structure Near a Breaking Point

On the charts, ADA’s structure remains fragile. The token recently lost the $0.53 horizontal support, confirming a bearish shift on higher timeframes.

Momentum indicators reflect that change. The RSI is below 50, and the MACD remains in a negative position. Recent price action looks corrective rather than impulsive, suggesting the latest bounce may already have run its course.

ADA is still hovering near its long-term diagonal support, but a clean breakdown would likely alter the outlook materially. Some analysts warn that, if this trend line fails, the price could retrace much deeper, potentially toward levels last seen during the previous bear market.

Long-Term Targets Contrast With Short-Term Risk

Despite the weak near-term picture, longer-term projections remain divided. One technical analyst has argued that ADA’s current consolidation resembles a prolonged corrective phase similar to the setup seen before its 2020 breakout, outlining upside targets ranging from the $5 area to above $10 in a full bull scenario.

However, those views hinge on the market first stabilizing and reclaiming key resistance zones. For now, ADA’s focus is simpler. The token is at a critical phase, with long-term support under pressure and sentiment cautious. Whether this level marks a base or a breakdown will likely shape Cardano’s trajectory into 2026.

Cover image from ChatGPT, ADAUSD chart from Tradingview

❌