Reading view

There are new articles available, click to refresh the page.

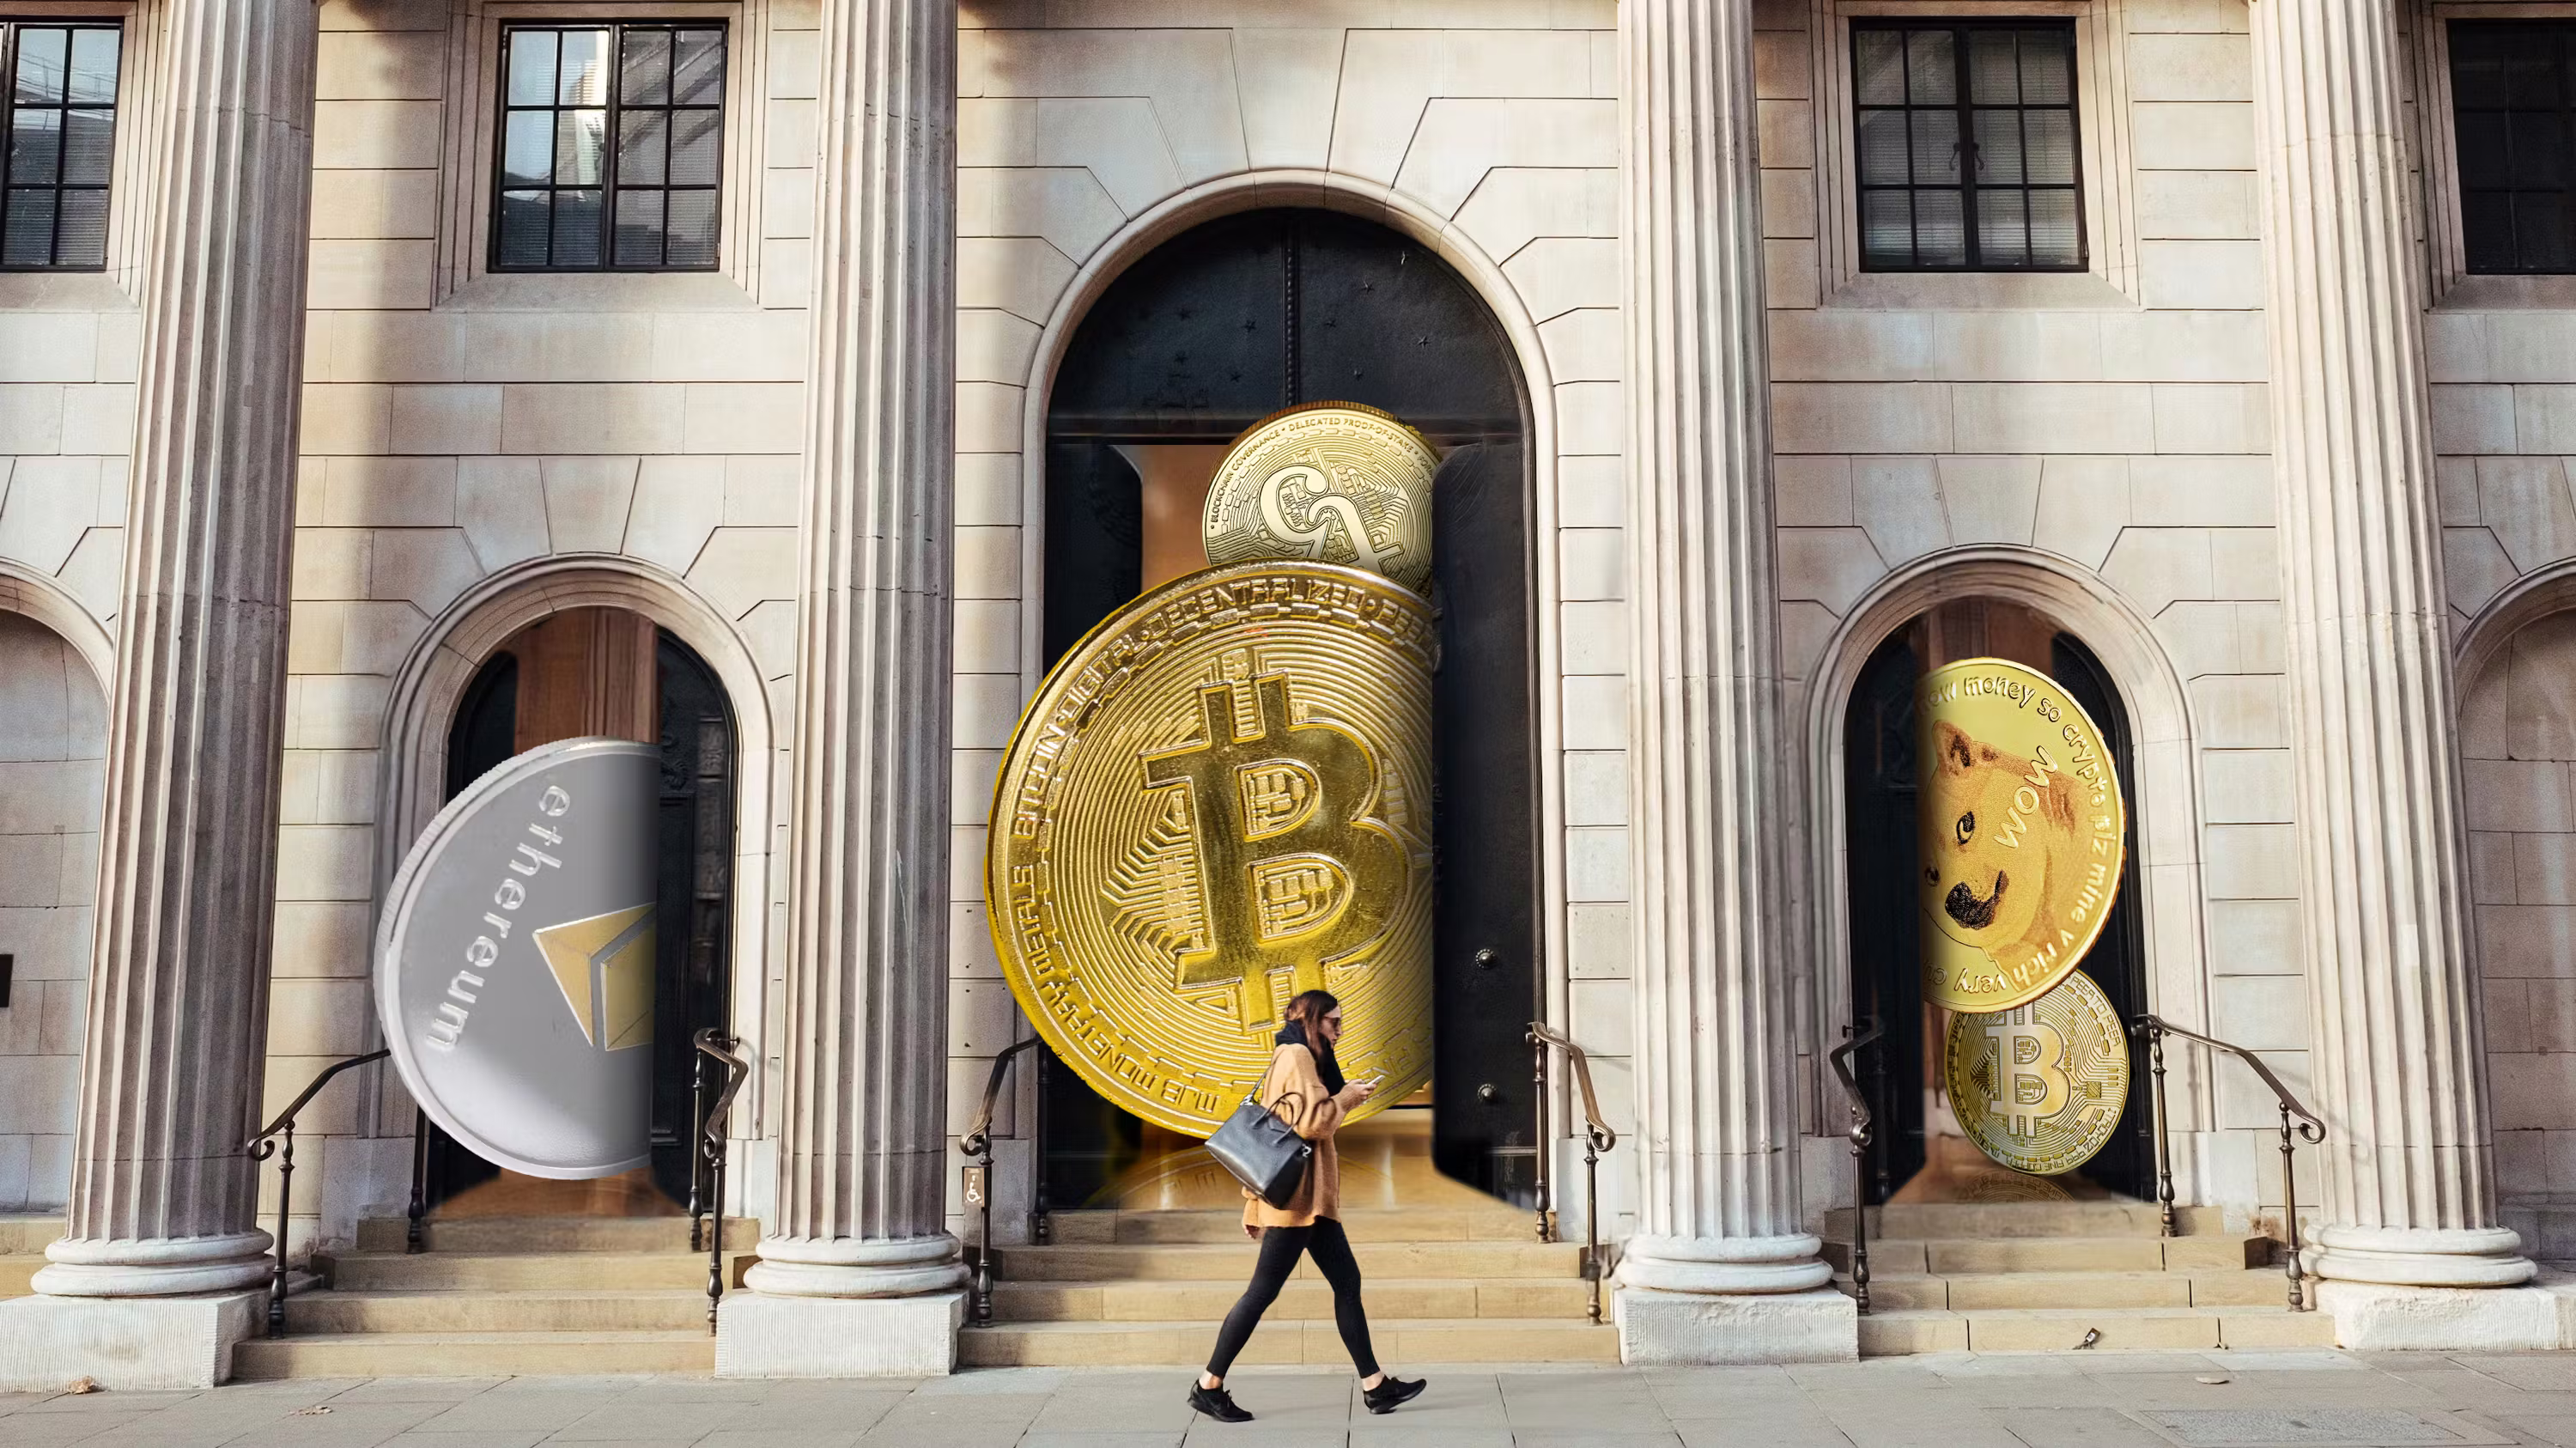
America’s Largest Banks Quietly Embrace Bitcoin Loans, Saylor Says

Michael Saylor, executive chairman of Strategy, told attendees at Binance Blockchain Week that the wall of skepticism inside big banks is breaking down faster than he once expected.

He said he had thought it might take four to eight years for major financial firms to move fully into Bitcoin. Now, he says, that timeline is compressing and the shift is visible right away.

Banking Giants Reverse Course

According to Saylor, the past 12 months have seen heavy hitters — including Citibank, BNY, Bank of America, PNC, JPMorgan, Wells Fargo and Vanguard — shift from hostility to a more welcoming stance on crypto.

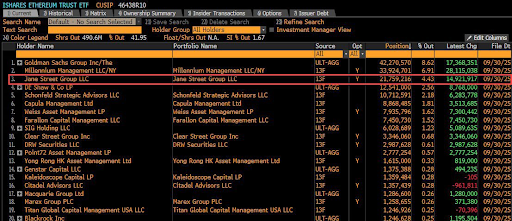
Reports have disclosed that Vanguard has enabled clients to trade ETF shares linked to XRP and Bitcoin through its platform. Saylor added that internal plans are in motion at several institutions to roll out custody services and credit lines tied to crypto holdings.

Loans Backed By Bitcoin

Based on Saylor’s remarks, Charles Schwab is preparing to offer Bitcoin custody and to extend credit against BTC as soon as next year, and Citibank is said to be moving in a similar direction.

He recalled earlier struggles to secure bank loans using Bitcoin as collateral and said lenders have flipped their approach within roughly six months.


According to him, eight of the top 10 US banks are now issuing credit backed by Bitcoin, a claim that highlights how quickly attitudes appear to be changing inside the industry.

Political Climate Could Be Speeding Things Up

Saylor pointed to policy shifts under US President Donald Trump as a factor that has encouraged banks to leave the sidelines.

Many firms were already experimenting with blockchain years ago — Goldman Sachs, for example, issued one of the first Bitcoin-backed loans in 2022 — but a friendlier regulatory tone, he said, has accelerated planning and product development.

Still, banks face legal, operational and risk hurdles before these services reach broad retail customers.

Markets Watching Fed Announcement

Meanwhile, traders and analysts are watching the Federal Open Market Committee. The Fed is expected to cut rates by 0.25%, bringing the target to 3.5%–3.75%, a move that often boosts risk assets like Bitcoin. Volatility is likely around the announcement, and some market players warn that early rallies can reverse quickly when the Fed provides forward guidance.
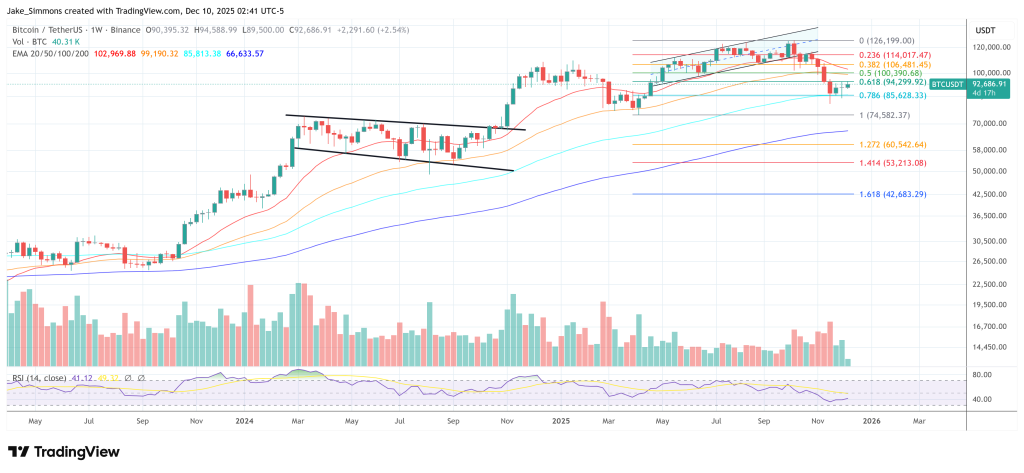
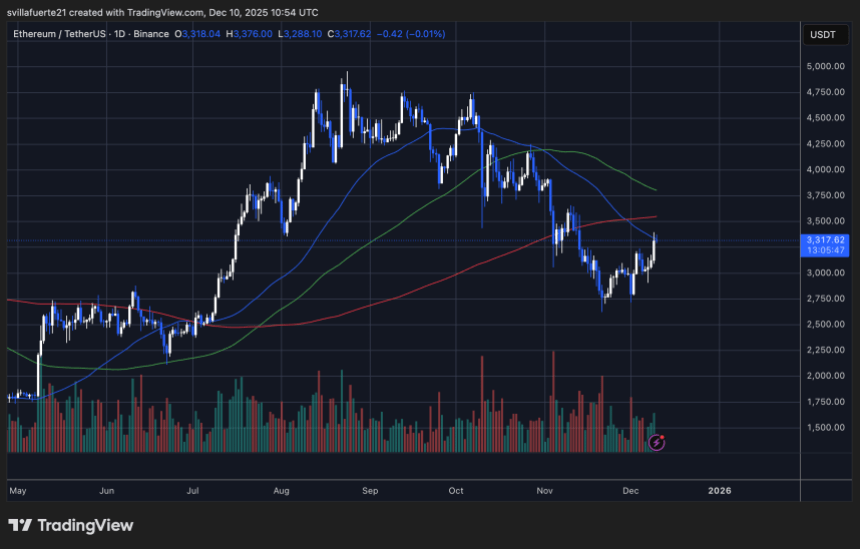
Technical Signals And Sentiment

Bitcoin’s own moves were discussed alongside the banking story. The crypto fear gauge hit 10 this week, signaling extreme fear, and price rebounded from $86,700 to roughly $92,300.

One analyst flagged resistance near $94,200 and suggested a clean breakout could open a path toward $103,000. Another observer noted Bitcoin has lagged the Nasdaq’s recovery, a divergence that could work in either direction if markets shift.

Featured image from The Information, chart from TradingView

Why Ethereum’s Rally Isn’t Overheated – And Where Demand Must Grow Next

Ethereum has pushed above the $3,350 level, injecting fresh momentum into the market after weeks of uncertainty. Yet despite this breakout, overall sentiment remains clouded by fear, with many analysts still warning that the broader structure points toward a developing bear market. Traders now find themselves at a pivotal juncture: is this the beginning of a sustained recovery, or merely a temporary rally before further downside?

According to a new CryptoQuant report, one of the most revealing indicators right now is Ethereum’s funding rate behavior across major exchanges. Unlike the explosive funding spikes seen during the two major rallies earlier this year, the current move shows a remarkably restrained funding environment. During those earlier surges, funding rates climbed aggressively into overheated territory, signaling euphoric long leverage and speculative excess — conditions that closely preceded short-term market tops.

This time, however, funding remains far more subdued. The absence of aggressive long positioning suggests that the current rally is not being driven by excessive leverage, which gives the move a different character compared to earlier spikes. Whether this signals healthier accumulation or simply a lack of conviction remains the core question as Ethereum approaches the next decisive phase.

Muted Funding Rates Highlight a Cautious But Potentially Constructive Rally

The CryptoQuant report highlights that, unlike previous explosive rallies, Ethereum’s current funding rates remain unusually low, even after its sharp recovery from the $2.8K region. This subdued funding environment signals that the derivatives market is not yet saturated with speculative long positions.

Buyers are stepping in, but modest leverage drives this move compared to past phases dominated by aggressive traders. Consequently, spot accumulation drives the current advance more than overheated futures activity.

Ethereum Funding Rates | Source: CryptoQuant

This difference carries important implications. Without a surge in speculative demand, Ethereum may struggle to ignite the kind of full bullish continuation leg seen in earlier breakout cycles. Historically, strong uptrends have required funding rates to expand meaningfully as traders chase price, forcing shorts to cover and fueling upward momentum. That behavior has not yet emerged in the current structure.

However, this muted landscape is not inherently bearish. Instead, it reflects a recovering market, not an overextended one. This leaves Ethereum with room to climb further — if demand strengthens. At the same time, the lack of leverage means the rally remains vulnerable; strong resistance rejections could quickly weaken momentum unless fresh buyers step in.

Testing Key Resistance as Momentum Builds

Ethereum’s daily chart shows a notable shift in momentum as the price pushes toward $3,320, extending its rebound from the sub-$2,800 lows. This recovery phase has been steady rather than explosive, reflecting a market that is stabilizing but still facing key overhead challenges.

ETH testing critical resistance level | Source: ETHUSDT chart on TradingView

The first major test is the 200-day moving average (red line), which ETH is now approaching after several weeks of trading below it. Historically, reclaiming this level has marked the transition from corrective phases into renewed bullish cycles, but a clean breakout is far from guaranteed.

The structure of the recent move highlights improving buyer confidence: ETH has formed a series of higher lows, indicating accumulation after the capitulation-like November drop. Although buyers are active, the relatively subdued volume profile suggests they lack broad-based conviction. A stronger influx of volume must flip the trend decisively bullish.

The 50-day and 100-day moving averages remain above the current price and are both aligned downward, reinforcing that ETH is still technically in a broader downtrend. For momentum to extend, Ethereum must break above the $3,350–$3,400 resistance zone, where prior support turned into resistance.

Featured image from ChatGPT, chart from TradingView.com

Market Stress Intensifies for Solana as Liquidity Drops to Cycle Lows and Volatility Builds

Solana’s (SOL) market structure is entering a tense phase, shaped by thinning liquidity, elevated leverage, and conflicting signals across institutional flows and derivatives markets.

Related Reading: The Current Bitcoin Price Pump Will End In A Crash – Here’s When To Start Selling

While price movements remain within familiar ranges, the underlying conditions paint a more complex picture, one that traders are watching closely for signs of either exhaustion or a sharp reversal.

Recent sessions have seen Solana drift between $128 and $145, with brief rebounds lifting it toward the upper end of this range. However, liquidity indicators suggest a deeper reset is taking shape. Analysts note that these conditions often precede turning points, though they can amplify volatility in the short term.

Solana SOL SOLUSD SOLUSD_2025-12-10_12-30-17

SOL Liquidity Drops to Bear-Market Levels

On-chain data shows Solana’s 30-day realized profit-to-loss ratio has stayed below 1 since mid-November. This pattern, more losses being realized than gains, typically marks a liquidity contraction similar to historical bear-market phases.

Analysts at Altcoin Vector describe the current setup as a “full liquidity reset,” a process that typically takes several weeks to resolve.

That backdrop aligns with observations from SynFutures, whose team cites realized losses, declining futures open interest, and fragmented liquidity pools as contributing factors.

Market-makers have also pulled back, thinning order books even as realized volatility increases. The effect is a market highly sensitive to sharp moves, particularly around key liquidation clusters.

A notable risk is emerging around the $129 level, where nearly $500 million in long positions would be liquidated if the price retests that zone. With $15.6 million in SOL contracts wiped out in the last 24 hours alone, the market remains vulnerable to cascades.

Similarly, exchange balances continue to drop, and spot ETFs have brought in more than $17 million this week, signaling accumulation despite broader stress.

Volatility Builds as Derivatives and Spot Activity Diverge

Derivatives data reflect a cautious but engaged trading environment. Open interest has climbed back above $7.2 billion, rising in tandem with a rebound in daily volume.

This type of build-up during a quiet price phase often signals positioning ahead of a larger move. Long-to-short ratios have shifted bullish in recent days, and funding rates remain positive, although traders are becoming increasingly sensitive to macroeconomic catalysts.

Spot markets tell a different story. Liquidity is thin, and deep-cycle reset metrics point to selling exhaustion rather than active expansion. This divergence, characterized by high derivative activity against weakening spot liquidity, typically precedes volatility spikes.

Key Solana Levels Ahead as Market Awaits a Cycle Turn

Technically, Solana remains stuck between established boundaries. The $145 resistance zone has capped multiple attempts to break higher, while support around $135 and deeper levels near $129 hold significance for traders monitoring liquidation risk.

Momentum indicators are stabilizing, and the MACD is edging toward a potential positive crossover. Analysts note that past liquidity resets have been followed by rapid upside moves once conditions improved; however, the timing remains uncertain.

Related Reading: NFT Slump Worsens With Monthly Sales Hitting Rock Bottom

Currently, Solana sits at the center of a tug-of-war between cautious sentiment, thinning liquidity, and steady institutional flows. Whether these opposing forces resolve into a recovery or further volatility may depend less on price action alone and more on how quickly liquidity returns to the ecosystem.

Cover image from ChatGPT, SOLUSD chart from Tradingview

Bitcoin Outlook Post Fed’s 0.25% Rate Cut: Historical Patterns And Predictions

In a move that could signal a bullish shift for Bitcoin (BTC) and the broader cryptocurrency market, the Federal Reserve (Fed) announced a 25 basis points (bps) interest rate cut, bringing the new rate range to 3.5% to 3.75%. 

Bitcoin Poised To Surge Toward $100,000?

Kevin Hassett, the White House economic adviser and a leading candidate to become the next Fed chair, commented to the Wall Street Journal CEO Council that there is “plenty of room” for additional interest rate cuts. 

He stated, “If the data suggests that we could do it, then — like right now, I think there’s plenty of room to do it.” Hassett, who is President Donald Trump’s preferred choice for the Fed chair position after Jerome Powell’s tenure concludes, has been critical of Powell for being “too late” in lowering rates.

While the last rate cut in October had minimal impact on the Bitcoin price, analyst Michael van de Poppe believes that the current rate cut could significantly benefit the cryptocurrency. He characterized it as a “great move” for Bitcoin and noted that a breakout above $92,000 might be indicative of future bullish momentum. 

Van de Poppe expressed optimism about Bitcoin’s ability to maintain the support level between $91,500 and $92,000, suggesting that if it does, there could be a pathway for Bitcoin to approach the $100,000 mark.

Can BTC Avoid Historical 10% Decline?

Market expert Ash Crypto pointed out that historically, each of the last four times the Fed slashed rates by 25 bps, Bitcoin experienced a 5% to 10% decline shortly thereafter. Despite this pattern, Ash noted that the current market setup differs from previous scenarios, suggesting that different dynamics could be at play.

Several positive factors underpinning this optimism include the conclusion of quantitative tightening (QT) after a three-year period. Should Powell hint at the possibility of quantitative easing (QE) in his forthcoming remarks, it could spur a further bullish trend in the market. 

Additionally, with this being the third rate cut, Ash asserted that there is potential for increased liquidity to flow back into the markets, which historically benefits risk assets like Bitcoin.

Bitcoin

Featured image from DALL-E, chart from TradingView.com 

Why Is The Bitcoin Price Down Again? Analyst Calls Out Trading Desk For Triggering Crashes

Crypto analyst Bull Theory has explained why the Bitcoin price has been crashing recently. The analyst pointed out that Wall Street traders were responsible for the price declines, indicating that these trading desks were manipulating the market for their own benefit.  

Analyst Explains Why The Bitcoin Price Is Crashing

In an X post, Bull Theory blamed Jane Street for the Bitcoin price’s constant crash at 10 a.m. ET when the U.S. market opens. The analyst pointed out that BTC erased 16 hours of gains in just 20 minutes after the U.S. market opened. This has notably been happening since early November, when the flagship crypto fell below $100,000. Meanwhile, a similar price action also played out in the second and third quarters of this year. 

Bull Theory noted that another analyst, Zerohedge, has claimed that Jane Street is most likely the entity responsible for this Bitcoin price crash. The analyst stated that the chart shows a pattern that is too consistent to ignore, with a clean wipeout within an hour of the market opening, followed by a slow recovery. He added that this is classic high-frequency execution and that it fits Jane Street’s profile. 

Bitcoin

Bull Theory stated that Jane Street is one of the largest high-frequency trading firms in the world and that they have the speed and liquidity to move markets for a few minutes. The analyst claimed that their behavior is simple: dump BTC at the market open, push the Bitcoin price into liquidity pockets, and then re-enter at a lower price. 

By doing this, the analyst claimed that Jane Street has accumulated billions in BTC. The trading firm is said to hold $2.5 billion worth of BlackRock’s Bitcoin ETF, which is its 5th-largest position. Bull Theory added that this means most of the dump in the Bitcoin price isn’t due to macro weakness but manipulation by this entity. He expects that BTC will continue its upward momentum once these big players are done buying. 

Bitcoin At Risk Of A Decline Post-FOMC

Crypto analyst Ali Martinez indicated that the Bitcoin price was at risk of a significant decline following today’s FOMC meeting. He pointed out that BTC has consistently reacted negatively to FOMC meetings, with six out of seven meetings this year leading to corrections for the flagship crypto. 

The Bitcoin price had rallied to as high as $94,500 yesterday in anticipation of a third rate cut this year from the Fed. According to CME FedWatch, there is currently a 90% chance that the Fed will lower rates by 25 basis points (bps). A CryptoQuant report noted how these rate cuts have turned out to be a ‘sell the news’ event on the two occasions the Fed lowered rates this year, with the probability of this price action playing out again. 

At the time of writing, the Bitcoin price is trading at around $92,600, down in the last 24 hours, according to data from CoinMarketCap.

Bitcoin

Bitcoin’s Market Structure Strengthens Despite Slower Trading Activity — Here’s Why

Despite a noticeable cooldown in trading volumes, Bitcoin’s underlying market structure has continued to strengthen. The price action has stabilized within a narrow range as long-term holders maintain firm conviction. As more BTC flows into cold storage and supply on exchanges tightens, the market is transitioning from hype-driven swings to steady structural support.

How The Price Compression Builds Energy For A Larger Move

CIO and founder of MNFund and MNCapital, CryptoMichNL, emphasized that Bitcoin shares a strong correlation with the Nasdaq. While Nasdaq continues to show steady resilience, BTC has stalled behind. This mismatch creates a mispricing and market divergence, which is why the path toward $100,000 remains wide open and why the 4-year cycle thesis doesn’t hold up.

Recently, BTC saw a massive correction, dropping from $115,000 to $80,000 in just two weeks. During that same liquidation period, what LVisserLabs calls the rotation between Pure Vol vs. Pure Profitability or Beta vs. Quality has fallen sharply. Beta here refers to high-volatility, high-beta stocks, which are essentially tech stocks that drive the markets. Meanwhile, Quality means more risk-off assets, including high-quality, profitable, and stable companies. 

Bitcoin

Currently, BTC has stalled after the sell-off, and the Beta assets have recovered substantially, implying that the stocks have inverted their loss with the big drop and are now grinding upwards, signaling that risk-on appetite is clearly back. With this kind of structural divergence, it’s likely that in the coming weeks or months, BTC will grind upward to $110,000 and $115,000 levels, reversing the drop as the entire correction was a little dubious.

CryptoMichNL advised that instead of relying on a time-based sounding the 4-year cycle assumption, it is better to focus on the charts and macro relationships that directly influence BTC price.

On-Chain Activity Shows Clear Confidence From Big Money

The ambassador of StandXOfficial and the KOL of Binance, who is also an advisor at KOLsAgency, Investor Ucan, has highlighted that the evidence of Bitcoin’s latest upward move is already on-chain. The last six hours have revealed a clear surge of institutional demand. On-chain data shows that Binance purchased 7,298 BTC, Coinbase bought 1,362 BTC, Wintermute bought 2,174 BTC, BlacRock bought 1,362 BTC, and an unknown whale bought 6,192 BTC. In total, 20,438 BTC were purchased in just six hours, valued at approximately $1.9 billion.

Ucan noted that the timing of this purchase is what stands out. These inflows hit the market hours before the Federal Reserve’s upcoming employment data was released. Institutional is clearly expecting a supportive outcome. A positive print refers to easing expectations and fresh liquidity on the horizon. Retail traders are reacting, and the institutions are anticipating early. If the Fed confirms what these flows imply, today’s buying won’t look like simple momentum, but preparation.

Bitcoin

Stellar’s December Outlook Brightens as Network Use Cases Grow, but Major Resistance Still Looms

Surging about 4% in the past 24 hours, Stellar (XLM) goes through December with a mix of optimism and caution as new payment integrations and institutional pilots draw attention back to the network’s utility.

However, despite signs of growing real-world use, XLM continues to trade near a critical long-term support level, leaving traders divided on whether the token is preparing for a recovery or facing another downward leg.

Recent activity across payments, banking pilots, and data-infrastructure upgrades show how Stellar’s ecosystem is expanding at a time when the token sits at a pivotal market position. The tension between strengthening fundamentals and fragile price structure is shaping the month’s outlook.

Stellar XLM XLMUSD XLMUSD_2025-12-10_11-49-55

Rising Utility Gives Stellar a Boost

Network usage has climbed following several developments in November. Wirex activated USDC and EURC card-settlement on Stellar for more than seven million users, shifting everyday transactions onto the blockchain and increasing stablecoin throughput.

Days later, U.S. Bank began testing a programmable stablecoin on Stellar, adding an institutional layer to the network’s growing settlement activity.

The recent integration of Space and Time (SxT), which now indexes the full Stellar network and provides cryptographically verified data to institutions, also strengthens the chain’s infrastructure.

Together, these upgrades position Stellar as a functioning payments network rather than a speculative asset alone. Early market reaction has been modest, but analysts note that expanding stablecoin flows could support stronger demand for XLM over time.

Price Holds Key Support as Traders Watch $0.245

Despite the momentum in utility, XLM continues to sit at one of its most important technical zones. The token has trended downward since November 2024 and now trades just above the $0.245 horizontal support, an area that has repeatedly prevented deeper losses over the past year.

Weekly indicators remain bearish, with RSI below 50 and MACD negative, suggesting that long-term momentum still leans downward. Short-term charts show a contained bounce within an ascending channel, which analysts view as corrective rather than a new uptrend.

A decisive break below $0.245 could open the door to new lows, while holding this level would give bulls another chance to challenge overhead resistance.

Resistance Blocks Cap Upside Expectations

Even with potential catalysts from network growth, analysts remain cautious about XLM’s ability to retest previous highs. Multiple reports highlight the $0.26–$0.27 range as the first major resistance zone, followed by a broader cluster near $0.28–$0.31.

Some forecasts suggest a possible move toward $0.31 by year-end if momentum strengthens, though this outlook carries medium confidence given the broader market’s uncertainty.

Stellar’s December narrative is supported by two opposing forces, rising real-world adoption and a price chart still struggling against long-standing resistance. Whether utility gains translate into market recovery will depend on XLM’s ability to hold its support level and reclaim key technical thresholds in the weeks ahead.

Cover image from ChatGPT, XLMUSD chart from Tradingview

Solana Network Sees 68% Crash In 3 Years, What’s Going On?

The Solana network has seen its validator count crash by more than 68% over the past three years, falling from thousands of active nodes to just around 800. The massive decline in validators has sparked discussions about whether this could become a threat to the blockchain network or a natural pruning of inactive nodes to increase efficiency. 

Solana loses 68% Of Its Validators In 3 Years

A new report from Criptonocias reveals that Solana has experienced a dramatic decline in the number of its validators, active and non-active, since March 2023. This decrease has raised concerns across the crypto community about the network’s overall health and security

Over the last three years, the Solana network has steadily lost validators, going from 2,500 to 2,100 in November 2022 and now hovering around 800. This decline means the blockchain has lost a total of 1,700 validators. Although this considerable decrease should trigger warning alerts, it could be a result of ledger pruning, which involves removing inactive or redundant nodes to streamline a network and improve its performance without compromising security. 

Notably, validators are crucial for the operation of a blockchain network, as they run nodes, confirm transactions, and help maintain the integrity of the system. Each validator adds to the diversity of the network and reduces the risk of any single entity gaining excessive control.  

Solana

According to the report, some voices in the Solana ecosystem see the reduction of validators in a positive light. They argue that losing “Sybil validators,” which are nodes pretending to be multiple independent operators but are actually controlled by a single party, can be beneficial. Based on this perspective, having a smaller number of reliable and active validators is healthier than maintaining thousands of nodes that do not contribute meaningfully to the blockchain network.

Criptonocias revealed that teams such as Layer 33, which develops infrastructure node tools and provides network services for Solana, point out that many of the validators leaving the blockchain are not Sybils but legitimate node operators. This suggests that the drop in numbers does not automatically equate to improved network quality despite widespread talks about ledge pruning.  

Notably, the potential impact on the Solana network, whether negative or positive, depends on the independence of the remaining validators and the distribution of power among them. An updated report of the validator count reveals that it has dropped again from 800 to 795. 

Solana Faces Liquidity Crunch As Profitability Declines

Amidst its decline in validators, the Solana network is showing signs of strain as liquidity dries up and profitability declines. On-chain data from Glassnode highlights a troubling trend in the network’s trading activity, with the 30-day average realized profit-to-loss ratio remaining below 1 since mid-November. 

This level is typically associated with bear market conditions and points to a growing imbalance between gains and losses among traders. A ratio below 1 also indicates that traders are realizing losses more frequently than profits, underscoring the cryptocurrency’s weakening market sentiment.

Solana

Bitcoin Roars Back To $94K — Traders Rush In As FOMO Explodes: Data

Bitcoin climbed to a three-week high on Tuesday before slipping back, a move that has traders and analysts watching closely.

According to TradingView data, Bitcoin price topped out at $94,600 late in the session — its highest level since November 25 — then eased to about $92,450 at the time of reporting.

Santiment, a blockchain analytics firm, said social chatter calling for “higher” and “above” exploded during the spike, but market action remained uneven.

Bitcoin: Trader Frenzy And Skepticism

Reports have disclosed that the surge drew heavy retail attention and a flurry of social-media posts urging more buying.

Some market watchers questioned how organic the rise was. A well-known long-term investor using the handle “NoLimit” told his 53,000 X followers that the $94,000 push looked engineered: big buys packed into a few minutes, thin order books, then little follow-through.

🤑 Bitcoin enjoyed a much needed rebound back to $94.6K today, reinvigorating traders, causing them to FOMO back in and expect higher prices. According to our social data scraping X, Reddit, Telegram, & other data, calls for “higher” & “above” exploded.

🟦 High bars indicate… pic.twitter.com/o3U3yWkwkk

— Santiment (@santimentfeed) December 9, 2025

That pattern, he argued, is how larger traders can create short-term fear of missing out so they can sell into strength.

Santiment also highlighted a behavioral twist: smaller traders appear to pile in after spikes, often leaving them on the wrong side of moves.

Volatility followed the high, as prices pulled back by a couple thousand dollars within hours. Exchange order depth and timing of large blocks, analysts say, matter a lot when liquidity is shallow.

Fed Decision Could Shift Momentum

The US central bank meeting this week is a key wildcard. Market pricing on CME Group futures showed an 88% chance of a 0.25% rate cut, which many traders think helped fuel the rally. Yet some analysts warned that any sign of hesitation about future cuts could dampen risk appetite.

Beyond US policy, next week’s potential Bank of Japan rate action is being watched because a tighter stance there could lift yields and pull capital back to Japan, tightening global liquidity. That kind of flow can pressure risky assets across markets.

Liquidity, Institutions And The Bigger Picture

Meanwhile, long-term holders pared back supply after a 36% correction from the all-time high, and some addresses now hold levels seen in March.

Jessica Gonzales, an analyst cited in reports, said M2 money supply sits at about $22.3 trillion and stablecoin reserves remain elevated, suggesting there is capital around but not necessarily evenly distributed in markets.

Institutional moves also feature: big firms such as BlackRock and Strategy have expanded crypto exposure, which could add a steadier buyer base — or simply shift where risk sits.

What Traders Should Watch

Short-term traders should track order-book depth, large trade clusters, and how price reacts to any Fed wording about future cuts.

The next 25 days were flagged as especially important by several observers because liquidity swings and regulatory updates could flip the narrative fast. If a true broad-based bid forms, prices could move quickly. If the Fed signals caution, the opposite could happen.

Featured image from Gemini, chart from TradingView

Here’s Why Strategy’s $1 Billion Bitcoin Purchase Did Not Trigger A Price Rally

When Strategy disclosed its acquisition of more than 10,000 Bitcoin worth $1 billion, market watchers anticipated an immediate rally. Instead, Bitcoin’s price barely moved. The muted response was not a reflection of weak demand but the result of how the purchase was executed. In response to the confusion surrounding the stagnant price action, Quinten Francois explained the mechanics behind the transaction, clarifying why such a large buy left no visible impact on the chart.

The Invisible Plumbing Behind Institutional Bitcoin Accumulation

On 9 December 2025, Andrew Tate questioned why a massive 10,000 BTC buy failed to nudge the market. The answer, as analyst Francois explained, lies in the operational backbone of over-the-counter (OTC) desks—an ecosystem designed to absorb billion-dollar flows while keeping price action stable. These desks operate entirely outside exchanges. When a firm wants thousands of BTC, nothing is executed against the real-time order book. Instead, OTC operators start sourcing supply quietly from large holders looking to offload position size.

This pipeline includes deep private liquidity that retail traders never see: miners selling block rewards, VCs rotating out of token allocations, market makers rebalancing inventory, and even corporate treasuries restructuring reserves. None of these trades appear on exchange feeds. According to Francois, they do not trigger volatility, sweep liquidity pools, or create the upward pressure that retail investors typically expect from large buys.

More critically, Francois notes that these transactions do not occur in a single block. A 5,000–10,000 BTC order is never filled all at once. Instead, OTC desks spread procurement over days or even weeks, accumulating inventory piece by piece. Only when enough matched supply is gathered do they finalize the transaction, resulting in a smooth settlement with no visible footprint on price charts.

Why No Price Rally Emerges From Shadow-Side Demand

Shadow-side demand refers to large-scale institutional buying that occurs entirely outside public exchanges. These hidden transactions do not trigger price rallies because OTC infrastructure is designed to prevent slippage, volatility, and market distortion. Institutions acquiring strategic size deliberately avoid pushing prices higher, while liquidity providers are incentivized to maintain stability. By keeping trades off public exchanges, both sides protect execution quality and preserve overall market integrity.

A rally only emerges when open-market demand exceeds visible liquidity. In this case, the demand never hit the open market. OTC desks tap private channels first and only touch exchanges if supply dries up—and that is considered a last resort. If enough sellers are found privately, no exchange-side buying occurs at all.

This is why public charts often show sell pressure but rarely show institutional demand. The buys happen in the shadows, the sells appear on-chain, and the price remains anchored. Strategy’s $1 billion allocation did not fail to move the market; it was intentionally engineered not to.

Bitcoin price chart from Tradingview.com (Strategy)

More Details On The Wall Street $500 Million Investment In XRP

Ripple’s most recent funding round has become one of the biggest crypto-related deals of the year, mainly because of who joined in and how the deal was structured. 

According to details shared in Bloomberg’s report, major Wall Street names, including affiliates of Citadel Securities, Fortress Investment Group, Brevan Howard, and Galaxy Digital, put $500 million into Ripple, giving the company a valuation of around $40 billion. This instantly turned the round into one of the strongest signs yet that traditional finance is taking a serious interest in the XRP ecosystem.

How Wall Street Structured The Deal To Protect Themselves

In early November 2025, Ripple closed a major private equity round that injected $500 million into the company, resulting in a valuation of roughly $40 billion. However, new details show that the most surprising part of the transaction is not the amount raised but the agreement behind it. Bloomberg reports that investors in this round did not simply buy Ripple shares and hope the value rises. Instead, they secured built-in protections that guarantee them profits later.

They were given the right to sell their shares back to Ripple in three to four years at a 10% yearly return, unless Ripple goes public before then. At that rate, Ripple would need to pay roughly $732 million to buy the shares back after four years. That means even if Ripple’s valuation stays flat or drops, the investors still walk away with guaranteed gains.

However, if Ripple decides to buy the shares back earlier, the investors get an even higher payout of around 25% annualized rate. A liquidation preference was also included, meaning these investors get paid first if anything goes wrong. Ripple noted in its announcement of the investment round that it has repurchased more than 25% of its outstanding shares over the past few years.

Why The Deal Is Really A Bet On XRP

Even though the investors bought equity in Ripple, not XRP itself, most of Ripple’s value still comes from its massive XRP holdings. According to Bloomberg, two of the funds that put in money noted that at least 90% of Ripple’s net value is tied to XRP. As of July 2025, Ripple held around $124 billion worth of XRP, although most of its XRP holdings are held in escrow.

This means the investment round, in reality, is also a bet on XRP’s long-term relevance and future market strength. If the price of XRP grows, Ripple benefits, and so do the investors who now hold equity backed by a company sitting on one of the world’s largest digital asset reserves. 

However, the $500 million investment does show that serious investors believe Ripple will continue growing, but just that Ripple’s success is still directly linked to the XRP price.

XRP

XRP Breakout Enters Critical Phase As Chart Targets $9–$13 Zone

Crypto analyst Cryptollica published a new XRP/USD 2-week chart on December 8 via TradingView, arguing that the altcoin may be replaying the same structural pattern that preceded its explosive 2017 rally. With current price action pivoting around the key $1.95 level and technical targets projected as high as $9–$13.

What Happens If XRP Repeats The 2017 Fractal?

The analysis uses a long-range log chart from Binance, where the latest candle in the screenshot shows XRP trading around $2.0892. In this timeframe, the analyst divides XRP’s history into mirrored cycles: 2014–2017 on the left and 2021–2025 on the right, each broken into labeled segments “Part 1,” “Part 2” and “Part 3.”

According to Cryptollica, “the cycle experienced by XRP between 2014 and 2017 is almost an identical copy of the current cycle spanning 2021 to 2025.” In both cases, Part 1 is described as an accumulation phase, with XRP suppressed below a dashed blue resistance band for an extended period while forming higher lows along a rising dotted trendline.

XRP/USD 2-Week Chart Analysis

The current Part 1, roughly 2022–2024, is said to have lasted substantially longer than in the earlier cycle. The analyst cites the rule that “the bigger the base, the higher in space,” arguing that this extended sideways structure signals a large build-up of potential energy.

Part 2 is defined as the breakout and retest of that blue resistance band. Once XRP closes decisively above this zone and consolidates there, the chart treats the area as a new support and as confirmation that “the official end of the downtrend and the start of a bull market” has been registered. Cryptollica suggests XRP is now at the final stage of, or has just completed, this breakout phase on the 2-week timeframe.

The pivotal reference point for the entire setup is the $1.95 level, drawn in green on the chart. “The $1.95 level, marked in green, is of vital importance,” the analyst writes, emphasizing the classic principle that “once resistance is broken, it turns into support.” In this framework, XRP “currently holding above this level (performing a successful retest) is the most crucial confirmation point for the continuation of the uptrend.”

If that confirmation holds, the analysis moves to Part 3, labeled the “Parabolic Rise – Discovery Phase.” In 2017, this segment corresponded to a near-vertical advance that pushed XRP into its all-time high zone. Cryptollica argues that XRP now stands “right on the precipice of this ‘vertical lift-off’ in the current cycle,” illustrated by a steep yellow arrow on the logarithmic chart. The first major objective is the region around the prior all-time high at roughly $3.30–$3.84. If the 2017 fractal “plays out precisely,” the post projects an “implied target” between $9.00 and $13.00.

The analyst tempers this with several cautions. The crypto market is far larger than in 2017, and a move to $10+ would imply a “colossal market capitalization,” making a repeat of the exact 2017 multiple “mathematically more challenging,” even if “logic often takes a backseat in crypto mania.” The scenario also assumes supportive fundamentals, including the resolution of regulatory overhangs, potential XRP ETF developments and Ripple’s stablecoin strategy.

Parabolic phases, Cryptollica warns, are typically accompanied by “sudden drops of 30–40%,” making them “the most dangerous territory for leveraged trading.” The analyst characterizes the overall outlook as “extremely positive (bullish)” as long as the $1.95 support holds, concluding that XRP is at the moment of “breaking its chains” and that, if broader market conditions remain constructive, “double-digit targets ($10+) for XRP are technically on the table.”

At press time, XRP traded at $2.07.

XRP price

Dogecoin Price Set To Surge As Sellers Show Signs Of Exhaustion

A new technical analysis shared by crypto analyst BitGuru on the social media platform X shows that Dogecoin is trading at an important price level that could set the stage for an upward shift. His chart shows a familiar structure forming at a major support level, one that has acted as the starting point for a previous rally in the year. The price action now developing is similar to this earlier setup, showing that Dogecoin may be preparing for another recovery move above $0.2.

Dogecoin Returns To An Important Support Zone

Dogecoin has spent the past few weeks trading between $0.13 and $0.15 without a clear path to bullish price action. This recent price action is an extension of a downturn that has been taking effect since mid-September from the $0.3 price level.

Notably, technical analysis of Dogecoin’s daily candlestick timeframe chart shows that the cryptocurrency is currently positioned on a significant historical support level, the same area that sparked previous rallies. This support is shown on the chart as between $0.139 and $0.141, the lower boundary of a wide accumulation zone, where price repeatedly stabilized before surging. 

Despite the broader market’s recent weakness, this price support range has held up. Price action in December has led to the creation of a few transition candles on the daily timeframe chart. This, in turn, has led to the creation of a higher low relative to the November breakdown, which had caused Dogecoin to break below $0.135.

Dogecoin price

Dogecoin Daily Candlestick Chart. Source: @bitgu_ru On X

Another notable feature highlighted by the analyst is the tight compression forming around Dogecoin’s candles. The chart shows a sequence of narrow movements, indicating that selling momentum has thinned out. 

BitGuru interpreted this as exhaustion from sellers, meaning the Dogecoin price is no longer displaying the heavy downward pressure seen in November. This type of narrowing range is expected to be the final stage of the downtrend and buyers are beginning to regain control.

Buyers Begin To Step In, Mid-Range Target Next

Early signs of buyer strength are now visible within this compressed zone. This is reflected in the price action in the past 24 hours, which has seen Dogecoin bounce from its intraday low of $0.14 and increase by 4.1%. That rebound is the first meaningful pushback from buyers after days of bearish activity.

The projected arrow in BitGuru’s chart points to the mid-range area around $0.188 as the first destination now that Dogecoin is rebounding from its support base. However, another higher price target is highlighted around $0.223 if Dogecoin completes its projected bounce from the support.

Depending on how Dogecoin reacts here, a bullish move will target the order block around $0.25, before further price targets at $0.284 and $0.306.

Dogecoin price chart from Tradingview.com

The Current Bitcoin Price Pump Will End In A Crash – Here’s When To Start Selling

Over the last few days, the Bitcoin price has fluctuated, but the most prominent moves have been upwards, going from below $90,000 to over $94,000. As expected, this rapid climb already has investors calling for a return of the bull run, but not everyone is convinced. For some, the current Bitcoin price momentum is most likely a bull trap, and crypto analyst Xanrox highlights this in a recent analysis, outlining the best level to start selling the digital asset.

Why The Bitcoin Price Risks A Crash To $74,000

Xanrox’s analysis focuses on the bearish formations that have appeared on the Bitcoin price crash following the recent upward move. While many in the crypto community celebrate the rise above $90,000 again, the crypto analyst sounds an alarm that this is the time to go bearish on the cryptocurrency.

According to the analysis shared on the TradingView website, there has been a clear bear flag formation for the cryptocurrency. This bearish formation is visible on both the 12-hour chart and the 1-Day chart. Regardless, both of these charts point to one possible outcome, and that is an almost perfect textbook bear flag formation.

In addition to the bear flag formation, Xanrox also highlights that there is a WXY corrective pattern inside the bear flag. Both of these point to a possible continuation to the initial downtrend that began after the Bitcoin price hit $126,000 back in October.

Bitcoin price

As for how far the current rally could go, the crypto analyst sees it reaching as high as $96,000 before momentum runs out. This presents the “perfect” time to sell or enter a short as the price continues its decline. The target for this is an over 25% crash that will send the price going toward $74,000.

The $74,000 target makes an appearance as it is a swing low from April 2024, meaning that crypto traders who are long on the digital asset would have their stop losses below it. Thus, this makes it an attractive point for market makers to push the price towards in order to clear significant liquidity.

The timeframe for this to play out is placed over the next few weeks, riding out the end of 2025 and moving into January 2026. However, the swing low support at $74,000, if it holds up, could end up serving as the next bounce-off point for the Bitcoin price.

Bitcoin price chart from Tradingview.com

NFT Slump Worsens With Monthly Sales Hitting Rock Bottom

A sharp slowdown in buying pushed the NFT market back toward its weakest levels of the year, as weekly and monthly totals fell sharply and overall valuations continued to slip.

According to market trackers, trading activity cooled significantly in November and the first week of December, raising fresh questions about demand heading into year end.

Sales And Volume Plunge

NFT sales fell to $320 million in November, down from close to $630 million in October, CryptoSlam data shows. That level is roughly on par with the $312 million recorded in September 2024.

Based on reports, the trend did not improve at the start of December: from Dec. 1–7, collections generated about $62 million in sales — the weakest weekly total recorded so far in 2025. Market participants are being hit by lower turnover and fewer big trades.

Market Cap Shrinks Dramatically

CoinGecko data shows the sector’s market cap sits at $3.1 billion, which is down 66% from a January high of $9.2 billion. Reports have disclosed a steep month-to-month swing as well: values dropped from $6.6 billion in October to $3.5 billion in November, a fall of 46% in roughly 30 days.

There was a brief uptick on Nov. 11 when market cap moved from $3.5 billion to nearly $4 billion during a memecoin-driven surge, but the recovery was short-lived and the market cap later retreated back to $3.1 billion. These moves show that prices are still volatile and driven by bursts of speculative interest.

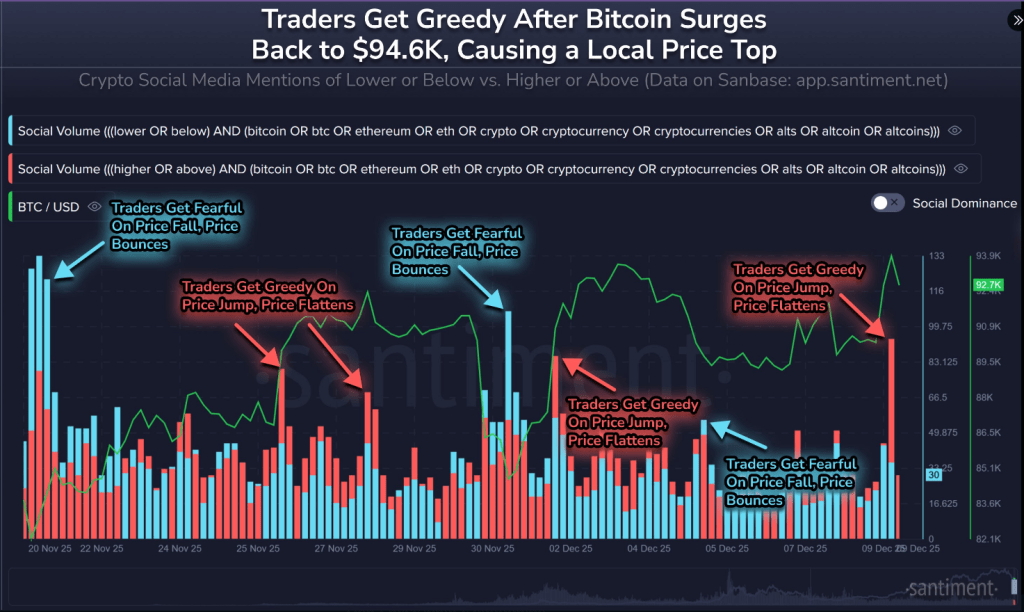
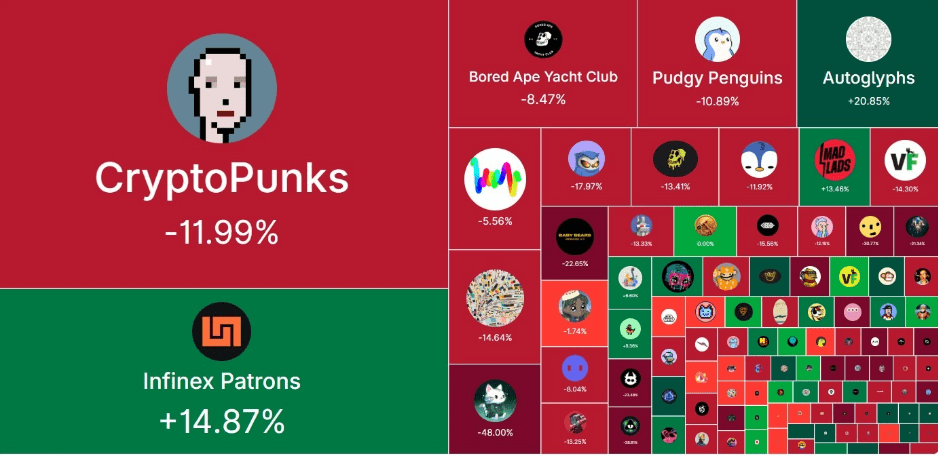
Blue Chips Mostly Lose Ground

Top collections were not immune. Based on reports, CryptoPunks fell about 12% over the past month. Bored Ape Yacht Club slid 8.5%, while Pudgy Penguins dropped 10.6% in the same period.

Art-focused blue-chip works also fell: Chromie Squiggle lost 5.6%, Fidenza declined 14.6%, Moonbirds went down 17.9% and Mutant Ape Yacht Club slipped 13.4%. The biggest fall among major names came from Hypurr, which dropped 48%.

Two Collections Show Gains

Not every project followed the downward path. Infinex Patrons posted almost 15% rise in the last 30 days, and Autoglyphs outperformed the top ten with a 21% gain.

These outliers were lifted by collector interest, and in some cases by the projects’ small supply or unique on-chain history. Still, such gains remain the exception rather than the rule.

Outlook As Year Ends

The weak start to December suggests the pullback could continue into the close of the year. Liquidity is thinner now, and short-lived rallies driven by other crypto market events have failed to create lasting momentum.

Prices were pushed down across a wide set of collections, and trading volumes have not shown a sustained recovery.

Featured image from Unsplash, chart from TradingView

Standard Chartered Cuts 2026 Bitcoin Price Prediction By 50%

Standard Chartered has sharply reduced its famously bullish Bitcoin roadmap, cutting its 2026 price target in half and acknowledging that its previous near-term projections were too aggressive, even as it keeps an ultra-optimistic long-term view intact.

Standard Chartered Downgrades Bitcoin Price Predictions

In a note shared on X by VanEck head of research Matthew Sigel, Standard Chartered argues that Bitcoin’s traditional halving cycle has been overtaken by ETF-driven flows. The bank writes: “With the advent of ETF buying, we think the BTC halving cycle is no longer a relevant price driver. The logic in previous cycles (when US ETFs did not exist) – i.e., prices would peak about 18 months after each halving and decline thereafter – is no longer valid, in our view.”

The report adds that it will “take a break of the current all-time high ($ 126,000 on 6 October 2025) to prove that; we expect this to happen in H1-2026.”

Alongside that shift in framework, the bank re-profiled its multi-year Bitcoin targets. According to the figures shared by Sigel, Standard Chartered has lowered its 2025 forecast from $200,000 to $100,000, its 2026 target from $300,000 to $150,000, its 2027 projection from $400,000 to $225,000, its 2028 estimate from $500,000 to $300,000, and its 2029 prediction from $500,000 to $400,000 while keeping a $500,000 target for 2030.

Bitcoin price predictions by Standard Chartered

Geoff Kendrick, Standard Chartered’s head of digital assets research, characterises the recent drawdown as painful but not structural. He describes the current phase as “a cold breeze,” explicitly rejecting the notion of a new crypto winter and noting that the magnitude of the pullback remains consistent with corrections seen in past bull cycles.

At the same time, he points out that weaker valuations for listed Bitcoin treasury companies have curtailed their ability to act as major marginal buyers, leaving spot ETFs as the primary driver of near-term gains.

Wall Street Giant Bernstein Agrees

The downgrade also lands in the context of a broader rethink on Wall Street. One day earlier, on December 8, Sigel shared a separate note from Bernstein that reached a similar conclusion about Bitcoin’s market structure.

Bernstein wrote that “the Bitcoin cycle has broken the 4-year pattern (cycle peaking every 4 years) and is now in an elongated bull-cycle with more sticky institutional buying offsetting any retail panic selling.”

Despite an approximately 30% correction, the firm notes that “we have seen less than 5% outflows via ETFs.” On that basis, Bernstein now moves its 2026 Bitcoin price target to $150,000, sees the cycle “potentially peaking in 2027E at $200,000,” and keeps its long-term 2033 target at roughly $1,000,000 per BTC.

Both Standard Chartered and Bernstein are converging on the same structural message: the halving alone no longer explains Bitcoin’s trajectory. ETF flows, institutional positioning and balance-sheet dynamics are now the core variables, even if their precise price targets and timelines diverge.

At press time, Bitcoin traded at $92,686.

Bitcoin price

Cathie Wood Says Bitcoin Is ‘Climbing Another Wall Of Worry’– Here’s Why

Ark Invest’s CEO and CIO, Cathie Wood, joined Fox Business’s “Morning With Maria” to discuss her investment strategy as she believes the US is entering a “historic productivity surge,” and why she is bullish on Bitcoin (BTC) for 2026.

The Four-Year Cycle Will Be ‘Disrupted’

On Tuesday, Ark Invest’s CEO, Cathie Wood, shared her perspective on the recent Bitcoin performance, which has retraced over 10% in the past month and struggled to reclaim crucial levels over the past few weeks.

To Wood, Bitcoin has been behaving like a risk-on asset and is currently “climbing another wall of worry” that has made investors wary of the leading crypto asset’s upcoming performance.

As she explained, there is a fear of the four-year cycle, which suggests that 2026 will be a corrective year for Bitcoin. Historically, BTC has seen significant price pullbacks during bear markets, with retraces of up to 75% to 90% in previous cycles.

The aggressive Q4 2025 correction has shattered most investors’ expectations of an end-of-year bull run, raising concerns that the crypto market has already entered the bearish phase of the cycle after the more than 30% drop from the October highs.

However, Ark Invest’s CEO considers that “the four-year cycle is going to be disrupted” as volatility has significantly diminished over the past few years, and large-scale investors turn to the rapidly growing industry.

“We think that the move by institutions into this new asset class is going to prevent much more of a decline,” Wood affirmed, noting, “we might have seen it a couple of weeks ago,” when BTC managed to hold the $80,000 barrier during the late November correction.

She previously asserted that growing institutional adoption will be a powerful driver for long-term value for the cryptocurrency, adding that institutions “really have just dipped their toes into this space. We have just started, so we have a long way to go.”

Bitcoin To Outperform Gold Soon?


During the interview, Wood also reaffirmed her previous forecast that the flagship crypto will outperform gold next year, despite its choppy performance during the last quarter of 2025.

She highlighted that “gold is more of a risk-off asset,” and its 60% year-to-date (YTD) rise is “proof” that Bitcoin is climbing a wall of worry as investors “are using gold as a hedge against geopolitical risks.”

Nonetheless, Ark Invest’s CEO pointed out that between the early 80s and the late 90s, gold peaked and “went down as we were in the golden age of innovation, ending with the internet.”

Now, she believes that the same could happen soon, as what she calls “the AI age” starts and the market potentially recovers. Meanwhile, she forecasted that Bitcoin would remain risk-on and outperform gold in 2026.

“I really believe we are moving from a rolling recession where we’ve been for the last three years, into a rolling recovery, which we think we are entering now. Then, a productivity-driven boom the likes of which we have never seen before,” Wood concluded.

 As of this writing, Bitcoin is trading at $94,011, a 3.75% increase in the daily timeframe.

Bitcoin, btc, btcusdt

Ethereum Price Climbs Toward $3,300 For The First Time Since November: What’s Driving The Surge?

On Tuesday, the Ethereum price experienced a notable surge, climbing by 6.5% and reclaiming the critical $3,300 mark for the first time in nearly a month. This has allowed Ethereum to outpace its peers among the top ten cryptocurrencies by market capitalization, showcasing a nearly 12% recovery for the leading altcoin over the past week.

ETH Grows In Demand 

Analysts from Bull Theory attribute this resurgence to several key factors, including significant institutional interest in Ethereum. The firm highlighted BitMine, which holds the largest public company collection of ETH, as a major player in this recovery phase. 

In a recent social media update on X (formerly Twitter), the analysts pointed out that demand for ETH is on the rise as Wall Street quietly builds on the Ethereum platform.

Notably, major financial institutions are beginning to make substantial moves in the Ethereum space. BlackRock, which manages $13.5 trillion, is launching tokenized funds and has filed for a staked Ethereum exchange-traded fund (ETF). 

Other notable players include JPMorgan with $4 trillion in assets, Deutsche Bank at $1.1 trillion, and Standard Chartered with $800 billion. These firms are developing tokenization and decentralized finance (DeFi) infrastructure specifically on Ethereum and its Layer 2 (L2) solutions.

In addition, well-known financial entities such as Amundi, HSBC, BNY Mellon, Coinbase (COIN), Kraken, and Robinhood (HOOD) are incorporating Ethereum into their operations for functions like custody, settlement, and rollup infrastructure. 

As a result, these large companies are holding and staking ETH to generate yield, significantly increasing the altcoin’s demand. BitMine, for instance, anticipates earning over $400 million annually from its staking position.

Could The Ethereum Price Hit $12,000?

Such institutional involvement has led market experts like Tom Lee to speculate that the Ethereum price could potentially reach $12,000 by 2026, driven by growing staking demand and the scaling of tokenization efforts. 

Adding to the momentum, Arkham reported that Tom Lee’s Ethereum treasury firm acquired 138,452 ETH since last week, valued at approximately $431.97 million. BitMine currently holds $12.05 billion in ETH and has an additional $1 billion allocated for further purchases. 

In a different development that could bolster the Ethereum price further, Chris MacDonald, an analyst for The Motley Fool, highlighted reports indicating that the Office of the Comptroller of the Currency (OCC) confirmed US banks can now legally conduct “riskless principal” transactions in crypto assets. 

The analyst asserted that this new regulatory approval may lead to an influx of capital into digital assets, which would likely benefit the Ethereum price and holders, as well as other top cryptocurrencies.

Ethereum price

As of this writing, the Ethereum price is trading at $3,325. Despite recent gains, the price is still nearly 33% below the all-time high of $4,946, which was reached earlier this year. 

Featured image from DALL-E, chart from TradingView.com 

Historic Reversal: Ethereum ETF Flows Plunge To Worst Month Since Launch

Ethereum’s momentum in institutional markets just hit a major roadblock. After months of enthusiasm surrounding spot Ethereum exchange-traded funds (ETFs), new data has shown that ETF flows have sunk to their worst monthly total since their launch. The sharp drop reflects a broader cooldown in investor demand, as market volatility and shifting risk appetite weigh on crypto allocations.

Will Staking ETFs Emerge To Stabilize Flows?

In an X post, a crypto analyst known as Milk Road revealed that the Ethereum ETFs had just printed their worst month on record since launch, which is roughly $1.4 billion in net outflows, the largest single-month withdrawal that ETH has ever encountered. 

Historically, ETF flow reversals tell more about liquidity pressure in the broader financial system than the long-term fundamentals of the asset itself. When redemptions spike this hard, it’s usually a sign that broader risk sentiment is cracking, not that the asset itself broke.

Ethereum

Meanwhile, most investors don’t know that while ETFs were handing back, Digital Asset Treasuries (DATs) stepped in as aggressive buyers. BitMine Immersion Technologies (BMNR) quietly added over 300,000 ETH, worth nearly $800 million at the time, to its treasuries. If the ETF outflow continues to accelerate, the near-term price action will remain choppy as liquidity gets strained at the edges.

However, if DAT inflows continue scaling, it builds the foundation for a tighter supply setup into 2026. The tension between this panicked short-term selling pressure and the quiet structural long-term accumulation is the most important dynamic for positioning.

Why ETH Reserves Are Becoming Strategic Corporate Assets

Crypto trader Bull Theory has noted that last week, BitMine bought an astonishing 138,452 ETH, worth $437.7 million. This single transaction solidifies their position as the largest ETH treasury in the world, holding 3.86 million ETH, valued at $12.4 billion and accounting for 3.2% of the entire circulating supply.

The true source of rising ETH demand is that Wall Street is quietly building on ETH. BlackRock, with $13.5 trillion AUM, has launched tokenized funds on ETH and has filed for a staked ETH ETF. JPMorgan, with $4 trillion, Deutsche Bank, with $1.1 trillion, and Standard Chartered, with $800 billion, are developing tokenization and DeFi infrastructure using ETH and its Layer-2 networks. 

Institutions like Amundi, HSBC, BNY Mellon, Coinbase, Kraken, and Robinhood are all using ETH rails for custody and settlement or rollup infrastructure for scaling and security. Furthermore, large companies are now holding and staking ETH for yield. BitMine alone expects to generate $400 million+ a year in staking revenue from its position. 

Tom Lee believes that as staking demand grows and institutions scale tokenization increases, ETH could reach $12,000 in 2026. “A Bitcoin miner is now the largest Ethereum whale, Wall Street is building on ETH, and treasuries are shifting toward yield. ETH is quickly becoming part of the Global Financial System.” Bull Theory noted.

Ethereum

Solana (SOL) Turns Lower From Key Zone—Is Support About to Be Tested?

Solana failed to stay above $142 and corrected gains. SOL price is now trading below $140 and might find bids near the $135 zone.

  • SOL price started a downside correction below $142 against the US Dollar.
  • The price is now trading above $135 and the 100-hourly simple moving average.
  • There is a bullish trend line forming with support at $135 on the hourly chart of the SOL/USD pair (data source from Kraken).
  • The pair could extend losses if it dips below the $135 zone.

Solana Price Starts Downside Correction

Solana price failed to surpass $145 and started a downside correction, like Bitcoin and Ethereum. SOL dipped below $142 and $140 to enter a short-term bearish zone.

There was a move below the 50% Fib retracement level of the upward wave from the $131 swing low to the $145 high. However, the bulls are active near $136. There is also a bullish trend line forming with support at $135 on the hourly chart of the SOL/USD pair.

Solana Price

Solana is now trading above $135 and the 100-hourly simple moving average. On the upside, the price is facing resistance near the $140 level. The next major resistance is near the $145 level. The main resistance could be $148. A successful close above the $148 resistance zone could set the pace for another steady increase. The next key resistance is $155. Any more gains might send the price toward the $165 level.

More Losses In SOL?

If SOL fails to rise above the $142 resistance, it could start another decline. Initial support on the downside is near the $136 zone and the 61.8% Fib retracement level of the upward wave from the $131 swing low to the $145 high. The first major support is near the $135 level and the trend line.

A break below the $135 level might send the price toward the $132 support zone. If there is a close below the $132 support, the price could decline toward the $125 support in the near term.

Technical Indicators

Hourly MACD – The MACD for SOL/USD is gaining pace in the bearish zone.

Hourly Hours RSI (Relative Strength Index) – The RSI for SOL/USD is below the 50 level.

Major Support Levels – $135 and $132.

Major Resistance Levels – $142 and $145.

❌