Reading view

There are new articles available, click to refresh the page.

Standard Chartered Cuts 2026 Bitcoin Price Prediction By 50%

Standard Chartered has sharply reduced its famously bullish Bitcoin roadmap, cutting its 2026 price target in half and acknowledging that its previous near-term projections were too aggressive, even as it keeps an ultra-optimistic long-term view intact.

Standard Chartered Downgrades Bitcoin Price Predictions

In a note shared on X by VanEck head of research Matthew Sigel, Standard Chartered argues that Bitcoin’s traditional halving cycle has been overtaken by ETF-driven flows. The bank writes: “With the advent of ETF buying, we think the BTC halving cycle is no longer a relevant price driver. The logic in previous cycles (when US ETFs did not exist) – i.e., prices would peak about 18 months after each halving and decline thereafter – is no longer valid, in our view.”

The report adds that it will “take a break of the current all-time high ($ 126,000 on 6 October 2025) to prove that; we expect this to happen in H1-2026.”

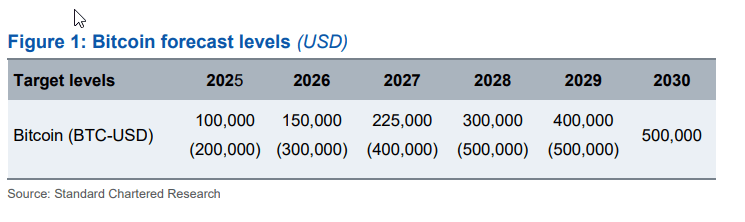
Alongside that shift in framework, the bank re-profiled its multi-year Bitcoin targets. According to the figures shared by Sigel, Standard Chartered has lowered its 2025 forecast from $200,000 to $100,000, its 2026 target from $300,000 to $150,000, its 2027 projection from $400,000 to $225,000, its 2028 estimate from $500,000 to $300,000, and its 2029 prediction from $500,000 to $400,000 while keeping a $500,000 target for 2030.

Bitcoin price predictions by Standard Chartered

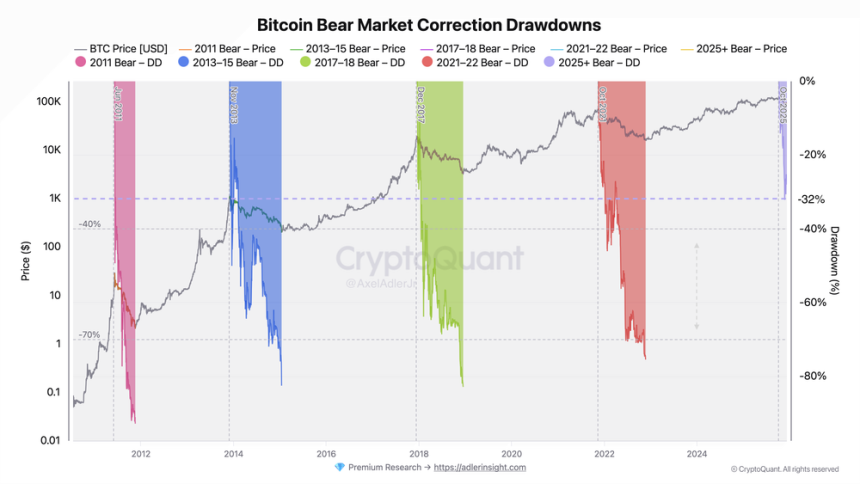
Geoff Kendrick, Standard Chartered’s head of digital assets research, characterises the recent drawdown as painful but not structural. He describes the current phase as “a cold breeze,” explicitly rejecting the notion of a new crypto winter and noting that the magnitude of the pullback remains consistent with corrections seen in past bull cycles.

At the same time, he points out that weaker valuations for listed Bitcoin treasury companies have curtailed their ability to act as major marginal buyers, leaving spot ETFs as the primary driver of near-term gains.

Wall Street Giant Bernstein Agrees

The downgrade also lands in the context of a broader rethink on Wall Street. One day earlier, on December 8, Sigel shared a separate note from Bernstein that reached a similar conclusion about Bitcoin’s market structure.

Bernstein wrote that “the Bitcoin cycle has broken the 4-year pattern (cycle peaking every 4 years) and is now in an elongated bull-cycle with more sticky institutional buying offsetting any retail panic selling.”

Despite an approximately 30% correction, the firm notes that “we have seen less than 5% outflows via ETFs.” On that basis, Bernstein now moves its 2026 Bitcoin price target to $150,000, sees the cycle “potentially peaking in 2027E at $200,000,” and keeps its long-term 2033 target at roughly $1,000,000 per BTC.

Both Standard Chartered and Bernstein are converging on the same structural message: the halving alone no longer explains Bitcoin’s trajectory. ETF flows, institutional positioning and balance-sheet dynamics are now the core variables, even if their precise price targets and timelines diverge.

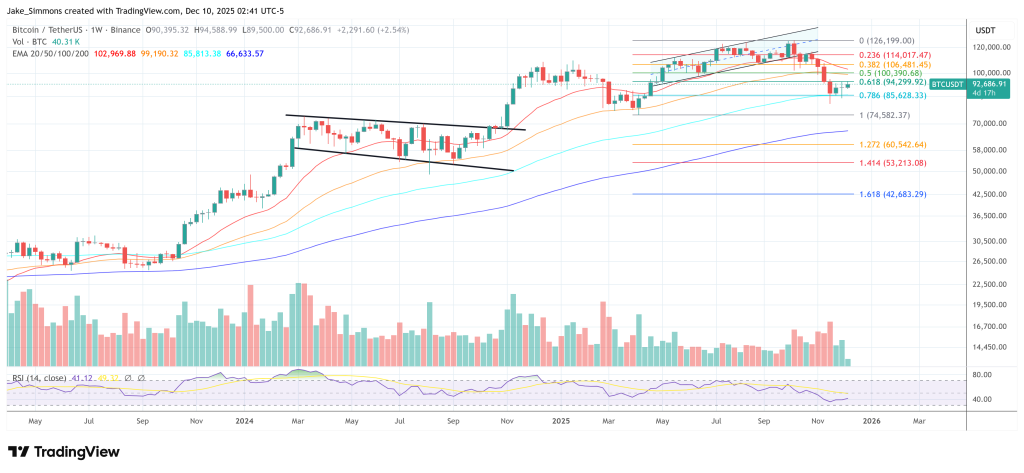
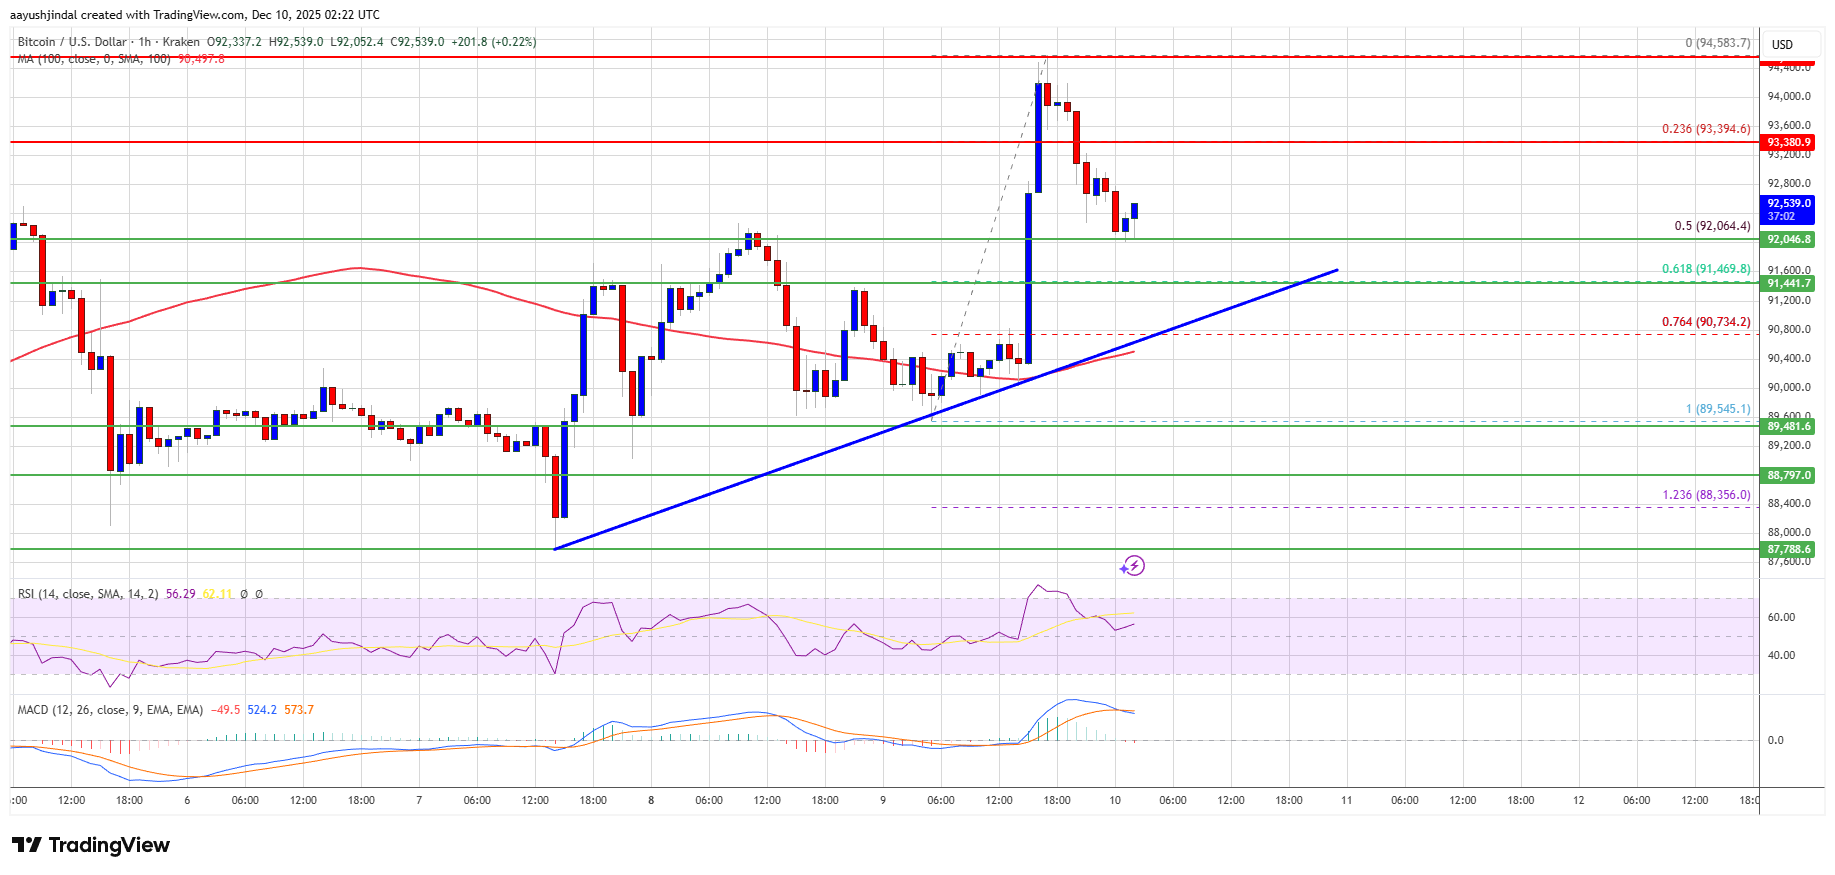
At press time, Bitcoin traded at $92,686.

Bitcoin price

Cathie Wood Says Bitcoin Is ‘Climbing Another Wall Of Worry’– Here’s Why

Ark Invest’s CEO and CIO, Cathie Wood, joined Fox Business’s “Morning With Maria” to discuss her investment strategy as she believes the US is entering a “historic productivity surge,” and why she is bullish on Bitcoin (BTC) for 2026.

The Four-Year Cycle Will Be ‘Disrupted’

On Tuesday, Ark Invest’s CEO, Cathie Wood, shared her perspective on the recent Bitcoin performance, which has retraced over 10% in the past month and struggled to reclaim crucial levels over the past few weeks.

To Wood, Bitcoin has been behaving like a risk-on asset and is currently “climbing another wall of worry” that has made investors wary of the leading crypto asset’s upcoming performance.

As she explained, there is a fear of the four-year cycle, which suggests that 2026 will be a corrective year for Bitcoin. Historically, BTC has seen significant price pullbacks during bear markets, with retraces of up to 75% to 90% in previous cycles.

The aggressive Q4 2025 correction has shattered most investors’ expectations of an end-of-year bull run, raising concerns that the crypto market has already entered the bearish phase of the cycle after the more than 30% drop from the October highs.

However, Ark Invest’s CEO considers that “the four-year cycle is going to be disrupted” as volatility has significantly diminished over the past few years, and large-scale investors turn to the rapidly growing industry.

“We think that the move by institutions into this new asset class is going to prevent much more of a decline,” Wood affirmed, noting, “we might have seen it a couple of weeks ago,” when BTC managed to hold the $80,000 barrier during the late November correction.

She previously asserted that growing institutional adoption will be a powerful driver for long-term value for the cryptocurrency, adding that institutions “really have just dipped their toes into this space. We have just started, so we have a long way to go.”

Bitcoin To Outperform Gold Soon?


During the interview, Wood also reaffirmed her previous forecast that the flagship crypto will outperform gold next year, despite its choppy performance during the last quarter of 2025.

She highlighted that “gold is more of a risk-off asset,” and its 60% year-to-date (YTD) rise is “proof” that Bitcoin is climbing a wall of worry as investors “are using gold as a hedge against geopolitical risks.”

Nonetheless, Ark Invest’s CEO pointed out that between the early 80s and the late 90s, gold peaked and “went down as we were in the golden age of innovation, ending with the internet.”

Now, she believes that the same could happen soon, as what she calls “the AI age” starts and the market potentially recovers. Meanwhile, she forecasted that Bitcoin would remain risk-on and outperform gold in 2026.

“I really believe we are moving from a rolling recession where we’ve been for the last three years, into a rolling recovery, which we think we are entering now. Then, a productivity-driven boom the likes of which we have never seen before,” Wood concluded.

 As of this writing, Bitcoin is trading at $94,011, a 3.75% increase in the daily timeframe.

Bitcoin, btc, btcusdt

Ethereum Price Climbs Toward $3,300 For The First Time Since November: What’s Driving The Surge?

On Tuesday, the Ethereum price experienced a notable surge, climbing by 6.5% and reclaiming the critical $3,300 mark for the first time in nearly a month. This has allowed Ethereum to outpace its peers among the top ten cryptocurrencies by market capitalization, showcasing a nearly 12% recovery for the leading altcoin over the past week.

ETH Grows In Demand 

Analysts from Bull Theory attribute this resurgence to several key factors, including significant institutional interest in Ethereum. The firm highlighted BitMine, which holds the largest public company collection of ETH, as a major player in this recovery phase. 

In a recent social media update on X (formerly Twitter), the analysts pointed out that demand for ETH is on the rise as Wall Street quietly builds on the Ethereum platform.

Notably, major financial institutions are beginning to make substantial moves in the Ethereum space. BlackRock, which manages $13.5 trillion, is launching tokenized funds and has filed for a staked Ethereum exchange-traded fund (ETF). 

Other notable players include JPMorgan with $4 trillion in assets, Deutsche Bank at $1.1 trillion, and Standard Chartered with $800 billion. These firms are developing tokenization and decentralized finance (DeFi) infrastructure specifically on Ethereum and its Layer 2 (L2) solutions.

In addition, well-known financial entities such as Amundi, HSBC, BNY Mellon, Coinbase (COIN), Kraken, and Robinhood (HOOD) are incorporating Ethereum into their operations for functions like custody, settlement, and rollup infrastructure. 

As a result, these large companies are holding and staking ETH to generate yield, significantly increasing the altcoin’s demand. BitMine, for instance, anticipates earning over $400 million annually from its staking position.

Could The Ethereum Price Hit $12,000?

Such institutional involvement has led market experts like Tom Lee to speculate that the Ethereum price could potentially reach $12,000 by 2026, driven by growing staking demand and the scaling of tokenization efforts. 

Adding to the momentum, Arkham reported that Tom Lee’s Ethereum treasury firm acquired 138,452 ETH since last week, valued at approximately $431.97 million. BitMine currently holds $12.05 billion in ETH and has an additional $1 billion allocated for further purchases. 

In a different development that could bolster the Ethereum price further, Chris MacDonald, an analyst for The Motley Fool, highlighted reports indicating that the Office of the Comptroller of the Currency (OCC) confirmed US banks can now legally conduct “riskless principal” transactions in crypto assets. 

The analyst asserted that this new regulatory approval may lead to an influx of capital into digital assets, which would likely benefit the Ethereum price and holders, as well as other top cryptocurrencies.

Ethereum price

As of this writing, the Ethereum price is trading at $3,325. Despite recent gains, the price is still nearly 33% below the all-time high of $4,946, which was reached earlier this year. 

Featured image from DALL-E, chart from TradingView.com 

Historic Reversal: Ethereum ETF Flows Plunge To Worst Month Since Launch

Ethereum’s momentum in institutional markets just hit a major roadblock. After months of enthusiasm surrounding spot Ethereum exchange-traded funds (ETFs), new data has shown that ETF flows have sunk to their worst monthly total since their launch. The sharp drop reflects a broader cooldown in investor demand, as market volatility and shifting risk appetite weigh on crypto allocations.

Will Staking ETFs Emerge To Stabilize Flows?

In an X post, a crypto analyst known as Milk Road revealed that the Ethereum ETFs had just printed their worst month on record since launch, which is roughly $1.4 billion in net outflows, the largest single-month withdrawal that ETH has ever encountered. 

Historically, ETF flow reversals tell more about liquidity pressure in the broader financial system than the long-term fundamentals of the asset itself. When redemptions spike this hard, it’s usually a sign that broader risk sentiment is cracking, not that the asset itself broke.

Ethereum

Meanwhile, most investors don’t know that while ETFs were handing back, Digital Asset Treasuries (DATs) stepped in as aggressive buyers. BitMine Immersion Technologies (BMNR) quietly added over 300,000 ETH, worth nearly $800 million at the time, to its treasuries. If the ETF outflow continues to accelerate, the near-term price action will remain choppy as liquidity gets strained at the edges.

However, if DAT inflows continue scaling, it builds the foundation for a tighter supply setup into 2026. The tension between this panicked short-term selling pressure and the quiet structural long-term accumulation is the most important dynamic for positioning.

Why ETH Reserves Are Becoming Strategic Corporate Assets

Crypto trader Bull Theory has noted that last week, BitMine bought an astonishing 138,452 ETH, worth $437.7 million. This single transaction solidifies their position as the largest ETH treasury in the world, holding 3.86 million ETH, valued at $12.4 billion and accounting for 3.2% of the entire circulating supply.

The true source of rising ETH demand is that Wall Street is quietly building on ETH. BlackRock, with $13.5 trillion AUM, has launched tokenized funds on ETH and has filed for a staked ETH ETF. JPMorgan, with $4 trillion, Deutsche Bank, with $1.1 trillion, and Standard Chartered, with $800 billion, are developing tokenization and DeFi infrastructure using ETH and its Layer-2 networks. 

Institutions like Amundi, HSBC, BNY Mellon, Coinbase, Kraken, and Robinhood are all using ETH rails for custody and settlement or rollup infrastructure for scaling and security. Furthermore, large companies are now holding and staking ETH for yield. BitMine alone expects to generate $400 million+ a year in staking revenue from its position. 

Tom Lee believes that as staking demand grows and institutions scale tokenization increases, ETH could reach $12,000 in 2026. “A Bitcoin miner is now the largest Ethereum whale, Wall Street is building on ETH, and treasuries are shifting toward yield. ETH is quickly becoming part of the Global Financial System.” Bull Theory noted.

Ethereum

Solana (SOL) Turns Lower From Key Zone—Is Support About to Be Tested?

Solana failed to stay above $142 and corrected gains. SOL price is now trading below $140 and might find bids near the $135 zone.

  • SOL price started a downside correction below $142 against the US Dollar.
  • The price is now trading above $135 and the 100-hourly simple moving average.
  • There is a bullish trend line forming with support at $135 on the hourly chart of the SOL/USD pair (data source from Kraken).
  • The pair could extend losses if it dips below the $135 zone.

Solana Price Starts Downside Correction

Solana price failed to surpass $145 and started a downside correction, like Bitcoin and Ethereum. SOL dipped below $142 and $140 to enter a short-term bearish zone.

There was a move below the 50% Fib retracement level of the upward wave from the $131 swing low to the $145 high. However, the bulls are active near $136. There is also a bullish trend line forming with support at $135 on the hourly chart of the SOL/USD pair.

Solana Price

Solana is now trading above $135 and the 100-hourly simple moving average. On the upside, the price is facing resistance near the $140 level. The next major resistance is near the $145 level. The main resistance could be $148. A successful close above the $148 resistance zone could set the pace for another steady increase. The next key resistance is $155. Any more gains might send the price toward the $165 level.

More Losses In SOL?

If SOL fails to rise above the $142 resistance, it could start another decline. Initial support on the downside is near the $136 zone and the 61.8% Fib retracement level of the upward wave from the $131 swing low to the $145 high. The first major support is near the $135 level and the trend line.

A break below the $135 level might send the price toward the $132 support zone. If there is a close below the $132 support, the price could decline toward the $125 support in the near term.

Technical Indicators

Hourly MACD – The MACD for SOL/USD is gaining pace in the bearish zone.

Hourly Hours RSI (Relative Strength Index) – The RSI for SOL/USD is below the 50 level.

Major Support Levels – $135 and $132.

Major Resistance Levels – $142 and $145.

Bitcoin Exchange Reserves Fall To Lowest Levels on Record: The Bullish Signal Most Traders Are Missing

Bitcoin is holding above $90,000 as the market heads into a highly anticipated FOMC meeting, a moment that could define the next direction for risk assets. But while price action keeps traders on edge, on-chain indicators are painting a surprisingly different picture beneath the surface. According to a new CryptoQuant report by XWIN Research Japan, Bitcoin’s exchange reserves have continued to fall sharply throughout 2025, even as price corrected toward the $90K range.

The data shows that the total amount of BTC held on centralized exchanges has dropped to 2.76 million BTC, reaching one of the lowest levels ever recorded. What makes this trend even more striking is its timing: during the steep November–December sell-off, exchange balances did not rise—they fell faster. The report highlights this behavior in the red-marked zone of the chart, showing accelerating outflows while the price was dropping.

This pattern signals something unusual: investors are not sending coins to exchanges to sell into weakness. Instead, they continue withdrawing BTC into long-term custody, suggesting confidence rather than capitulation. As volatility builds ahead of the FOMC decision, the contrast between short-term price fear and long-term accumulation is becoming one of the most important dynamics in the current Bitcoin market.

Shrinking Exchange Reserves Signal Structural Strength

The report emphasizes that Bitcoin’s rapidly shrinking exchange reserves carry important structural implications for the market. When fewer coins sit on centralized exchanges, it means less Bitcoin is available for immediate sale, effectively tightening the liquid supply. According to the data, this decline is not being driven by short-term speculators but by long-term holders and institutional entities steadily moving BTC into self-custody or cold storage.

Bitcoin Exchange Reserve | Source: CryptoQuant

What makes this trend remarkable is its timing. Historically, sharp price declines trigger a wave of inflows to exchanges as investors prepare to sell or panic-exit their positions. This cycle, however, tells a very different story. Even as Bitcoin corrected into the $90K region, exchange balances kept falling, suggesting that buyers with a long-term outlook are actively accumulating rather than retreating.

This divergence between price action and on-chain behavior signals underlying strength. While short-term volatility may continue—especially around macro catalysts like the FOMC meeting—the broader structure points toward a market quietly tightening its available supply. As reserves move toward historic lows, a future “supply shock” becomes increasingly plausible.

Despite the weak spot market performance, on-chain metrics are slowly turning bullish, hinting that the foundation for the next major trend may already be forming beneath the surface.

BTC Tests Critical Support as Market Awaits Direction

Bitcoin’s price action on the 3-day chart shows a market attempting to stabilize after a sharp corrective phase. BTC is currently trading around $90,437, hovering just above the 200-day moving average — a level that has historically acted as a major dynamic support during mid-cycle retracements. The recent bounce from the $87K–$88K region suggests that buyers are defending this zone, but the structure remains fragile as long as the price stays below the 50-day and 100-day moving averages, both of which are now sloping downward.

BTC consolidates around key level | Source: BTCUSDT chart on TradingView

The chart reveals a clear shift in momentum. After months of steady higher lows, Bitcoin broke its ascending structure in late November, leading to a fast drop toward the high-$80K range. Volume increased during the decline, indicating stronger participation on the sell side. However, the subsequent candles show shrinking sell volume, hinting at exhaustion among short-term sellers.

For a meaningful recovery, BTC must reclaim the $95K–$97K area, where previous support turned into resistance. Failure to break that zone would likely keep the market in a consolidation phase, with risks of another retest of the 200-day MA.

Featured image from ChatGPT, chart from TradingView.com

XRP Price Positive Streak Fades—Are Traders Bracing for Volatility?

XRP price started a decent increase above $2.150. The price is now correcting gains and might struggle to stay in a positive zone.

  • XRP price started a downside correction and tested the $2.080 zone.
  • The price is now trading above $2.050 and the 100-hourly Simple Moving Average.
  • There is a bullish trend line forming with support at $2.070 on the hourly chart of the XRP/USD pair (data source from Kraken).
  • The pair could start another increase if it clears $2.120.

XRP Price Dips Again

XRP price started a downside correction from the $2.180 zone, like Bitcoin and Ethereum. The price dipped below the $2.150 and $2.120 levels to enter a consolidation phase.

The price even dipped below the 50% Fib retracement level of the upward move from the $2.042 swing low to the $2.1778 high. However, the bulls remained active above the $2.080 support. There is also a bullish trend line forming with support at $2.070 on the hourly chart of the XRP/USD pair.

The price is now trading above $2.050 and the 100-hourly Simple Moving Average. If there is a fresh upward move, the price might face resistance near the $2.120 level.

XRP Price

The first major resistance is near the $2.150 level, above which the price could rise and test $2.180. A clear move above the $2.180 resistance might send the price toward the $2.2250 resistance. Any more gains might send the price toward the $2.250 resistance. The next major hurdle for the bulls might be near $2.2880.

More Losses?

If XRP fails to clear the $2.120 resistance zone, it could start a fresh decline. Initial support on the downside is near the $2.070 level, the 76.4% Fib retracement level of the upward move from the $2.042 swing low to the $2.1778 high, and the trend line. The next major support is near the $2.050 level.

If there is a downside break and a close below the $2.050 level, the price might continue to decline toward $2.00. The next major support sits near the $1.9850 zone, below which the price could continue lower toward $1.920.

Technical Indicators

Hourly MACD – The MACD for XRP/USD is now gaining pace in the bearish zone.

Hourly RSI (Relative Strength Index) – The RSI for XRP/USD is now below the 50 level.

Major Support Levels – $2.070 and $2.050.

Major Resistance Levels – $2.120 and $2.180.

Expert Declares Bitcoin Has Reached Midpoint Of Bear Cycle: What Lies Ahead?

During what many anticipated would be the year of a major Bitcoin (BTC) bull run, market expert Axel Adler has revealed that the leading cryptocurrency finds itself at the midpoint of a bear cycle. 

A Mild Bear Cycle Compared To History

As of now, Bitcoin has recorded a modest year-to-date decline of 4%. However, the cryptocurrency has shown some stability this week, consolidating in the range of $89,000 to $94,000, with the latter figure serving as immediate resistance. 

According to Adler, this current correction, which stands at approximately -32%, is considered less severe compared to previous bear cycles. He emphasizes that approximately 88% of Bitcoin holdings remain in unrealized profit, while only about 12% of the total supply is currently at a loss.

Adler points out that Bitcoin’s price action has remained relatively steady within the $90,000 zone, reflecting a mild drawdown in historical context. 

The crucial question as the year approaches its end is whether this correction will stabilize between -35% and -40% from its all-time high, indicating a new, more “flattened” cycle, or if the market will follow historical trends that typically lead to deeper declines of -60% to -70%.

Analyzing past cycles, Adler notes that major bear markets in 2011, 2016, 2019, and 2023 were characterized by a significant increase in the percentage of coins at a loss, often rising to around 60%. These levels typically marked capitulation points in the market. 

Bitcoin

In contrast, the current landscape shows only 12% of holders experiencing unrealized losses, which diverges sharply from the patterns observed during past bear markets.

Can Bitcoin Avoid Deeper Declines?

The expert further noted that during recent local cycle peaks, only about 17% of coins were in the red, a figure that remains three to four times lower than traditional capitulation levels. 

This unusual configuration suggests that the current market may resemble a correction within a bullish supercycle rather than the final downturn of a full-blown bear market.

Adler believes that the market appears to be testing the resilience of this correction structure, which stands at -32% from its peak, while maintaining a high ratio of profitable positions. 

He argues that if Bitcoin can sustain this maximum drawdown above the -35% zone alongside moderate unrealized losses, it could bolster the case for a shift towards more “flat” corrections influenced by institutional demand and a structural supply deficit.

On the contrary, should Bitcoin’s correction extend beyond the -40% mark, the likelihood of entering a classic bear market increases significantly. Such a scenario would pave the way for deeper declines, potentially reaching the -60% to -70% range, and could trigger a full capitulation phase in terms of unrealized loss metrics.

Bitcoin

At the time of writing, the market’s leading cryptocurrency is trading at $93,000, marking gains of 5% and nearly 9% in the 24-hour and 14-day time frames, respectively.

Featured image from DALL-E, chart from TradingView.com 

Ethereum Smashes Resistance—Bitcoin Left Behind as Momentum Flips Bullish

Ethereum price started a fresh increase above $3,250. ETH is now consolidating gains and might aim for more gains if it clears the $3,380 resistance.

  • Ethereum started a fresh increase above the $3,200 and $3,250 levels.
  • The price is trading above $3,200 and the 100-hourly Simple Moving Average.
  • There is a bullish trend line forming with support at $3,210 on the hourly chart of ETH/USD (data feed via Kraken).
  • The pair could continue to move up if it settles above the $3,350 zone.

Ethereum Price Rallies Over 8%

Ethereum price managed to stay above $3,000 and started a fresh increase, beating Bitcoin. ETH price gained strength for a move above the $3,120 and $3,250 resistance levels.

The bulls even pushed the price above $3,350. However, the bears were active below $3,400. A high was formed at $3,396 and the price is now consolidating. There was a minor drop below the 23.6% Fib retracement level of the upward wave from the $3,094 swing low to the $3,396 low.

Ethereum price is now trading above $3,200 and the 100-hourly Simple Moving Average. There is also a bullish trend line forming with support at $3,210 on the hourly chart of ETH/USD.

Ethereum Price

If there is another upward move, the price could face resistance near the $3,320 level. The next key resistance is near the $3,350 level. The first major resistance is near the $3,380 level. A clear move above the $3,380 resistance might send the price toward the $3,420 resistance. An upside break above the $3,420 region might call for more gains in the coming days. In the stated case, Ether could rise toward the $3,500 resistance zone or even $3,550 in the near term.

Pullback In ETH?

If Ethereum fails to clear the $3,380 resistance, it could start a fresh decline. Initial support on the downside is near the $3,250 level and the 50% Fib retracement level of the upward wave from the $3,094 swing low to the $3,396 low. The first major support sits near the $3,210 zone.

A clear move below the $3,210 support might push the price toward the $3,150 support. Any more losses might send the price toward the $3,050 region. The next key support sits at $3,000.

Technical Indicators

Hourly MACDThe MACD for ETH/USD is gaining momentum in the bullish zone.

Hourly RSIThe RSI for ETH/USD is now above the 50 zone.

Major Support Level – $3,210

Major Resistance Level – $3,380

Will The Crypto Market Benefit From The Trump Fed Takeover?

The prospect of a “Trump Fed takeover” is rapidly becoming a central macro theme for 2026, with some traders arguing that markets still underestimate how radical the shift could be for global liquidity – and by extension for crypto.

Macro commentator plur daddy (@plur_daddy) describes it bluntly via X: “The Trump Fed takeover being underpriced is my primary theme going into 2026 (hence my gold bet). This is a momentous shift: the bigger and more convex the catalyst, the more difficult it is for markets to price it in properly.”

Former Fed trader Joseph Wang known as “Fed Guy” echoes the concern from inside the plumbing, warning: “The market underestimates the likelihood of a Trump Fed. The Administration is showing resourcefulness and determination for lower rates. That could set off the blow off top in equities, where implied vol shows speculation still has room to run.”

The Trump Fed Takeover Isn’t Price In

That determination is colliding with a bond market that appears to be pushing back via term premium. Plur highlights the spread between the 12-month T-bill and the 10-year Treasury as a clean gauge of that tension. He notes that the spread “peaked right before inauguration on the generic ‘Trump will run it hot’ viewpoint,” then “got crushed lower as DOGE and Tariffs got priced in.” It bottomed near the tariff lows and “is now back to the highs,” a pattern he reads as term-premium expansion as “a form of protest to [Kevin] Hassett,” Trump’s presumed Fed pick.

Against that backdrop, the administration still has powerful tools to compress term premium without formally announcing quantitative easing. Plur identifies three levers. First, de-regulating banks so they are allowed – in practice, pressured – to hold more Treasuries, boosting structural demand for government paper.

Second, reducing the Treasury’s weighted-average maturity by shifting issuance “to bills over longer dated notes,” which cuts the duration the market has to absorb. Third, specifically for mortgages, “lever up the GSEs to buy MBS,” narrowing mortgage spreads and transmitting easier policy to the housing market even if the policy rate moves more slowly. He argues that “all of these are quite bullish for risk overall but will take time to play out.”

For now, the environment remains awkward for directional risk bets, including crypto. “In the meantime, it has been a choppy and difficult market, across the board. Equity indices have grinded higher but the underlying rotations have been tricky to navigate. QT ended but liquidity is still relatively thin, and the fact that we are going into year end does not help. Better times will come.”

The bullish pivot in his framework arrives with the calendar. “In the new year, fiscal accommodation will re-expand on the implementation of OBBBA (+$10–15bn/mo). Meanwhile we have sell-side macro teams calling for $20–45bn/mo in T-bill repurchasing by the Fed, as soon as Jan 1.”

This mix would directly ease pressures visible in funding markets: “This would go a long way towards easing the current liquidity issues (see the SOFR–IORB spread chart below). This is not classic QE in that there is very little duration being absorbed from the private sector, and mainly has the effect of expanding bank reserves. This is still bullish because bank reserves are tight at the time, which is tied to the repo liquidity issues.”

Will The Crypto Market Rise Again?

On that basis, Plur expects the macro backdrop in 2026 to look “better than H2 ’25 has been, perhaps more on par with parts of 2024.” His expression of the trade is clear: “This should be enough for strong performance on gold given the Fed takeover angle, and continued melt-up in equities and select commodities.”

For Bitcoin and the broader crypto market, however, his stance is notably more cautious. “For BTC it is more difficult to say. My base case continues to be a frustrating period of chop and re-accumulation.” Improved liquidity “should be favorable for BTC,” but he questions whether there will be “a material shift in the supply/demand imbalances we have been seeing,” concluding: “I will keep watching it for now.”

In other words, the Trump Fed trade is already driving high-convexity bets in gold, equities and commodities. Crypto stands to benefit indirectly from easier reserves and lower term premium, but in this framework, the key constraint is no longer just macro liquidity – it is whether fresh demand is strong enough to meet an increasingly inelastic supply in the crypto market.

At press time, the total crypto market cap stood at $3.05 trillion.

Total crypto market cap

Bitcoin Price Shows Fresh Strength—Could This Spark a Rapid Rally?

Bitcoin price started a decent increase above $92,000. BTC is now consolidating gains and might aim for another increase if it clears $93,400.

  • Bitcoin started a downside correction from the $94,500 zone.
  • The price is trading above $92,000 and the 100 hourly Simple moving average.
  • There is a bullish trend line forming with support at $91,500 on the hourly chart of the BTC/USD pair (data feed from Kraken).
  • The pair might continue to move up if it settles above the $93,400 zone.

Bitcoin Price Holds Support

Bitcoin price managed to stay above the $91,000 zone and started a fresh increase. BTC gained strength for a move above the $92,500 and $94,000 levels.

However, the bears were active near $94,500. A high was formed at $94,583 and the price recently corrected some gains. There was a drop toward the 50% Fib retracement level of the upward move from the $89,545 swing low to the $94,583 high.

However, the bulls were active near the $92,000 support. Bitcoin is now trading below $92,000 and the 100 hourly Simple moving average. Besides, there is a bullish trend line forming with support at $91,500 on the hourly chart of the BTC/USD pair.

Bitcoin Price

If the bulls remain in action, the price could attempt another increase. Immediate resistance is near the $92,800 level. The first key resistance is near the $93,200 level. The next resistance could be $94,000. A close above the $94,000 resistance might send the price further higher. In the stated case, the price could rise and test the $94,500 resistance. Any more gains might send the price toward the $95,500 level. The next barrier for the bulls could be $96,200 and $96,500.

More Losses In BTC?

If Bitcoin fails to rise above the $94,000 resistance zone, it could start another decline. Immediate support is near the $92,000 level. The first major support is near the $91,500 level and the 61.8% Fib retracement level of the upward move from the $89,545 swing low to the $94,583 high.

The next support is now near the $90,750 zone. Any more losses might send the price toward the $90,000 support in the near term. The main support sits at $88,800, below which BTC might accelerate lower in the near term.

Technical indicators:

Hourly MACD – The MACD is now gaining pace in the bullish zone.

Hourly RSI (Relative Strength Index) – The RSI for BTC/USD is now above the 50 level.

Major Support Levels – $92,000, followed by $91,500.

Major Resistance Levels – $93,200 and $94,000.

Institutions Scoop Up 9,000 Ether, Fueling Bullish Signals

Ethereum saw a flurry of big moves that traders say could matter for its next price swing. In just a few hours, major accounts pulled large sums off an exchange and big wallets opened sizable margin longs. Market watchers are parsing those moves for clues.

Institutions Shift Big Stakes

According to Arkham Intelligence, Amber Group and Metalapha pulled out 9,000 Ether from Binance in a short span, a haul worth more than $28 million at current prices.

Based on reports, institutional flows have been heavy for months — nearly 4 million ETH has been accumulated by institutions over five months. Those kinds of transfers are often linked to custody setups or long-term holdings rather than quick trades.

Whales Add Margin Bets

Several large wallets added roughly $426 million in margin long exposure. Wallets named 1011short and Anti-CZ are among the accounts that expanded long bets.

That kind of activity raises the chance of sharper moves in either direction: if prices rise, longs can feed a rapid upswing; if a pullback hits, forced selling could amplify losses. Market structure is tighter now than it was several months ago.

🚨 INSTITUTIONS ARE ACCUMULATING $ETH ~ QUIETLY.

In the last few hours:

• Amber Group withdrew 6,000 ETH ($18.8M) from Binance • Metalapha withdrew 3,000 ETH ($9.4M)

That’s 9,000 ETH pulled off exchanges in a single morning.

This is the same pattern we’ve seen for weeks:… pic.twitter.com/MBgyXoPfJz

— BMNR Bullz (@BMNRBullz) December 8, 2025

Available Supply Shrinks

On-chain data shows only 8.7% of ETH is currently held on exchanges. More than 28 million ETH is locked up in staking, custody, and what reports call long-term storage.

Staking inflows remain high, with over 40,000 ETH added per day on average. Less supply on exchanges can lower immediate selling pressure, making price swings more dependent on fresh buy orders.

Price Range And Key Levels

Ethereum has gained 2.5% in the last 24 hours and is trading near $3,050. According to an analyst’s chart, ETH has been moving inside a tight range between $3,050 and $3,200, with $3,100 acting as a support line.

Traders say a clear break above the $3,300–$3,400 band could open the way toward $3,700 to $3,800. Failure at that resistance would likely push prices back toward $3,000, where buyers may step in again.

Regulatory Step Could Matter

In a related development, the US Commodity Futures Trading Commission has launched a pilot that allows Ethereum, USDC and Bitcoin to be used as collateral in regulated derivatives venues.

Acting Chair Caroline Pham unveiled the plan in Washington and said the move will let regulators observe how tokenized collateral behaves in stressed conditions.

The program sets rules for custody, segregation, and valuation tests inside a controlled environment.

Featured image from Unsplash, chart from TradingView

Bitcoin Treads Water At $90,000 — Market Braces For FOMC To End The Compression Phase

Bitcoin is currently holding steady, trading water around the critical $90,000 level as the market enters a period of high compression. With ETF inflows slowing down, the price lacks the momentum to break through overhead resistance. The highly anticipated FOMC meeting is expected to provide the necessary catalyst to end the current consolidation and dictate Bitcoin’s next major directional move.

BTC Compression Intensifies: Scaling Back Intraday Scalps

According to a recent update from Lennaert Snyder, Bitcoin continues to tighten within a compression phase. The market has been trading in an increasingly narrow range, signaling that a larger move is approaching. Snyder noted that the scalp long and short setups from his previous analysis played out well.

He explained that as compression increases, the reward-to-risk ratio naturally declines. While the trades were profitable, they still fell into the category of “C-setups,” meaning they lacked the cleaner momentum and clarity found at range boundaries. Snyder emphasized that the best trading opportunities always emerge at the edges of a range.

With the current setup, his focus remains on the key resistance area around $94,000. A breakout above that level could offer long opportunities, while a failure there may open the door for shorts. On the downside, if price sweeps the lows and returns to the $87,400 support region, long entries are likely following signs of reversal.

Bitcoin

However, he added that if Bitcoin fails to show strength during this phase, he is not eager to take new long positions. A deeper retest of the $83,200 zone could become the next area of interest, though he expects any move toward that level to come with a liquidity sweep. 

Snyder also mentioned that he remains in shorts as a hedge, with scalp shorts still acceptable for traders who understand the increased risk at this stage. He concluded by highlighting the importance of the upcoming FOMC meeting, noting that the market is likely to stay muted until then.

Upcoming FOMC Meeting Dictates Bitcoin’s Next Major Move

Analyst Ted, in a recent update, revealed that BTC is currently in a state of consolidation around the $90,000 level. This tight range-bound movement suggests that while selling pressure is not dominant, buyers are also struggling to push the price higher aggressively.

Ted attributed the market’s current stagnation and its inability to break above major resistance levels to a slowdown in institutional investment. Specifically, he noted that recent ETF inflows have slowed down, removing a major source of directional buying pressure that typically drives breakouts.

Furthermore, the analyst highlighted that a critical macroeconomic event is pending: the FOMC meeting is scheduled for tomorrow, and the market’s next significant directional move will be heavily dependent on the outcome.

Bitco0in

Dogecoin Stabilizes Above Key Support as Adoption Rises and Long-Term Outlook Strengthens

Dogecoin (DOGE) is, in another consecutive week, settling into a familiar pattern: holding firm at a crucial support zone while market participants weigh technical signals, shifting adoption trends, and the ever-present influence of its community.

As the token trades around $0.14, its price behavior reflects a broader phase of consolidation, characterized by tighter volatility and increasing on-chain engagement. With new real-world use cases emerging and traders watching for a breakout, DOGE’s long-term trajectory is becoming a point of renewed discussion.

Dogecoin DOGE DOGEUSD DOGEUSD_2025-12-09_12-33-27

Network Activity Strengthens as Dogecoin Price Holds Key Support

Despite muted market reaction to Dogecoin’s 12th anniversary, activity on the network continues to rise.

Daily active addresses reached over 67,000 earlier in December, marking the second-highest level in three months. This increase comes as DOGE repeatedly defended the $0.14 support, forming a tight compression range between $0.1406 and $0.1450.

Short-term charts indicate multiple rebounds from the $0.14 level, accompanied by decreasing sell volume, an early sign of accumulation.

Analysts identify $0.16 as the threshold that would shift DOGE from range-bound movement into a potential trend continuation. Failure to hold support, however, could expose deeper downside toward $0.081, an area highlighted by realized on-chain distribution clusters.

Adoption Expands Beyond Market Narratives

Recent developments show Dogecoin slowly expanding beyond its memecoin label. In Argentina, certain taxes can now be paid using DOGE, while Alternative Airlines has begun accepting the token for ticket purchases. These integrations, although still modest, indicate real-world traction that supports a longer-term use case narrative.

Broader sentiment, however, remains closely tied to macroeconomic conditions. Analysts note that liquidity trends, regulatory developments, and institutional risk appetite continue to shape DOGE’s outlook.

The launch of the first Dogecoin ETF in November drew little initial inflow, signaling that large investors remain cautious despite the token’s growing visibility.

Long-Term Structure Points to Potential Upside

From a structural standpoint, Dogecoin continues to follow a multi-year pattern that some analysts view as constructive. Long-term charts show price action moving within a large triangle formation dating back to 2021, with a cup-and-handle structure still intact on higher timeframes.

Weekly RSI levels near 50 resemble conditions seen before DOGE’s 2021 rally, while MACD indicators approach bullish crossovers on both weekly and monthly charts.

Forecasts place Dogecoin’s path toward $1 as a possibility later in the decade, with projections suggesting a climb toward that level by 2030. In the near term, the $0.145–$0.16 zone remains the defining barrier that could determine whether DOGE transitions into a stronger upward phase or remains confined to its current band.

As Dogecoin stabilizes above key support and real-world adoption increases, traders are closely watching for the next catalyst, whether it be network expansion, macroeconomic shifts, or renewed community-driven momentum.

Cover image from ChatGPT, DOGEUSD chart from Tradingview

Crypto Market Structure Talks: Senator Lummis Addresses Latest Legislation Plans

Senators engaged in bipartisan discussions regarding the anticipated crypto market structure bill met on Tuesday amid ongoing disagreements about the timing of a committee vote on the legislation. 

According to a report from Politico, Sen. Cynthia Lummis, a key negotiator for the Republican side, expressed optimism that a new draft of the bill could be released this week. 

Lummis aims to have the bill ready for markup before Congress adjourns for the holiday break, stating, “Knock on wood, I hope to share a draft at the end of this week that reflects our best efforts to date.”

Lummis Urges Swift Progress On Crypto Legislation

During a panel discussion hosted by the Blockchain Association, Sen. Lummis emphasized the urgency of progressing with the legislation. She remarked that it might be advantageous for lawmakers to finalize a product and proceed with the markup next week, allowing everyone to take a break for the Christmas holidays. 

In related developments, Politico reported that Senate Banking Republicans submitted a proposal to their Democratic counterparts last week, suggesting over 30 amendments to a previous draft of the legislation. 

The three-page document, which comes from GOP senators on the Banking Committee, seeks to maintain certain elements of the original bill while incorporating adjustments acceptable to Democratic lawmakers.

Senate Banking Committee Chair Tim Scott and other Republicans are eager to finalize the markup next week, although some Democrats have expressed skepticism about this ambitious timeline. Following a meeting on Monday, Democrats sent a response to the GOP offer, but details of their feedback remain unclear.

Concessions In GOP’s Proposal 

The GOP’s proposal outlines the aspects from a September crypto market structure framework that they agree to integrate into a bipartisan bill, hoping to reconcile differences with their Democratic colleagues. 

The proposal includes a two-column table delineating 38 concessions the Republicans are willing to make, in exchange for retaining or modifying 32 sections of the original Responsible Financial Innovation Act discussion draft.

Among the concessions is language that reflects White House approval, which could address Democratic concerns regarding appointments to the Securities and Exchange Commission (SEC) and the Commodity Futures Trading Commission (CFTC). 

Additionally, the proposal contains ethics provisions aimed at addressing scrutiny over the Trump family’s business connections in the crypto sector. 

However, Lummis noted a previous ethics proposal she negotiated with Sen. Ruben Gallego was rejected by the White House, and she plans to collaborate further with Democrats to revisit the issue.

Other notable concessions from the Republicans include a section on consumer protection standards for digital assets, proposed language regarding bankruptcy, the establishment of a federal baseline for crypto ATMs, and risk management standards for digital asset intermediaries. 

Crypto

Featured image from DALL-E, chart from TradingView.com 

Ethereum Sees Largest Binance Inflow Since 2023 – Warning Sign?

Ethereum has spent the past several days consolidating in a tight range between $3,000 and $3,200, signaling a moment of hesitation as the broader market struggles to find direction. Despite attempts to push higher, momentum has flattened, and uncertainty continues to dominate sentiment. Many analysts now warn that Ethereum may be entering a deeper bearish phase, pointing to weakening spot demand, fragile market structure, and fading optimism across major exchanges.

However, one on-chain development has captured the market’s attention. According to new data from CryptoQuant, December 5, 2025 saw a massive spike in Ethereum Exchange Netflow to Binance, marking one of the largest daily inflows in years. Such a surge typically raises questions about investor intentions: large inflows often signal that holders are moving ETH onto exchanges with the potential to sell, increasing the probability of short-term volatility or downside pressure.

Yet the broader context matters. Ethereum’s price remains above key support, suggesting that the market is in a critical decision zone rather than a confirmed breakdown. This combination of consolidation, rising caution, and an unusually large exchange inflow sets the stage for what could become a pivotal moment for ETH as traders prepare for the next major move.

Massive Netflow Surge Raises Caution for Ethereum

According to data from CryptoOnchain shared on CryptoQuant, Ethereum experienced a striking shift in exchange activity on December 5, 2025. The netflow to Binance reached 162,084 ETH while the price hovered near $3,021, marking the largest daily positive netflow since May 2023. Such an influx is significant, not only because of its size but because of what it typically signals: a rise in the number of investors moving ETH from self-custody to exchanges.

Ethereum Exchange Netflow on Binance | Source: CryptoQuant

Historically, large positive netflows are interpreted as potentially bearish, suggesting that holders may be preparing to sell or rebalance. When deposits drastically outweigh withdrawals, it can precede heightened selling pressure, especially when the market is already in a fragile state. Inflows of this magnitude can act as a temporary supply shock; if even a portion of this ETH hits the order books as market sells, the price could face increased volatility or short-term corrective pressure.

Because of this, traders should closely monitor how Binance absorbs this liquidity. Watching order book depth, open interest reactions, and subsequent netflow patterns will reveal whether this was a one-off spike or the beginning of a broader shift in investor behavior. In a market this delicate, even a single inflow event can set the tone for the days ahead.

ETH Price Attempts Stabilization

Ethereum’s daily chart shows a market in the process of stabilizing, but still weighed down by significant structural resistance. After dipping below $2,800 in late November, ETH has managed to reclaim the $3,100 region, where it has been consolidating for several days. This range-bound behavior signals a pause in the prior downtrend, yet the recovery lacks the strong momentum typically seen in bullish reversals.

ETH consolidates between key levels | Source: ETHUSDT chart on TradingView

The 50-day and 100-day moving averages remain positioned above the current price, forming a clear zone of resistance between $3,250 and $3,500. These declining MAs highlight that the broader trend still favors sellers, and ETH will need a decisive breakout above them to shift market sentiment. The 200-day MA, sitting higher, reinforces the idea that Ethereum is still trading below its long-term trend structure.

Volume has also weakened during this rebound, suggesting that buyers are hesitant to commit aggressively at current levels. The recent spike in exchange netflows adds another layer of caution, raising the possibility of increased near-term selling pressure.

ETH is showing early signs of stabilization, but the path forward requires stronger conviction. Until price breaks above the cluster of moving averages, this recovery remains fragile and vulnerable to renewed downside pressure.

Featured image from ChatGPT, chart from TradingView.com

Bitcoin Addresses Holding Over 0.1 BTC Haven’t Grown in Two Years, What Does This Mean?

Since Bitcoin’s launch, the number of addresses holding more than 0.1 BTC has climbed steadily through every market cycle, until now. Data shows that addresses in this cohort haven’t grown at all over the past two years, breaking a trend that held for more than a decade. 

The stagnation indicates a change in how smaller and mid-sized investors engage with Bitcoin, even as broader institutional activity in the market continues to rise.

Small Holder Participation Reaches A Standstill

The 0.1 BTC threshold has historically represented an important milestone for retail holders, large enough to signal commitment but small enough to remain widely attainable. For more than a decade, wallets crossing that line grew year after year, even during drawdowns when long-term buyers were accumulating quietly.

That pattern is no longer intact. The number of addresses with more than 0.1 BTC has flattened since 2023 and is showing no signs of returning to its previous trajectory. Particularly, data from the on-chain analytics platform Santiment shows that the number of these addresses has stalled at around 4.44 million for the past year. This suggests that fewer new participants are choosing to build self-custodied Bitcoin positions at this level.

Bitcoin

The stagnation becomes more notable considering Bitcoin’s rising mainstream visibility and repeated pushes toward new all-time highs this year. In earlier cycles, such conditions have led to a surge in retail accumulation. This time, the address count has stayed frozen, and this means retail addresses holding Bitcoin might actually be plateauing. 

How Bitcoin’s Holder Base Is Changing

Although on-chain data points to a slowdown in the growth of overall Bitcoin addresses holding more than 0.1 BTC, it doesn’t necessarily signal a decline in overall adoption. For many market participants, Bitcoin exposure now happens entirely off-chain.

Larger investor cohorts, from high-net-worth individuals to funds and corporate entities, are buying huge amounts of Bitcoin. For instance, Santiment data shows that large Bitcoin holders controlling more than 100 BTC have increased their balances throughout 2024 and 2025, even as smaller address cohorts have stalled.

At the same time, more investors are choosing to access Bitcoin through custodial avenues instead of managing their own wallets. Spot Bitcoin ETFs have become one of the most important gateways for new BTC exposure. In the US alone, Spot Bitcoin ETFs now control almost $120 billion worth of Bitcoin, with BlackRock’s IBIT consistently recording the strongest demand. 

Together, these developments point to a new phase in Bitcoin’s development. What was once dominated by individual self-custodied users is now increasingly shaped by institutions, ETFs, funds, and professionally managed capital. Therefore, the numbers from on-chain wallet metrics reflect a smaller portion of the actual user base.

Bitcoin

Circle Gains Major Regulatory Foothold in UAE With ADGM License to Scale Stablecoin Adoption

Circle’s slow but steady expansion into the Middle East has taken a decisive step forward, as the USDC issuer secured a Financial Services Permission (FSP) license from Abu Dhabi Global Market (ADGM).

The move positions the company at the center of the UAE’s growing digital-asset ecosystem, strengthening its ability to scale stablecoin adoption across the region.

For a market actively developing clearer regulatory frameworks and attracting global crypto players, Circle’s entry underscores the central role stablecoins have come to play in payment infrastructure and cross-border finance.

Circle Ethereum ETH ETHUSD ETHUSD_2025-12-09_12-58-28

Circle Secures ADGM Approval and Expands Regional Strategy

The license, granted by ADGM’s Financial Services Regulatory Authority, permits Circle to operate as a regulated Money Services Provider within the financial free zone.

This follows preliminary approval earlier this year and gives the firm formal permission to offer USDC-powered payment, settlement and on-chain financial tools to businesses and institutions across the UAE.

Alongside the approval, Circle appointed Dr. Saeeda Jaffar as managing director for the Middle East and Africa. A long-time payments executive with leadership experience at Visa and major consulting firms, she will guide Circle’s expansion efforts, deepen local partnerships, and help integrate USDC into regional prospects.

Her appointment reflects Circle’s intent to localize operations and strengthen ties with banks, enterprises, and government entities.

UAE Supports Push Toward Regulated Digital Finance

Circle’s regulatory milestone comes as the UAE increases its efforts to build an institutional-grade digital asset ecosystem. ADGM and Dubai’s DIFC have both issued stablecoin and token frameworks designed to offer clarity for companies operating in the sector.

USDC and EURC were recognized earlier this year under Dubai’s crypto token regime, providing Circle with visibility across both major financial zones in the country.

The approval also coincides with a wave of regulatory progress for other major players. Binance received full authorization to operate its global platform under ADGM oversight this week, while Tether secured recognition for USDT across multiple blockchain networks.

These developments show how Abu Dhabi is positioning itself as a global hub for regulated stablecoin activity, driven by remittance demand, trade flows, and a growing emphasis on compliance.

Stablecoin Adoption Enters New Phase

The UAE’s structured approach comes at a time when stablecoins are gaining broader acceptance in global finance.

With regulatory guardrails expanding internationally and stablecoins increasingly used for cross-border payments, Circle’s license opens the door for wider USDC adoption in corporate finance, developer applications, and digital-asset settlement.

Related Reading: Bitcoin Speculation Muted: Glassnode Analyst Calls Perps A ‘Ghost Town’

For Circle, the ADGM license marks a pivotal foothold in one of the world’s fastest-moving regulatory environments. For the UAE, it reinforces an ambition to lead in compliant digital-asset innovation while shaping standards for a rapidly evolving sector.

Cover image from ChatGPT, ETHUSD chart from Tradingview

Bitcoin Sees Largest Annual Exchange Drop: Over 400,000 Coins Gone

Bitcoin’s on-exchange supply has dropped sharply, and traders are taking note. According to Santiment, more than 403,000 BTC have left exchanges since December 7, 2024 — roughly 2% of Bitcoin’s total supply.

That shift, measured against an on-exchange balance of about 2.11 million BTC in late November, is being seen as a sign that fewer coins are poised for quick sale.

Exchange Balances Shrink

Santiment said lower exchange balances have historically been linked with fewer sudden sell-offs, an observation many market watchers find encouraging.

The math is straightforward: when a big chunk of supply sits outside exchanges, there is less immediately available stock to meet selling pressure.

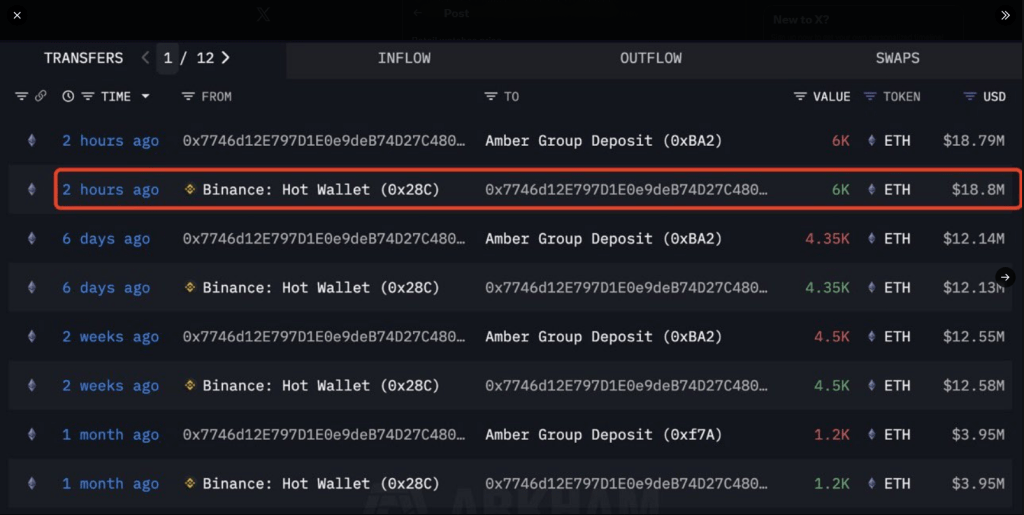
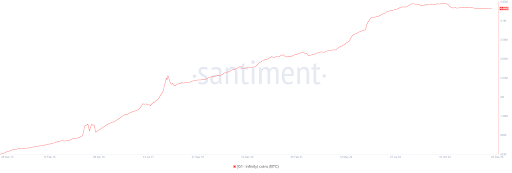
📊 As Bitcoin’s market value hovers around $90K, crypto’s top market cap continues to see its supply moving away from exchanges. Over the past year, there has been:

📉 A net total of -403.2K $BTC moving off exchanges 📉 A net reduction of -2.09% of $BTC‘s entire supply moving… pic.twitter.com/Y0JTC880Np

— Santiment (@santimentfeed) December 8, 2025

Institutions Step In

Based on reports from BitcoinTresuries.Net and others, exchange outflows are not only going to private cold wallets. ETFs and public firms are also accumulating.

BitBo lists ETFs holding over 1.5 million BTC and public companies holding over 1 million. Combined, those holdings represent nearly 11% of the total Bitcoin supply.

According to analysts, institutional vehicles have quietly absorbed a lot of coins, changing where Bitcoin sits and who can sell it.

Supply Moves Matter

This is more than bookkeeping. Coins locked in institutional or self-custodied vaults are not sold on a whim. That makes available supply tighter.

At the same time, coins leaving exchanges can lead to sharper price moves when demand surges because the pool of sellable coins is smaller. Some of the effects are already visible on price charts; others may show up later if buying pressure picks up.

Price Action And Macro Focus

Bitcoin traded near $90,650 with a small rise of 0.28% in recent action. Year-to-date gains stand at 11%. The market swung from a daily low of $89,540 to a high of $92,290, showing active trading around current levels.

Traders are watching a Federal Reserve meeting closely, and the outcome is expected to drive short-term volatility. Interest-rate cues often move broader markets, and crypto is no exception.

Market Outlook And Risks

Overall, the move off exchanges looks like a bullish backdrop because it reduces immediate selling liquidity. Still, that same scarcity can make prices more sensitive to changes in demand, which raises the possibility of sharper swings.

Analysts will be watching whether ETFs and public firms continue to add to their holdings or start to slow down purchases.

Featured image from Unsplash, chart from TradingView

Bitcoin In An Opportunity Zone? Hash Ribbons Flash New Buy Signal

On-chain data shows the popular Bitcoin Hash Ribbons indicator has just given a miner capitulation signal. Here’s what this could mean.

Bitcoin Hash Ribbons Now Signaling Miner Stress

As pointed out by CryptoQuant author Darkfrost in an X post, the Bitcoin Hash Ribbons have shown a crossover that has historically corresponded to rising stress among the miners. The Hash Ribbons indicator aims to gauge the situation of the miners by comparing the 30-day and 60-day moving averages (MAs) of the BTC Hashrate, a metric that measures the total amount of computing power that the validators as a whole have connected to the blockchain.

The trend in the Hashrate can act as a representation of the sentiment among the miners, as they usually expand computing power (an increase in the Hashrate) when mining is profitable and/or they believe BTC is heading toward a bullish outcome, while they decommission mining rigs (a drop in the Hashrate) when they are having a hard time breaking even.

The Hash Ribbons indicator basically captures shifts between these two behaviors. When the 30-day ribbon falls below the 60-day one, it means miners are reducing power at a fast rate. This can be a sign that this group is going through capitulation.

Such a crossover has recently formed again for Bitcoin, as the chart below shared by Darkfrost shows.

Bitcoin Hash Ribbons

Thus, it would appear that miners are once again in a phase of capitulation. “Historically, these periods of mining stress have been profitable for Bitcoin investors, with one exception during the 2021 mining ban in China,” noted the analyst.

The signal doesn’t act as a straightforward buy indicator, however, as mining capitulation often doesn’t directly coincide with a bottom. “In the short term, these periods tend to be bearish because miners may need to increase their selling to cover production costs,” explained Darkfrost.

In general, miner capitulation periods have tended to lead into profitable buying windows for the cryptocurrency, although it’s unpredictable how long such a phase would last. From the chart, it’s apparent that sometimes the Hash Ribbons signal has been quite brief, while other times it has been maintained for weeks.

As for what has forced miners to turn off Hashrate recently, the answer likely lies in the bearish trajectory that Bitcoin has witnessed. Miners obtain their reward in BTC denomination, so how the USD value of the coin fluctuates directly affects their dollar revenue.

Before this, miners had been in a phase of rapid expansion alongside the bull rally, which had led to an explosion in the network’s mining Difficulty. With the price plummeting and Difficulty being at extraordinary levels, miners have faced a double whammy during the past month.

BTC Price

Bitcoin saw a recovery above $92,000 on Monday, but it would appear that the asset wasn’t able to maintain it, as its price is now back at $90,300.

Bitcoin Price Chart

❌