Reading view

There are new articles available, click to refresh the page.

Can Bitcoin Price Still Hit $140,000? What The Global M2 Money Supply Says

The Bitcoin price outlook remains under scrutiny as market analysts assess whether the world’s largest cryptocurrency can still reach $140,000. Given BTC’s recent downturn and fluctuating price, it’s understandable that a dramatic surge to $140,000 could be viewed skeptically. However, the analyst points to global M2 Money Supply, highlighting its correlation with Bitcoin and its support for a significant upside move.

New discussions have emerged in the crypto space about the relationship between the Bitcoin price action and the global M2 Money Supply. Pseudonymous crypto analyst ‘MoneyLord’ has projected a massive price surge to $140,000 for BTC based on M2 data. The analyst noted that many people are skeptical about the relevance of M2 Money Supply, likely questioning whether it still holds predictive value for Bitcoin’s performance.

Global M2 Money Supply To Fuel $140,000 Bitcoin Price Surge

According to MoneyLord, the recent disconnect between Bitcoin and M2 data should not be viewed as a failure of the model, but rather as a consequence of aggressive market interference and increased stress across global financial systems. In his technical report released on X, he argued that, without heavy manipulation and the collapse and insolvency of major entities, Bitcoin would have continued to track global liquidity growth.

Related Reading: Is It More Profitable To Hold Bitcoin For The Short-Term? 2025 Numbers Are Here

MoneyLord believes that those shocks temporarily suppressed BTC’s price expansion, likely contributing to its recent decline and slow momentum. With market conditions somewhat stabilizing, the analyst suggests that Bitcoin is poised to realign with global M2 Money Supply trends, potentially setting the stage for renewed upward momentum. 

Bitcoin

From this perspective, the current phase is viewed as a delayed reaction rather than a failed cycle. MoneyLord predicts that if Bitcoin begins to catch up with M2 data, the cryptocurrency’s price could hit a target above $140,000 sooner than the market expects. The accompanying chart illustrates this bullish outlook, showing global liquidity, represented by the blue line, continuing to rise toward the projected price. 

With Bitcoin trading near $90,000 after a more than 6% decline this month, a rally to $140,000 would require a gain of at least 55%. Reaching this level would set a new all-time high, exceeding its present peak of over $126,000 by more than 10%. 

Bitcoin Shows Resilience Amid Market Sell-Offs

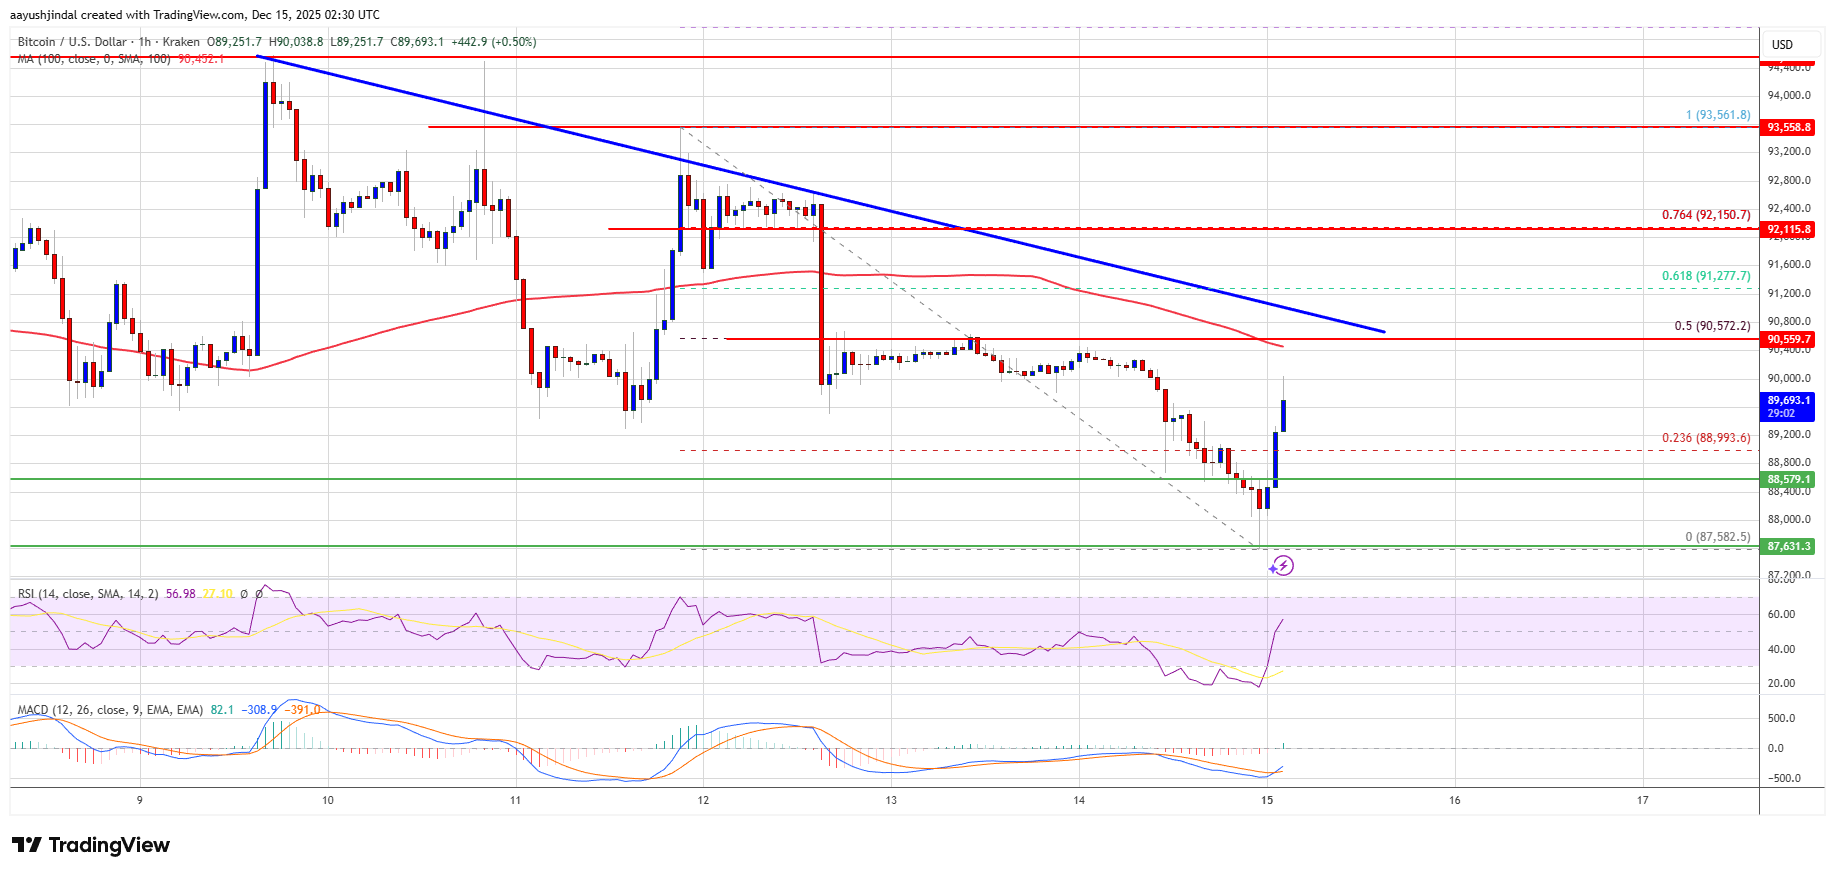
According to crypto analyst Don, Bitcoin has bounced back after a period of sharp sell-offs that shook out many traders and triggered widespread liquidations. The analyst noted that bulls have stepped in to reclaim critical support and restore confidence in the market as BTC resumes trading within a well-defined ascending triangle pattern

The chart shows that the triangle has an upper boundary near $94,324 and a lower boundary around $89,241. Price action inside the formation suggests that Bitcoin is consolidating and likely building momentum for a potential breakout. 

Bitcoin

Market Stress Continues As Bitcoin STH SOPR Dips Below 1– When Will The Pain End?

Bitcoin continues to struggle below the $90,000 level, failing to reclaim key resistance as bulls attempt to defend current demand zones. Price action reflects a market under pressure, with momentum fading after a prolonged correction. From its all-time high, Bitcoin has now retraced roughly 30%, placing the asset firmly in a corrective phase where uncertainty and caution dominate trading behavior.

According to a report from Axel Adler, on-chain data confirms that market stress is no longer limited to price alone. Two key indicators—the Short-Term Holder Spent Output Profit Ratio (STH SOPR) and the P/L Block—are signaling broad loss realization among participants and a deterioration in overall market sentiment.

These metrics provide insight into the behavior of short-term holders, who are often the most sensitive to price swings and macro uncertainty. Together, these signals suggest that Bitcoin remains in a fragile state, where confidence has weakened, and recovery attempts face increasing resistance.

STH SOPR and P/L Block Confirm Capitulation Pressure

Adler explains that the Short-Term Holder Spent Output Profit Ratio (STH SOPR) measures whether coins held for less than 155 days are being sold at a profit or a loss. When the indicator falls below one, it signals that recent buyers are realizing losses.

Currently, the 7-day moving average of STH SOPR has slipped into the red zone, with a reading near 0.99. This confirms that short-term holders are, on average, selling Bitcoin below their acquisition price—a behavior typically associated with heightened stress and emotional selling.

Bitcoin Short-Term Holder SOPR Dashboard | Source: Axel Adler

Historically, similar SOPR conditions have marked local capitulation phases, when selling pressure peaks and weaker hands exit the market. As long as the SOPR 7-day average remains below one, short-term participants stay in “stress mode.”

Adler notes that a meaningful improvement would require a sustained move back above one on a daily close, signaling that sellers have exhausted supply and buyers are once again absorbing sell-side pressure.

Complementing this signal, the P/L Block indicator tracks the aggregated profit and loss state of market participants. The current red block reflects loss dominance, with a P/L Score of minus three—classified as pronounced stress.

With Bitcoin down 30% from its all-time high and 30-day returns negative, both indicators align, reinforcing a clear picture of capitulation among short-term holders.

Bitcoin Price Analysis: Weekly Structure Remains Critical

The weekly chart shows Bitcoin trading around the $89,900 level after a sharp rejection from the $120,000–$125,000 region. Price has retraced aggressively but is now attempting to stabilize above the rising 200-week moving average (green), a level that has historically defined long-term trend validity. So far, this area is acting as dynamic support, suggesting that buyers are defending higher-cycle structure despite broader market weakness.

BTC consolidates above key SMA | Source: BTCUSDT chart on TradingView

However, Bitcoin remains below the 50-week moving average (blue), which is now sloping downward. This configuration reflects a loss of medium-term momentum and confirms that the market is still in a corrective phase rather than a resumed uptrend.

The 100-week moving average (red) continues to rise well below price, reinforcing that the broader macro trend remains intact, but also highlighting how much excess was built during the prior rally.

Volume has declined during the recent consolidation, signaling indecision rather than aggressive accumulation. This typically precedes a volatility expansion. From a structural perspective, holding above the $85,000–$88,000 zone is critical. A sustained breakdown below the 200-week MA would increase the probability of a deeper retracement toward the $75,000–$80,000 region.

Conversely, reclaiming the 50-week MA near $95,000 would be an early signal that downside pressure is fading. Until then, Bitcoin remains range-bound, with long-term support holding but momentum still fragile.

Featured image from ChatGPT, chart from TradingView.com

Why XRP Isn’t Reacting to Major Institutional and Regional Developments

XRP has spent the past several weeks moving sideways around the $2.00 level, even as headlines around Ripple and the broader XRP ecosystem continue to stack up.

Related Reading: Dogecoin Holds Demand Zone Above $0.13, What A Bounce Would Do

From a $300 million venture fund expansion into South Korea to nearly $1 billion in spot ETF inflows and fresh regulatory approvals, the backdrop appears supportive on paper.

However, price action tells a different story. Instead of responding to institutional traction and regional growth, XRP remains locked in a tight range, reflecting a disconnect between developments and market behavior.

Ripple XRP XRPUSD XRPUSD_2025-12-15_12-37-32

Institutional Growth Isn’t Translating Into Token Demand

Ripple’s expansion into South Korea through a $300 million venture fund has drawn attention due to the involvement of well-established, Seoul-based asset managers.

However, market participants are increasingly viewing this move as tied to Ripple’s corporate strategy and potential IPO positioning, rather than direct demand for XRP. Institutional investors tend to prioritize predictable cash-flow or equity-style exposure, limiting the immediate impact such initiatives have on the token’s market dynamics.

A similar pattern is visible in the ETF market. Spot XRP ETFs have recorded roughly $990 million in inflows over 30 consecutive days, making them one of the fastest-growing crypto fund segments.

Despite this, XRP has fallen more than 12% over the past month. Analysts note that ETF inflows do not always translate into spot market pressure, especially when liquidity is fragmented or offset by broader risk-off sentiment across crypto assets.

Technical Pressure and Broader Market Headwinds

From a technical standpoint, XRP remains under pressure. The price has retraced to key Fibonacci levels after falling from its yearly high near $3.65.

Chart patterns such as a developing death cross and a double-top formation point to downside risk, with support levels around $1.63 and $1.50 in focus if selling continues. Traders describe the current phase as bearish consolidation, with strong resistance clustered between $2.00 and $2.20.

These conditions mirror weakness across the wider crypto market. Bitcoin’s decline from earlier highs and drawdowns in major altcoins have reduced risk appetite, often pulling XRP lower regardless of asset-specific news.

Liquidity, Bots, and Muted Price Response

Market structure may also be playing a role. Analysts point to low trading volumes and heavy arbitrage activity as factors keeping XRP pinned near psychological levels.

In thin markets, automated strategies tend to fade moves quickly, preventing follow-through. While some data suggests tokens are gradually moving off exchanges, signaling longer-term holding, short-term price discovery remains dominated by macro flows and Bitcoin-led volatility.

Related Reading: Dogecoin (DOGE) Slides Deeper Into Red—Is a Bottom in Sight?

Currently, XRP’s lack of movement reflects market mechanics more than a judgment on progress within its ecosystem. Until volume and liquidity shift decisively, headlines alone may not be enough to move the price.

Cover image from ChatGPT, XRPUSD chart from Tradingview

Why Did The Bitcoin, Ethereum, And XRP Prices Crash, And Will It Continue?

Crypto pundit Crypto Wimar has explained why the Bitcoin, Ethereum, and XRP prices crashed, highlighting the continuous selling pressure. The crypto market is also at risk of further downward pressure due to macro factors such as the impending Japan rate hike. 

Why The Bitcoin, Ethereum, And XRP Prices Crashed

In an X post, Crypto Wimar revealed that Wintermute has dumped 40% of its holdings over the last three weeks, which has contributed to the crash in Bitcoin, Ethereum, and XRP prices. The crypto pundit further noted that the market maker is still dumping millions in BTC and ETH on Binance, which puts these coins at risk of further declines. 

The Bitcoin, Ethereum, and XRP prices are also crashing as crypto market investors brace for a Japan interest rate hike by the BOJ at their December 19 meeting. Polymarket data shows that there is currently a 97.4% chance that the BOJ will increase rates by 25 basis points. A Japan rate hike impacts the crypto market as it puts the yen carry trade in focus, with investors moving to sell their assets before the yen strengthens and their debt becomes more expensive. 

Meanwhile, it is worth mentioning that the Bitcoin, Ethereum, and XRP prices have crashed after every Fed rate cut this year. This similar price action is playing out as the Fed lowered rates by 25 bps last week. These crypto assets had seen a notable rebound prior to the Fed rate decision last week, indicating that the cut was already priced in. 

Demand for Bitcoin, Ethereum, and XRP also appears to be dwindling, even among institutional investors. Crypto analytics platform CryptoQuant stated that Bitcoin treasury growth is losing momentum, noting that the accumulation pace is slowing despite the fact that 117 new companies added BTC to their treasuries this year. Ethereum treasury company BitMine is also the only company that has continued to accumulate ETH at an impressive pace amid this market downturn. 

BTC At Risk Of Drop Below $50,000

Crypto analyst Titan of Crypto has indicated that the Bitcoin price could still drop below $50,000, which also puts Ethereum and XRP at risk of crashing. In an X post, the analyst raised the possibility that a BTC bear pennant is forming.

He noted that this is not a structure that market investors will typically want to see in a bull market. Titan of Crypto added that the structure is still developing, but it is one that is worth monitoring closely. 

Bitcoin

Meanwhile, the analyst’s accompanying chart showed that the Bitcoin price could drop below $50,000 as soon as February next year. It is worth mentioning that veteran trader Peter Brandt had also earlier predicted that BTC could drop below $50,000 based on his belief that the flagship crypto is already in a bear market.

Bitcoin

Ethereum Price Compression Deepens as Analysts Debate if the Next Move Is a Rally or Breakdown

Ethereum (ETH) has entered another period of tight price compression, a phase that has left traders split between expectations of a renewed rally and concerns about a deeper correction.

As of December 15, the Ethereum price trades near the $3,100 level, drifting sideways after several failed attempts to reclaim higher resistance zones. The narrowing range reflects hesitation across the market, with declining volumes, mixed technical signals, and contrasting institutional activity.

Despite modest intraday fluctuations, Ethereum’s broader structure shows a market waiting for direction. Trading activity has slowed compared to earlier in the year, suggesting reduced speculative participation rather than heavy distribution.

Ethereum ETH ETHUSD ETHUSD_2025-12-15_12-26-42

The Ethereum Price Key Levels Define the Short-Term Outlook

Support near the $3,020–$3,000 zone remains critical. This area has been tested multiple times and continues to act as a floor for price action.

A sustained break below it would likely expose the Ethereum price to a deeper pullback, with some analysts pointing to demand zones closer to $2,900 or even the $2,600–$2,500 range if downside momentum accelerates.

On the upside, resistance between $3,150 and $3,400 continues to cap recovery attempts. Ethereum remains below major moving averages and a descending trendline that has guided price action since November.

Analysts note that a daily close above this resistance band, supported by rising volume, would be required to shift the current corrective bias and signal a trend change.

Diverging Technical Signals Add to Uncertainty

Technical interpretations remain mixed. Elliott Wave analysts argue Ethereum may be approaching a potential Wave 3 phase, which historically has coincided with strong upward moves.

However, others highlight the lack of demand strength and repeated rejections near resistance as signs that upside moves remain corrective rather than impulsive.

On-chain data adds another layer of complexity. Liquidation heatmaps reveal dense clusters above current prices, particularly in the $3,400–$3,700 range, suggesting a potential magnet for price if momentum builds.

At the same time, thinner liquidity below current levels implies that a downside sweep could occur before any sustained rally develops.

Institutional Flows Contrast With Price Stagnation

While the Ethereum price action remains compressed, institutional involvement continues to grow. U.S. spot Ethereum ETFs recorded roughly $209 million in net inflows during the past week, led by BlackRock’s ETHA.

Separately, BitMine Immersion Technologies has continued accumulating Ether, now holding a sizable share of the circulating supply as part of a long-term treasury strategy.

This contrast between steady institutional accumulation and cautious market pricing underscores the current stalemate. For now, Ethereum remains caught between strong long-term narratives and unresolved short-term technical pressure, with a clear breakout or breakdown likely to determine sentiment in the weeks ahead.

Cover image from ChatGPT, ETHUSD chart from Tradingview

XRP Could Reach $100 Within 5 Years, Predicts World’s Highest-IQ Claimant

Young Hoon Kim — a social-media personality who describes himself on X as the “IQ 276” holder — said XRP could rise to $100 over the next five years, offering a fresh bullish target that drew a mix of enthusiasm and criticism across Crypto Twitter.

Kim Doubles Down On XRP

“Based on my personal view, XRP could potentially reach $100 over the next 5 years. (NFA/DYOR),” the superbrain posted via X on Dec. 14. The post showed roughly 133,300 views.

Based on my personal view, #XRP could potentially reach $100 over the next 5 years. (NFA/DYOR)

— YoungHoon Kim, IQ 276 (@yhbryankimiq) December 14, 2025

Notably, Kim didn’t stop at the five-year call, either. In an earlier post on Saturday, he said: “In my view, XRP has a strong possibility of reaching a new ATH by the end of this year.”

Neither post included a detailed methodology or valuation framework. The reaction, accordingly, centered less on the specific target and more on the absence of supporting analysis — and on Kim’s public persona, which has become part of the conversation around his market calls.

Software engineer Vincent Van Code responded by asking for the underlying math in a joking tone: “Ok mr brain, please share with us your calculations. I too agree, I have calcs I shared using my 20 IQ brain.”

JD (@jaydee_757), a chart analyst popular in the XRP community, framed the post as momentum-driven: “Sounds like this boy bought the hype lol!” Gordon (@GordonGekko) added: “The smartest man in the world says XRP could hit $100 by 2030. Do you think this is a possible target?”

Larger trading and chart-focused accounts were more direct. Ali Martinez (@alicharts) wrote, “You can have the highest IQ and still be dumb AF,” while IncomeSharks asked, “Has one prediction you’ve said come true?” Both comments were posted in response to Kim’s XRP-related statements circulating over the weekend.

The posts are a continuation of a narrative that gained traction at the end of last week. As reported on Dec. 12, Kim’s first ever XRP related post on X — “I buy #XRP from now on” — came after a period of frequent Bitcoin-related posting.

Notably, Kim not only posted about XRP but also World Liberty Financial, the decentralized finance (DeFi) platform backed by the Trump family, over the weekend. On Sunday, Kim posted via X: “I personally buy WLFI every day, because I believe it is significantly undervalued based on my own assessment.” Again, there was no explanation or technical analysis. Just a provocant claim.

Already on October 24, Kim claimed that WLFI is more valuable than Bitcoin. “As the World’s Highest IQ Record Holder (by World Memory Championships & Official World Record®), I predict WLFI will soon reach a market cap of $5B. WLFI is the only crypto more valuable than Bitcoin,” he wrote.

Meanwhile, his Bitcoin price prediction for 2026 is not less sensational. “My analysis suggests that Bitcoin reaching 300K in early 2026 is a logical scenario,” he wrote on Dec. 11.

At press time, XRP traded at $1.99.

XRP price

Bitcoin Pulls Back Under $89K, Michael Saylor Smells Opportunity

Strategy chair Michael Saylor signaled that his firm may add to its Bitcoin holdings just as the market slid again on Sunday, a move that kept traders on edge and fed fresh debate over what is driving the declines.

Back To More Orange Dots

According to a post on X, Saylor shared a chart with the phrase “Back to More Orange Dots,” a shorthand that investors interpret as fresh buying.

Based on reports tracked by SaylorTracker, Strategy bought 10,624 BTC on Dec. 12 — its biggest single purchase since late July.

The firm now holds about 660,624 BTC, which at current prices is worth roughly $58.5 billion, and its average cost per coin stands at $74,696.

₿ack to More Orange Dots. pic.twitter.com/rBi1aagDVO

— Michael Saylor (@saylor) December 14, 2025

Sunday Wick, Low Liquidity

Bitcoin briefly dipped to a two-week low near $87,750 in late trading on Sunday, before climbing back above $89,000 by the time of writing.

Traders pointed to a familiar pattern: quick wick-downs on weekends when liquidity is thin. Ether showed relative strength while major altcoins lagged, and market participants were seen positioning ahead of a packed calendar of US data and central bank decisions this week.

Analysts Eye Bank Of Japan

According to analyst commentary, some market participants blame the selling on expectations around the Bank Of Japan.

People are seriously underestimating what the bank is about to do to crypto, said one analyst using the handle NoLimit.

Justin d’Anethan, head of research at Arctic Digital, said the slide toward $88,000 “feels like a defeat,” and linked the move to fear of a carry trade unwind tied to Japanese rate expectations.

Markets May Have Priced It In

Sykodelic, another market watcher, argued that Japan’s actions are largely priced in. “Markets are forward-thinking, forward-moving. They move in anticipation of events, not when those events happen,” they wrote.

Based on that view, the recent drop is less about a fresh shock and more about ordinary back-and-forth: macro funds trimming exposure, short-term traders taking profit, and buyers stepping in at lower levels.

That push-and-pull helps explain why Bitcoin keeps snapping lower on thin pockets of liquidity but does not break decisively below key support.

Meanwhile, the tension between long-term holders — represented by companies like Strategy — and short-term macro flows is shaping price action.

There is no sign yet of widespread liquidations or a funding crisis, which suggests the declines are measured rather than chaotic.

Featured image from Australian Farmers, chart from TradingView

Dogecoin Holds Demand Zone Above $0.13, What A Bounce Would Do

As the eventful year of 2025 draws to an end, crypto analysts are looking into what the Dogecoin price could hold for investors going into the end of the year. One of these analysts is BitGuru, who shared an interest in the Dogecoin price chart, highlighting the next possible roadmap that the meme coin could take. With the possibility of a bounce rising, the next targets have become increasingly important to identify in order to maximize gains.

Why The Dogecoin Price Could Recover Quickly

BitGuru’s analysis focuses on the rising demand surrounding the meme coin after finding support from the recent crash. The Dogecoin price had stopped above $0.13, suggesting that the demand at this level continues to hold strong as buyers return to the market.

Pointing out this demand, the crypto analyst explains that the Dogecoin price is actually holding the demand zone after a prolonged downtrend. This is often bullish for the digital asset as it shows rising interest in the cryptocurrency as it establishes new support levels.

This base formation, as the analyst calls it, could serve as the starting point for the next rally that could push the Dogecoin price higher. However, for this to happen, the Dogecoin bulls would have to maintain their position above this demand level.

If this support level is held, then BitGuru forecasts that the Dogecoin price could start to recover again. This bounce could lead to a 50% increase, with the analyst’s chart outline putting it as high as $0.188. The upper end of the rally shows the price climbing to $0.22 before hitting resistance.

Dogecoin price

End Of Year Could End Red

Interestingly, the last quarter of the year has often been reasonably bullish for the Dogecoin price, but the year 2025 has deviated hard. So far, the quarter is already 41.8% deep in the red, according to data from the CryptoRank website, and it doesn’t look like that would change anytime soon.

The Dogecoin price is already down more than 7.5% in the month of December so far, contributing to the decline that has been felt in the quarter. The months of October and November ended in the red with 20% and 21.3% losses, respectively, and if this trend continues, then the Dogecoin price could follow suit.

Dogecoin price chart from Tradingview.com

Hashdex Unveils Its Top 3 Crypto Predictions For 2026

Hashdex is out with its 2026 crypto investment outlook, and the vibe is pretty clear: stop treating crypto like a weird side-bet and start treating it like… an allocation. The firm’s CIO Samir Kerbage says “most investors” should be thinking in the 5–10% range, framing it as a pragmatic response to a messier macro regime (sticky inflation risk, debt burdens, the 60/40 portfolio looking less like a law of nature and more like a historical artifact).

Look, you can debate the exact number, but Hashdex’s point is that the underweight has become the active decision. Crypto is now “well above $3 trillion” in market cap and about 1% of the global investable market by its math—meaning a sub-1% allocation is basically a deliberate fade. They also cite a Charles Schwab survey where 45% of financial advisors said they planned to allocate to crypto ETFs over the next year.

And they’re not just waving their hands. Hashdex runs a simple portfolio thought experiment: adding crypto exposure (represented by the Nasdaq Crypto Index US) to a 60/40 improves risk-adjusted returns in their backtest window, with higher allocations juicing total return while, yes, drawdowns get uglier. That trade-off isn’t hidden — it’s the whole point of sizing the position instead of YOLO’ing it.

But the meat of the report isn’t “buy crypto because number go up.” It’s three themes, three predictions — basically a roadmap for what they think does the heavy lifting in 2026.

Top 3 Crypto Predictions For 2026

First up: the “cryptodollar”. Hashdex argues stablecoins are starting to do something geopolitically weird and financially consequential: while some sovereigns try to de-dollarize, stablecoins re-dollarize at the user and corporate level, with issuers recycling that demand into short-duration Treasuries. Their baseline is stablecoins going from roughly $295 billion to well over $500 billion in 2026.

If that accelerates, they suggest it changes the shape of Treasury demand — in one scenario, stablecoin growth could shorten the average duration of US debt by around four months (because the backing skews short). That’s the kind of detail bond people obsess over. Crypto people probably should, too.

Second: tokenization finally acting like a flywheel instead of a conference slide. Hashdex points to tokenized RWAs at roughly $36 billion as of late 2025 and says the market could grow 10x to about $400 billion by end-2026. They also flag that tokenized Treasury bills have already climbed to over $8 billion, from a little above $700 million two years earlier.

They namecheck real-world rollout examples — BlackRock’s liquidity fund, Franklin Templeton’s on-chain government money fund, UBS’s tokenized VCC fund in Singapore, Siemens’ on-chain bond — as proof this isn’t just crypto teams talking to themselves anymore. “We’re not spending enough time talking about how quickly we’re going to tokenize every financial asset.”

Third: AI, but not the “add AI to the pitch deck” version. Hashdex says decentralized AI networks pulled nearly $1 billion in venture funding in 2025, largely aimed at problems like verification, coordination, and compute cost. Their call is the “AI Crypto” segment growing from about $3 billion to $10 billion in 2026.

The throughline is simple even if the plumbing isn’t: stablecoins deepen on-chain liquidity, tokenization pulls more assets onto rails, and AI pushes demand for crypto-native infrastructure that can verify and coordinate without a single gatekeeper. Hashdex’s punchline is that 2026 is when “exploratory” turns into “strategic.” Not a tidy ending, sure — but markets rarely give you one.

At press time, the total crypto market cap stood at $3.03 trillion.

Total crypto market cap chart

Analyst: Bitcoin’s Cycle Is Intact, Yet No Longer Purely Market-Driven

According to Markus Thielen, head of research at 10x Research, Bitcoin’s familiar four-year cycle still exists, but what drives that rhythm has changed. He told listeners on The Wolf Of All Streets Podcast that the calendar timing of halvings is no longer the main force. Instead, election timing, central bank moves and where money flows now matter more.

Shift From Halving To Politics And Liquidity

Thielen highlighted that Bitcoin’s major peaks in 2013, 2017, and 2021 all happened in the fourth quarter, and he believes these highs match up more closely with election cycles and political uncertainty than with the timing of the halvings.

According to him, there is added market worry about whether the sitting president’s party will keep control of Congress. He said that could shape policy and investor choices, and he mentioned US President Donald Trump when discussing current political odds. The message was clear: politics changes expectations, and expectations move prices.


The four-year cycle is still intact, but it’s driven by midterm elections, not the halving.@markus10x pic.twitter.com/5td8bLgb20

— The Wolf Of All Streets (@scottmelker) December 13, 2025

Liquidity And Institutional Caution

The recent Fed rate cut did not spark the usual broad rally in risk assets. Institutional investors, who now have a larger role in crypto markets, are acting more guardedly as policy signals remain mixed and liquidity looks tighter.

Capital inflows into Bitcoin have slowed compared with last year, Thielen said, removing some of the buying pressure that helped push prices higher before. Arthur Hayes, the BitMEX co-founder, made a similar point in October, saying that global liquidity, not an automatic four-year clock, has always driven the main moves in cryptocurrency. According to Hayes, halvings may line up with rallies sometimes, but they are often coincidental.

Bitcoin slipped below $90,000 in thin Sunday trading, a sign of fragile demand when volumes are low. Ether showed relative strength while major altcoins lagged. Traders are positioning ahead of a busy week of US data and central bank events, putting premium on signals that affect liquidity and risk appetite. With institutional desks watching macro reads closely, momentum is likely to depend on flows rather than calendar dates.

What This Means For Investors

The clearest takeaway is simple. The four-year pattern can still help frame expectations, but it should not be treated as a rule. Halvings affect supply and miner economics, and they matter to some market actors, but in a market shaped by large funds and ETFs the real fuel is cash and credit conditions.

When liquidity loosens, prices can run. When it tightens, rallies can end. That lesson sits at the center of both Thielen’s and Hayes’s views.

Policy and liquidity are now central to Bitcoin’s cycles. Reports indicate that the pattern has shifted from a purely mechanical schedule to one influenced by broader money conditions and political timelines. Market participants appear to be responding to economic news and central bank signals alongside the block reward schedule.

Featured image from Unsplash, chart from TradingView

Dogecoin (DOGE) Slides Deeper Into Red—Is a Bottom in Sight?

Dogecoin started a fresh decline below the $0.1400 zone against the US Dollar. DOGE is now consolidating losses and might face hurdles near $0.1400.

  • DOGE price started a fresh decline below the $0.1400 level.
  • The price is trading below the $0.1380 level and the 100-hourly simple moving average.
  • There is a key bearish trend line forming with resistance at $0.1375 on the hourly chart of the DOGE/USD pair (data source from Kraken).
  • The price could extend losses if it stays below $0.1400 and $0.1420.

Dogecoin Price Dips Further

Dogecoin price started a fresh decline after it closed below $0.1420, like Bitcoin and Ethereum. DOGE declined below the $0.1400 and $0.1380 support levels.

The price even traded below $0.1350. A low was formed near $0.1326, and the price recently corrected some losses. There was a minor increase toward the 23.6% Fib retracement level of the downward move from the $0.1530 swing high to the $0.1326 low.

Dogecoin price is now trading below the $0.1400 level and the 100-hourly simple moving average. If there is a recovery wave, immediate resistance on the upside is near the $0.1380 level. There is also a key bearish trend line forming with resistance at $0.1375 on the hourly chart of the DOGE/USD pair.

Dogecoin Price

The first major resistance for the bulls could be near the $0.140 level. The next major resistance is near the $0.1425 level and the 50% Fib retracement level of the downward move from the $0.1530 swing high to the $0.1326 low. A close above the $0.1425 resistance might send the price toward the $0.1450 resistance. Any more gains might send the price toward the $0.1500 level. The next major stop for the bulls might be $0.1550.

Another Decline In DOGE?

If DOGE’s price fails to climb above the $0.140 level, it could continue to move down. Initial support on the downside is near the $0.1340 level. The next major support is near the $0.1325 level.

The main support sits at $0.130. If there is a downside break below the $0.130 support, the price could decline further. In the stated case, the price might slide toward the $0.1250 level or even $0.1240 in the near term.

Technical Indicators

Hourly MACD – The MACD for DOGE/USD is now gaining momentum in the bearish zone.

Hourly RSI (Relative Strength Index) – The RSI for DOGE/USD is now above the 50 level.

Major Support Levels – $0.1340 and $0.1300.

Major Resistance Levels – $0.1400 and $0.1420.

XRP Price Struggles Near $2.0—Breakout Blocked or Pullback Ahead?

XRP price started a fresh decline below $2.00. The price is now struggling and faces resistance near the $2.020 resistance level.

  • XRP price started a fresh decline below the $2.00 zone.
  • The price is now trading below $2.00 and the 100-hourly Simple Moving Average.
  • There is a bearish trend line forming with resistance at $2.020 on the hourly chart of the XRP/USD pair (data source from Kraken).
  • The pair could continue to move down if it settles below $1.950.

XRP Price Dips Again

XRP price attempted a recovery wave above $2.120 but failed to continue higher, like Bitcoin and Ethereum. The price started a fresh decline below $2.050 and $2.020.

There was a move below the $2.00 support level. A low was formed at $1.9525, and the price recently started an upside correction. There was a move above the 50% Fib retracement level of the downward move from the $2.047 swing high to the $1.952 low.

However, the bears are active near $2.00 and $2.020. There is also a bearish trend line forming with resistance at $2.020 on the hourly chart of the XRP/USD pair. The price is now trading below $2.00 and the 100-hourly Simple Moving Average.

If there is a fresh upward move, the price might face resistance near the $2.00 level. The first major resistance is near the $2.020 level or the 61.8% Fib retracement level of the downward move from the $2.047 swing high to the $1.952 low.

XRP Price

A close above $2.020 could send the price to $2.050. The next hurdle sits at $2.080. A clear move above the $2.120 resistance might send the price toward the $2.150 resistance. Any more gains might send the price toward the $2.20 resistance. The next major hurdle for the bulls might be near $2.250.

Another Decline?

If XRP fails to clear the $2.020 resistance zone, it could start a fresh decline. Initial support on the downside is near the $1.9650 level. The next major support is near the $1.950 level.

If there is a downside break and a close below the $1.950 level, the price might continue to decline toward $1.920. The next major support sits near the $1.880 zone, below which the price could continue lower toward $1.820.

Technical Indicators

Hourly MACD – The MACD for XRP/USD is now gaining pace in the bearish zone.

Hourly RSI (Relative Strength Index) – The RSI for XRP/USD is now below the 50 level.

Major Support Levels – $1.950 and $1.920.

Major Resistance Levels – $2.020 and $2.050.

Ethereum Price Drifts Lower—Is $3,000 About to Be the Battleground?

Ethereum price started a fresh decline below $3,120. ETH is now consolidating and might soon aim to start a recovery wave above $3,200.

  • Ethereum started a downside correction from the $3,250 zone.
  • The price is trading below $3,200 and the 100-hourly Simple Moving Average.
  • There is a connecting bearish trend line forming with resistance at $3,175 on the hourly chart of ETH/USD (data feed via Kraken).
  • The pair could continue to move down if it settles below the $3,050 zone.

Ethereum Price Dips Toward Support

Ethereum price failed to stay above $3,180 and started a fresh decline, like Bitcoin. ETH price dipped below $3,150 and $3,120 to enter a short-term bearish zone.

The bears even pushed the price toward $3,000. A low was formed at $3,026 and the price is now attempting to recover some losses. There was a move above the 23.6% Fib retracement level of the downward move from the $3,273 swing high to the $3,026 low.

Ethereum price is now trading below $3,200 and the 100-hourly Simple Moving Average. Besides, there is a connecting bearish trend line forming with resistance at $3,175 on the hourly chart of ETH/USD.

If there is another upward move, the price could face resistance near the $3,150 level or the 50% Fib retracement level of the downward move from the $3,273 swing high to the $3,026 low. The next key resistance is near the $3,180 level and the trend line.

Ethereum Price

The first major resistance is near the $3,200 level. A clear move above the $3,200 resistance might send the price toward the $3,250 resistance. An upside break above the $3,250 region might call for more gains in the coming days. In the stated case, Ether could rise toward the $3,320 resistance zone or even $3,400 in the near term.

Another Decline In ETH?

If Ethereum fails to clear the $3,200 resistance, it could start a fresh decline. Initial support on the downside is near the $3,080 level. The first major support sits near the $3,050 zone.

A clear move below the $3,050 support might push the price toward the $3,020 support. Any more losses might send the price toward the $3,000 region. The next key support sits at $2,940.

Technical Indicators

Hourly MACDThe MACD for ETH/USD is gaining momentum in the bullish zone.

Hourly RSIThe RSI for ETH/USD is now above the 50 zone.

Major Support Level – $3,080

Major Resistance Level – $3,200

Bitcoin Price Faces Growing Heat—Is Momentum Turning Against Bulls?

Bitcoin price corrected gains and traded below the $90,000 support zone. BTC is now rising and might struggle to clear the $90,500 zone.

  • Bitcoin started a downside correction from the $92,500 zone.
  • The price is trading below $90,000 and the 100 hourly Simple moving average.
  • There is a bearish trend line forming with resistance at $90,650 on the hourly chart of the BTC/USD pair (data feed from Kraken).
  • The pair might continue to move up if it settles above the $90,500 zone.

Bitcoin Price Aims Fresh Increase

Bitcoin price failed to gain strength for a move above the $92,000 and $92,500 levels. BTC started a downside correction and traded below the $90,500 support.

The price even spiked below the $88,000 support. However, the bulls were active near the $87,500 zone. A low was formed at $87,582 and the price is moving higher. There was a break above the 23.6% Fib retracement level of the downward move from the $93,561 swing high to the $87,582 low.

Bitcoin is now trading below $90,000 and the 100 hourly Simple moving average. If the bulls remain in action, the price could attempt another increase. Immediate resistance is near the $90,000 level. The first key resistance is near the $90,500 level. There is also a bearish trend line forming with resistance at $90,650 on the hourly chart of the BTC/USD pair.

Bitcoin Price

The next resistance could be $92,000. A close above the $92,000 resistance might send the price further higher. In the stated case, the price could rise and test the $92,500 resistance. Any more gains might send the price toward the $93,200 level. The next barrier for the bulls could be $94,000 and $94,500.

Another Decline In BTC?

If Bitcoin fails to rise above the $90,500 resistance zone, it could start another decline. Immediate support is near the $88,550 level. The first major support is near the $88,000 level.

The next support is now near the $87,500 zone. Any more losses might send the price toward the $86,500 support in the near term. The main support sits at $85,000, below which BTC might accelerate lower in the near term.

Technical indicators:

Hourly MACD – The MACD is now gaining pace in the bullish zone.

Hourly RSI (Relative Strength Index) – The RSI for BTC/USD is now above the 50 level.

Major Support Levels – $88,550, followed by $88,000.

Major Resistance Levels – $90,000 and $90,500.

XRP Holders Labeled ‘Uneducated Perma Bulls’ By Veteran Trader – Details

Veteran market trader Peter Brandt has reignited debate around XRP after issuing sharp remarks about the token’s most loyal supporters. Drawing from a career that spans more than five decades, Brandt grouped XRP alongside silver when describing markets where bullish belief often holds firm despite repeated price swings and long periods of disappointment.

According to people familiar with his comments, Brandt grounded his criticism in personal trading history. He said he has handled thousands of contracts across commodities, equity benchmarks, and digital assets, and argued that the “perma bulls who I find most uneducated and biased are those who trumpet Silver and XRP,” pointing to what he sees as a pattern of investors staying bullish even when price action and broader conditions turn against them.

Brandt Highlights Decades Of Experience

Brandt’s tone was blunt and personal. He has a long record of public commentary, and his criticisms of XRP are part of a pattern that stretches back years. Earlier this month he called XRP supporters “obsessed” and compared their conviction to that of silver bulls.

For 50 years I have traded many thousands of contracts of every commodity, stock indexes and as many cryptos as you can think of The perma bulls who I find most uneducated and biased are those who trumpet Silver and XRP

— Peter Brandt (@PeterLBrandt) December 12, 2025

At times he has made bearish forecasts — including predictions that XRP would slide toward zero against Bitcoin — while at other moments he identified bullish chart patterns and set higher targets that were later hit before the market reversed.

Community Pushback And Surprises

Responses came fast. Zach Rector, a known figure in the XRP space, pushed back on Brandt’s view. Reports disclosed that Bitcoin maximalist YoungHoon Kim said on December 12 that he would start buying XRP — a notable shift for someone who had favored Bitcoin exclusively.

Kim has claimed an IQ of 276, a detail many readers flagged as unverifiable, but it was repeated in social posts and prompted discussion. X Finance Bull accepted Brandt’s trading record but suggested that charts alone may miss broader structural moves in crypto markets. Dr. Don Woods, a self-described silver bull, joked that triple-digit returns had left him unbothered by labels of bias or ignorance.

XRP: Price Context And Market Moves

According to market snapshots tied to the exchanges, XRP traded above $3 at one point before slipping toward the lower end of the $2 region. Volume and broader crypto swings played parts in that move.

Brandt’s critics point to that resilience as proof his calls are sometimes off. His supporters say his track record over five decades still deserves weight. Both views are in circulation, and both are being used to argue different investment cases.

10,000 XRP And The Freedom Argument

Meanwhile, Edoardo Farina, founder of Alpha Lions Academy, has kept a steady bullish stance. Based on his past posts, he argued that holding 10,000 XRP could put an investor in a special position if prices rise enough.

“It’s hard to understand how free you’ll be,” he wrote in one message that was later shared widely. That claim contains no timeline or clear price targets. It is a conviction play, not a forecast built from disclosed assumptions.

The differing views is part of a wider debate about bias, data, and belief in crypto. Some traders treat Brandt’s words as a warning against unchecked optimism. Others treat community pushback as evidence that XRP’s story is not settled and that broader factors — legal, regulatory, and adoption-related — could change the math.

Featured image from Unsplash, chart from TradingView

Ethereum Forms Wyckoff Breakout Setup: $10,000 Price Target Back In Focus

A recent technical analysis shared on X by crypto analyst Merlijn The Trader presents Ethereum’s price action on the 2-day candlestick chart as a textbook example of Wyckoff accumulation. In his assessment, Ethereum has already moved through several key stages of the model and is now approaching a powerful expansion phase, provided the structure stays intact.

Wyckoff Accumulation Structure Taking Shape On Ethereum Chart

Over the past several days, Ethereum has traded between roughly $3,050 and $3,400, repeatedly failing to secure a sustained move beyond either boundary. At the time of writing, Ethereum’s price action is trading around $3,100.

This prolonged standoff has reinforced the view that Ethereum has returned to consolidating rather than trading in a defined trend, a behavior that aligns closely with the accumulation phase highlighted in a technical analysis by Merlijn The Trader.

In his post, Merlijn described Ethereum’s chart as a “Wyckoff masterclass,” pointing to a sequence of events that align with textbook behavior from the Wyckoff accumulation schematic, which have been playing out for the entirety of 2025.

According to the annotated structure, the spring occurred when ETH briefly dipped below $1,500 in the first half of the year. Price did not linger below that level for long, reclaiming the range within days and going on a rally that eventually ended at a selling climax (SC) of $4,946

Within this structure, the initial selling climax and automatic downtrend reaction established a clear range in which the cryptocurrency has been trading up until now. The chart labels show this as Ethereum moving through Phase D, and this has been highlighted by a downtrend in recent months. 

However, based on the Wyckoff framework, Ethereum seems to now be approaching the breakout zone, with a transition into a full Phase E and a potential vertical markup coming next if the structure continues to play out.

Phase E Projection Points To Strong Upside Scenario

If the Wyckoff roadmap continues to unfold as outlined, Merlijn believes Ethereum is setting up for a full Phase E, the final stage of the accumulation process. This phase is characterized by a sustained markup, where price exits the selling climax (SC) decisively and trends higher with increasing momentum.

Ethereum / US Dollar: @MerlijnTrader on X

The projection on the chart shows a sharp upside expansion once overhead resistance is cleared, with Merlijn pointing to $10,000 and higher as a long-term objective if the structure completes. The path higher is not expected to be linear. The model anticipates an initial push into new all-time highs, followed by a modest rejection around the $5,000 area before the price pauses to consolidate towards the Backup and Last Point of Support

According to the chart, this BU/LPS would likely form around $3,750. If Ethereum holds above that level during the pullback, it would confirm structural strength, with the subsequent expansion targeting above $10,000.

Featured image from Unsplash, chart from TradingView

Bitcoin Headed For $200 Trillion? CEO Makes Bold Prediction

A new public company with a big Bitcoin stash is pitching a bold claim. Twenty One Capital, which listed on the New York Stock Exchange on December 9, arrived with close to $4 billion Bitcoin treasury and now holds the third-largest BTC reserve among public firms. According to the firm’s CEO, Jack Mallers, Bitcoin’s role could expand far beyond a speculative holding.

CEO Sees Bitcoin As A Reserve Asset

Mallers told viewers on theCUBE+NYSE Wired that Bitcoin has compounded holders’ portfolios at roughly 50% a year over the past five to 10 years. Based on reports, he expects that the current $2 trillion market for Bitcoin could grow to between $20 trillion and $200 trillion.

He argued Bitcoin might become the next global reserve asset as finance “recollateralizes” itself away from traditional treasuries and government debt. If supply then stood at 20 million tokens when a 100x market rise happened, Bitcoin would trade near $10 million per coin. At a present price of $92,270, that outcome would equal an increase of about 10,730%.

Market Signals Remain Mixed

Short-term market signs are not all in favor of a big rally. According to market watchers, the Federal Reserve’s recent rate cut barely moved Bitcoin, leaving price action largely flat and directionless.

The MACD histogram, however, is showing hints of bullish momentum in some technical reads, which suggests buyers may be warming up.

The dollar index is showing signs of weakness, which often helps assets like Bitcoin. ETF flows keep disappointing. Without steady inflows from funds, big narratives can struggle to turn into lasting price gains.

Product Push Aimed At Liquidity Without Selling

Twenty One Capital says it wants to offer services that let holders tap liquidity without selling their coins. The firm plans to start in credit and lending and has said it will roll out products in partnership with Tether.

Mallers described the company as more than a balance-sheet accumulator; he compared their ambitions to Coinbase while stressing a narrower focus on Bitcoin services. If executed, these offerings could change how holders manage risk and cash needs.

Big Numbers And Big Questions

The projection to $200 trillion is headline-grabbing. It is a vision, not a forecast, and it hinges on major shifts in global finance and adoption. Reports note that other industry figures have offered similar long-term targets, which means the idea is not unique but remains highly debated.

Featured image from Unsplash, chart from TradingView


Reasons Why XRP’s Technical Structure Favors Upside Than Down Over Next 6 Months

XRP’s recent pullback to $2 has not changed the broader technical picture, according to a new analysis shared on X by crypto analyst Egrag Crypto. Despite the lack of bullish price action in recent weeks, the technical analysis proposes that the market structure continues to favor an upside continuation rather than the trend ending. 

This outlook places the next three to six months in a constructive zone for XRP’s price action, where the probability of further upside is higher than the risk of a downward move.

XRP Currently In Consolidation, Not Distribution

The assessment of Egrag’s technical analysis is based on XRP’s price action currently ticking a list of boxes that points to the next move being up. The first of these boxes is what the analyst referred to as a regime shift, which occurred after the XRP price made a decisive breakout from a multi-year base around $0.5 last year.

This decisive breakout shifted the market from accumulation to expansion. Pullbacks in this phase are usually corrective, not trend-ending. In that context, the current price action can be viewed as part of a natural pause rather than a signal that the larger bullish move has failed.

Another central argument in the analysis is that the current price behavior represents consolidation rather than distribution. Egrag Crypto describes the market as being in a compression phase following an impulse, and this is a pause, not a top. Although XRP has spent about 13 months ranging within this structure, the analyst interpreted this as extended consolidation instead of a distribution process.

Chart Image From X. Source: @egragcrypto On X

EMA Structure Keeps Bullish Bias Intact

Another reason as to why the trend is more likely bullish is because XRP is still trading in alignment with its long-term exponential moving average, which remains above the 21 EMA. That relationship preserves the bullish bias, even though price currently sits below the faster 9 EMA, but this only reflects short-term weakness rather than a structural breakdown.

Beyond pure chart structure, fundamental developments have added weight to the case for longer-term appreciation. XRP is currently holding $2 as an important support zone, and recent developments have emerged that could increase bullish sentiment.

An example is Ripple’s conditional approval alongside other crypto firms for a national trust bank charter from the US Office of the Comptroller of the Currency.

Although the outlook is much more bullish, there is always the possibility of turning bearish within the next six months. According to Egrag, this outlook can only turn bearish if XRP records a sustained monthly close below the $1.80 to $1.60 region. 

Taken together, the analysis concludes that XRP is more likely to resolve higher than lower over the next three to six months, even if there is price volatility along the way.

Featured image from Unsplash, chart from TradingView

Bitcoin And Ethereum Market Structure Points To Crypto Winter – Details

The crypto market has shown a modest price rebound in the last three weeks, returning to a total market cap of $3.07 trillion. During this time, Bitcoin has climbed by 11% from its local bottom at $80,700, while Ethereum has been more aggressive, gaining by 18% within the same period. Despite these reassuring performances, a market analyst with the username PelinayPA postulates that the bear market has commenced, considering certain technical parameters.

BTC & ETH Moving Averages, Trading Volumes Signal Bear Season 

Bear market speculations have been at a heightened level in Q4 2025, as the crypto market suffered extensive price corrections, during which Bitcoin alone retraced by around 36.5%. While the market may have shown some steady upward mobility in recent weeks, many analysts remain convinced the bears have assumed market control, leaving little bullish potential for a full market reversal.

In analyzing Bitcoin’s chart, PelinayPA explains that price is presently trading below the short (7, 14), medium (30, 50), and long-term moving averages (100), indicating a strong sellers’ dominance in the market. However, the more concerning observation is that these averages are sloping downward, suggesting the recent downtrend or corrections may not be temporary.

Bitcoin

Furthermore, the seasoned crypto analyst notes these moving averages are acting as resistance in classic bear-market behavior that initiates a selling spree upon contact with price. In addition, sellers are also aggressive as red candles come with higher volume, while hesitant buyers load the green candles with relatively lower volumes. Based on these technical observations, PelinayPA explains that Bitcoin is not launching a bullish market reversal, but rather remains in a reaction within a larger bear market. 

Meanwhile, the Ethereum market analysis shows a similar situation in that price is trading below key moving averages. However, the short-term MAs (7, 14) are beginning to turn upward. In addition, the price rebounds from lows are stable and stronger while candles are recording shorter wicks, indicating the selling pressure is less aggressive, why buying interest remains visible. 

Therefore, while Ethereum is clearly stronger than Bitcoin, the bullish strength remains insufficient to initiate a trend reversal as long-term MAs remain downward sloping amid low buying volume.

Bitcoin Price Overview

At the time of writing, Bitcoin trades at $90,155 after a minor 0.22% decline in the past 24 hours. Meanwhile, daily trading volume is down by 20.34% and valued at $64.22 billion.

According to PelinayPA, the Bitcoin bull rally is finished, and a deeper price correction is needed before investors see another parabolic surge or all-time high. The analyst predicts Bitcoin to bottom around $50,000 in the “ongoing” bear market, postulating a potential 44.4% decline from the present market prices.

Bitcoin

Ethereum Active Address Count Hits Seven-Month Low — What This Means

While the Ethereum price still struggles to mount a sustained bullish momentum, an investigation into its on-chain activity has revealed a significant change in the behavior of its market participants. 

Active Addresses Decline To 327,000 From 483,000 August High 

In a Quicktake post on the CryptoQuant platform, market analyst CryptoOnchain shared that there has been a growing scarcity of activity within the Ethereum network. Specifically, the quant referenced data obtained from the Ethereum Active Addresses metric, observed on the 7-day Simple Moving Average. 

Since reaching its peak in August, the Active Addresses metric has declined steadily from about 483,000 to 327,000 — a level which marks the lowest reached since May this year. This downturn of more than 32% suggests an increasing exit of willing participants from the Ethereum network.

Ethereum

Interestingly, the aforementioned downturn is not a stand-alone phenomenon. Just around the same period where active addresses explored the southside of the charts, the Ethereum price also took on a bearish direction. This period saw the Ether token lose its $4,800 valuation and begin its descent to the current price around $3,100.

According to the analyst, this strong correlation between the falling Ethereum valuation and its contracting network usage points to something clear — that the recent price drop is likely a result of reduced network demand. This further shows that market participants are moving past speculation, and are in lieu adopting a broader outlook on the Ethereum blockchain. 

Ethereum Market Outlook

On the more positive side, CryptoOnchain explained how healthy bull cycles differ from the present market cycle. Typically, rising prices are not taken for granted as they often indicate a healthy bullish cycle.

An expansion of the cryptocurrency’s network usage also lends credence — enough to serve as confirmation — to suspicions of structural shifts into bullish phases. This theory holds true from a variety of historical occurrences.

So, a market would not qualify as bullish enough if the Ethereum price were on the rise without any parallel growth in on-chain activity. Hence, for a convincing price reversal to hold, there has to be a significant and sustained recovery of active addresses.

This would signal the return of on-chain demand and further heighten expectations of imminent momentum. Until those conditions are simultaneously met, the Ethereum market remains in a state of utmost caution, where prices could head towards either direction, with the major factor being the influx of network users. 

As of press time, the Ether token is valued at about $3,106, reflecting no significant movement since the past day. 

Ethereum

❌