Forget Bitcoin’s Old Cycle—A New Institutional Era Has Begun: Cathie Wood
Ark Invest CEO Cathie Wood says Bitcoin’s long-running four-year pattern may be losing its grip as big financial players buy and hold more of the supply, a shift that could tame price swings and change how investors plan ahead.
Institutional Buying Is Changing Markets
According to Wood, large firms and spot ETFs are slowly locking up coins that used to flow in and out of retail hands. The most recent halving, on April 20, 2024, cut the miner reward to 3.125 BTC.
On a daily basis, that reduction translated to about a 450 Bitcoin drop in supply each day, a figure some analysts call small compared with the trillions attributed to the market’s value and the billions moving into ETFs.
Ark has been active too, buying shares in Coinbase, Circle and its own Ark 21Shares Bitcoin ETF (ARKB), a signal that institutional demand is more than a rumor.
Cycle Rules Are Being Questioned
Based on reports from banks and crypto firms, the familiar cycle—rises tied to halvings followed by deep crashes of 75–90%—is under debate.
Standard Chartered cut its 2025 price forecast from $200,000 to $100,000, arguing ETF inflows weaken the halving’s price punch.
Bitwise’s Matt Hougan and CryptoQuant founder Ki Young Ju have said institutional flows have changed or even erased the classic rhythm.
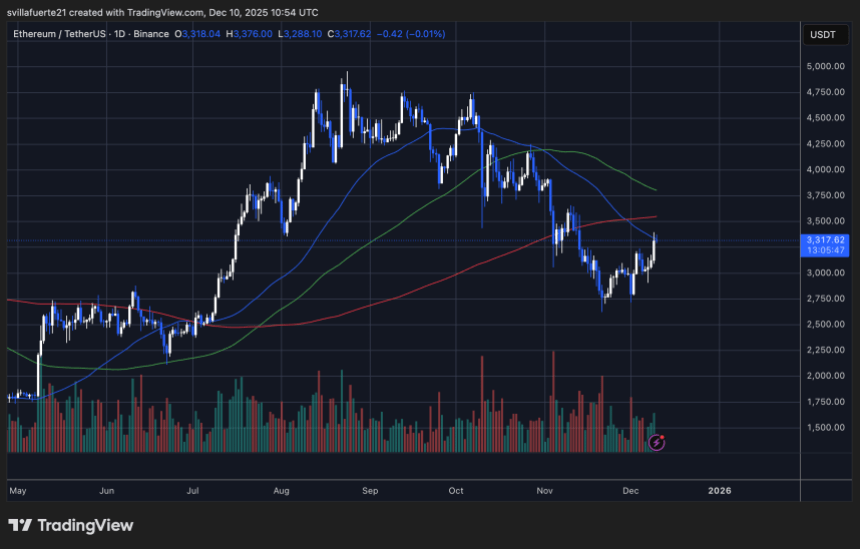
Markets hit a peak near $122,000 in July, and some analysts now say future drawdowns may be shallower, in the 25% to 40% range rather than the extreme collapses seen earlier.
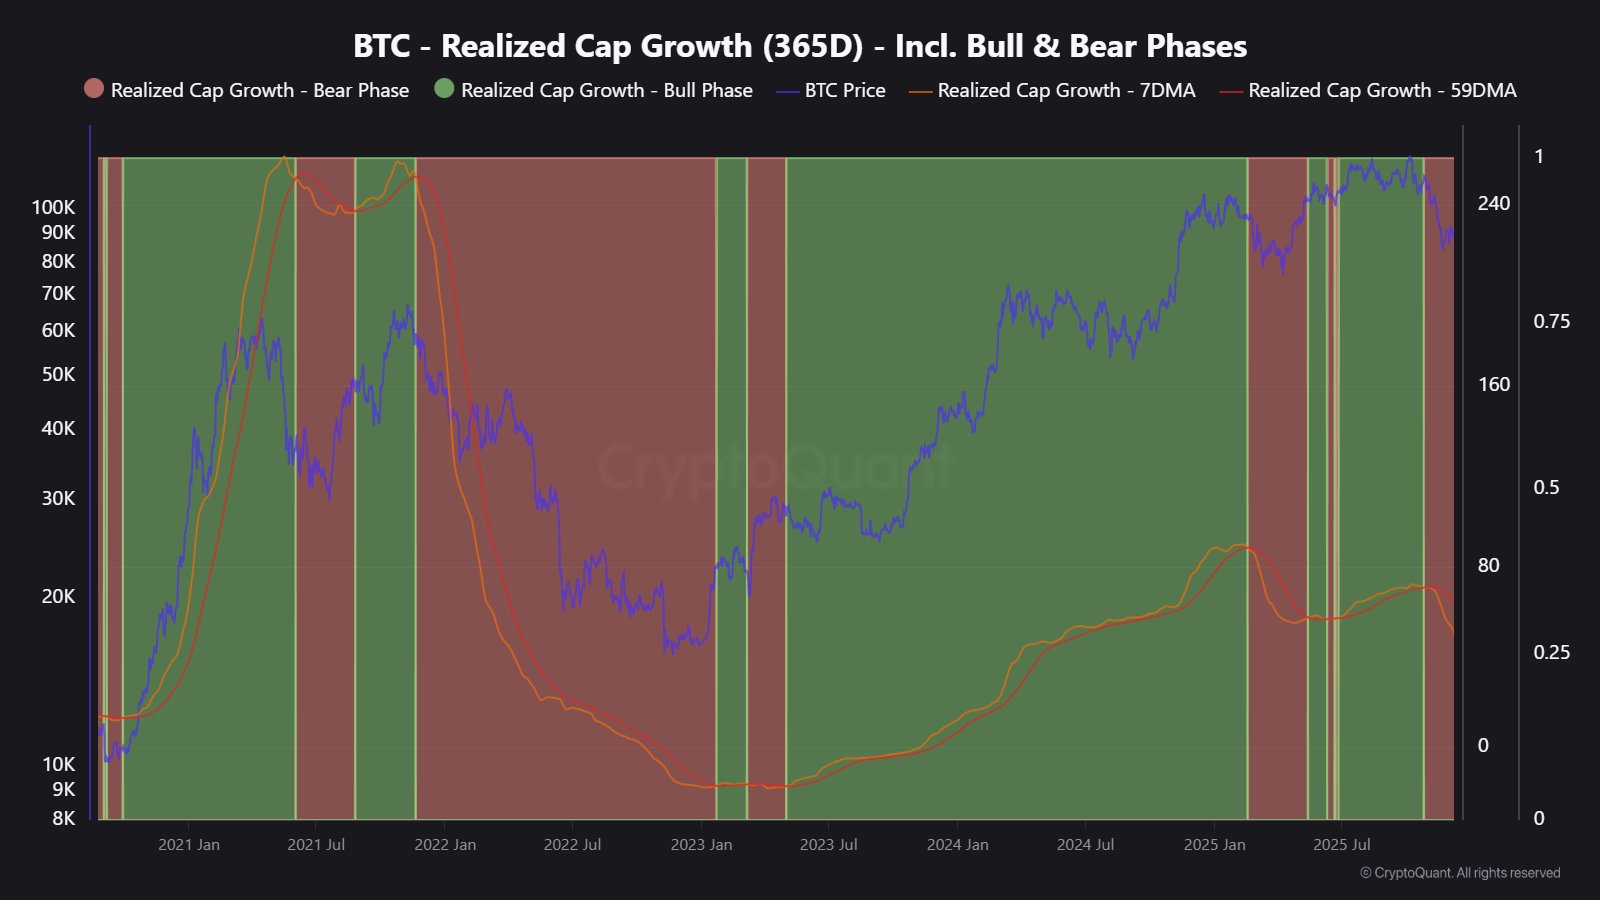
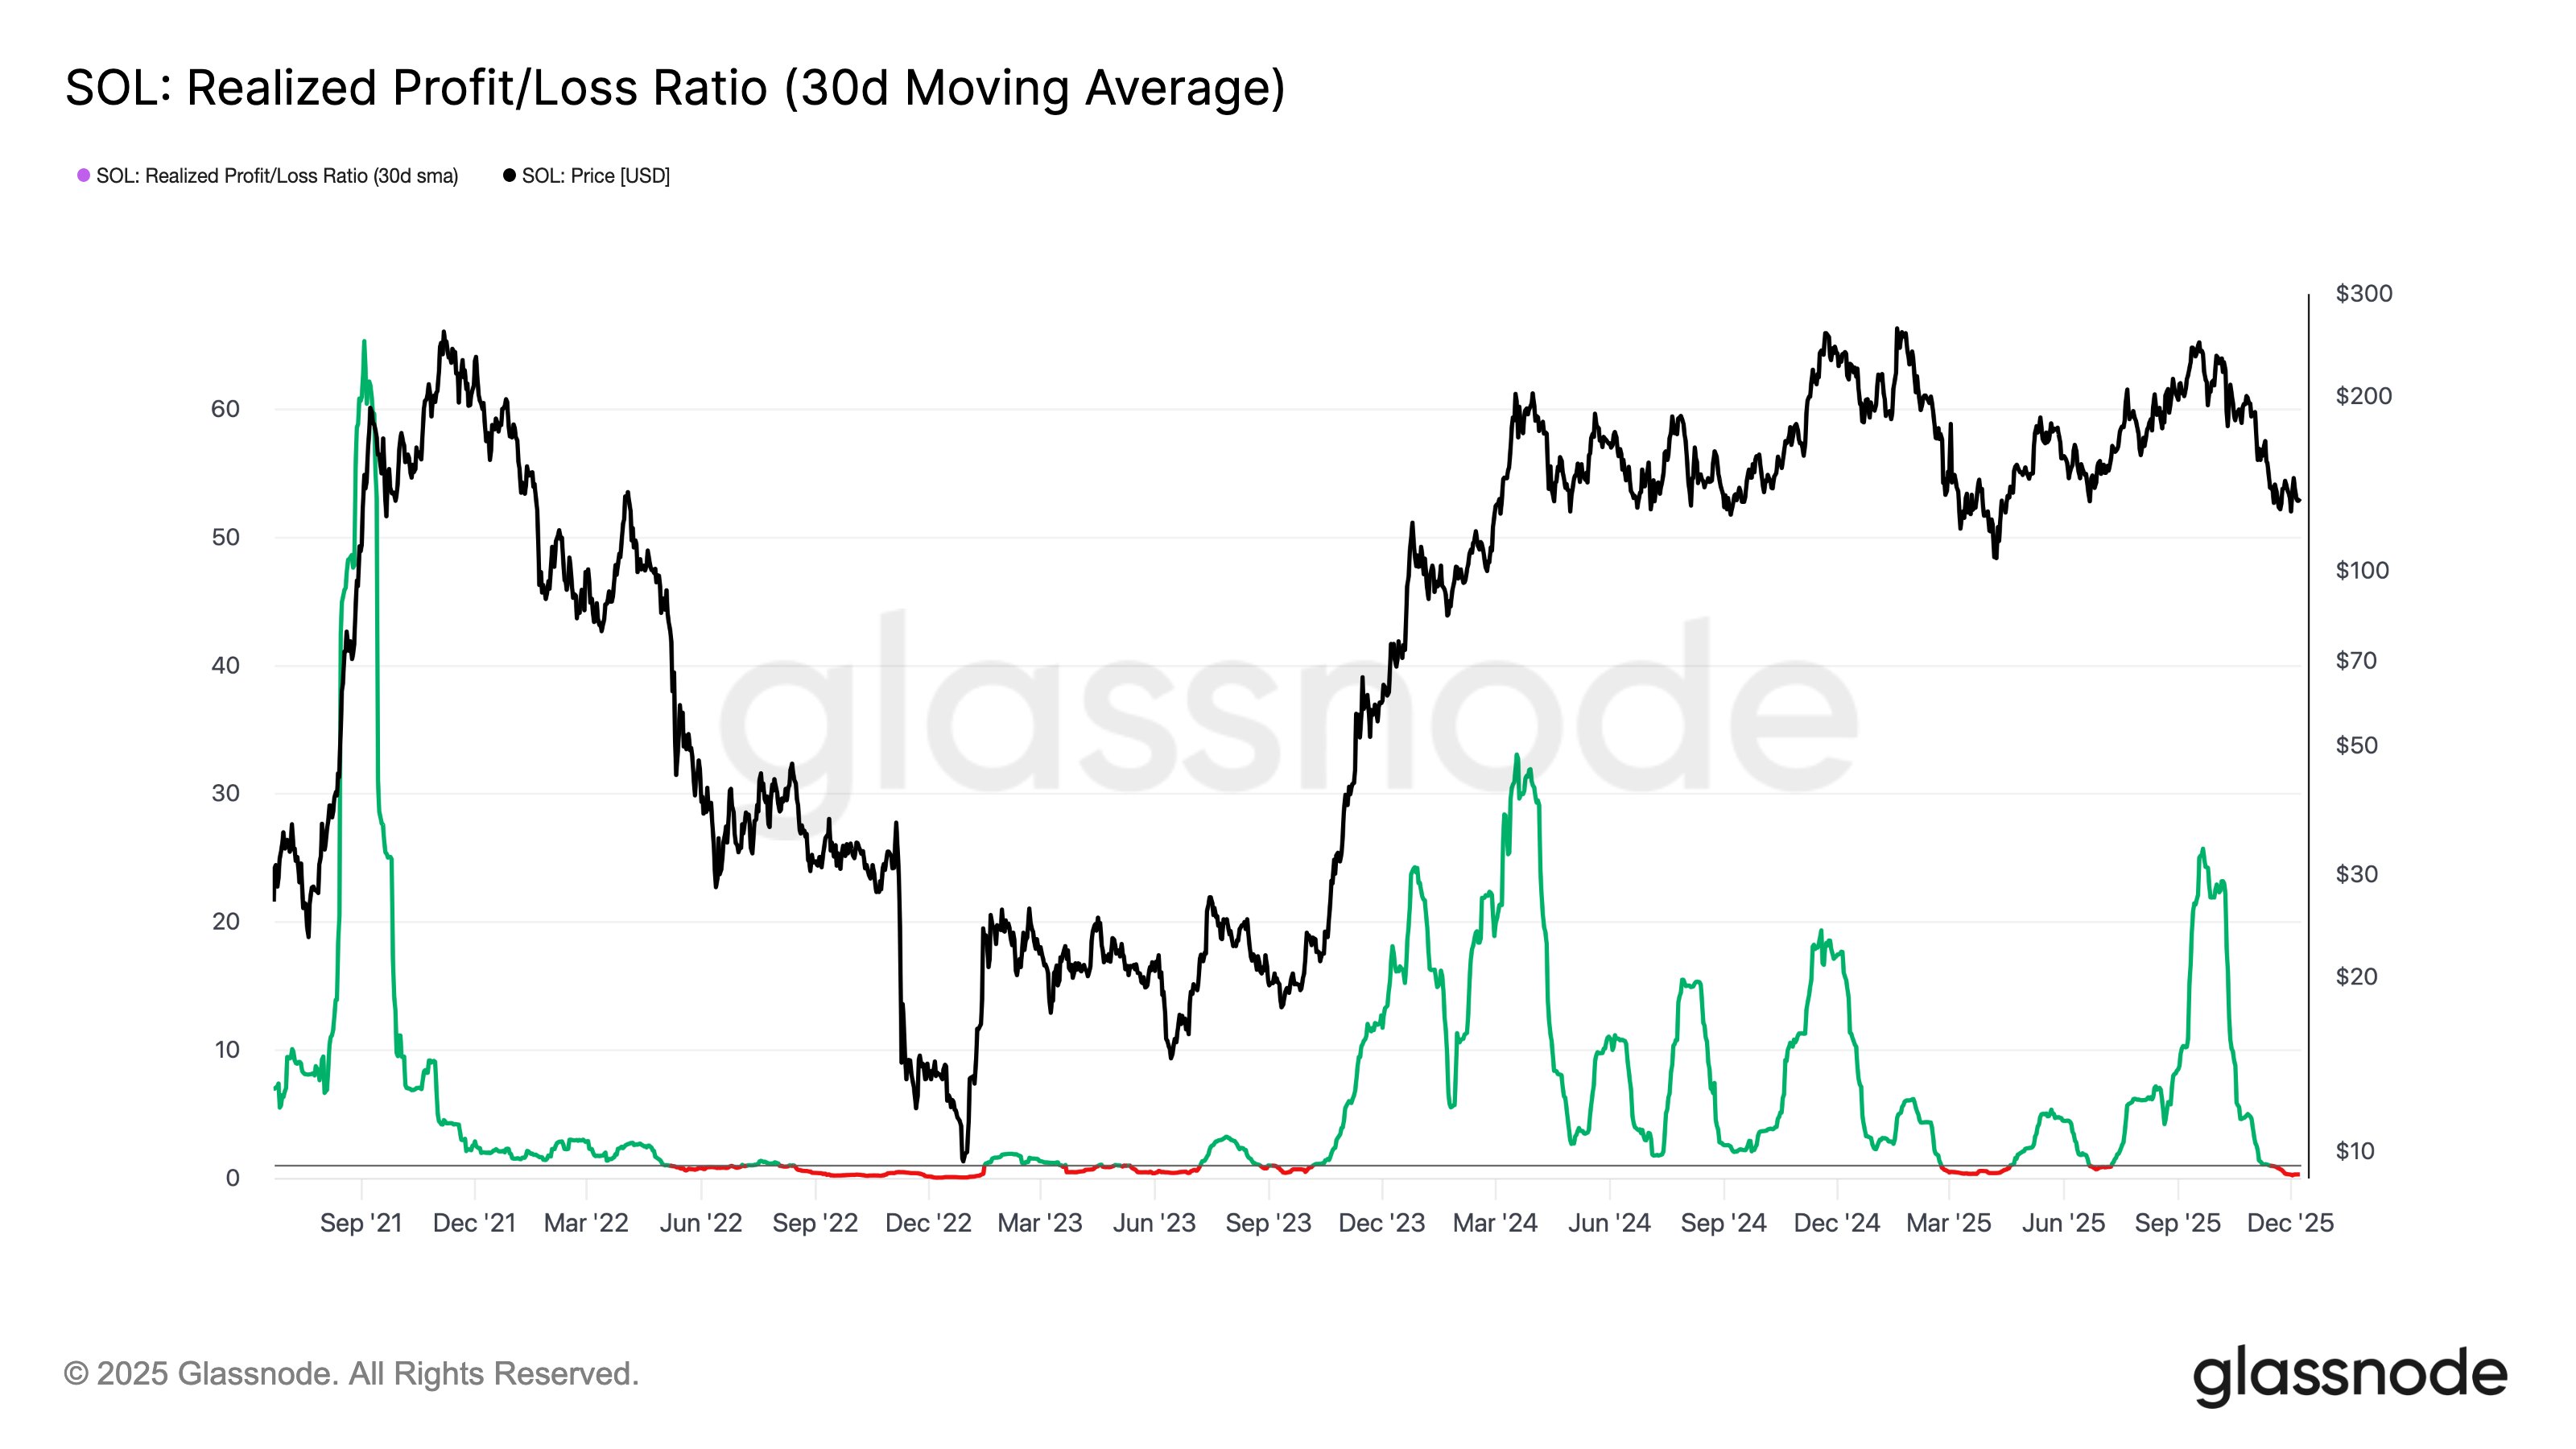
Market Structure Still Shows Old PatternsNot all evidence points to a finished cycle. Reports published by on-chain analytics firms such as Glassnode show behaviors among long-term holders that look like past up-and-down swings.
Demand from late-cycle buyers has softened in ways that mirror prior years, according to that research. It is being argued that halvings remain meaningful interruptions inside a longer trend, not irrelevant events.
Macro observers add that broader economic forces—rates, fiat liquidity, and institutional appetite—are increasingly important in the price story.
Investors should expect longer moves more often, with rallies stretching over more months and volatility generally lower, analysts say.
Wood suggested volatility is falling and that markets may already have hit a low a couple of weeks earlier.
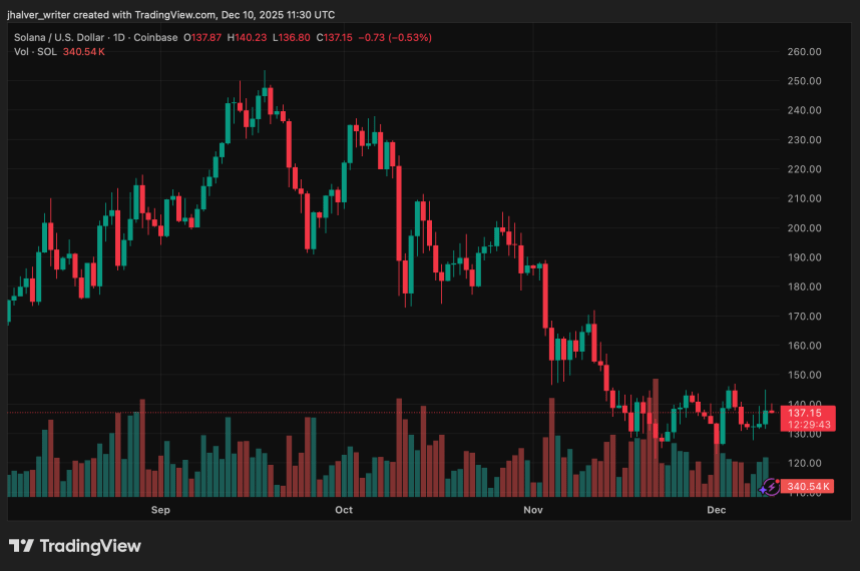
Featured image from Unsplash, chart from TradingView