Reading view

There are new articles available, click to refresh the page.

Institutions Scoop Up 9,000 Ether, Fueling Bullish Signals

Ethereum saw a flurry of big moves that traders say could matter for its next price swing. In just a few hours, major accounts pulled large sums off an exchange and big wallets opened sizable margin longs. Market watchers are parsing those moves for clues.

Institutions Shift Big Stakes

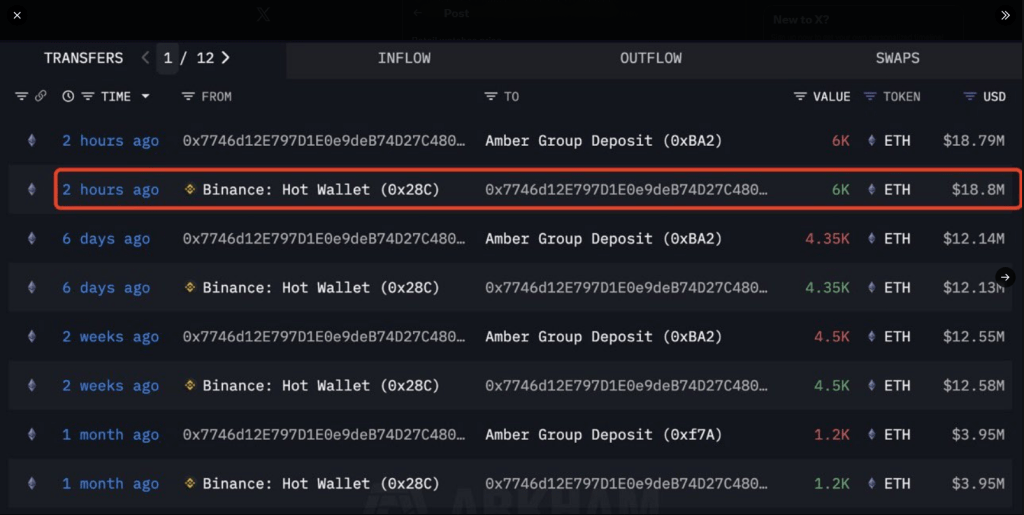
According to Arkham Intelligence, Amber Group and Metalapha pulled out 9,000 Ether from Binance in a short span, a haul worth more than $28 million at current prices.

Based on reports, institutional flows have been heavy for months — nearly 4 million ETH has been accumulated by institutions over five months. Those kinds of transfers are often linked to custody setups or long-term holdings rather than quick trades.

Whales Add Margin Bets

Several large wallets added roughly $426 million in margin long exposure. Wallets named 1011short and Anti-CZ are among the accounts that expanded long bets.

That kind of activity raises the chance of sharper moves in either direction: if prices rise, longs can feed a rapid upswing; if a pullback hits, forced selling could amplify losses. Market structure is tighter now than it was several months ago.

🚨 INSTITUTIONS ARE ACCUMULATING $ETH ~ QUIETLY.

In the last few hours:

• Amber Group withdrew 6,000 ETH ($18.8M) from Binance • Metalapha withdrew 3,000 ETH ($9.4M)

That’s 9,000 ETH pulled off exchanges in a single morning.

This is the same pattern we’ve seen for weeks:… pic.twitter.com/MBgyXoPfJz

— BMNR Bullz (@BMNRBullz) December 8, 2025

Available Supply Shrinks

On-chain data shows only 8.7% of ETH is currently held on exchanges. More than 28 million ETH is locked up in staking, custody, and what reports call long-term storage.

Staking inflows remain high, with over 40,000 ETH added per day on average. Less supply on exchanges can lower immediate selling pressure, making price swings more dependent on fresh buy orders.

Price Range And Key Levels

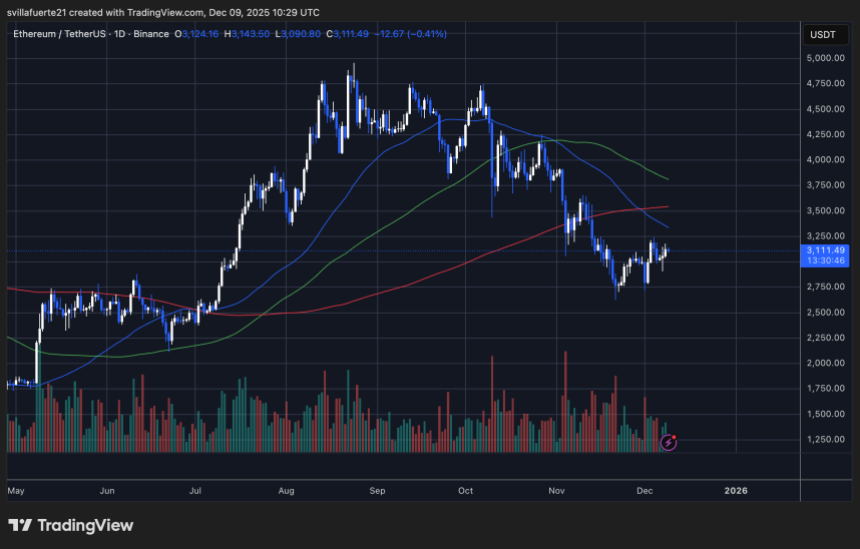
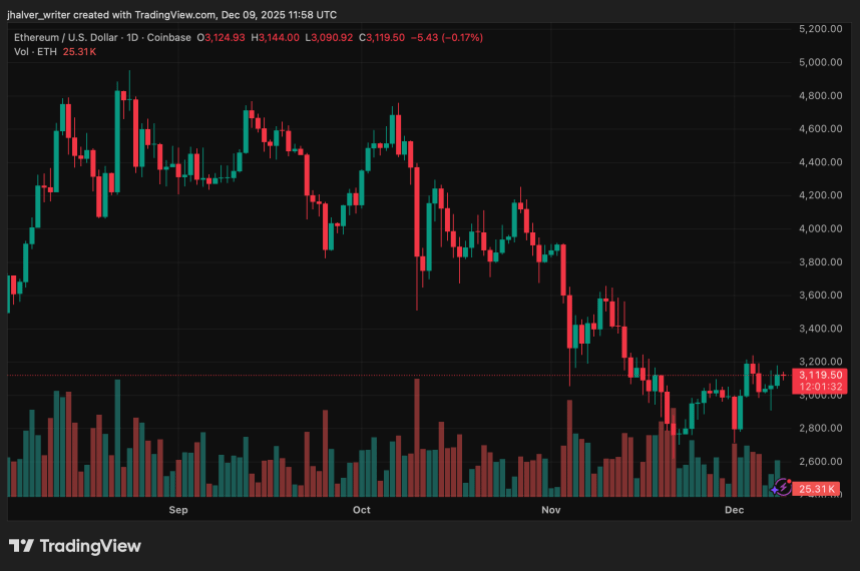
Ethereum has gained 2.5% in the last 24 hours and is trading near $3,050. According to an analyst’s chart, ETH has been moving inside a tight range between $3,050 and $3,200, with $3,100 acting as a support line.

Traders say a clear break above the $3,300–$3,400 band could open the way toward $3,700 to $3,800. Failure at that resistance would likely push prices back toward $3,000, where buyers may step in again.

Regulatory Step Could Matter

In a related development, the US Commodity Futures Trading Commission has launched a pilot that allows Ethereum, USDC and Bitcoin to be used as collateral in regulated derivatives venues.

Acting Chair Caroline Pham unveiled the plan in Washington and said the move will let regulators observe how tokenized collateral behaves in stressed conditions.

The program sets rules for custody, segregation, and valuation tests inside a controlled environment.

Featured image from Unsplash, chart from TradingView

Bitcoin Treads Water At $90,000 — Market Braces For FOMC To End The Compression Phase

Bitcoin is currently holding steady, trading water around the critical $90,000 level as the market enters a period of high compression. With ETF inflows slowing down, the price lacks the momentum to break through overhead resistance. The highly anticipated FOMC meeting is expected to provide the necessary catalyst to end the current consolidation and dictate Bitcoin’s next major directional move.

BTC Compression Intensifies: Scaling Back Intraday Scalps

According to a recent update from Lennaert Snyder, Bitcoin continues to tighten within a compression phase. The market has been trading in an increasingly narrow range, signaling that a larger move is approaching. Snyder noted that the scalp long and short setups from his previous analysis played out well.

He explained that as compression increases, the reward-to-risk ratio naturally declines. While the trades were profitable, they still fell into the category of “C-setups,” meaning they lacked the cleaner momentum and clarity found at range boundaries. Snyder emphasized that the best trading opportunities always emerge at the edges of a range.

With the current setup, his focus remains on the key resistance area around $94,000. A breakout above that level could offer long opportunities, while a failure there may open the door for shorts. On the downside, if price sweeps the lows and returns to the $87,400 support region, long entries are likely following signs of reversal.

Bitcoin

However, he added that if Bitcoin fails to show strength during this phase, he is not eager to take new long positions. A deeper retest of the $83,200 zone could become the next area of interest, though he expects any move toward that level to come with a liquidity sweep. 

Snyder also mentioned that he remains in shorts as a hedge, with scalp shorts still acceptable for traders who understand the increased risk at this stage. He concluded by highlighting the importance of the upcoming FOMC meeting, noting that the market is likely to stay muted until then.

Upcoming FOMC Meeting Dictates Bitcoin’s Next Major Move

Analyst Ted, in a recent update, revealed that BTC is currently in a state of consolidation around the $90,000 level. This tight range-bound movement suggests that while selling pressure is not dominant, buyers are also struggling to push the price higher aggressively.

Ted attributed the market’s current stagnation and its inability to break above major resistance levels to a slowdown in institutional investment. Specifically, he noted that recent ETF inflows have slowed down, removing a major source of directional buying pressure that typically drives breakouts.

Furthermore, the analyst highlighted that a critical macroeconomic event is pending: the FOMC meeting is scheduled for tomorrow, and the market’s next significant directional move will be heavily dependent on the outcome.

Bitco0in

Dogecoin Stabilizes Above Key Support as Adoption Rises and Long-Term Outlook Strengthens

Dogecoin (DOGE) is, in another consecutive week, settling into a familiar pattern: holding firm at a crucial support zone while market participants weigh technical signals, shifting adoption trends, and the ever-present influence of its community.

As the token trades around $0.14, its price behavior reflects a broader phase of consolidation, characterized by tighter volatility and increasing on-chain engagement. With new real-world use cases emerging and traders watching for a breakout, DOGE’s long-term trajectory is becoming a point of renewed discussion.

Dogecoin DOGE DOGEUSD DOGEUSD_2025-12-09_12-33-27

Network Activity Strengthens as Dogecoin Price Holds Key Support

Despite muted market reaction to Dogecoin’s 12th anniversary, activity on the network continues to rise.

Daily active addresses reached over 67,000 earlier in December, marking the second-highest level in three months. This increase comes as DOGE repeatedly defended the $0.14 support, forming a tight compression range between $0.1406 and $0.1450.

Short-term charts indicate multiple rebounds from the $0.14 level, accompanied by decreasing sell volume, an early sign of accumulation.

Analysts identify $0.16 as the threshold that would shift DOGE from range-bound movement into a potential trend continuation. Failure to hold support, however, could expose deeper downside toward $0.081, an area highlighted by realized on-chain distribution clusters.

Adoption Expands Beyond Market Narratives

Recent developments show Dogecoin slowly expanding beyond its memecoin label. In Argentina, certain taxes can now be paid using DOGE, while Alternative Airlines has begun accepting the token for ticket purchases. These integrations, although still modest, indicate real-world traction that supports a longer-term use case narrative.

Broader sentiment, however, remains closely tied to macroeconomic conditions. Analysts note that liquidity trends, regulatory developments, and institutional risk appetite continue to shape DOGE’s outlook.

The launch of the first Dogecoin ETF in November drew little initial inflow, signaling that large investors remain cautious despite the token’s growing visibility.

Long-Term Structure Points to Potential Upside

From a structural standpoint, Dogecoin continues to follow a multi-year pattern that some analysts view as constructive. Long-term charts show price action moving within a large triangle formation dating back to 2021, with a cup-and-handle structure still intact on higher timeframes.

Weekly RSI levels near 50 resemble conditions seen before DOGE’s 2021 rally, while MACD indicators approach bullish crossovers on both weekly and monthly charts.

Forecasts place Dogecoin’s path toward $1 as a possibility later in the decade, with projections suggesting a climb toward that level by 2030. In the near term, the $0.145–$0.16 zone remains the defining barrier that could determine whether DOGE transitions into a stronger upward phase or remains confined to its current band.

As Dogecoin stabilizes above key support and real-world adoption increases, traders are closely watching for the next catalyst, whether it be network expansion, macroeconomic shifts, or renewed community-driven momentum.

Cover image from ChatGPT, DOGEUSD chart from Tradingview

Crypto Market Structure Talks: Senator Lummis Addresses Latest Legislation Plans

Senators engaged in bipartisan discussions regarding the anticipated crypto market structure bill met on Tuesday amid ongoing disagreements about the timing of a committee vote on the legislation. 

According to a report from Politico, Sen. Cynthia Lummis, a key negotiator for the Republican side, expressed optimism that a new draft of the bill could be released this week. 

Lummis aims to have the bill ready for markup before Congress adjourns for the holiday break, stating, “Knock on wood, I hope to share a draft at the end of this week that reflects our best efforts to date.”

Lummis Urges Swift Progress On Crypto Legislation

During a panel discussion hosted by the Blockchain Association, Sen. Lummis emphasized the urgency of progressing with the legislation. She remarked that it might be advantageous for lawmakers to finalize a product and proceed with the markup next week, allowing everyone to take a break for the Christmas holidays. 

In related developments, Politico reported that Senate Banking Republicans submitted a proposal to their Democratic counterparts last week, suggesting over 30 amendments to a previous draft of the legislation. 

The three-page document, which comes from GOP senators on the Banking Committee, seeks to maintain certain elements of the original bill while incorporating adjustments acceptable to Democratic lawmakers.

Senate Banking Committee Chair Tim Scott and other Republicans are eager to finalize the markup next week, although some Democrats have expressed skepticism about this ambitious timeline. Following a meeting on Monday, Democrats sent a response to the GOP offer, but details of their feedback remain unclear.

Concessions In GOP’s Proposal 

The GOP’s proposal outlines the aspects from a September crypto market structure framework that they agree to integrate into a bipartisan bill, hoping to reconcile differences with their Democratic colleagues. 

The proposal includes a two-column table delineating 38 concessions the Republicans are willing to make, in exchange for retaining or modifying 32 sections of the original Responsible Financial Innovation Act discussion draft.

Among the concessions is language that reflects White House approval, which could address Democratic concerns regarding appointments to the Securities and Exchange Commission (SEC) and the Commodity Futures Trading Commission (CFTC). 

Additionally, the proposal contains ethics provisions aimed at addressing scrutiny over the Trump family’s business connections in the crypto sector. 

However, Lummis noted a previous ethics proposal she negotiated with Sen. Ruben Gallego was rejected by the White House, and she plans to collaborate further with Democrats to revisit the issue.

Other notable concessions from the Republicans include a section on consumer protection standards for digital assets, proposed language regarding bankruptcy, the establishment of a federal baseline for crypto ATMs, and risk management standards for digital asset intermediaries. 

Crypto

Featured image from DALL-E, chart from TradingView.com 

Ethereum Sees Largest Binance Inflow Since 2023 – Warning Sign?

Ethereum has spent the past several days consolidating in a tight range between $3,000 and $3,200, signaling a moment of hesitation as the broader market struggles to find direction. Despite attempts to push higher, momentum has flattened, and uncertainty continues to dominate sentiment. Many analysts now warn that Ethereum may be entering a deeper bearish phase, pointing to weakening spot demand, fragile market structure, and fading optimism across major exchanges.

However, one on-chain development has captured the market’s attention. According to new data from CryptoQuant, December 5, 2025 saw a massive spike in Ethereum Exchange Netflow to Binance, marking one of the largest daily inflows in years. Such a surge typically raises questions about investor intentions: large inflows often signal that holders are moving ETH onto exchanges with the potential to sell, increasing the probability of short-term volatility or downside pressure.

Yet the broader context matters. Ethereum’s price remains above key support, suggesting that the market is in a critical decision zone rather than a confirmed breakdown. This combination of consolidation, rising caution, and an unusually large exchange inflow sets the stage for what could become a pivotal moment for ETH as traders prepare for the next major move.

Massive Netflow Surge Raises Caution for Ethereum

According to data from CryptoOnchain shared on CryptoQuant, Ethereum experienced a striking shift in exchange activity on December 5, 2025. The netflow to Binance reached 162,084 ETH while the price hovered near $3,021, marking the largest daily positive netflow since May 2023. Such an influx is significant, not only because of its size but because of what it typically signals: a rise in the number of investors moving ETH from self-custody to exchanges.

Ethereum Exchange Netflow on Binance | Source: CryptoQuant

Historically, large positive netflows are interpreted as potentially bearish, suggesting that holders may be preparing to sell or rebalance. When deposits drastically outweigh withdrawals, it can precede heightened selling pressure, especially when the market is already in a fragile state. Inflows of this magnitude can act as a temporary supply shock; if even a portion of this ETH hits the order books as market sells, the price could face increased volatility or short-term corrective pressure.

Because of this, traders should closely monitor how Binance absorbs this liquidity. Watching order book depth, open interest reactions, and subsequent netflow patterns will reveal whether this was a one-off spike or the beginning of a broader shift in investor behavior. In a market this delicate, even a single inflow event can set the tone for the days ahead.

ETH Price Attempts Stabilization

Ethereum’s daily chart shows a market in the process of stabilizing, but still weighed down by significant structural resistance. After dipping below $2,800 in late November, ETH has managed to reclaim the $3,100 region, where it has been consolidating for several days. This range-bound behavior signals a pause in the prior downtrend, yet the recovery lacks the strong momentum typically seen in bullish reversals.

ETH consolidates between key levels | Source: ETHUSDT chart on TradingView

The 50-day and 100-day moving averages remain positioned above the current price, forming a clear zone of resistance between $3,250 and $3,500. These declining MAs highlight that the broader trend still favors sellers, and ETH will need a decisive breakout above them to shift market sentiment. The 200-day MA, sitting higher, reinforces the idea that Ethereum is still trading below its long-term trend structure.

Volume has also weakened during this rebound, suggesting that buyers are hesitant to commit aggressively at current levels. The recent spike in exchange netflows adds another layer of caution, raising the possibility of increased near-term selling pressure.

ETH is showing early signs of stabilization, but the path forward requires stronger conviction. Until price breaks above the cluster of moving averages, this recovery remains fragile and vulnerable to renewed downside pressure.

Featured image from ChatGPT, chart from TradingView.com

Bitcoin Addresses Holding Over 0.1 BTC Haven’t Grown in Two Years, What Does This Mean?

Since Bitcoin’s launch, the number of addresses holding more than 0.1 BTC has climbed steadily through every market cycle, until now. Data shows that addresses in this cohort haven’t grown at all over the past two years, breaking a trend that held for more than a decade. 

The stagnation indicates a change in how smaller and mid-sized investors engage with Bitcoin, even as broader institutional activity in the market continues to rise.

Small Holder Participation Reaches A Standstill

The 0.1 BTC threshold has historically represented an important milestone for retail holders, large enough to signal commitment but small enough to remain widely attainable. For more than a decade, wallets crossing that line grew year after year, even during drawdowns when long-term buyers were accumulating quietly.

That pattern is no longer intact. The number of addresses with more than 0.1 BTC has flattened since 2023 and is showing no signs of returning to its previous trajectory. Particularly, data from the on-chain analytics platform Santiment shows that the number of these addresses has stalled at around 4.44 million for the past year. This suggests that fewer new participants are choosing to build self-custodied Bitcoin positions at this level.

Bitcoin

The stagnation becomes more notable considering Bitcoin’s rising mainstream visibility and repeated pushes toward new all-time highs this year. In earlier cycles, such conditions have led to a surge in retail accumulation. This time, the address count has stayed frozen, and this means retail addresses holding Bitcoin might actually be plateauing. 

How Bitcoin’s Holder Base Is Changing

Although on-chain data points to a slowdown in the growth of overall Bitcoin addresses holding more than 0.1 BTC, it doesn’t necessarily signal a decline in overall adoption. For many market participants, Bitcoin exposure now happens entirely off-chain.

Larger investor cohorts, from high-net-worth individuals to funds and corporate entities, are buying huge amounts of Bitcoin. For instance, Santiment data shows that large Bitcoin holders controlling more than 100 BTC have increased their balances throughout 2024 and 2025, even as smaller address cohorts have stalled.

At the same time, more investors are choosing to access Bitcoin through custodial avenues instead of managing their own wallets. Spot Bitcoin ETFs have become one of the most important gateways for new BTC exposure. In the US alone, Spot Bitcoin ETFs now control almost $120 billion worth of Bitcoin, with BlackRock’s IBIT consistently recording the strongest demand. 

Together, these developments point to a new phase in Bitcoin’s development. What was once dominated by individual self-custodied users is now increasingly shaped by institutions, ETFs, funds, and professionally managed capital. Therefore, the numbers from on-chain wallet metrics reflect a smaller portion of the actual user base.

Bitcoin

Circle Gains Major Regulatory Foothold in UAE With ADGM License to Scale Stablecoin Adoption

Circle’s slow but steady expansion into the Middle East has taken a decisive step forward, as the USDC issuer secured a Financial Services Permission (FSP) license from Abu Dhabi Global Market (ADGM).

The move positions the company at the center of the UAE’s growing digital-asset ecosystem, strengthening its ability to scale stablecoin adoption across the region.

For a market actively developing clearer regulatory frameworks and attracting global crypto players, Circle’s entry underscores the central role stablecoins have come to play in payment infrastructure and cross-border finance.

Circle Ethereum ETH ETHUSD ETHUSD_2025-12-09_12-58-28

Circle Secures ADGM Approval and Expands Regional Strategy

The license, granted by ADGM’s Financial Services Regulatory Authority, permits Circle to operate as a regulated Money Services Provider within the financial free zone.

This follows preliminary approval earlier this year and gives the firm formal permission to offer USDC-powered payment, settlement and on-chain financial tools to businesses and institutions across the UAE.

Alongside the approval, Circle appointed Dr. Saeeda Jaffar as managing director for the Middle East and Africa. A long-time payments executive with leadership experience at Visa and major consulting firms, she will guide Circle’s expansion efforts, deepen local partnerships, and help integrate USDC into regional prospects.

Her appointment reflects Circle’s intent to localize operations and strengthen ties with banks, enterprises, and government entities.

UAE Supports Push Toward Regulated Digital Finance

Circle’s regulatory milestone comes as the UAE increases its efforts to build an institutional-grade digital asset ecosystem. ADGM and Dubai’s DIFC have both issued stablecoin and token frameworks designed to offer clarity for companies operating in the sector.

USDC and EURC were recognized earlier this year under Dubai’s crypto token regime, providing Circle with visibility across both major financial zones in the country.

The approval also coincides with a wave of regulatory progress for other major players. Binance received full authorization to operate its global platform under ADGM oversight this week, while Tether secured recognition for USDT across multiple blockchain networks.

These developments show how Abu Dhabi is positioning itself as a global hub for regulated stablecoin activity, driven by remittance demand, trade flows, and a growing emphasis on compliance.

Stablecoin Adoption Enters New Phase

The UAE’s structured approach comes at a time when stablecoins are gaining broader acceptance in global finance.

With regulatory guardrails expanding internationally and stablecoins increasingly used for cross-border payments, Circle’s license opens the door for wider USDC adoption in corporate finance, developer applications, and digital-asset settlement.

Related Reading: Bitcoin Speculation Muted: Glassnode Analyst Calls Perps A ‘Ghost Town’

For Circle, the ADGM license marks a pivotal foothold in one of the world’s fastest-moving regulatory environments. For the UAE, it reinforces an ambition to lead in compliant digital-asset innovation while shaping standards for a rapidly evolving sector.

Cover image from ChatGPT, ETHUSD chart from Tradingview

Bitcoin Sees Largest Annual Exchange Drop: Over 400,000 Coins Gone

Bitcoin’s on-exchange supply has dropped sharply, and traders are taking note. According to Santiment, more than 403,000 BTC have left exchanges since December 7, 2024 — roughly 2% of Bitcoin’s total supply.

That shift, measured against an on-exchange balance of about 2.11 million BTC in late November, is being seen as a sign that fewer coins are poised for quick sale.

Exchange Balances Shrink

Santiment said lower exchange balances have historically been linked with fewer sudden sell-offs, an observation many market watchers find encouraging.

The math is straightforward: when a big chunk of supply sits outside exchanges, there is less immediately available stock to meet selling pressure.

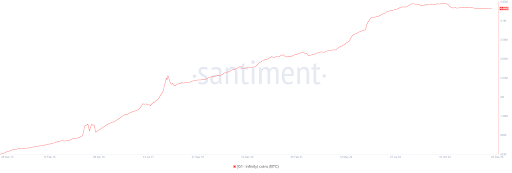
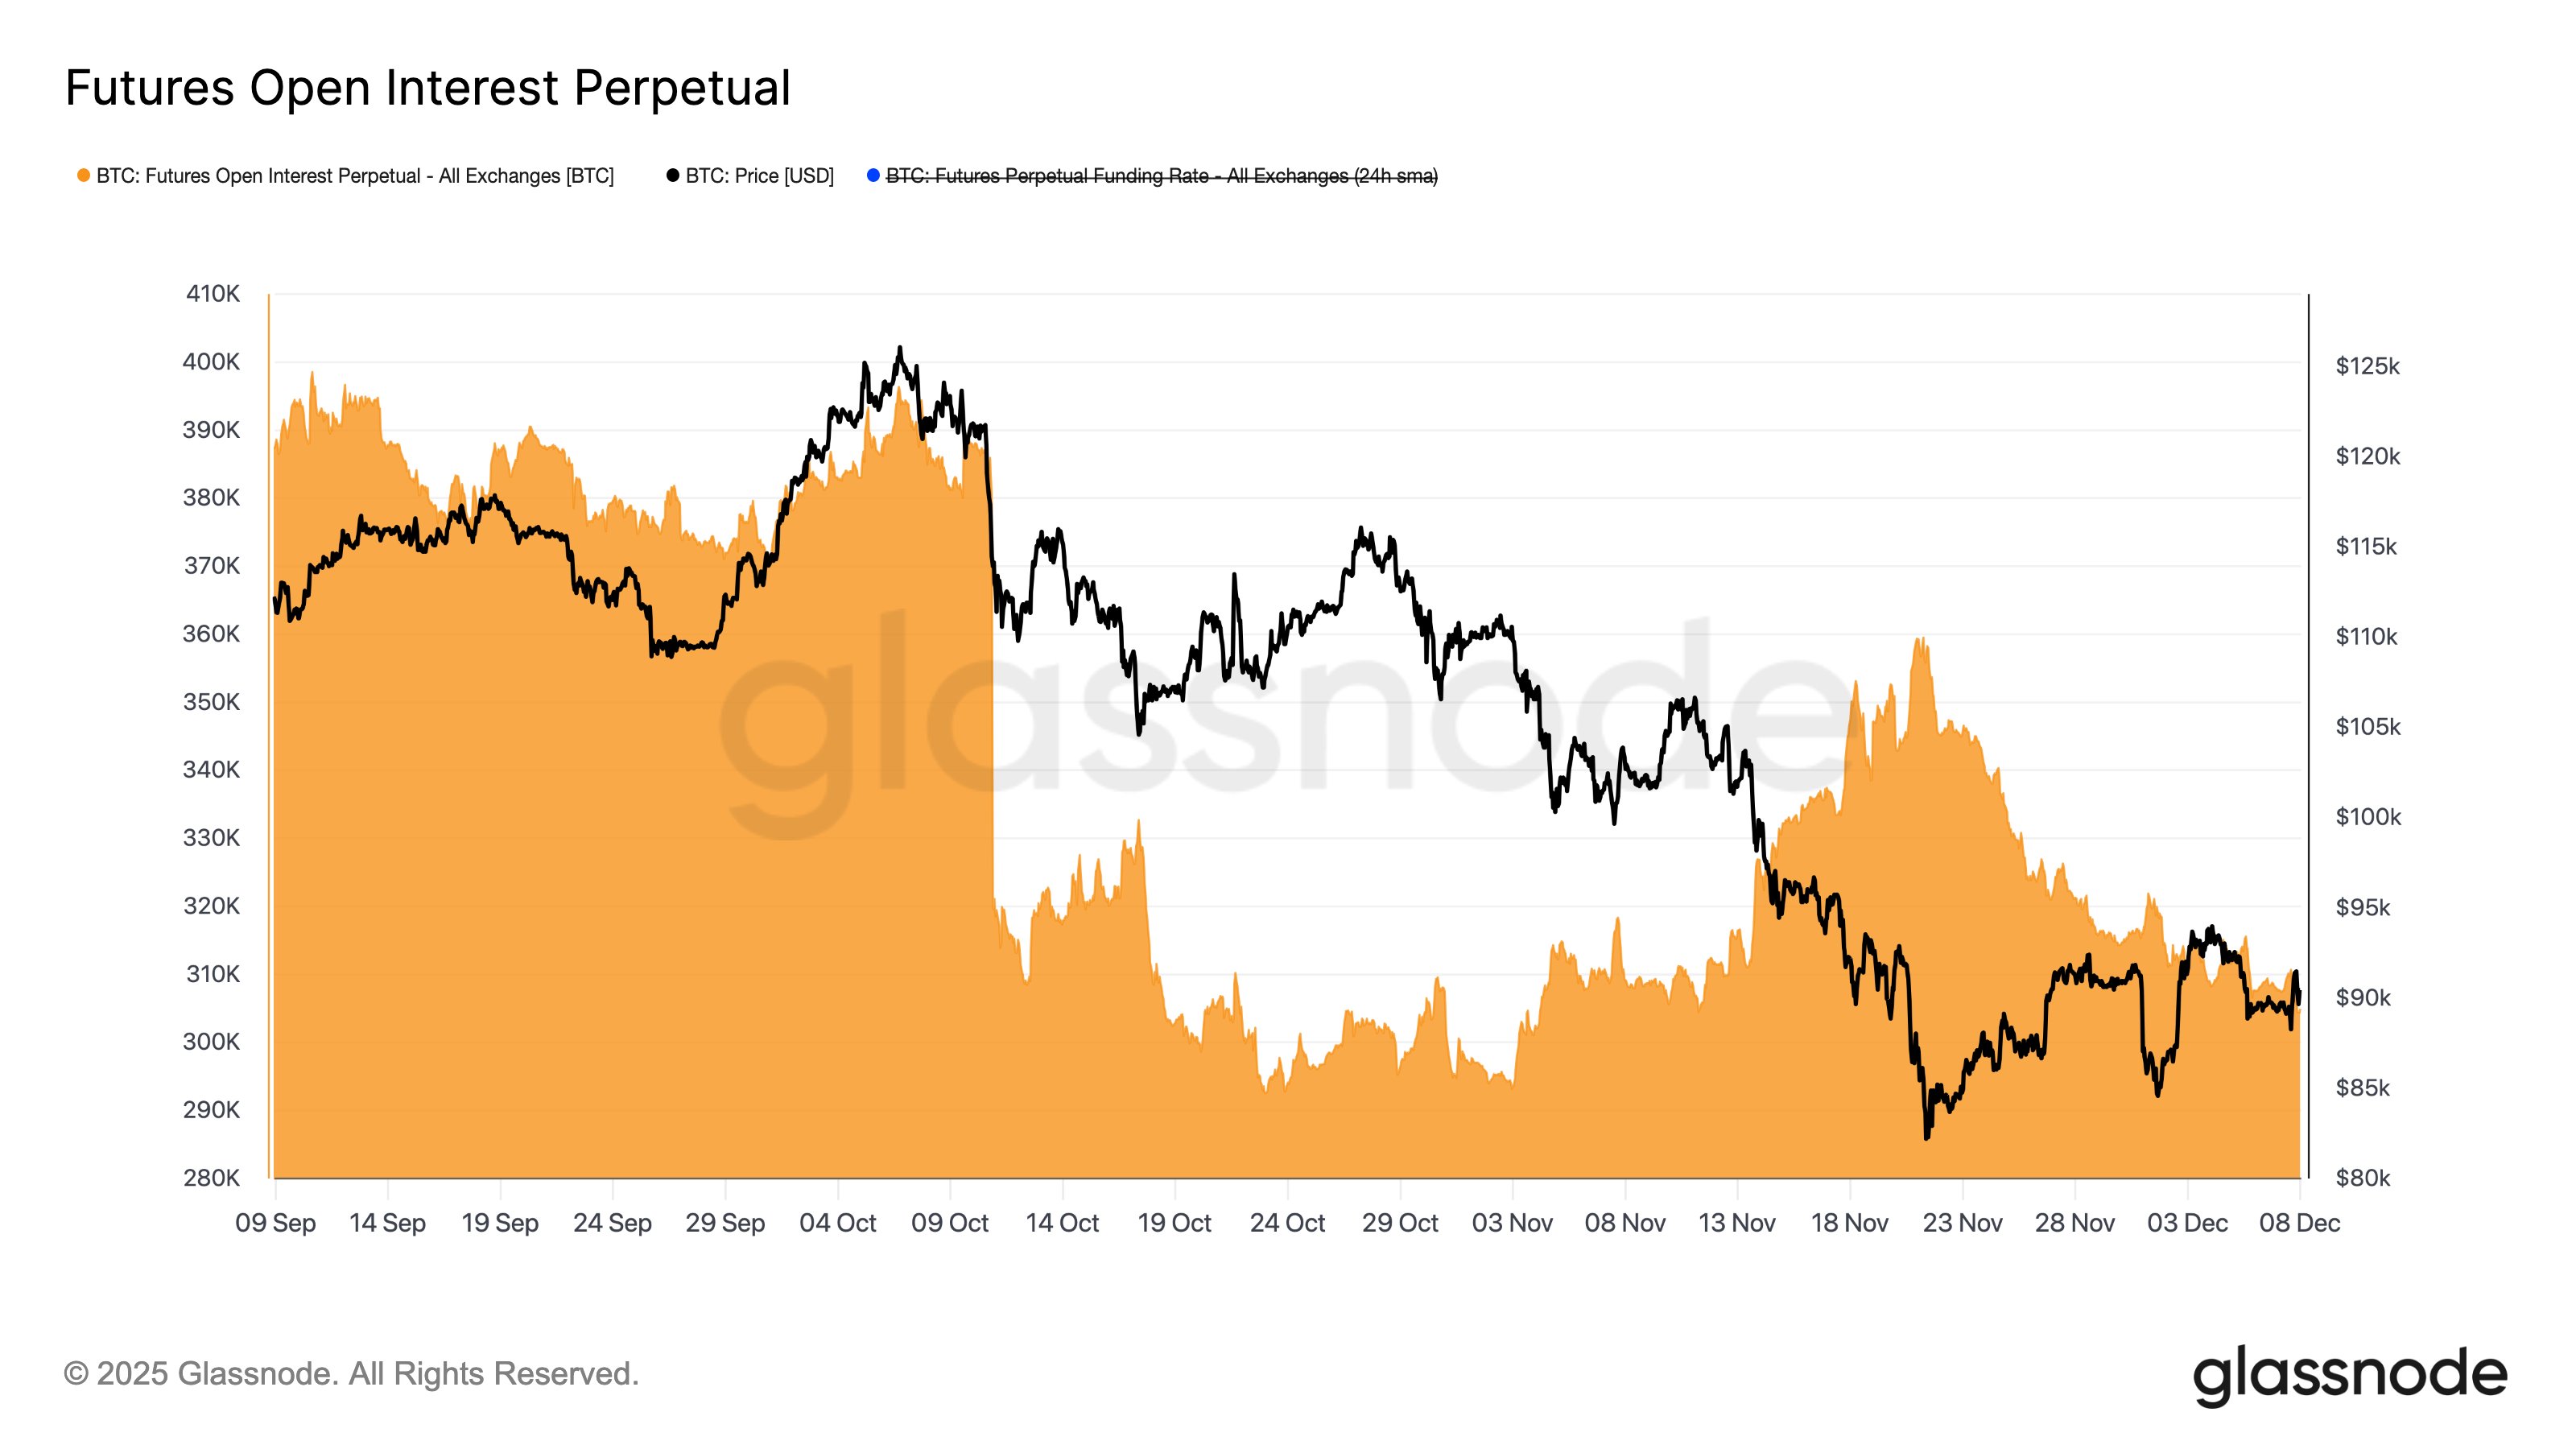
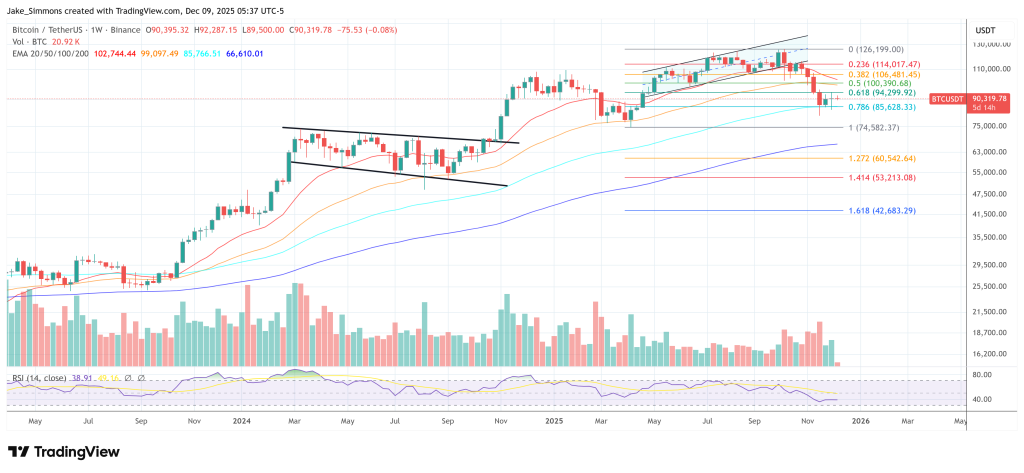
📊 As Bitcoin’s market value hovers around $90K, crypto’s top market cap continues to see its supply moving away from exchanges. Over the past year, there has been:

📉 A net total of -403.2K $BTC moving off exchanges 📉 A net reduction of -2.09% of $BTC‘s entire supply moving… pic.twitter.com/Y0JTC880Np

— Santiment (@santimentfeed) December 8, 2025

Institutions Step In

Based on reports from BitcoinTresuries.Net and others, exchange outflows are not only going to private cold wallets. ETFs and public firms are also accumulating.

BitBo lists ETFs holding over 1.5 million BTC and public companies holding over 1 million. Combined, those holdings represent nearly 11% of the total Bitcoin supply.

According to analysts, institutional vehicles have quietly absorbed a lot of coins, changing where Bitcoin sits and who can sell it.

Supply Moves Matter

This is more than bookkeeping. Coins locked in institutional or self-custodied vaults are not sold on a whim. That makes available supply tighter.

At the same time, coins leaving exchanges can lead to sharper price moves when demand surges because the pool of sellable coins is smaller. Some of the effects are already visible on price charts; others may show up later if buying pressure picks up.

Price Action And Macro Focus

Bitcoin traded near $90,650 with a small rise of 0.28% in recent action. Year-to-date gains stand at 11%. The market swung from a daily low of $89,540 to a high of $92,290, showing active trading around current levels.

Traders are watching a Federal Reserve meeting closely, and the outcome is expected to drive short-term volatility. Interest-rate cues often move broader markets, and crypto is no exception.

Market Outlook And Risks

Overall, the move off exchanges looks like a bullish backdrop because it reduces immediate selling liquidity. Still, that same scarcity can make prices more sensitive to changes in demand, which raises the possibility of sharper swings.

Analysts will be watching whether ETFs and public firms continue to add to their holdings or start to slow down purchases.

Featured image from Unsplash, chart from TradingView

Bitcoin In An Opportunity Zone? Hash Ribbons Flash New Buy Signal

On-chain data shows the popular Bitcoin Hash Ribbons indicator has just given a miner capitulation signal. Here’s what this could mean.

Bitcoin Hash Ribbons Now Signaling Miner Stress

As pointed out by CryptoQuant author Darkfrost in an X post, the Bitcoin Hash Ribbons have shown a crossover that has historically corresponded to rising stress among the miners. The Hash Ribbons indicator aims to gauge the situation of the miners by comparing the 30-day and 60-day moving averages (MAs) of the BTC Hashrate, a metric that measures the total amount of computing power that the validators as a whole have connected to the blockchain.

The trend in the Hashrate can act as a representation of the sentiment among the miners, as they usually expand computing power (an increase in the Hashrate) when mining is profitable and/or they believe BTC is heading toward a bullish outcome, while they decommission mining rigs (a drop in the Hashrate) when they are having a hard time breaking even.

The Hash Ribbons indicator basically captures shifts between these two behaviors. When the 30-day ribbon falls below the 60-day one, it means miners are reducing power at a fast rate. This can be a sign that this group is going through capitulation.

Such a crossover has recently formed again for Bitcoin, as the chart below shared by Darkfrost shows.

Bitcoin Hash Ribbons

Thus, it would appear that miners are once again in a phase of capitulation. “Historically, these periods of mining stress have been profitable for Bitcoin investors, with one exception during the 2021 mining ban in China,” noted the analyst.

The signal doesn’t act as a straightforward buy indicator, however, as mining capitulation often doesn’t directly coincide with a bottom. “In the short term, these periods tend to be bearish because miners may need to increase their selling to cover production costs,” explained Darkfrost.

In general, miner capitulation periods have tended to lead into profitable buying windows for the cryptocurrency, although it’s unpredictable how long such a phase would last. From the chart, it’s apparent that sometimes the Hash Ribbons signal has been quite brief, while other times it has been maintained for weeks.

As for what has forced miners to turn off Hashrate recently, the answer likely lies in the bearish trajectory that Bitcoin has witnessed. Miners obtain their reward in BTC denomination, so how the USD value of the coin fluctuates directly affects their dollar revenue.

Before this, miners had been in a phase of rapid expansion alongside the bull rally, which had led to an explosion in the network’s mining Difficulty. With the price plummeting and Difficulty being at extraordinary levels, miners have faced a double whammy during the past month.

BTC Price

Bitcoin saw a recovery above $92,000 on Monday, but it would appear that the asset wasn’t able to maintain it, as its price is now back at $90,300.

Bitcoin Price Chart

Why The Litecoin Price Could Stage A 33% Rally To $110

A crypto analyst has forecasted that the Litecoin price is gearing up for an explosive rally to $110. Unlike Bitcoin and Ethereum, which have seen considerable declines over the past few months, Litecoin appears to be stabilizing, gaining about 7.8% this past week, according to CoinMarketCap. Although LTC has seen its fair share of declines this year, analysts still hold hope that the cryptocurrency could cross the $100 threshold and reclaim former highs. 

Litecoin Price Targets A $110 Breakout

Litecoin may be preparing for a strong upward move, according to a new analysis from TradingView market expert MadWhale. The analyst has indicated that the cryptocurrency has the technical structure needed to break out of its long-term descending channel and potentially climb toward $110. With its current price sitting around $83, a surge to this level would represent a significant 33% rally. 

MadWhale has based his bullish LTC forecast on weekly candlesticks and how the cryptocurrency has consistently responded to past support and resistance levels. He explained that the altcoin had been trapped in a descending channel that has controlled its price for several weeks now. According to the TradingView analyst, Litecoin is now approaching the upper resistance region of the descending channel–a point where traders usually watch for either a clean breakout or a sharp rejection.

Litecoin

From the analyst’s price chart, Litecoin’s support zones have repeatedly held firm, showing that buyers consistently defended the area. Due to this steady support, he expects Litecoin’s bounce near the descending channel’s upper resistance to build momentum. If the support holds, MadWhale suggests the cryptocurrency could skyrocket to $110, completing its breakout from the descending channel. 

A breakout could signal a significant shift, potentially transforming Litecoin’s recent downtrend into a new bullish phase. MadWhale’s chart also highlights the cryptocurrency’s volatility, showing that in early October, LTC had rallied around 33.84%, climbing above $120. However, just days later, it crashed more than 17%, coinciding with the October 10 liquidation event that shook the market. 

Update On LTC’s Price Action

Litecoin is approximately 79% below its all-time high of over $410, recorded during the 2021 bull run. The cryptocurrency has dropped 17.68% over the past week and is down 33% for the year, mirroring the broader decline seen across altcoins. Despite its performance, LTC’s Fear and Greed Index remains in the neutral zone, suggesting that crypto investors are cautiously optimistic.

According to market analyst CW on X, the next sell wall for Litecoin is at $98, about 15% above its current price. Once the cryptocurrency reaches this level, CW expects a significant number of sellers to offload their coins. His chart also highlights the next key resistance levels for LTC, suggesting a potential surge to $98 first and then to the $106-$110 range.

Litecoin

Wall Street Giant Bernstein Predicts Bitcoin Price To Hit $1 Million By 2033

Wall Street research firm Bernstein has reiterated one of the boldest long-term calls in traditional finance, confirming a $1 million Bitcoin price target for 2033 while materially revising how and when it expects the market to get there.

Bernstein Keeps $1 Million Price Target For Bitcoin

The latest shift surfaced after Matthew Sigel, head of digital assets research at VanEck, shared an excerpt from a new Bernstein note on X. In it, the analysts write: “In view of recent market correction, we believe, the Bitcoin cycle has broken the 4-year pattern (cycle peaking every 4 years) and is now in an elongated bull-cycle with more sticky institutional buying offsetting any retail panic selling.”

The analyst from Bernstein added: “Despite a ~30% Bitcoin correction, we have seen less than 5% outflows via ETFs. We are moving our 2026E Bitcoin price target to $150,000, with the cycle potentially peaking in 2027E at $200,000. Our long term 2033E Bitcoin price target remains ~$1,000,000.”

This marks a clear evolution from Bernstein’s earlier cycle roadmap. In mid-2024, when the firm first laid out the $1 million-by-2033 thesis as part of its initiation on MicroStrategy, it projected a “cycle-high” of around $200,000 by 2025, up from an already-optimistic $150,000 target, explicitly driven by strong US spot ETF inflows and constrained supply.

Subsequent commentary reiterated that path and framed Bitcoin firmly within the traditional four-year halving rhythm: ETF demand would supercharge, but not fundamentally alter, the classic post-halving boom-and-bust pattern.

Reality forced an adjustment. Bitcoin did break to new highs on the back of ETF demand, validating Bernstein’s structural call that regulated spot products would be a decisive catalyst. However, price action has fallen short of the earlier timing: the market topped out in the mid-$120,000s rather than the $200,000 band originally envisaged for 2025, and a roughly 30% drawdown followed.

Related Reading: Bitcoin To Hit $50 Million By 2041, Says EMJ Capital CEO

What changed is not the end-state, but the path. Bernstein now argues that the four-year template has been superseded by a longer, ETF-anchored bull cycle. The critical datapoint underpinning this view is behavior in the recent correction: despite a near one-third price decline, spot Bitcoin ETFs have seen only about 5% net outflows, which the firm interprets as evidence of “sticky” institutional capital rather than the reflexive retail capitulation that defined previous tops.

In the new framework, earlier targets are effectively rescheduled rather than abandoned. The mid-2020s six-figure region is shifted out by roughly one to two years, with $150,000 now penciled in for 2026 and a potential cycle peak near $200,000 in 2027, while the 2033 $1 million objective is left unchanged.

In that sense, Bernstein’s track record is mixed but internally consistent. The firm has been directionally right on the drivers—ETF adoption, institutionalization, and supply absorption—but too aggressive on the speed at which those forces would translate into price. The latest note formalizes that recognition: same destination, slower ascent, and a Bitcoin market that Bernstein now sees as governed less by halvings and more by the behavior of large, ETF-mediated capital pools over the rest of the decade.

At press time, BTC traded at $90,319.

Bitcoin price

Shiba Inu’s Volume Explosion: Leading Meme Coin Barrels Ahead In This Metric

Shiba Inu has recorded a notable surge in spot trading activity on several exchanges over the last seven days. This provides a bullish outlook for the second-largest meme coin by market cap, which has been one of the underperformers in this market cycle

Shiba Inu Sees Surge In Spot Trading Activity

CoinGlass data show a 154% surge in Shiba Inu USD spot trading volume on Kraken over the last seven days. There has also been a significant surge on other major exchanges, such as Binance, Bybit, OKX, and Gemini, during the same period. This indicates that spot buyers may be stepping in to defend the SHIB price at a critical support amid the broader crypto market decline

Notably, Shiba Inu is one of the altcoins that are in the green over the last week, suggesting that the bulls may be in control at the moment. CoinMarketCap data shows that the second-largest meme coin by market cap is up almost 7% during this period despite Bitcoin’s choppy price action. 

Meanwhile, further data from CoinGlass also shows that most leverage traders are currently betting on an increase in the Shiba Inu price, with the long/short ratio currently above 1. However, it is worth noting that derivatives volume is down by over 10% and open interest is down by almost 4%, which presents a bearish outlook for the meme coin. 

Another positive for Shiba Inu, besides the surge in spot trading volume, is that the Fed is likely to cut interest rates again at this week’s FOMC meeting. This could inject more liquidity into the crypto market, with altcoins like SHIB benefiting from it. Meanwhile, Bitcoin is currently looking to hold above the psychological $90,000 level, which could pave the way for higher prices for SHIB given their positive correlation.  

Community Gives Update On SHIB’s Progress

In an X post, Shiba Inu community member Shibizens gave an update on SHIB’s progress over the last few days. The community member noted that over 45 billion SHIB have been moved off exchanges, indicating that holders are accumulating. Shibizens also alluded to a $35 million whale transfer into a private wallet, suggesting that SHIB whales are also bullish. 

Furthermore, Coinbase is set to launch Shiba Inu futures on December 12 for institutional and retail investors, which could boost the meme coin’s adoption. Meanwhile, NYSE Arca has filed the 19b-4 for T. Rowe’s Shiba Inu ETF, bringing the ETF one step closer to launch. 

Shibuzens also highlighted upgrades on the Shibarium network, which could provide a major boost for SHIB. This includes the RPC upgrade, while a full privacy upgrade has been confirmed using encrypted tech. There are plans to roll this out by next year. 

At the time of writing, the Shiba Inu price is trading at around $0.000008498, up in the last 24 hours, according to data from CoinMarketCap.

Shiba Inu

Pundit Highlights The Condition That Will Trigger A 2,300% XRP Rally To $50

The XRP price is currently more than 45% below its all-time high and continues to decline amid broader market uncertainty. Despite the slow price action and weak momentum, a crypto analyst has projected that XRP could explode to $50 soon, providing reasons for his ambitious forecast. He boldly stated that the cryptocurrency will not experience a gradual climb to $5 or $10 first, but will instead jump straight to $50.

XRP To Hit $50 With A Ripple Bank Charter 

Crypto analyst Pumpius has outlined a compelling scenario that could dramatically transform XRP’s market outlook. The market expert claims that a single regulatory event could catapult XRP’s price to $50, representing more than a 2,300% increase from current levels around $2. In his thread post on X, he explained the reasons for his bold prediction and the trigger behind this parabolic surge .

Pumpius believes that XRP could skyrocket to $50 once Ripple secures a national trust bank charter from the United States Office of the Comptroller of the Currency (OCC). According to him, approval of this banking license would give Ripple the same powers as major US banks, as well as direct access to the Federal Reserve (FED). 

The analyst noted that through the charter, Ripple could gain the authority to custody crypto and tokenized assets, issue stablecoins, and settle securities under complete regulatory oversight. He described the potential approval of the banking license as a foundational move that could establish  Ripple as a leading force in US tokenized finance. 

Pumpius highlighted that XRP remains at the centre of the changes, positioned as the native bridge asset in this potential structure. He suggested that with a charter in place, banks, brokers, and funds could bypass intermediaries and interact directly with Ripple to move value into tokenized markets

According to the analyst’s predictions, the result of this shift could be a massive, sustained surge in liquidity and institutional demand for XRP, creating the ideal conditions for an unprecedented price rally. He explains that with $6.6 trillion moving through banks each day in global settlements, even a small fraction routed through XRP’s limited supply could drive its price higher toward $50. 

While the market expert’s forecast is ambitious, it hinges entirely on the OCC’s decision, which is not guaranteed and could be influenced by compliance standards, risk assessments, and broader financial policy considerations. Even with approval, actual integration by major institutions would likely take considerable time and depend on competition with existing settlement networks. 

Ripple Legal Victory Paves Way For $50 XRP Price

In his post, Pumpius suggested that Ripple’s prolonged legal battle with the US Securities and Exchange Commission (SEC) was part of a broader strategy to secure regulatory clarity. He viewed the former lawsuit as a smokescreen intended to delay, filter, and prepare the path for a national trust bank charter under the OCC. With the case now resolved, the analyst indicates that the timing is perfect for Ripple to pursue full regulatory approval and integrate XRP into mainstream banking channels.

Pumpius boldly declared that the day the OCC approves Ripple’s banking license will mark a turning point for XRP, transforming it from a cryptocurrency to “the rails of US finance.” At that point, the analyst argues that a $50 price target would be significantly undervalued. 

XRP price chart from Tradingview.com

XRP Secures $1B AUM Milestone, Sets ETF Speed Record In The US

XRP Spot ETFs have nearly crossed the $1 billion mark in assets under management (AUM), marking one of the quickest ramps since Ethereum, according to Ripple’s CEO.

Rapid Fund Growth In Weeks

According to the disclosure, the four XRP ETF products now hold about $1.23B in total net assets, which equals 597 million XRP at a reported XRP price of $2.06.

Reports have disclosed a fresh inflow of $30 million on Monday, Dec. 8, and the cumulative net inflow into these products stands close to $935 million.

Ripple CEO Brad Garlinghouse highlighted that the collective figure reached the $1 billion level in under four weeks after the first fund hit the market.

Canary Capital Leads With Heavy Flows

Canary Capital’s XRPC grabbed the most attention at launch, bringing roughly $245 million in net flows on its debut day on Nov. 13. Canary’s fund holds about 335.889 million XRP, valued at approximately $691 million, which represents 56% of the combined assets across the four funds.

👀<4 weeks, and XRP is now the fastest crypto Spot ETF to reach $1B in AUM (since ETH) in the US.

With over 40 crypto ETFs launched this year in the US alone, a few points are obvious to me:

1/ there’s pent up demand for regulated crypto products, and with Vanguard opening up…

— Brad Garlinghouse (@bgarlinghouse) December 8, 2025

The other managers hold smaller shares: Grayscale’s product holds 104.381 million XRP, about $215 million or 17.47% of the total; Bitwise carries 93.827 million XRP valued at $193.284 million or 15.7%; Franklin Templeton has 62.99 million XRP worth about $131.829 million, or 10.71%.

A Wave Of Approved Crypto Funds

Based on reports, this development follows a broader rollout of spot and futures crypto ETFs since US spot Bitcoin ETFs arrived in January 2024.

Ethereum spot products launched in July 2024, and Solana listings came in October 2025. The US Securities and Exchange Commission has approved more than 40 crypto-related ETF products this year, which market participants say has opened familiar rails for mainstream investors.

Vanguard’s choice to allow crypto access inside standard retirement and broker accounts is being cited as a change that lets many Americans gain exposure without deep crypto know-how.

What This Means For Investors

According to analysts and market observers, the speed of these flows underlines strong demand for regulated crypto vehicles. Big-name asset managers entering the market have helped create options that look and act like other mutual funds or ETFs, which can ease the path for retirement plans and advisers to take part.

At the same time, a large share resting in a single debut fund shows concentration risk: Canary’s XRPC accounts for more than half of the total net assets, and that matters for liquidity and fund dynamics if flows shift.

Fresh Inflows & ETF Demand

While $1.23 billion is a headline figure, market watchers will be watching fresh inflows, trading volumes, and how price moves react to ETF demand.

For now, XRP listings have drawn sizable attention, and the coming weeks should make clearer whether the early momentum will spread more evenly across products and push broader investor participation.

Featured image from Unsplash, chart from TradingView

Dogecoin Price Will Rally Before It Crashes, But What’s The Target?

The Dogecoin price is already struggling amid the bearish pressure that has dominated the crypto market recently. After the initial fall to $0.2, DOGE bulls had attempted to hold support, pushing for a rebound. However, with the bearish headwinds of the last quarter of the year, the Dogecoin price has since succumbed and is now trading below the $0.15 support level, and continues to struggle.

Despite the already troubling price performance, crypto analyst Weslad says that the worst might be yet to come. This is due to a corrective structure that has appeared on the meme coin’s price chart, and the result of this has been a bearish flag. As these technical developments unfold, the crypto analyst has warned investors of what to expect, outlining why the Dogecoin price could see a major crash while attempting to recover.

Dogecoin Price To Rise And Then Fall

The analysis, which was shared on the TradingView website, points to the bearish flag as a precursor of what is to come. Weslad explains that the bearish flag had triggered the Dogecoin price breakdown that had led to the downward leg. As a result, the sentiment has skewed negative so far, suggesting that there could be more declines to come.

However, the crypto analyst points out that the Dogecoin price is still well below its breakout zone. Given this, it is likely that there could be an initial relief rally for the meme coin. If this rally plays out, then there would be an initial decline below $0.12 to form support above $0.118. Once this support is established, then the resulting bounce is expected to push the Dogecoin price to $0.2.

Dogecoin price

Once this move is completed, though, the analyst predicts an even deeper crash on the horizon. From the $0.2 mark, Weslad’s chart shows that the Dogecoin price could decline another 70%, falling toward $0.05 in the process, which would mean a return to 2-year lows.

“The immediate plan is to monitor a pullback toward the minimum bearish flag targets around the $0.12 region, which aligns with the former structure support and breakout zone,” the crypto analyst said. This bottom area serves as a “supply on the retest” and could trigger the next decline.

For now, the analyst expects that the Dogecoin price will continue on its bearish path. This is dependent on the broader market performance, and so far, a breakdown looks to be more likely.

Dogecoin price chart from Tradingview.com

Shiba Inu Whales Spike To 6-Month High: What’s Brewing?

Shiba Inu has just logged its most intense burst of large-holder activity in half a year, raising questions over whether fresh volatility – and potentially renewed selling pressure – is around the corner.

On-chain analytics firm Santiment reported the move on X, highlighting a six-month chart of Shiba Inu’s price, exchange balances and large transfers. According to the firm, “Shiba Inu has seen the highest amount of whale transfers since June 6th today, happening in tandem with a +1.06T net change to the amount of SHIB on exchanges. The #24 market cap in crypto is likely to see high volatility in the coming days.”

What Does This Mean For The Shiba Inu Price?

The chart shows 406 individual transactions exceeding $100,000 in value within a single day, the highest reading since early June. The second-highest peak occurred during the October 10 market meltdown, when roughly 300 SHIB whales were active, and the third came in mid-July, as more than 280 whales executed transfers.

These “whale” transfers represent activity from large holders, trading desks and liquidity providers whose moves can materially affect market liquidity and order-book depth.

At the same time, Shiba Inu’s exchange supply has jumped. Santiment’s overlay of “Supply on Exchanges (SHIB)” reveals a clear, abrupt uptick, annotated as “1.06T More SHIB On Exchanges in 24 Hours.” This reflects a net inflow of around 1.06 trillion tokens into exchange wallets, meaning more SHIB is now sitting in venues where it can be traded immediately.

Shiba Inu whale transaction count vs. balance on exchanges

In market-structure terms, the combination of record recent whale activity and a sharp rise in exchange balances creates conditions that often precede significant price swings. Moving coins from self-custody to exchanges does not guarantee that they will be sold, but it increases the portion of circulating supply that is “sale-ready” and able to hit the order books at short notice.

Whether that translates into an outright dump is not yet visible on-chain. The same footprint could reflect whales preparing to sell, to arbitrage across venues, to supply liquidity, or to rebalance positions in anticipation of broader market moves. Santiment itself stops short of a directional call, limiting its guidance to the expectation that the Shiba Inu token “is likely to see high volatility in the coming days.”

For now, the data point is clear: Shiba Inu’s largest holders have become more active than at any time since early June, and over a trillion additional tokens have shifted onto exchanges in just 24 hours. The direction of the next major move will depend on how that newly mobile supply is deployed.

At press time, SHIB traded at $0.00000859.

Shiba Inu price

Bitcoin Speculation Muted: Glassnode Analyst Calls Perps A ‘Ghost Town’

Glassnode’s senior researcher has pointed out how Bitcoin perpetual futures market is looking like a “ghost town,” with Open Interest continuing to be at muted levels.

Bitcoin Futures Open Interest Has Remained Low Since October Reset

In a new post on X, Glassnode senior researcher CryptoVizArt.₿ has talked about the recent trend in the Bitcoin Open Interest for the perpetual futures market. The “Open Interest” refers to an indicator that measures the total amount of positions related to the asset that are currently open on all centralized derivatives platforms.

When the value of the metric rises, it means the investors are opening new positions related to the asset. Generally, new positions come with fresh leverage for the sector, so the cryptocurrency’s price can become more volatile following an increase in the Open Interest.

On the other hand, the indicator going down suggests the perpetual futures traders are either closing up position of their own volition or getting forcibly liquidated by their platform. Such a trend can lead to more stable price action for BTC due to the clearing of leverage.

Now, here is the chart shared by CryptoVizArt.₿ that shows the trend in the Bitcoin perpetual futures Open Interest (BTC-denominated) over the last few months:

Bitcoin Open Interest

As displayed in the above graph, the BTC-denominated Bitcoin perpetual futures Open Interest saw a sharp plunge back in October as a result of the crash in the cryptocurrency’s price.

Following the leverage flush, the indicator traveled sideways around its lows, but in mid-November, speculation noted an uptick as the asset’s drawdown continued, with the metric’s value peaking alongside the level that has so far acted as the bottom.

Since this high, however, the indicator has cooled off once again and approached the same lows as the ones that followed the massive liquidation event in October. Thus, with Open Interest back under 310,000 BTC, it seems speculative interest in the market has once again become muted.

The recent decline in speculative participation has come alongside a drop in the perpetual futures Funding Rate, a metric tracking the amount of periodic fee being exchanged between the short and long investors.

Bitcoin Funding Rate

From the chart, it’s visible that the Bitcoin perpetual futures Funding Rate has been going down since a while now. “This persistent drift lower reflects a decline in leveraged long conviction, with traders unwilling to pay a premium to maintain upside exposure,” noted the Glassnode researcher.

Based on the recent developments, CryptoVizArt.₿ has called the perpetual futures market a “ghost town.”

BTC Price

At the time of writing, Bitcoin is floating around $90,500, up almost 6% over the last seven days.

Bitcoin Price Chart

New Bitcoin Crash Incoming? Twenty One Capital Moves 43,500 BTC Amid Major Losses

Twenty One Capital, a major player in the Bitcoin (BTC) treasury sector founded by Jack Mallers, is on the verge of going public in the United States. However, ahead of its highly anticipated debut on December 9, the company has moved a substantial sum of 43,500 BTC—approximately worth $4.5 billion—into an escrow wallet. 

This move has sparked market concerns about a potential sell-off, which could create major selling pressure for the leading cryptocurrency as it attempts to consolidate above the key $90,000 support level.  

$1.5 Billion Loss In Bitcoin Investments

Experts on the social media platform X (formerly Twitter), such as OxNobler, have pointed out that the company is currently grappling with a significant $1.5 billion loss on its Bitcoin investment. 

He warned that this financial pressure could potentially lead to a new crash for Bitcoin and adversely affect the broader cryptocurrency market as well. 

The apprehension surrounding this situation is reflected in Bitcoin’s price action, as the leading cryptocurrency dipped below $90,000 earlier on Monday amid growing uncertainty about its future trajectory.

Bitcoin

However, Jack Mallers had previously addressed the reasoning behind this monumental Bitcoin transfer. According to him, this step is part of the preparations for Twenty One Capital’s upcoming listing on the New York Stock Exchange (NYSE). 

As part of the transaction, the company is transitioning 43,500 BTC from third-party custody to a self-custody account, ensuring transparency by updating its proof of reserves accordingly.

The firm, backed by major players like Tether and SoftBank, aims to take on Michael Saylor’s Bitcoin proxy firm Strategy (previously MicroStrategy) in the competitive Bitcoin treasury sector. 

A significant milestone was reached on December 3, when shareholders of CEP approved a business merger with Twenty One Capital, paving the way for the company’s initial public offering (IPO).

Once the transactions are finalized, the combined entity will operate as Twenty One Capital, Inc., with its shares expected to begin trading on the NYSE under the ticker symbol “XXI.” 

Twenty One Capital Gears Up For IPO

Amid the preparations for its anticipated debut in the US, the firm has indicated that it will focus exclusively on Bitcoin-related ventures, offering shareholders new opportunities to gain exposure to BTC through equity markets. 

With a Bitcoin-native operating framework and a long-term strategy designed for value creation, Twenty One intends to establish itself as a leading platform for capital-efficient Bitcoin accumulation and related business initiatives.

This move to go public follows a tumultuous period for Mallers, who disclosed that JPMorgan Chase had abruptly closed his accounts in September without explanation. 

“Last month, J.P. Morgan Chase threw me out of the bank… Whenever I asked them why, I received the same response: ‘We aren’t allowed to tell you,’” Mallers recounted on November 23. The closure letter cited “concerning activity” and referenced the Bank Secrecy Act, preventing him from reopening accounts at the bank.

Featured image from DALL-E, chart from TradingView.com 

All Eyes On Ethereum: Price Attempts Key Breakout As BlackRock Files For Staked ETH ETF

After weeks of speculation, BlackRock, the world’s largest asset manager, has officially filed for a staked Ethereum (ETH) Exchange-Traded Fund (ETF) with the US Securities and Exchange Commission (SEC). Amid the bullish news, the King of Altcoins’ price is attempting to break out of a two-month resistance, which could set the stage for a retest of higher levels.

BlackRock Files For Staked Ethereum ETF

BlackRock has submitted an S-1 form with the US SEC to get approval for its iShares Ethereum Staking Trust (ETHB), which “seeks to reflect generally the performance of the price of ether and rewards from staking a portion of the Trust’s ether, to the extent the Sponsor in its sole discretion determines that the Trust may do so without incurring undue legal or regulatory risk.”

Filed on December 5, BlackRock’s registration statement explains that, if approved, the proposed fund aims to stake 70% to 90% of its Ethereum holdings, distributing staking rewards to stakeholders at least quarterly.

Coinbase Custody Trust will serve as the custodian for the Trust’s ETH holdings, the filing noted, while Anchorage Digital Bank will be an available alternative custodian for the Trust’s ether holdings. Meanwhile, the Bank of New York Mellon will serve as the custodian for the Trust’s cash holdings and the administrator of the Trust.

Notably, BlackRock’s ETHB will operate separately from its spot ETH fund, the iShares Ethereum Trust ETF (ETHA), which is the largest in its category with $11 billion in assets under management (AUM).

It’s worth noting that the crypto community began speculating about BlackRock’s upcoming staked ETH fund after the leading asset manager registered the name in Delaware last month.

In a November report, 10x Research argued that the potential introduction of a staked Ethereum ETF by BlackRock would bring “increased scrutiny” to “the economics of DATs” as retail investors would reallocate to a low-cost source of yield.

The report added that many investors are unaware that Digital Asset Treasury (DATs)’s embedded costs “far exceed” the management fee charged by asset managers like BlackRock on its Bitcoin (BTC) and ETH ETFs.

ETH Nears Key Downtrend Line

Ethereum’s price started the week attempting to reclaim a crucial area after managing to hold the $3,000 level as support despite the volatility during the weekend. The cryptocurrency surged nearly 3% in the daily timeframe, hitting $3,180 before retracing on Monday.

Amid this performance, analyst Ali Martinez suggested that “it’s time to pay attention to ETH,” noting that it nears a key level that could push the price to higher zones. Per the chart, Ethereum briefly broke out of its two-month downtrend line, which has served as resistance since early October.

Over this period, the King of Altcoins has attempted to break out of this level twice, but has ultimately been rejected during each attempt. On Monday morning, ETH briefly broke above the trendline before being rejected a third time.

However, if Ethereum reclaims the $3,120-$3,130 levels and turns the downtrend into support, it could build the base for a retest of the $3,200-$3,300 horizontal levels, which marks the lower boundary of its Q3 and early Q4 price range.

Meanwhile, Rekt Capital asserted that Ethereum Dominance (ETHDOM) continues to move within its macro consolidation range, holding support at the 11.67% level. He previously affirmed that if “ETHDOM can maintain itself above 10.05% then it should be positioned for higher market dominance levels over time.”

The analyst added that although history suggests a potential 2.5% drop to the consolidation range lows, this dip would occur “in the context of a macro move to 18%-20%” in the future.

As of this writing, Ethereum is trading at $3,114, a 13.7% increase on the weekly timeframe.

Ethereum, eth, ethusdt

Did 2025 Mark A Bear Market For Bitcoin? Predictions Point To A $150,000 Rally In 2026

As Bitcoin (BTC) experienced significant volatility throughout the year, reaching new all-time highs (ATHs) before enduring sharp corrections of up to 30%, the cryptocurrency community has become increasingly polarized regarding its future direction. 

Many analysts are raising concerns about a potential bear market emerging in 2026; however, market expert Shanaka Anslem has offered a different perspective on social media platform X (formerly Twitter), questioning whether 2025 has already represented the real bear market.

A Sign Of Cycle Change

In his analysis, Anslem highlights key evidence. For the first time in history, Bitcoin breached its all-time high prior to the Halving event in April of this year, which he argues isn’t a bullish signal but rather an indication of the cycle inverting. 

According to him, 2024 should not be viewed as the beginning of a new bull run; instead, it was a period of what he calls “political repricing” as the market factored in a pro-crypto administration with President Donald Trump’s reelection. 

The characteristics of a bear market have been evident in 2025, according to Anslem. Bitcoin’s dominance has reached multi-year highs while altcoins continue to struggle, leading to quarter-after-quarter declines in their values. 

Additionally, a massive $3.5 billion in exchange-traded fund (ETF) outflows occurred within just one month. This year saw a significant 29% drawdown from its October highs, paired with extreme fear readings on various sentiment indices.

Anslem insists that while the four-year Halving cycle remains relevant, its impact has evolved. With $120 billion in ETF interconnected with the Federal Reserve’s (Fed) liquidity, the Halving continues to dictate BTC’s supply, but demand now aligns with broader economic narratives rather than the more crypto-specific factors.

Major Bitcoin Rally Ahead? 

What does Anslem’s “cycle inversion” theory implies for 2026? If the bear market has already transpired, masked by nominal highs, the next logical phase might be a genuine blow-off top. 

His predictions suggest Bitcoin’s price could soar to between $150,000 and $200,000, particularly as global liquidity continues to expand and directs capital toward hard assets. Anslem believes that many in the market are currently positioned for a downturn that has already occurred.

However, dissenting opinions exist. Analyst Mr. Wall Street argues that the bottom for Bitcoin has not yet arrived and won’t be realized in the coming weeks or months. 

He highlights that the critical support level has been breached, indicated by the weekly exponential moving-average (EMA50) closing below the threshold. 

He asserts that the market has entered the early stages of a substantial bear market, predicting that it will only abate once Bitcoin reaches the $54,000 to $60,000 range, which he expects might occur in the fourth quarter of 2026. 

Despite this bearish outlook, he remains cautiously optimistic about Bitcoin in the short term. He expects a potential upward movement to retest the EMA50 Weekly, which currently stands at approximately $100,000, while maintaining that mid-term targets are much lower. 

Bitcoin

At the time of writing, BTC was trading at $90,352, which represents a 28% difference between current valuations and ATH levels. 

Featured image from DALL-E, chart from TradingView.com 

❌