Reading view

There are new articles available, click to refresh the page.

Bitcoin Alert: Saylor Signals New Purchase As His Favorite Indicator Returns

Michael Saylor’s hint about a fresh Bitcoin purchase has renewed talk among traders and investors, even as on-chain stress signals point to a tougher stretch for the network. The mix of heavy buying by public firms and signs of miner strain is drawing attention from both bulls and bears.

Saylor’s Tracker Signals

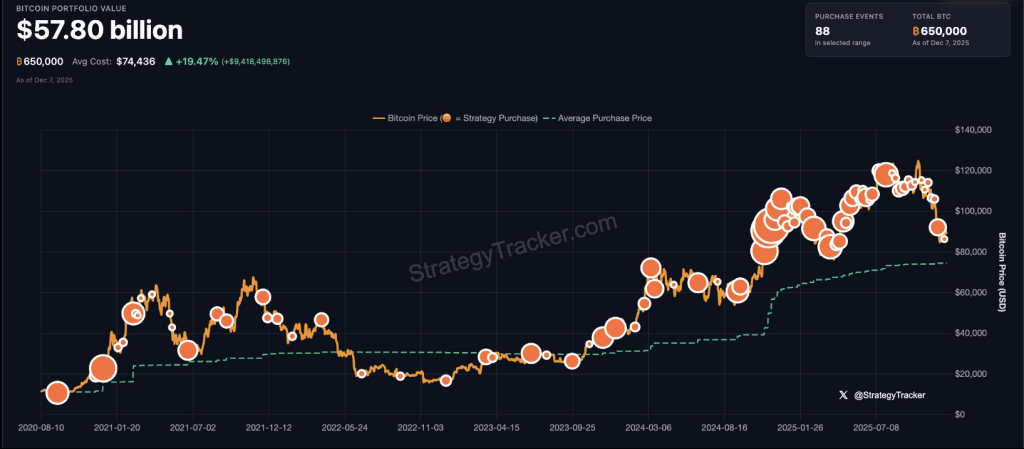
According to a StrategyTracker chart shared by Michael Saylor, Strategy holds about 650,000 BTC with a portfolio value near $58 billion. The chart lists an average purchase price of $74,436 and shows 88 confirmed buy events over time.

Saylor captioned the image “Back to Orange Dots?” — a short, familiar cue that has often come before a new accumulation round.

Strategy’s most recent reported move was a 130 BTC buy, which fits the company’s long habit of adding during periods of market fear. That pattern matters because when an entity repeatedly buys through downswings, it shapes how other investors react.

₿ack to Orange Dots? pic.twitter.com/npB0NWSZ52

— Michael Saylor (@saylor) December 7, 2025

Corporate Buying Continues

Based on reports from BitcoinTreasuries.NET, the top 100 public firms now hold about 1,059,453 BTC combined. ABTC reportedly added 363 BTC, the largest increase this week, while Cango Inc. purchased 130.6 BTC.

Other names cited in recent filings include Bitdeer, BitFuFu, Hyperscale Data, Genius Group, and Bitcoin Hodl Co. These moves show that some companies keep expanding reserves even when prices wobble.

For market watchers, steady corporate accumulation can be a calming force, though it does not erase broader sell pressure.

On-Chain Stress Indicators

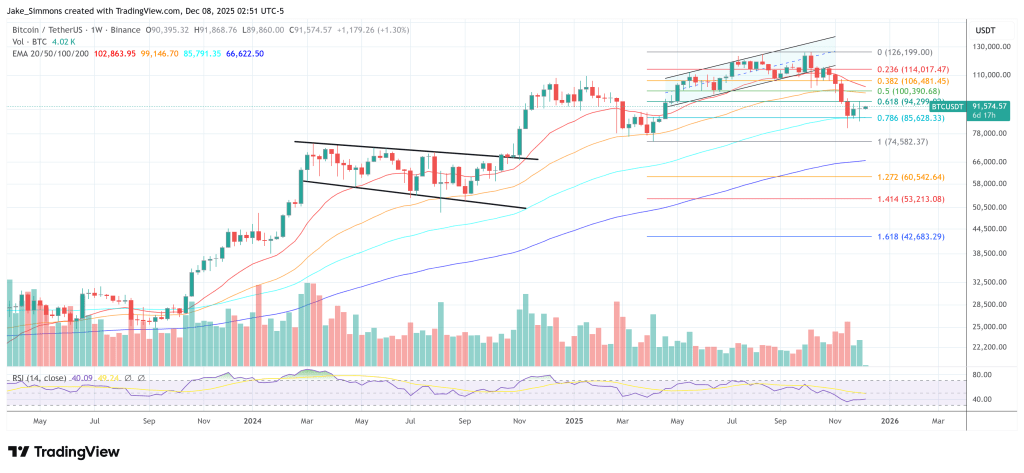
According to Glassnode charts shared by the Bitcoin Archive, the Hash Ribbon has shifted bearish again, a sign that some miners are facing stress or even pausing operations.

Short-Term Holder NUPL has fallen below zero, meaning many recent buyers are holding coins at a loss. Historically, episodes where miners are squeezed at the same time new holders are underwater have appeared near significant lows.

That outcome is not certain, but the combination of technical miner strain and unrealized losses among short-term wallets is the kind of setup traders watch closely.

What Traders Are Watching Now

Traders are monitoring whether the miner stress and losses among fresh buyers will coincide with renewed buying by big holders.

Some expect that corporate purchases and purchases by Strategy could blunt downside and spark a rebound. Others remain cautious because on-chain indicators point to real strain.

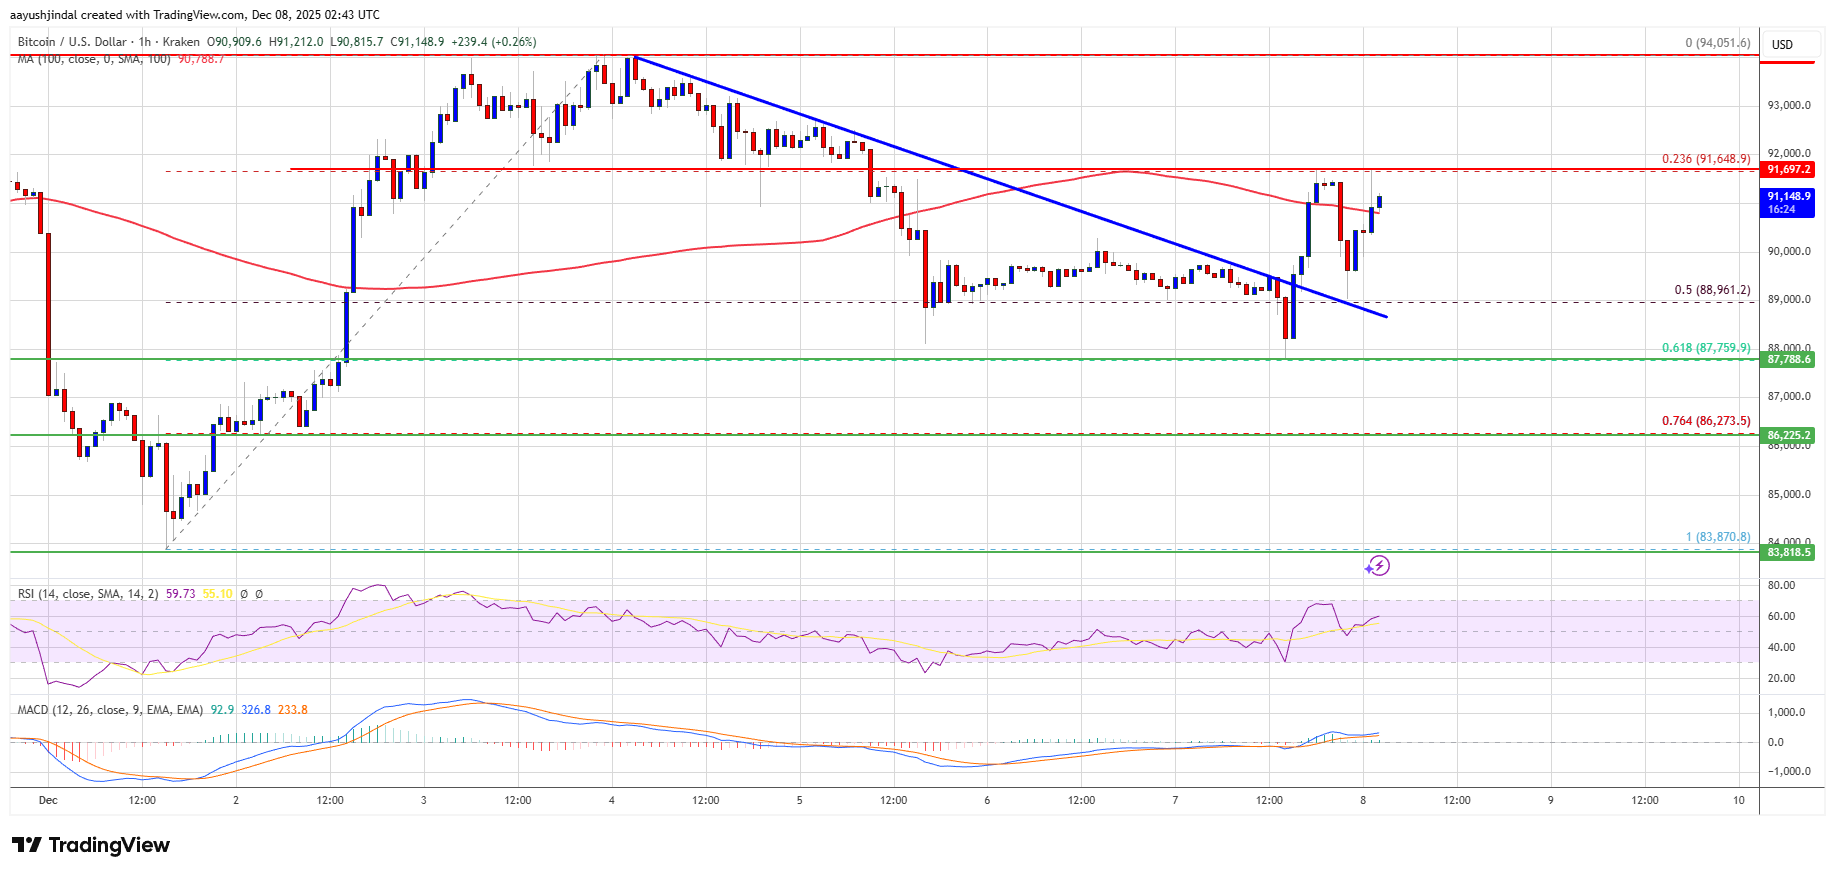
Market action around major events, like central bank announcements, has also shown Bitcoin can stall before policy moves and then move sharply after.

Featured image from Unsplash, chart from TradingView

Smart Whales Align: Top Performers Go All-In On Ethereum Long Positions With Over $425M in Exposure

Ethereum has reclaimed the $3,150 level after a volatile stretch, offering a rare sign of strength in an otherwise uncertain market. The broader crypto landscape remains sharply divided: some analysts argue that ETH and the rest of the market still face downward continuation, potentially setting new local lows, while others believe this correction is simply a reset before a much larger bull cycle—possibly extending into 2026.

Yet one signal stands out clearly amid the noise: smart whales are unanimously going long on ETH. On-chain data shows that several of the most profitable and consistent whale traders—each with tens of millions in realized gains—have opened substantial long positions, collectively exceeding hundreds of millions of dollars. Their coordinated behavior indicates confidence that Ethereum’s recent lows represent opportunity rather than danger.

This alignment among top-performing whales introduces a compelling counterpoint to bearish narratives. While retail sentiment remains fragile, the most sophisticated market participants appear to be positioning for a larger move ahead. As Ethereum stabilizes above $3,150, the question now becomes whether whale conviction will prove to be early—or correct.

Top Performers Load Up on Ethereum

According to Hyperdash data shared by Lookonchain, some of the most successful and influential whales in the market are aggressively accumulating Ethereum—sending a strong signal that high-conviction players expect upside ahead.

One of the most notable is BitcoinOG, the trader widely recognized for shorting the market during the violent 10/10 crash, a move that earned him significant credibility. With a total realized PNL of $105 million, BitcoinOG is now positioned firmly on the bullish side, holding 54,277 ETH worth approximately $169.48 million.

BitcoinOG Ethereum Position | Source: Hyperdash

Another major player is the well-known Anti-CZ whale, named for his historical pattern of taking the opposite side of positions favored by Binance founder Changpeng Zhao. With an impressive $58.8 million in total PNL, this whale is currently long 62,156 ETH—a massive $194 million position. His trades have often been early indicators of broad market direction, adding weight to this shift toward bullish exposure.

Finally, pension-usdt.eth, a consistently profitable whale address with $16.3 million in realized gains, is long 20,000 ETH valued at $62.5 million.

Taken together, these positions reflect a unified stance among top-performing whales: despite market uncertainty, they are positioning for Ethereum strength.

Weekly Structure Shows Early Signs of Stabilization

Ethereum’s weekly chart reveals a market attempting to regain its footing after a sharp multi-week decline from the $4,500 region. The recent reclaim of $3,150 is a meaningful development, as this level aligns closely with prior weekly support from mid-2024 and sits just above the 50-week moving average—an area that often acts as a trend-defining zone. ETH briefly dipped below this region during the November selloff, but buyers stepped in aggressively, producing a strong weekly wick that signals demand at lower levels.

ETH consolidates around critical level Source: ETHUSDT chart on TradingView

Despite this recovery attempt, ETH remains below key resistance levels. The 20-week and 100-week moving averages are positioned above the current price and converging, creating a zone of potential rejection unless momentum strengthens. For now, ETH is trading in a transitional structure: no longer trending downward aggressively, but not yet showing a confirmed bullish reversal on high timeframes.

Volume patterns also support this interpretation. Selling volume has diminished compared to the capitulation phase, while recent green candles show moderate but steady buying interest—suggesting accumulation rather than full risk-on behavior.

If ETH can establish consecutive weekly closes above $3,200–$3,300, the chart opens the door for a retest of the $3,600–$3,800 range. Failure to hold $3,150, however, risks another move toward $2,800 support.

Featured image from ChatGPT, chart from TradingView.com

Solana Price Faces Critical Test Near $140 While Analysts Track KOL Indicators and Liquidity Shifts

The Solana price is entering a decisive phase as its action tightens below the $140 barrier, a level that has repeatedly capped attempts at recovery. After months of sustained selling pressure and increased whale activity, the market is now watching whether Solana can hold its recent gains or slip back toward lower support zones.

Related Reading: What’s Happening With XRP And Why Did Its Spot ETF Crash 20%?

This comes at a time when analysts, on-chain trackers, and market participants are also assessing the broader influence of KOL (Key Opinion Leader) predictions, many of which have dramatically misaligned with Solana’s actual price trajectory over the past two months.

Solana SOLUSD_2025-12-08_13-43-26

Solana Price Stalls Below Key Resistance

SOL is currently trading just under $138 after a modest recovery from the $128 low. Technical data indicates that the Solana price is struggling beneath a dense cluster of moving averages, with the 20-day EMA at $138 repeatedly rejecting upward attempts.

The intraday structure remains corrective, as rallies tend to fade before gaining traction. A sustained close above $140 remains the key threshold. Clearing it could open immediate targets near $142 and later $150. However, failure at this level risks renewed pullbacks toward $132, and deeper weakness could revisit $128 region.

Short-term indicators offer mixed signals. The hourly RSI remains above 50, while the MACD leans slightly bullish, suggesting that momentum exists but lacks conviction.

KOL Predictions Scrutinized as Market Cap Declines

Solana’s market cap has fallen roughly 40.5% over the past two months, contradicting bullish influencer claims made earlier in the quarter. Data from Santiment shows how traders predict a near-term all-time high, only for SOL to continue its downward slide.

This divergence is leading analysts to lean more heavily on tools like the KOLs_Tracker, which ranks influencer performance and helps identify when certain calls may function as contrarian signals.

The gap between predictions and actual performance has added an extra layer of volatility to Solana’s narrative, as traders use social sentiment data alongside traditional indicators to gauge market direction. With network activity and flows still subdued, traders are approaching such predictions with increased caution.

Liquidity Shifts Highlight Whale Influence

On-chain activity shows notable movement from large holders, including a whale that recently transferred 100,000 SOL to Binance, part of a broader trend that has seen over 600,000 SOL moved to exchanges since April.

While not enough to move the market on its own, such consistent selling reinforces resistance zones and limits recovery momentum. The address still holds more than 700,000 SOL, meaning additional liquidity could enter the market if the Solana price approaches previously favored selling levels.

Related Reading: Ethereum Founder Breaks Silence With Major Upgrade Proposal

As the Solana price deals with this tight range, market participants remain focused on whether buyers can establish a base above $138–$140. Until then, resistance remains firm, sentiment remains cautious, and the path forward depends on both technical confirmation and the broader crypto market direction.

Cover image from ChatGPT, SOLUSD chart from Tradingview

Bitcoin RSI Shows Shocking Similarities To 2012-2015, But What Happened Last Time?

A crypto analyst has revisited long-term charts from 2012-2015, noting that the current Bitcoin (BTC) cycle shows striking similarities to this timeline, in terms of the Relative Strength Index (RSI) and price action. During the 2017-2015 bull run, BTC experienced one of the strongest multi-year advances before bottoming out. The market expert claims that the same sequence of peaks and pullbacks observed in that timeline is now unfolding again in this cycle. 

Bitcoin RSI Comparison Signals Bottoming Structure

Bitcoin’s latest momentum study by crypto analyst Tony Severino has drawn significant attention from market watchers. In his X post on December 6, Severino highlighted surprising similarities between the RSI trend and price movements of the 2023-2026 cycle and those observed from 2012 to 2015. 

His comparison focuses on the timing of several major points that appeared in both cycles. These include the moment a price bottom began to form, the first price peak, a subsequent momentum peak, and finally a Bearish Divergence that typically precedes deeper corrective phases.

Severino shared a chart from the 2012-2015 cycle showing that Bitcoin’s RSI had gradually climbed, with several short bursts of sharper upward momentum along the way. Eventually, momentum faded, and the indicator declined for an extended period before settling in a mid-range zone at the 44 level. 

Bitcoin

In the current cycle, which began in 2023, the RSI also climbed sharply before reaching a notable peak. Since then, the indicator has been gradually declining, currently sitting around 38. This level is similar to the mid-range RSI values observed in the former cycle before Bitcoin advanced again. 

Sharing a second chart, Severino also pointed to Bitcoin’s price action relative to its RSI performance across both cycles. During the earlier cycle, Bitcoin’s price sat around $233.54, while in the recent cycle, it has declined to $89,352. The analyst argues that the alignment between the RSI movements and price action in both timelines strengthens his theory that Bitcoin may be approaching a meaningful bottom soon. 

Severino also suggested that if history repeats in the 2023-2026 cycle, traders could be looking at the early stages of a year-long accumulation phase, similar to what played out a decade ago. Nevertheless, he acknowledged that there is no guarantee that the current cycle will mirror past patterns completely. 

Analyst Flags New BTC Bullish Crossover

Crypto analyst AO has shared a more optimistic outlook for Bitcoin, highlighting the formation of a Bullish Crossover—a key technical signal that has historically preceded significant price surges. According to him, each time the Stochastic RSI on US10Y*CN10Y experiences a Bullish Crossover, Bitcoin enters a significant bull run.

AO presented a chart showcasing four previous Bullish Crossovers, each followed by a massive price increase. The first crossover appeared in 2013 and coincided with an early surge. The second came in 2017, marking the start of a multi-month bull run. The third occurred in late 2020, shortly before BTC’s record-breaking run in 2021. The most recent signal has not emerged in 2025, suggesting the potential for a similar upward move.

Bitcoin

Ethereum Loses Momentum While OI Holds Steady: Binance Data Shows A Market Reset

Ethereum has reclaimed the $3,150 level after a volatile Sunday session that left traders divided on what comes next. Some analysts warn that ETH’s recent bounce is nothing more than a temporary pause before the downtrend resumes, while others see signs of a potential bullish reversal forming at current levels.

Fresh data from Binance reveals that Ethereum is now entering a delicate phase. Price momentum has clearly weakened, yet open interest remains relatively high despite the decline from the $3,900 region. This disconnect highlights a major shift in futures market behavior: traders are holding positions, but not aggressively increasing them.

The 30-day open interest Z-Score currently sits at 0.50, indicating that OI is just slightly above its 30-day average—well within normal volatility bands. Unlike previous corrections, where open interest surged during heavy selling, the current reading suggests neither extreme leverage buildup nor panic-driven position closures.

This unusual combination—weakening momentum paired with stable open interest—underscores a market in transition. Whether Ethereum resumes its downtrend or begins carving out a recovery will depend on how quickly momentum returns to spot and futures markets in the days ahead.

Open Interest Stability Signals a Market in Repositioning

According to the Arab Chain report on CryptoQuant, Ethereum’s $6.61 billion in open interest highlights that traders are still holding a substantial share of their positions despite the sharp decline from $3,900 to below $3,200. This divergence—falling price but steady OI—is characteristic of market repositioning phases, where traders reduce activity without fully exiting the market.

The supporting metrics reinforce this view: the OI avg30 sits at $6.44 billion, and the OI std30 at $329 million, indicating that current fluctuations remain well within normal volatility ranges. There is no sign of aggressive position buildup or liquidation pressure.

Binance Ethereum Open Interest Z-Score | Source: CryptoQuant

With the Z-Score at 0.50, the modest rise in open interest does not suggest overwhelming bearish leverage. Instead, it shows that traders are still engaging with the market and selectively building new positions as price declines. This level of participation is important: it signals that the derivatives market is active but not overheated.

Ethereum’s price weakness, driven by fading momentum after failing to sustain its previous highs, leaves the market at an inflection point. If large traders are predominantly short, stable OI could support the continuation of downward pressure. However, if long positions dominate, this same stability may lay the groundwork for a rebound once momentum returns.

Testing Momentum as Bulls Attempt to Reclaim Control

Ethereum is attempting to stabilize above the $3,150–$3,160 zone after a volatile multi-week decline. The chart shows ETH rebounding from a local low near $2,750, forming a short-term rising structure. However, momentum remains fragile. The 50-day SMA continues to slope downward and sits well above current price action, reinforcing the broader downtrend. Until ETH can break and close above this moving average, upside attempts will likely face resistance.

ETH conolidates around key level | Source: ETHUSDT chart on TradingView

The 100-day SMA is also declining, converging with the $3,350–$3,400 region—an area that could act as the next major ceiling for any bullish continuation. Meanwhile, the 200-day SMA remains flat but sits just above price, creating an additional barrier around $3,250–$3,300. This cluster of resistance levels confirms that Ethereum is still operating within a corrective structure despite the recent bounce.

Volume has tapered off noticeably compared to the heavy sell-side spikes seen in November. This suggests that the rebound may be driven more by diminishing selling pressure than strong spot demand. If volume remains weak, ETH may struggle to build enough momentum for a sustained recovery.

Featured image from ChatGPT, chart from TradingView.com

Analysts Split on XRP Future Outlook as Centralization Debate Intensifies

The outlook for XRP is becoming increasingly polarized as traders, analysts, and industry critics weigh in on its price trajectory, governance model, and growing institutional interest.

Recent market activity reflects a complex environment where both technical signals and structural concerns are shaping sentiment. As whale sell-offs, ETF inflows, and a revived decentralization debate collide, XRP finds itself at a critical moment that is testing assumptions about its long-term viability.

Ripple XRP XRPUSD XRPUSD_2025-12-08_13-21-40

New Participation Models and Market Volatility

A wave of alternative yield platforms, including BlackchainMining, has entered the market offering “XRP mining” rewards, despite XRP not being a mineable asset. These models rely on token lock-ups rather than computational work, with platforms distributing returns from liquidity operations or other investment strategies.

While they appeal to holders seeking passive income, they introduce counterparty and operational risks, especially given their reliance on centralized management rather than transparent network mechanics.

At the same time, XRP’s spot price continues to react to whale activity. Recent sell-offs pushed the token toward the $2 level before stabilizing, reflecting short-term volatility driven by large holders. In contrast, long-term investors appear unfazed, maintaining positions that help steady the circulating supply.

Institutional demand through XRP ETFs adds yet another dimension. U.S.-listed funds have seen nearly $900 million in inflows, indicating that larger players are continuing to build exposure despite market turbulence.

Technical Setups and Derivatives Data Show Mixed Sentiment

Analysts tracking XRP’s long-term chart structure note parallels with the 2017 bull cycle. A multi-year symmetrical triangle forming between 2018 and 2025 has created expectations of a breakout, with some projecting potential upside should historical patterns repeat.

The current price action around $2.05 reflects a tightening consolidation, and a 16% move in either direction is considered possible after the pattern resolves.

However, derivatives markets present a contrasting picture. Coinglass data shows that XRP is the most aggressively shorted major asset, with roughly 96% of open interest positioned against it.

Despite this, XRP has held modest gains, supported by sustained ETF inflows. Analysts warn that such extreme positioning increases the likelihood of a short squeeze if even minor catalysts shift sentiment.

Centralization Concerns Resurface

Beyond price action, structural criticism has resurfaced following sharp commentary from analyst Justin Bons, who argues that XRP is “centralized in every way,” citing validator distribution and governance limitations.

Supporters counter that XRP’s model is designed for institutional settlement rather than maximal decentralization, but the debate highlights a longstanding divide between crypto-native expectations and enterprise-focused blockchain design.

Whether XRP evolves through technical breakouts, institutional adoption, or renewed scrutiny over its governance will determine how the asset is perceived moving forward. Currently, the market remains divided, with both opportunity and uncertainty moulding the path ahead.

Cover image from ChatGPT, XRPUSD chart from Tradingview

Confirming The Bitcoin Price Direction: Analyst Reveals What You Should Look Out For

After breaking below $90,000 again, the next direction of the Bitcoin price is being hotly debated once again. This comes with the added burden of a number of major events coming around this week, as well as investor sentiment being stuck in the negative territory for an extended period of time. Crypto analyst, MarcPMarkets, shares his thoughts on the current state of the market and what investors should be looking out for as the next direction is determined.

The Bearish And Bullish Scenarios

In the analysis shared on the TradingView website, MarcPMarkets highlights the different scenarios that could determine where the Bitcoin price could be headed next. Cautioning investors to watch out for confirmation, the first level that the analyst highlights is the $93,500 area, where the Bitcoin price had failed to reclaim a high.

Since the price fell below $90,000 over the weekend, the next major level now lies at $88,000, and it is where bulls must protect their support. In the event that bulls lose this support and the price breaks decisively below this point, the crypto analyst warns investors to expect the Bitcoin price to crash another $10,000. Next would be the $78,000 area, where the cryptocurrency is likely to secure its next support.

On the flip side, where the Bitcoin price could turn bullish once again, the crypto analyst points to the $95,000 resistance. Investors are to pay attention to this resistance, because if broken, then it would mean that strength is building back up, completely canceling out the bearish scenario highlighted above.

The major targets in the case of a bullish takeover would first be $105,581. Above this lies the next major level of $113,213, and then finally, the $120,850 target that would be the final hit before momentum fizzles out.

Bitcoin price

Developments That Could Affect The Bitcoin Price

Beyond the price action, some events that could affect Bitcoin’s trajectory are expected to unfold this week. The FOMC meeting is drawing closer, with the Fed expected to announce its stance on the financial markets going forward.

If, at the completion of the press conference, the Fed takes on a dovish stance, then the crypto analyst expects that prices will begin to move upward again. Additionally, quantitative tightening ended at the start of December, ushering the markets into an era of quantitative easing, which has always been bullish for risk assets as new liquidity is pumped into the market.

Bitcoin price chart from Tradingview.com

Crypto Market On Alert As This Week’s Fed Decision Isn’t Just About Rates

Crypto markets head into this week’s Federal Reserve meeting focused less on rate cut and more on whether Jerome Powell quietly declares the start of quantitative easing (QE). The key question on Wednesday for macro-sensitive traders is whether the Fed shifts into a bill-heavy “reserve management” regime that starts rebuilding dollar liquidity, even if it refuses to call it QE.

Futures markets suggest the rate decision itself is largely a foregone conclusion. According to the CME FedWatch Tool, traders are assigning roughly 87.2% odds to a 0.25 percentage point cut, underscoring that the real uncertainty is not about the size of the move, but about what the Fed signals on reserves, T-bill purchases and the future path of its balance sheet.

Former New York Fed repo specialist and current Bank of America strategist Mark Cabana has become the focal point of that debate. His latest client note argues that Powell is poised to announce a program of roughly 45 billion dollars in monthly Treasury bill purchases. For Cabana, the rate move is secondary; the balance-sheet pivot is the real event.

Cabana’s argument is rooted in the Fed’s own “ample reserves” framework. After years of QT, he contends that bank reserves are skirting the bottom of the comfortable range. Bill purchases would be presented as technical “reserve management” to keep funding markets orderly and repo rates anchored, but in practice they would mark a turn from draining to refilling the system. That is why many in crypto describe the prospective move as “stealth QE,” even though the Fed would frame it as plumbing.

What This Means For The Crypto Market

James E. Thorne, Chief Market Strategist at Wellington Altus, sharpened the point in X post. “Will Powell surprise on Wednesday?” he asked, before posing the question that has been echoing across macro desks: “Is Powell about to admit on Wednesday that the Fed has drained the system too far and now has to start refilling the bathtub?” Thorne argues that this FOMC “is not just about another token rate cut; it is about whether Powell is forced to roll out a standing schedule of bill-heavy ‘reserve management’ operations precisely because the Fed has yanked too much liquidity out of the plumbing.”

Thorne ties that directly to New York Fed commentary on funding markets and reserve adequacy. In his reading, “By Powell’s own framework, QT is done, reserves are skirting the bottom of the ‘ample’ range bordering on being too tight, and any new bill buying will be dressed up as a technical tweak rather than a confession of error, even though it will plainly rebuild reserves and patch the funding stress that the Fed’s own over-tightening has triggered.” That framing goes to the heart of what crypto traders care about: the direction of net liquidity rather than the official label.

Macro analysts followed closely by digital-asset investors are already mapping the next phase. Milk Road Macro on X has argued that QE returns in 2026, potentially as early as the first quarter, but in a much weaker form than the crisis-era programs.

They point to expectations of roughly 20 billion dollars a month in balance-sheet growth, “tiny compared to the 800bn per month in 2020,” and stress that the Fed “will be buying treasury bills, not treasury coupons.” Their distinction is blunt: “Buying treasury coupons = real QE. Buying treasury bills = slow QE.” The takeaway, in their words, is that “the overall direct effect on risk asset markets from this QE will be minimal.”

That distinction explains the tension now gripping crypto markets. A bill-only, slow-paced program aimed at stabilizing short-term funding is very different from the broad-based coupon buying that previously compressed long-term yields and turbo-charged the hunt for yield across risk assets. Yet even a modest, technically framed program would mark a clear return to balance-sheet expansion.

For Bitcoin and the broader crypto market, the immediate impact will depend less on Wednesday’s basis-point move and more on Powell’s language around reserves, Treasury bill purchases and future “reserve management” operations. If the Fed signals that QE is effectively starting and the bathtub is starting to be refilled, the liquidity backdrop that crypto trades against in 2026 may already be taking shape this week.

At press time, the total crypto market cap was at $3.1 trillion.

Total crypto market cap

Here’s How High The Dogecoin Price Will Go Once The MACD Bullish Cross Happens

The Dogecoin price has been drifting through a subdued stretch over the past few days, holding around the mid-$0.13 to $0.14. The recent decline has slowed down in the past 48 hours, and the chart now shows the meme coin attempting to steady itself after weeks of persistent selling pressure.

Trader Tardigrade, a well-known crypto analyst on X, shared a new three-day chart suggesting that an important MACD signal is on the verge of forming, and historical performance shows that Dogecoin tends to move bullish once this signal appears.

Approaching The MACD Bullish Cross

Dogecoin’s quiet phase in the past 48 hours has become increasingly important because one of Dogecoin’s higher-timeframe indicators is beginning to show early signs of life.  According to Trader Tardigrade, Dogecoin’s MACD indicator on the 3-day candlestick price chart has not yet confirmed a bullish cross, but it is very close to doing so. 

The chart he shared shows the MACD lines converging at the lower boundary of the recent downtrend, and the blue line is approaching the red line. The blue line is about to cross over the red one, mirroring the exact setup that preceded previous breakouts earlier this year. 

Even with Dogecoin trading quietly in recent days, the compression of the MACD indicator hints that bearish momentum is fading. Once the cross officially forms, the trend will shift into a bullish one. This gradual tightening of price movement is also characteristic of an accumulation phase, and this is shown by an important Dogecoin metric.

Dogecoin price

Dogecoin Price Chart, MACD Cross. Source: @TATrader_Alan On X

How High The Dogecoin Price Could Go

The chart reveals a clear pattern: every time Dogecoin printed a three-day MACD bullish cross in 2025, the price responded with a significant upward move. The first cross was in April, and this preceded a rally that pushed Dogecoin’s price from below $0.14 into a breakout to $0.26. 

A second cross followed during mid-summer in July, and once again the price climbed aggressively shortly afterward. This saw the Dogecoin price rally from around $0.16 to $0.30 very briefly. 

Both events are circled on the chart above, showing how the momentum flipped swiftly once the MACD crossed above the signal line. These repeated reactions strengthen the case that Dogecoin could be preparing for another sizeable run if the indicator confirms a cross in the coming days.

The projection area drawn on the right side of the chart points to a climb that extends well above $0.20. This suggests that the next wave may revisit the upper levels where Dogecoin last traded during its late-summer rally.

The analyst’s chart outlines a wide upward arc, indicating that the expected move would not be a minor rebound but a structured uptrend similar to the earlier surges this year. In terms of a price target, the projection shows Dogecoin reaching a price target around $0.35 in the next few weeks. This would translate to a 140% increase from Dogecoin’s current price of $0.142.

Dogecoin price chart from Tradingview.com

Here’s When The Altcoin Season Happens Following The Bitcoin Cycle

Bitcoin’s recent movement has left many traders waiting for signs of an altcoin season, and a post shared by crypto analyst Crypto Nova offers a different way to understand when this will actually begin. 

The explanation, supported by charts from 2017 and 2021, shows that altcoins have historically performed their best while Bitcoin’s price action was already climbing, not after it had reached its peak. The charts she shared show how those earlier cycles unfolded and why the timing of Bitcoin’s surge has been the important factor each time.

Altseasons Form During Bitcoin’s Strongest Surges

This outlook goes against the projection of many crypto analysts, who have been waiting for a downturn in the Bitcoin dominance characterized by outflows from Bitcoin and into the altcoin market.  

However, careful technical analysis shows that the largest and most explosive altcoin seasons did not occur after Bitcoin had completed its run. Instead, they developed while Bitcoin was already pushing to new price highs. 

The 2017 cycle illustrated this the most clearly. Bitcoin dominance began to decline during an altcoin season, even as BTC surged from around $1,000 to nearly $20,000. The chart shows a waterfall-like collapse in dominance from 95% in early 2017 to below 40% in early 2018, happening at the exact moment when Bitcoin was rising massively. Altcoins were already outperforming the leading cryptocurrency long before Bitcoin topped just below $20,000.

Bitcoin

A similar pattern played out in 2021. Bitcoin dominance peaked in January of that year and started falling while the Bitcoin price climbed from roughly $30,000 to its mid-cycle high above $60,000. Although altcoins took a little longer to increase compared to 2017, the bulk of their performance still arrived during Bitcoin’s rapid upward trajectory, not after it had stalled or reversed. 

The charts below highlight this synchronicity clearly: dominance moves lower while Bitcoin candles continue to stretch higher.

Bitcoin Needs A Confirmed Bottom And A New Surge

Nova noted that traders are making a mistake by focusing solely on Bitcoin dominance without considering Bitcoin’s broader market structure. It is important to note that dominance does not drop simply because Bitcoin moves sideways or reaches a peak. 

Instead, dominance mostly declines when Bitcoin is in a strong, sustained uptrend, but the altcoin niche is witnessing more inflows compared to the leading cryptocurrency. This means an altcoin season is unlikely to start until Bitcoin prints a confirmed bottom and its rally convinces inflows into altcoins. 

As noted by the analyst, Bitcoin is currently in a downtrend, and without a shift in trend, dominance metrics alone cannot trigger altcoin momentum. This viewpoint challenges the frequent claims circulating online that altseason is here or just about to begin.

As it stands, the crypto industry is still logged into a Bitcoin season, with the CMC altcoin season index sitting at 19 and the CMC Bitcoin dominance at 58.7%.

Altcoin

All-In On XRP: Why This Leading Investor Sold His Entire Bitcoin Stack

According to reports, a well-known crypto commentator/investor who goes by the handle Crypto X AiMan has sold all his Bitcoin and moved the proceeds into XRP. He says four reasons drove his decision, and the move has stirred debate across trading circles.

Investor Dumps Bitcoin For XRP

AiMan, who says he first bought Bitcoin when it traded at $3,000, told followers that legal clarity is the main reason for his shift. He pointed to a July 2023 court ruling by Judge Torres that found certain programmatic XRP sales were not securities.

According to him, that court decision gives XRP a different standing from many other tokens. He also noted that US regulators often treat Bitcoin as a commodity, a stance reiterated by former SEC Chair Gary Gensler. AiMan framed the court outcome as a rare, explicit legal test that favored XRP.

He highlighted another factor: Ripple’s large holdings. Based on company disclosures, Ripple holds close to 40 billion XRP, nearly 40% of the total supply. AiMan argued those reserves could support future use cases if Ripple or its partners chose to deploy the tokens for payments.

I just sold ALL my Bitcoin.

Yes, you read that right.

I went 100% all-in on XRP.

Here’s why:

XRP is the only crypto with legal clarity in the United States (won the SEC case, not a security).

Ripple owns ~40B XRP and is partnered with 300+ banks, central banks, and payment… pic.twitter.com/tRzpiKPas5

— Crypto X AiMan (@CryptoXAiMan) December 5, 2025

He called XRP faster and cheaper to move than Bitcoin, saying it is built for cross-border transfers — a point he used to contrast XRP’s utility with Bitcoin’s role as a store of value. He also ran through a market-size scenario.

Market analysts have projected the cross-border payments market at $250 trillion by 2027, and AiMan suggested that even a 1% share of that volume could mean big gains for XRP.

He admitted the trade is extreme: “If I’m wrong? XRP probably goes to zero, and I lose everything,” he said. He added that if he is right, the payoff would be huge.

XRP’s Legal Advantage

Market reaction has been mixed. Based on reports from data providers, traders are taking large short positions against XRP. Coinglass figures show XRP with $15 million in shorts versus $0.6 million in longs — a roughly 96% short allocation and a shorts-to-longs ratio near 25 to 1.

For comparison, Bitcoin had $131 million in shorts and $70 million in longs; Ethereum showed $110 million shorts and $58 million longs. Despite heavy shorting, XRP has posted daily gains at times, according to recent price movements.

Aggressive Shorts Dominate Positioning

Analysts say heavy short positions can indicate weak near-term sentiment. They also create technical risks, because a squeeze could push prices higher quickly if shorts are forced to cover.

That does not remove the core risks AiMan flagged and others raised: a big token allocation held by one company raises centralization concerns, and banks have not broadly shifted settlement rails to public tokens.

Bitcoin still has a market cap near $1.8 trillion and deeper liquidity, which many investors view as stability in a volatile market.

Featured image from Pexels, chart from TradingView

Ethereum Founder Breaks Silence With Major Upgrade Proposal

Ethereum co-founder Vitalik Buterin has unveiled a major proposal that could fundamentally reshape how the network handles transaction fees. His new design aims to replace unpredictable costs with a system that lets users plan and budget more effectively, signaling one of the most significant shifts in Ethereum’s economic framework in years.

Ethereum Gas Fees As Predictable, Prepaid Resources

Buterin’s proposal centers on a new on-chain gas futures market. Today, gas fees rise and fall based on network congestion and users have no way to know in advance what they will pay, which complicates planning for developers, businesses, and high-volume platforms.

The new model reshapes that dynamic by allowing users to purchase a defined amount of gas at a fixed price for future use. Rather than hoping the network will be affordable at the moment they need to transact, they can lock in their costs in advance. This moves Ethereum from a system dominated by short-term fee volatility to one anchored in stable, forward-looking pricing

Under the proposed design, these futures contracts would be traded directly on-chain. Their prices would naturally reflect expectations of future demand. When demand is expected to increase, futures prices rise; when expected to fall, they drop. This creates a transparent, market-driven view of upcoming network activity, giving developers and organizations a more reliable basis for planning their operations.

The structure also builds on the foundation set by EIP-1559, which introduced the base fee mechanism. Buterin’s futures market doesn’t replace that system—it extends it. It transforms gas from reactive cost into a resource that can be managed in advance, similar to how businesses lock in costs for electricity, bandwidth, or other essential inputs.

Operational Benefits For Developers, Businesses, And The Network

The most immediate benefit is cost certainty. High-volume users—exchanges, rollups, wallets, and automation services—often operate on tight margins, and sudden gas fee spikes disrupt operations and planning. By locking in future gas costs, this uncertainty is removed, supporting consistent service delivery. Developers also gain a stable environment, enabling them to schedule upgrades, plan deployments, and manage workloads without worrying about fee surges. This predictability strengthens project roadmaps and enhances user experience.

For enterprises integrating Ethereum into payments, verification, or data-processing workflows, predictable fees are essential. Buterin’s model addresses this barrier, positioning Ethereum as a more reliable foundation for long-term, large-scale adoption.

At the network level, the futures market introduces clearer economic signals. Rising futures prices indicate increasing demand for blockspace, guiding scaling decisions and resource allocation. Falling prices signal lower demand, enabling more efficient development and infrastructure planning.

The proposal does not lower gas fees but makes them manageable, converting an unstable cost into a predictable one. This enhances Ethereum’s appeal for serious applications, institutional activity, and reliable operational planning. By introducing a gas futures mechanism, the ecosystem can better manage costs and prepare for growth, marking a decisive step toward a more professional-grade Ethereum.

Ethereum price chart from Tradingview.com

What’s Happening With XRP And Why Did Its Spot ETF Crash 20%?

XRP’s price has continued to chop, trading sideways, which has impacted the price of the U.S. spot ETFs that provide exposure to the altcoin. Canary Capital’s XRP fund has crashed 20% since its launch, although this fund remains the largest by assets under management (AuM). 

XRP’s Sideways Price Action Leads To Spot ETF Crash

The XRP price has continued to trade within a tight range, just above the psychological $2 level, sparking bearish sentiment among investors. The altcoin is down over 10% in the last month, around the time the first spot XRP ETF, Canary’s fund, launched. This bearish price action has notably contributed to a price crash for Canary’s XRPC fund. 

TradingView data shows that Canary’s XRP ETF is down 20% since its launch on November 13. XRPC also dropped almost 10% last week amid choppy price action. Canary’s fund has also likely crashed due to increased competition from three other spot funds that launched after it. This has led to a slowdown in its inflows since these funds launched. 

XRP

Meanwhile, these funds track the spot XRP price, which also explains Canary’s XRPC crash. XRP has mirrored Bitcoin’s price action amid concerns that the crypto market may already be in a bear market. XRP whales also look to be bearish at the moment, as Santiment data shows a drop in whale transactions from a recent high recorded in November. 

However, despite this bearish sentiment, with the crypto market currently in a state of fear, the XRP ETFs have continued to record daily net inflows. SoSo Value data show that these funds have been on a 16-day net inflow streak since Canary’s XRP fund launched on November 13, and they have yet to record a net outflow day. 

Canary’s XRP ETF, which has suffered a 20% price crash, is currently the largest spot XRP fund with $364 million in assets under management. Grayscale’s GXRP is second with $211 million, while Bitwise and Franklin Templeton are third and fourth. As a group, these XRP funds are about to hit $1 billion in assets under management, with $861 million in total net assets. 

Some Positives For The Altcoin

Santiment data show that XRP exchange outflows have outweighed inflows in recent times. This is a positive as it indicates that more investors are accumulating than selling. Exchange outflows typically represent moves for long-term holding, especially in anticipation of higher prices. 

In an X post, Santiment mentioned that the XRP Ledger is seeing a fascinating trend of whale and shark wallets shrinking in number but continuing to grow in coins held. The on-chain analytics platform noted that there are 20.6% fewer 100 million XRP wallets, but that these wallets, as a group, still own a 7-year high 48 billion coins. As such, the existing 100 million XRP wallets are doubling down on their accumulation efforts and making up for the shrinking number of wallets. 

At the time of writing, the altcoin’s price is trading at around $2.07, up in the last 24 hours, according to data from CoinMarketCap.

XRP

Bitcoin Poised For Lift-Off As Key Bullish Catalysts Kick In: Ex-CEO

According to former BitMEX CEO Arthur Hayes, battles over the US debt ceiling create clear cash swings that move markets. When the Treasury spends down its main checking account — the Treasury General Account, or TGA — new dollars enter the system and lift risky assets.

Later, when the Treasury refills the TGA by selling debt, cash is pulled back out and pressure returns to stocks and crypto, he said.

Hayes points to 2023 as a clear example, when a large pool of funds at the Fed’s reverse repo facility — about $2.5 trillion — was available to be drawn back into markets.

Market Metrics And Recent Moves

Traders can see the effects in price action. Bitcoin’s recent fall toward the $80,000 area followed a stretch of tighter liquidity, and the rebound to above $91,000 has many investors asking whether the sell-off marked a cycle low.

The crypto market gained ground Monday, with total capitalization rising to a little over $3 trillion, up 1.2% in the last 24 hours. Bitcoin climbed to $92,120, a 1.50% increase on the day and almost 6.5% higher over the week.

Ethereum traded around $3,160 after a 4% daily rise and an 11% weekly jump. Reports have disclosed that these moves come as traders watch big-dollar flows tied to US Treasury operations and central bank balance sheet moves.

Smaller gains in the last day sit against larger weekly returns for several top tokens, showing that swings remain wide but that buying interest has reappeared.

Why 2025 Looks Different

Based on reports, Hayes says 2025 is not the same as 2023. The reverse repo balances that helped fuel the earlier rally are largely gone, and liquidity tightened by almost $1 trillion between July and late 2025 as the Treasury issued debt and the Fed ran quantitative tightening.

That drought of available cash was a headwind for risk assets and helped push prices lower. The mechanics are simple: less cash chasing assets tends to reduce bids and widen price drops.

Price Reaction And Cross-Market Effects

The liquidity story is not limited to crypto. Stocks, gold, and property responded to the same flow shifts during the prior cycle.

Hayes estimates that about $2.5 trillion of liquidity was effectively redeployed from Fed facilities into markets in 2023, amplifying gains across asset classes. When that source was absent in 2025, selling pressure intensified and volatility rose.

Favorable Market Conditions

Hayes says the environment has shifted in a positive way. The Fed has put quantitative tightening on hold, liquidity pressure in the Treasury market is calming down, the TGA is close to where officials want it, and banks are starting to open up their lending taps again.

He views the slide toward $80,000 as the cycle low and expects upward pressure as cash conditions improve. According to his view, these factors together create the environment for renewed upside.

Featured image from Unsplash, chart from TradingView


Bitcoin To Hit $50 Million By 2041, Says EMJ Capital CEO

EMJ Capital CEO Eric Jackson has laid out one of the most aggressive long-term bitcoin targets in the space yet, arguing in an interview with reporter Phil Rosen that the cryptocurrency could reach $50 million per coin by 2041. His projection is tied to a thesis that bitcoin will evolve from “digital gold” into the core collateral layer of the global financial system.

Jackson said his thinking grows out of the same “hundred bagger” framework he used when buying beaten-down equities like Carvana. He recalled entering Carvana after its share price collapsed from around $400 to roughly $3.50 in 2022, at a time when sentiment was almost universally hostile. “You would hear things like, that’s run by a bunch of criminals. This is what a bunch of idiots. Like you’d have to be an idiot to let your company go from $400 this year to $450 or $350 rather,” he told Rosen.

For Jackson, that period illustrated how markets behave at extremes. “It’s human nature almost that when you’re in the moment of max pain or pessimism, you can only see what’s right in front of you,” he said. Yet the underlying product remained strong: “It wasn’t a broken platform. It wasn’t a broken service […] they would tell you they loved it. It was so easy. It was the best customer experience they had.” From there, he could “envision how they were going to be like a much more profitable business” once the company focused on profitability and addressed its debt.

Jackson’s Long-Term Thesis For Bitcoin

He applies the same long-horizon lens to bitcoin, arguing that the day-to-day ticker and polarized narratives obscure its structural potential. “We get so tied to turning on the TV and just seeing, like, what’s the price of Bitcoin today […] Some people are bearish and they say, oh, it’s a Ponzi scheme. And some people are bullish and they just, you know, throw these like kind of pie in the sky targets that you can’t really tie to reality,” Jackson said. “It’s kind of hard to latch on to like, what is the value of this thing?”

Jackson begins with the common “digital gold” framing. He asks how large the gold market is, how many central banks and sovereigns hold it and why. “Could Bitcoin be as big as gold one day? That seems like a safe assumption,” he argued, adding that because it is “digital” and “programmable” rather than a “hunk of rock,” younger generations may prefer it as a store of value. But he stresses that this is only part of the story, as bitcoin has not become a medium for daily transactions “since the guy who bought pizza with Bitcoin back in like 2011.”

The “penny dropped,” he said, when he began to think in terms of what he calls the “global collateral layer” that underpins borrowing by sovereigns and central banks. Historically, that base layer moved from gold to the Eurodollar system from the 1960s onward, and today is heavily intertwined with sovereign debt. “All the countries around the world issue debt and then they kind of borrow against that and they do their daily like government transactions,” he noted, but “there are problems with that.”

In Jackson’s “Vision 2041,” bitcoin replaces the Eurodollar and, functionally, becomes the neutral asset that other balance sheets are built upon. He argues that bitcoin is “much superior” as collateral because it is digital and “apolitical,” sitting outside central banks and the influence of “whoever the latest treasury secretary here is in the US.”

As with the Eurodollar, he does not see this as a direct attack on the dollar or Treasuries, but as a new underlying layer: “There’s some underlying thing that a lot of other countries and the financial systems borrow against to kind of do things.”

Eric Jackson (@ericjackson) expects bitcoin to hit $50 million by 2041.

He compares his thesis to how he knew Carvana, $CVNA, would be a 100-bagger stock pick. pic.twitter.com/CA9BWoR4zF

— Phil Rosen (@philrosenn) December 7, 2025

Looking ahead 15 years, Jackson envisions sovereigns that currently issue and roll debt instead “rely on Bitcoin,” because “over time, like that’s much more logical.” Given the “enormous” scale of the sovereign debt world, he argues that if bitcoin becomes the dominant collateral substrate, its price per coin would need to reach orders of magnitude above current levels—hence his $50 million-by-2041 target.

At press time, Bitcoin traded at $91,574.

Bitcoin price

Solana (SOL) Recovery Momentum Hinges on Price Closing Firmly Above $140

Solana started a recovery wave above the $132 zone. SOL price is now consolidating and faces hurdles near the $138 zone.

  • SOL price started a decent recovery wave above $130 and $132 against the US Dollar.
  • The price is now trading below $138 and the 100-hourly simple moving average.
  • There was a break above a key bearish trend line with resistance at $132 on the hourly chart of the SOL/USD pair (data source from Kraken).
  • The price could continue to move up if it clears $138 and $140.

Solana Price Eyes Upside Break

Solana price remained stable and started a decent recovery wave from $128, like Bitcoin and Ethereum. SOL was able to climb above the $130 level.

There was a move above the 23.6% Fib retracement level of the downward move from the $147 swing high to the $128 low. Besides, there was a break above a key bearish trend line with resistance at $132 on the hourly chart of the SOL/USD pair.

Solana is now trading below $138 and the 100-hourly simple moving average. On the upside, immediate resistance is near the $137 level, the 100-hourly simple moving average, and the 50% Fib retracement level of the downward move from the $147 swing high to the $128 low.

Solana Price

The next major resistance is near the $140 level. The main resistance could be $142. A successful close above the $142 resistance zone could set the pace for another steady increase. The next key resistance is $150. Any more gains might send the price toward the $155 level.

Another Decline In SOL?

If SOL fails to rise above the $140 resistance, it could continue to move down. Initial support on the downside is near the $132 zone. The first major support is near the $130 level.

A break below the $130 level might send the price toward the $128 support zone. If there is a close below the $128 support, the price could decline toward the $120 zone in the near term.

Technical Indicators

Hourly MACD – The MACD for SOL/USD is gaining pace in the bullish zone.

Hourly Hours RSI (Relative Strength Index) – The RSI for SOL/USD is above the 50 level.

Major Support Levels – $132 and $130.

Major Resistance Levels – $138 and $140.

XRP Price Struggles at Resistance With Signals Hinting at a Possible New Decline

XRP price started a recovery wave above $2.050. The price is now showing positive signs but might struggle to clear the $2.10 resistance.

  • XRP price started a recovery wave above the $2.050 zone.
  • The price is now trading above $2.060 and the 100-hourly Simple Moving Average.
  • There is a connecting bearish trend line forming with resistance at $2.090 on the hourly chart of the XRP/USD pair (data source from Kraken).
  • The pair could continue to move up if it settles above $2.160.

XRP Price Faces Uphill Task

XRP price remained supported above $2.00 and started a recovery wave, like Bitcoin and Ethereum. The price was able to climb above $2.020 and $2.050 to enter a positive zone.

There was a clear move above the 23.6% Fib retracement level of the downward move from the $2.2130 swing high to the $1.990 low. However, the price is now facing resistance near $2.10. There is also a connecting bearish trend line forming with resistance at $2.090 on the hourly chart of the XRP/USD pair.

The price is now trading above $2.060 and the 100-hourly Simple Moving Average. If there is a fresh upward move, the price might face resistance near the $2.10 level and the trend line. The first major resistance is near the $2.1250 level.

XRP Price

A close above $2.1250 could send the price to $2.160 and the 76.4% Fib retracement level of the downward move from the $2.2130 swing high to the $1.990 low. The next hurdle sits at $2.220. A clear move above the $2.220 resistance might send the price toward the $2.280 resistance. Any more gains might send the price toward the $2.350 resistance. The next major hurdle for the bulls might be near $2.450.

Another Decline?

If XRP fails to clear the $2.10 resistance zone, it could start a fresh decline. Initial support on the downside is near the $2.050 level. The next major support is near the $2.00 level.

If there is a downside break and a close below the $2.00 level, the price might continue to decline toward $1.9650. The next major support sits near the $1.920 zone, below which the price could continue lower toward $1.850.

Technical Indicators

Hourly MACD – The MACD for XRP/USD is now gaining pace in the bullish zone.

Hourly RSI (Relative Strength Index) – The RSI for XRP/USD is now above the 50 level.

Major Support Levels – $2.020 and $2.00.

Major Resistance Levels – $2.10 and $2.160.

Ethereum Price Targets Upside Break as Buyers Tighten Grip on Trend

Ethereum price started a fresh increase above $3,000. ETH is now consolidating gains and might aim for more gains above $3,150.

  • Ethereum started a fresh increase above the $3,000 and $3,020 levels.
  • The price is trading above $3,050 and the 100-hourly Simple Moving Average.
  • There is a key bearish trend line forming with resistance at $3,140 on the hourly chart of ETH/USD (data feed via Kraken).
  • The pair could continue to move up if it settles above the $3,150 zone.

Ethereum Price Eyes Additional Gains

Ethereum price managed to stay above $2,920 and started a fresh increase, like Bitcoin. ETH price gained strength for a move above the $3,000 and $3,020 resistance levels.

Recently, the price saw a downside correction from the $3,240 zone. There was a drop below the 50% Fib retracement level of the upward wave from the $2,718 swing low to the $3,240 low. However, the bulls remained active near the $2,920 zone.

Ethereum price is now trading above $3,050 and the 100-hourly Simple Moving Average. If there is another upward move, the price could face resistance near the $3,140 level. There is also a key bearish trend line forming with resistance at $3,140 on the hourly chart of ETH/USD.

Ethereum Price

The next key resistance is near the $3,200 level. The first major resistance is near the $3,250 level. A clear move above the $3,250 resistance might send the price toward the $3,320 resistance. An upside break above the $3,320 region might call for more gains in the coming days. In the stated case, Ether could rise toward the $3,450 resistance zone or even $3,500 in the near term.

Another Downside Correction In ETH?

If Ethereum fails to clear the $3,140 resistance, it could start a fresh decline. Initial support on the downside is near the $3,050 level. The first major support sits near the $3,000 zone.

A clear move below the $3,000 support might push the price toward the $2,950 support. Any more losses might send the price toward the $2,920 region and the 61.8% Fib retracement level of the upward wave from the $2,718 swing low to the $3,240 low. The next key support sits at $2,840 and $2,820.

Technical Indicators

Hourly MACDThe MACD for ETH/USD is gaining momentum in the bullish zone.

Hourly RSIThe RSI for ETH/USD is now above the 50 zone.

Major Support Level – $3,050

Major Resistance Level – $3,140

Bitcoin Aims Higher as Bulls Regain Strength and Push for Resistance Break

Bitcoin price started a fresh increase above $90,500. BTC is now consolidating gains and might attempt an upside break above $91,650.

  • Bitcoin started a fresh increase above the $90,500 zone.
  • The price is trading above $91,000 and the 100 hourly Simple moving average.
  • There was a break above a key bearish trend line with resistance at $90,000 on the hourly chart of the BTC/USD pair (data feed from Kraken).
  • The pair might continue to move up if it settles above the $91,650 zone.

Bitcoin Price Faces Resistance

Bitcoin price managed to stay above the $90,500 zone and started a fresh increase. BTC gained strength for a move above the $91,500 and $92,500 levels.

There was a clear move above the $93,000 resistance. A high was formed at $94,050 and the price recently corrected some gains. There was a drop below the 50% Fib retracement level of the upward move from the $83,871 swing low to the $94,050 high.

However, the bulls were active near the $87,800 support and the 61.8% Fib retracement level of the upward move from the $83,871 swing low to the $94,050 high. The price is again rising above $90,000.

There was a break above a key bearish trend line with resistance at $90,000 on the hourly chart of the BTC/USD pair. Bitcoin is now trading above $91,000 and the 100 hourly Simple moving average.

Bitcoin Price

If the bulls remain in action, the price could attempt another increase. Immediate resistance is near the $91,650 level. The first key resistance is near the $92,000 level. The next resistance could be $93,000. A close above the $93,000 resistance might send the price further higher. In the stated case, the price could rise and test the $95,000 resistance. Any more gains might send the price toward the $95,500 level. The next barrier for the bulls could be $96,200 and $96,450.

Another Decline In BTC?

If Bitcoin fails to rise above the $91,650 resistance zone, it could start another decline. Immediate support is near the $90,000 level. The first major support is near the $89,500 level.

The next support is now near the $87,800 zone. Any more losses might send the price toward the $87,250 support in the near term. The main support sits at $86,500, below which BTC might accelerate lower in the near term.

Technical indicators:

Hourly MACD – The MACD is now gaining pace in the bullish zone.

Hourly RSI (Relative Strength Index) – The RSI for BTC/USD is now above the 50 level.

Major Support Levels – $90,000, followed by $89,500.

Major Resistance Levels – $91,650 and $92,000.

Altcoin Rally Alert: 4 Bullish Signals To Watch Out For – Analyst

Prominent market analyst Michael Van de Poppe has shared four market conditions that would confirm an altcoin market rally. Meanwhile, the cryptocurrency market continues to experience a widespread correction, weighing down the price growth of several assets.

Ethereum Outperforms Bitcoin: A Positive Sign For Altcoins?

Ethereum has shown more resilience in the last month than Bitcoin, which is largely interpreted as a bullish signal for altcoin enthusiasts. In the last week alone, the prominent altcoin reported a slight market gain of 0.86% compared to Bitcoin’s loss of 1.95%. When Ethereum outperforms Bitcoin, it encourages increased altcoin activity, as investor confidence spreads beyond the market leader into the broader crypto ecosystem.

However, a full altcoin market takeover only comes into effect after the following technical developments. Firstly, de Poppe explains that Bitcoin, as the market leader, must achieve a breakthrough above $92,000 resistance, potentially testing the $100,000 mark, to signal renewed market strength. Additionally, the analyst states the ETH/BTC ratio must stay above its 20-day moving average (MA), indicating Ethereum’s continued dominance and further encouraging altcoin accumulation. Together, these signals could set the technical bedrock for a significant altcoin rally.

Macro Factors Could Amplify Altcoin Gains

Beyond crypto-specific indicators, de Poppe also touches on broader financial market plays that could initiate the next altcoin move. The analyst suggests that a 5-10% correction in gold prices, coupled with a peak in silver, could encourage capital to flow into riskier assets like cryptocurrencies including cryptocurrencies. 

Meanwhile, a strong upward movement in the Nasdaq would indicate increased investor risk appetite, a development that often translates into heightened activity in the crypto markets. When combined with positive momentum in Bitcoin and Ethereum, these macro signals could create an environment ripe for a substantial altcoin rally. According to de Poppe, the fulfillment of these conditions indicates that altcoins could achieve market gains of 200%-300% in the present market cycle.

Market Overview

At the time of writing, the total cryptocurrency market is valued at $3.04 trillion, following a significant 15.5% decline over the past month. Meanwhile, the altcoin market cap stands at $1.26 trillion, accounting for 41.44% of all circulating digital assets. In tandem, data from CoinMarketCap shows the altseason index at 20/100, as Bitcoin still maintains a dominant grip on overall market performance, with a 58.6% dominance.

In short, the conditions for a full-scale altcoin breakout have yet to materialize,  but the key indicators highlighted above suggest that scenario may be approaching if momentum shifts decisively toward risk assets.

altcoin

❌