Reading view

There are new articles available, click to refresh the page.

Industry Leader Shares Why Ethereum Price Will Reach $12,000

Industry leader Tom Lee has shared how the Ethereum price could reach $12,000 within the next few months. He based his prediction on the Bitcoin price action and how ETH could match the flagship crypto on a potential run to the upside. 

Tom Lee Explains How The Ethereum Price Could Rally To $12,000

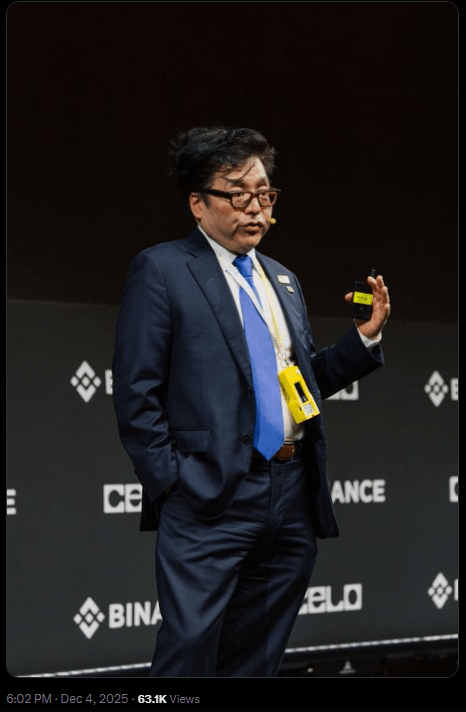
Speaking at the Binance Blockchain Week, Tom Lee predicted that the Ethereum price could reach $12,000 as Bitcoin rallies to $250,000 within the next few months. He explained that ETH can reach the $12,000 target if the ETH/BTC ratio returns to its eight-year average of 0.0479. Lee described this potential rally to $12,000 as a “huge move.”

Tom Lee further predicted that the Ethereum price could reach $22,000 if the ETH/BTC ratio gets to its 2021 high of 0.0873. He added that he believes Ethereum will become the future of finance and the payment rails. As such, Lee predicted that the ETH/BTC ratio could reach 0.2500, sparking an Ethereum rally to as high as $62,500. In line with this, the expert declared that ETH at $3,000 is “grossly undervalued.”

Ethereum

Tom Lee also remarked that the bigger the base, the bigger the breakout for the Ethereum price. He noted that ETH spent years building a similar base to its current price action before the move from $90 to its previous all-time high (ATH) of $4,866. The expert added that if the pattern plays out again, the next leg could be larger than what people expect. 

It is worth noting that Tom Lee is the chairman of BitMine, which is the largest Ethereum treasury company. According to Strategic ETH Reserve data, the company currently holds 3.73 million ETH, which is just over 3% of the altcoin’s total supply. Lee remains bullish on the Ethereum price, despite his company holding an unrealized loss of $3.3 billion of their ETH investment. 

A Rally To $62,000 Is “Ambitious”

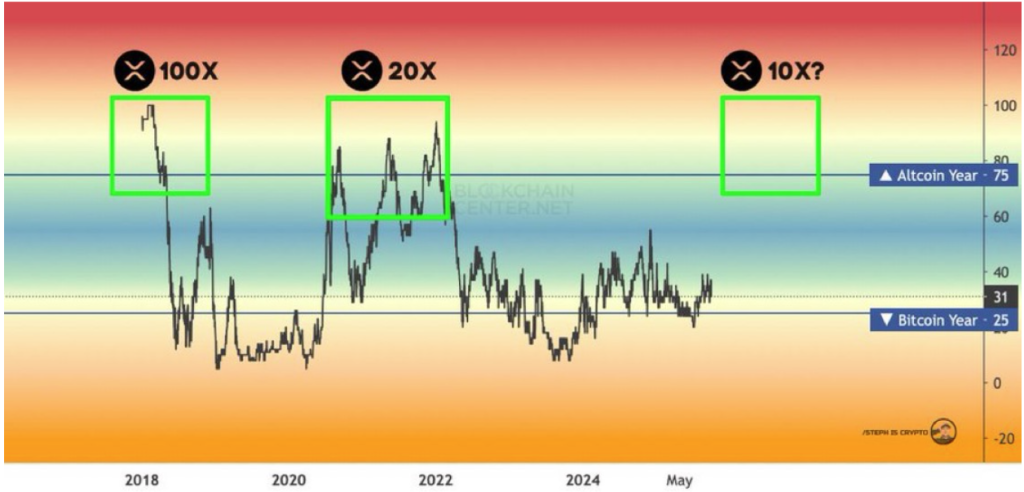
Market commentator Milk Road described Tom Lee’s Ethereum price prediction of $62,000 in a few months as being ambitious. The platform stated that an ETH/BTC ratio of 0.25 has never happened. The highest it has ever gone is 0.15, and that was during the 2017 supercycle, which makes it less likely now, given that market conditions have changed. 

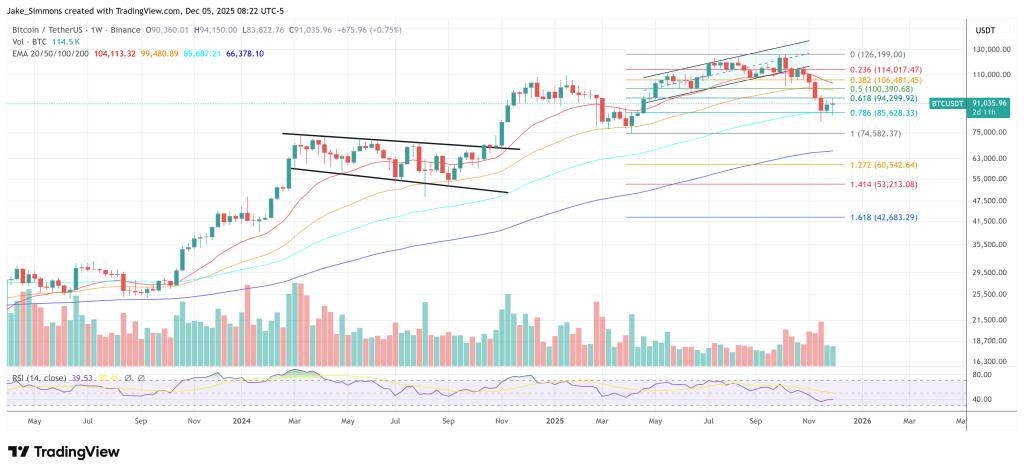
Tom Lee had based his Ethereum prediction on Bitcoin hitting $250,000, which Milk Road also described as an issue. The market commentator noted that BTC would need to surge 177% from current prices to reach this target. The last time this happened was in 2020 when it surged from $7,000 to $19,000 during the “peak mania.” Notably, BTC didn’t record a 100% gain even when the Bitcoin ETFs launched last year. 

At the time of writing, the Ethereum price is trading at around $3,000, down over 4% in the last 24 hours, according to data from CoinMarketCap.

Ethereum

Bitcoin Price Falls Below $90,000 — Is The Recovery Over?

The Bitcoin price has had a mixed performance over the past week, with both sides of the market divide struggling to establish dominance. In the latest battle between the bulls and bears, the premier cryptocurrency appears to be succumbing to pressure from the latter group.

As this weekend approached, the Bitcoin price retreated from its latest local high of around $94,000 to beneath the psychological $90,000 level. This latest correction has prompted questions in the crowd, with investors wondering whether it is just a brief obstacle or the end of the recovery.

Why $80,500 Could Be The Next Local Low For BTC

In a December 5 post on the social media platform X, Alphractal CEO and founder shared insight into the latest Bitcoin price decline below $90,000. The on-chain expert revealed that losing the $89,800 level is the more relevant occurrence in the latest price downturn.

In a previous post on X, Wedson evaluated the likely trajectory of the Bitcoin price should it lose the $89,800 level. The crypto pundit revealed that losing this price mark could lead to an accumulation pattern for the bulls or a redistribution phase for the bears.

While the accumulation period for the bulls would initially coincide with lower prices, it eventually leads to a Bitcoin price return to above the latest local high. Meanwhile, a redistribution phase could see the bears push the flagship cryptocurrency to around the $70,000 mark.

Bitcoin price

According to the Alphractal CEO, the price of BTC also failed to hold the key on-chain levels, strengthening the probability of a broader price sideways phase. “Sideways action is the cause — the big pumps or dumps are just the effect,” Wedson had earlier stated in his previous X post.

Furthermore, Wedson noted that the next level to watch is $86,500, which, if lost, opens the very high possibility for the formation of a new local low around $80,500. This local low could provide a perfect spot for investors to buy the dip and enter the market.

Bitcoin Price Overview 

As mentioned earlier, the past week has been one of highs and lows for the premier cryptocurrency, plummeting to as low as $84,600 on Monday, December 1. After a shaky start to the month, the Bitcoin price recovered strongly to around $94,000 on Thursday, December 4.

As of this writing, the market leader is valued at around $89,415, reflecting an over 3% price decline in the past 24 hours. According to data from CoinGecko, the price of Bitcoin has been down by nearly 10% in the past year.

Bitcoin price

Pundit Predicts That XRP Is About To Make Investors Extremely Rich

A crypto analyst has made an unexpected declaration, predicting that XRP investors could become extremely rich in just a few months. This bold claim comes with a new technical analysis, suggesting that XRP is now entering a pivotal price area that previously triggered explosive rallies. Despite the cryptocurrency’s low price and recent downtrend, the analyst remains confident that XRP could mirror past trends and skyrocket to new highs.

XRP To Make Holders Wealthy In 3 Months?

In a recent X post, popular market analyst ‘Steph Is Crypto’ issued a dramatic warning to XRP holders, announcing that investors will become extremely rich within the next three months. The analyst’s bold prediction elicited mixed reactions from the XRP community, with some expressing optimism and others skepticism. 

Steph Is Crypto shared a price chart with colored bands to support his ambitious claims, tracking XRP’s performance through multiple past bull cycles. The chart highlights a recurring pattern in which XRP enters a higher-colored zone during periods often associated with altcoin strength. In previous cycles, those moments were followed by unexpected, explosive upward price moves

During the bull cycle in 2018, XRP skyrocketed by 100x, pushing its price up towards its current all-time high of $3.84. A similar uptrend occurred again during the 2020 to 2022 cycle, with XRP entering a prolonged bull phase that saw its price rally by 20x. According to Steph Is Crypto, the current chart setup appears similar to these past bullish phases. 

His chart analysis suggests that XRP is once again approaching the same colored region that previously marked the start of strong price rallies. While the scale of the projected acceleration this time may differ from the peaks seen in the last two cycles, Steph Is Crypto remains confident that it will still be substantial enough to make holders significantly wealthy by March 2026.

XRP Maintains Bullish Monthly SuperTrend

Crypto market analyst ChartNerd has released a fresh technical analysis of XRP, suggesting that the cryptocurrency continues to show strong positive signals. According to him, XRP’s monthly SuperTrend remains firmly bullish. He emphasized that maintaining a price above the green SuperTrend line near $1.30 signals a long-term upward trajectory, with no red trends currently indicating the onset of a bear market. 

ChartNerd shared a chart with a SuperTrend overlay where green lines represent bullish conditions and red lines highlight previous bear markets. The current monthly candles for XRP remain well above the green zone, reinforcing the belief that broader market conditions favor an upside. The analyst interprets this as confirmation that XRP’s long-term price trend is still predominantly bullish. 

Historical data on the chart also indicate that past declines in XRP coincided with prolonged red SuperTrend phases. This happened before the big 2017 and 2020 breakout, with each recovery triggered once the price moved back above the green SuperTrend line. 

Featured image from Unsplash, chart from TradingView

Bitcoin Settles In Consolidation Zone – Levels To Watch

Bitcoin (BTC) trades just below $90,000 after a fluctuating week of price action resulted in a net loss of 1.8%. Despite initial hopes of a resurgence in late November, the premier cryptocurrency is now 29.16% away from its all-time high. Going by the price action, popular analyst with the X username PlanD postulates BTC is now in consolidation guided by two major price levels.

Bitcoin Moves In Key Range Between $85,000-$93,000, Market Breakout Awaits

In an X post on December 5, PlanD provides an update on a continued analysis of the Bitcoin market, stating the crypto market leader appears to be building momentum within a set price range. Notably, recent price action has pushed the flagship cryptocurrency below the lower boundary of a broadening ascending channel between $93,000 and $131,000, raising fears of a bear market. However, Bitcoin has repeatedly rebounded, forming a strong consolidation range between $85,400 and $93,000. PlanD defines the present market condition as Bitcoin being in a decision zone and needing a price breakout to determine its next major direction. The analyst states that if Bitcoin moves to overcome the price resistance at $93,000, its initial price target lies at $100,000. A successful reclaim of this psychological six-figure level would confirm renewed bullish intent and stronger potential for a full market revival.

Bitcoin

On the other hand, if Bitcoin breaks below the vital support zone at $85,300, investors should expect steeper losses. In this case, PlanD projects a price drop to around $72,000, representing a potential 19% decline from present market prices. Notably, considering the recent market volatility, the ongoing consolidation may close out sooner than expected, to establish a clear market direction.

Bitcoin Price Overview

According to data from CoinMarketCap, Bitcoin trades at $89,703, reflecting a price loss of 2.99%. Meanwhile, the daily trading volume is up by 4.56% and valued at $63.16 billion.

Following the turbulent price action of the last week, BTC’s price struggles in Q4 continue against previous popular predictions. Still, several bullish indicators could support a rebound before year-end. Key catalysts include a widely anticipated interest rate cut at the upcoming Federal Open Market Committee (FOMC) meeting on December 9–10.

In addition, market sentiment is benefiting from speculation that pro-crypto economist Kevin Hassett could succeed Jerome Powell as Federal Reserve Chair in 2026.

Bitcoin

Italy’s Market Watchdog Gives Crypto Firms A Clear Order: Act Or Exit

According to a press release from Consob on December 4, 2025, Italy’s securities regulator told crypto and virtual asset service providers (VASPs) that they must secure authorization under the EU’s Markets in Crypto-Assets regime (MiCA) by December 30, 2025, or stop serving Italian clients.

The notice warns operators that those who do not file for a MiCA-compliant license must close out services and return customer funds by the year-end.

Consob’s Deadline And What It Means For Firms

Based on reports, companies that submit an authorization application by the cutoff may keep operating while the application is under review. But that temporary permission will not last beyond June 30, 2026, regulators say. That window gives providers some breathing room, but it also sets a hard date for final approvals.

The regulator singled out platforms that until now have worked under Italy’s lighter national registry system (OAM). Those businesses now face a choice: apply to become fully authorized crypto-asset service providers (CASPs) under MiCA or plan an orderly exit. Operators who plan to leave must notify users clearly and return assets in a safe, verifiable way.

Italy Opens A Broader Risk Review

According to a Reuters report, Italy’s Economy Ministry has also ordered an in-depth review of crypto risks, bringing together the Bank of Italy, Consob and other agencies to check whether current protections are strong enough for investors and the wider financial system. The move came during a committee meeting that flagged rising exposure and the need to monitor spillovers into traditional finance.

What Investors Should Watch For Next

Customers in Italy should confirm whether their chosen platform has lodged a MiCA application or has made clear plans for compliance or exit. If an operator fails to apply by December 30, users could face service interruptions and will need to follow the provider’s instructions for fund returns. Regulators say transparency from firms will be key in the weeks ahead.

Smaller local platforms may find the compliance burden steep. Some operators could seek licenses in other EU states and use passporting rules to serve Italian clients, while others may shut down or merge.

The provisional operating window stretches into mid-2026, but the final shape of the market will depend on how quickly firms meet the tougher requirements and how long authorizations take to process.

Consob’s notice is meant to cut through uncertainty and force a choice before year-end. The combination of a firm deadline, mandatory filings and a parallel review marks a stricter approach to crypto oversight in Italy.

Featured image from Unsplash, chart from TradingView

Bitcoin Bull Season Hinges On Key $82,150 Level – Here’s Why

The Bitcoin market continues to experience high levels of investor uncertainty, as indicated by the unstable price action of the past week. In the last month alone, the leading cryptocurrency has lost about 14% of its value, strengthening fears of an impending bear market. Notably, renowned market expert Ali Martinez has shared some insight on this speculation, highlighting a key technical development that historically precedes an extended downtrend.

Bitcoin Winter Phase To Start Only When Price Loses 730-Day SMA – Analyst 

In an X post on Friday, Martinez presents an on-chain analysis that identifies a key price zone for determining Bitcoin’s price trajectory amid current market volatility. Using data from the Bitcoin Investor Tool metric from Glassnode, the analyst has discovered that extended downtrends in Bitcoin often start once the price falls below its 730-day Simple Moving Average (SMA), a level currently sitting at $82,150. For context, the chart below shows that the 730-day SMA (green), an important long-term indicator, has historically acted as a structural support level during major market cycles. When Bitcoin decisively loses this line, momentum tends to shift, leading to deeper corrections and lengthier bearish periods as seen between 2015-2016, 2019, and 2022-2023.

Bitcoin

However, the chart also presents some bullish insights. Larger cyclical metrics, including the 730-day SMA × 5 band (pink) sitting at $410,771, remain well above the current price, indicating that macro overvaluation is not yet a concern, as the leading cryptocurrency remains far from an overheated zone. According to Ali Martinez, as long as Bitcoin holds above $82,150, the potential for any prolonged downtrend synonymous with a bear market remains minimal, ensuring the bull structure remains intact.

Bitcoin Weekly Net Outflows Hit $800M As Accumulation Rises

In other developments, on-chain analytics firm Sentora reports that the Bitcoin market recorded an $805 million increase in weekly exchange net outflows, indicating that a significant portion of market investors are unfazed by the recent price correction. Instead, they are opting to transfer more of their investment off crypto exchanges, suggesting an intention to hold in anticipation of future price appreciation. Meanwhile, total Bitcoin network fees reached $1.96 million, representing a 7.69% gain from the previous week and indicating an increase in transactions and network activity during this period. At the time of writing, Bitcoin trades at $89,693 following a 2.71% price decline in the last 24 hours.

Bitcoin

Bernstein Forecasts Coinbase (COIN) To Surge 90%, Setting $510 Price Target

Coinbase (COIN), the largest cryptocurrency exchange in the US, has experienced a significant decline in its stock valuation, dropping nearly 40% from its peak of $444 in July to its current trading level of around $271 per share. This, amid market fluctuations and heightened volatility in the broader crypto market, impacting the exchange’s stock performance.

Bernstein Forecasts New Bullish Phase For Coinbase

Despite these challenges, analysts at Bernstein hold an optimistic outlook on Coinbase’s stock price, suggesting a potential new bullish phase that could propel COIN to surpass previous all-time highs and reach levels above $500. 

Bernstein maintains a price target of $510 on Coinbase, underlining the exchange’s shift from a trading-centric platform to what analysts dub an emerging “everything exchange.”

Analysts led by Gautam Chhugani highlighted the delicate market conditions, citing crypto price fluctuations influencing listed crypto-exposed equities

However, Bernstein distinguishes the current market environment from past crypto downturns, noting that speculative excess primarily affects what they refer to as “MSTR copycats,” referencing Strategy’s (previously MicroStrategy) stock performance. 

Central to Bernstein’s bullish thesis is Coinbase’s strategic diversification away from volatile spot trading revenue. They assert that exchange is evolving into a comprehensive financial platform.

The analysts emphasize that clearer regulatory guidelines in the US could drive a revaluation of these business lines, bridging the gap with offshore competitors benefiting from faster token listings and fundraising fees. 

Coinbase’s foray into token issuance through a launchpad-style model, exemplified by Monad’s (MON) recent listing, demonstrates growing market interest. Bernstein notes that these launches, directly influencing trading activity, can stimulate a cycle of issuance, listing, and heightened trading volume.

Confident Ratings For COIN

Looking ahead, one of the exchange’s most notable catalysts is the upcoming product showcase on December 17, anticipated to unveil developments in tokenized equities, prediction markets, and other tools expanding the exchange’s offerings beyond spot crypto trading. 

The integration with Deribit is also expected to further bolster Coinbase’s derivatives expansion, positioning the exchange closer to platforms like Robinhood as both entities diversify their product offerings.

On the consumer front, the exchange’s Base app, focusing on wallet services, payments, and social features, acts as a centralized access point for the broader token markets, reaffirming the analysts’ bullish predictions

Bernstein’s reaffirmed “Buy” rating on Coinbase with a massive $510 price target underscores the firm’s confidence in COIN’s growth trajectory. Monness Crespi’s recent upgrade from “Neutral” to “Buy” with a $375 target further adds to the bullish sentiment surrounding the stock’s valuation amid falling prices. 

Coinbase

Featured image from DALL-E, chart from TradingView.com 

Bitcoin Bull Run Set To Last Until 2027, Analysts Highlight Influential Factors

Many in the crypto space have echoed a familiar sentiment over recent months: “The four-year crypto market cycle is dead.” Experts from the Bull Theory assert that while the four-year cycle may have come to an end, the Bitcoin bull run itself is merely delayed and could stretch until 2027.

Why The Four-Year Cycle May Be Ending

In a recent post on social media platform X, formerly known as Twitter, the Bull Theory analysts noted that the concept of Bitcoin adhering to a neat four-year cycle is weakening. 

They highlighted that significant price movements over the last decade weren’t solely driven by Halving events; rather, they were influenced by shifts in global liquidity. 

The analysts pointed to the current landscape of stablecoin liquidity, which remains high despite recent downturns, indicating that larger investors are still engaged in the market, poised to invest when appropriate macroeconomic conditions arise.

In the US, Treasury policies are emerging as pivotal catalysts. The recent buybacks are notable, but the analysts emphasize that the larger narrative lies in the Treasury General Account (TGA) balance, which is currently around $940 billion—almost $90 billion above its normal range. 

This surplus cash is likely to flow back into the financial system, enhancing financing conditions and adding liquidity that typically gravitates toward risk assets.

Globally, the trends appear even more promising. China has been injecting liquidity for several months, while Japan recently announced a stimulus package worth approximately $135 billion, alongside efforts to simplify cryptocurrency regulations. 

Canada is also moving toward easing its monetary policy, and the US Federal Reserve (Fed) has officially halted its quantitative tightening (QT) measures—a historical precursor to some form of liquidity expansion.

Political And Monetary Factors Align To Create Bullish Condition

The analysts explained that when major economies adopt expansive monetary policies simultaneously, risk assets like Bitcoin tend to respond more rapidly than traditional stocks or broader markets. 

Additionally, potential policy tools, such as the Supplementary Leverage Ratio (SLR) exemption—implemented in 2020 to allow banks more flexibility in expanding their balance sheets—could return, resulting in increased credit creation and overall market liquidity.

There is also a political dimension to consider. President Trump has discussed potential tax reforms, including abolishing income tax and distributing $2,000 tariff dividends. 

Furthermore, the likelihood of a new Federal Reserve chair who supports liquidity assistance and is constructive toward cryptocurrency could bolster conditions for economic growth.

Extended Bitcoin Uptrend

Historically, whenever the Institute for Supply Management’s Purchasing Managers’ Index (ISM PMI) surpasses 55, it has been followed by periods of altcoin season. The probability of this occurring in 2026 appears high, according to the Bull Theory.

The convergence of rising stablecoin liquidity, the Treasury’s injection of cash back into markets, global quantitative easing, the cessation of QT in the US, potential bank-lending relief, pro-market policy shifts in 2026, and major players entering the crypto sector suggests a very different scenario than the old four-year halving model. 

The analysts concluded that if liquidity expands concurrently across the US, Japan, China, Canada, and other significant economies, Bitcoin is unlikely to move counter to that trend.

Therefore, rather than experiencing a sharp rally followed by a prolonged bear market, the current environment indicates a more extended and broader uptrend that could span through 2026 and into 2027.

Bitcoin

Featured image from DALL-E, chart from TradingView.com

Bitcoin Price Slides Below $90,000 – Is A Retest Of The November Lows Near?

Bitcoin (BTC) is retesting a crucial support area after its price slid 5% from the recent highs and fell below the $90,000 barrier. Some analysts have suggested that the cryptocurrency’s structure remains intact, but warned that it must bounce quickly or risk retesting the November lows.

Bitcoin Retests $88,000 After Rejection

On Friday, Bitcoin lost the recently reclaimed $90,000 level, falling to a key support area before stabilizing. The flagship crypto has been attempting to recover from the November market correction, which sent its price to a seven-month low of $80,600.

Since reaching its local lows two weeks ago, the cryptocurrency has traded within a macro re-accumulation range, between $82,000 and $93,500, attempting to break out of this zone on Wednesday, when it reached a multi-week high of $94,150.

However, as the first week of December approaches its end, BTC has lost the upper area of its local range again, falling below its monthly open and tapping the $88,000 support.

Amid the drop, Analyst Ted Pillows noted that BTC has been struggling to reclaim the $94,000 resistance, adding that price “wants to go lower here before another breakout attempt.”  Therefore, he suggested that a bounce back from the $88,000-$89,000 support zone is likely.

Altcoin Sherpa affirmed that the ongoing retest would confirm whether the recent bounce was “just lower highs and price is going lower or if we actually have any juice to bounce to like 100k or something.”

The analyst outlined two potential outcomes. In the first scenario, the flagship crypto would retrace to the $87,000-$89,000 area and bounce above the $93,000-$94,000 resistance levels.

In the second scenario, Bitcoin would continue to move sideways below the local resistance before eventually sliding to the November lows and potentially lower levels. Per the analysis, the leading cryptocurrency must bottom quickly, or it will risk the second outcome.

BTC Shows Shallowing Pullback Tendency

Analyst Rekt Capital also pointed out that Bitcoin continues to face rejection from the range high resistance. However, he considers that investors should not worry as long as the pullback isn’t as big as the previous ones.

If “the rejection is shallower than the previous two, then this resistance will continue to weaken until eventually breached,” he explained, adding that “as long as this weakening continues, BTC should be able to finally breach this resistance over time & try to challenge the multi-week Downtrend above.”

Earlier this week, the analyst affirmed that BTC’s consolidation structure will remain intact as long as Bitcoin closes the week above the range lows. He also noted that its Macro Downtrend, which “has been dictating resistance throughout this phase of the cycle,” remains the dominant structural barrier and the level to break.

As the price stabilized between the $88,500-$89,350 area, the analyst added that today’s retracement “continues to be a shallower pullback than the previous two,” which keeps the range “‘retrace shallowing’ tendency” intact.

He noted that Bitcoin could technically drop into the ascending two-week support trendline, or tap the $86,000 level and still perform a shallower correction than the recent 10% drop.

As of this writing, Bitcoin is trading at $89,400, a 2.9% decline in the daily timeframe.

Bitcoin, btc, btcusdt

Bitcoin Price Faces Potential 60% Decline As Expert Warns Of ‘Major Bull Trap’

Despite the Bitcoin price recovery above the crucial $90,000 threshold—a level that has historically served as a supportive floor for the cryptocurrency—the market is exhibiting signs that a further correction may be imminent. 

Bitcoin Price Recovery At Risk?

Market expert Rekt Fencer recently shared insights on social media platform X, formerly known as Twitter, suggesting that the Bitcoin price might be forming what he calls a “massive bull trap.” 

This term refers to a deceptive bullish signal in which the price briefly surpasses a resistance level, in this case, the $90,000 mark, only to reverse into a decline. Such movements can entrap investors who bought in during the peak, leading to significant losses.

Fencer pointed out a troubling pattern reminiscent of early 2022 when Bitcoin reclaimed its 50-week moving average (MA)—currently positioned above $102,300—before experiencing a severe decline of roughly 60%, plummeting below $20,000 by June of that year. 

Bitcoin price

He indicated that the recent price recovery following major drops to $84,000 should not be interpreted as a signal of near-term success, especially since the Bitcoin price is currently trading under the 50-week MA.

If historical trends repeat, this could mean that Bitcoin might see a significant drop, potentially reaching around $36,200, which could potentially represent the low point of the bearish cycle for the cryptocurrency. On the other hand, there are analysts who retain a bullish outlook. 

BTC Bottom In Sight? 

Market researcher and analyst Miles Deutscher expressed a confident sentiment, stating he believes there is a 91.5% likelihood that the Bitcoin price has hit its bottom, based on his analysis of key developments. 

He noted that recent weeks have been dominated by negative news stories, including concerns surrounding Tether (USDT) and the implications of China’s actions on crypto, which he asserts often mark local price bottoms.

Moreover, Deutscher pointed out a shift in market flows from predominantly bearish to bullish. He explained that the trading environment has recently seen a resurgence in buying momentum, with large investors, or “OG whales,” ceasing their selling. This change has been reflected in the order books, indicating a possible stabilization in market sentiment.

Additionally, the liquidity landscape appears to be shifting, with market conditions tightening in recent months. The potential appointment of a new Federal Reserve chair known for dovish policies, coupled with the official end of quantitative tightening (QT), could further influence market dynamics in favor of buyers.

Deutscher concluded by emphasizing that given the extreme levels of fear, uncertainty, and doubt (FUD) in the market, combined with improvements in trading flows, he believes that the odds favor the notion that the Bitcoin price has indeed reached its bottom.

Featured image from DALL-E, chart from TradingView.com 

Bitcoin Adoption Is Just Getting Started — 200x Growth Possible, Tom Lee Says

Fundstrat’s Tom Lee told attendees at Binance Blockchain Week that he believes the worst leg of the recent crypto slump is likely over and that markets may be ready for a gradual recovery. He pointed to weakening selling pressure and growing underlying activity as reasons for cautious optimism.

Market Sentiment May Be Near A Turning Point

According to Lee, mood on the street turned darker after October, with many investors showing fatigue after steady losses. He said the current selling looks closer to exhaustion than to the start of another major decline. Trading desks have cut back. Volume has thinned. Sentiment is low. Lee argued that often, when pessimism peaks, conditions for a reversal begin to form.

Bitcoin Drawdowns Are Not Uncommon

Based on reports, Bitcoin has fallen about 36% from its all-time high in the recent retreat. That size of drop has happened in prior cycles, including 2017 and 2021, and has been followed by rallies that reached new records.

“Crypto prices likely bottomed. The best years of growth are still ahead: there is 200x adoption to come.” – Tom Lee, Chairman of Bitmine pic.twitter.com/fPWbWdaosO

— Binance (@binance) December 4, 2025

Lee pointed to long-term returns for bitcoin and ether compared with some traditional assets over the last decade, saying crypto’s gains were larger. He used that history to support the idea that patient holders have been rewarded after past stress.

Tokenization Could Be A Major Story In 2026

Lee also presented tokenization as a key theme for the future. He said large institutions are preparing to move more financial products on-chain and that, if real estate joins the shift, close to a quadrillion dollars in assets could eventually be tokenized.

Stablecoins were cited as an early example of why tokenized instruments can attract demand. He suggested that a broader institutional push could add steady interest to the market over time.

BlackRock’s Bitcoin ETF Was Highlighted As A Signal

Reports have disclosed that BlackRock’s bitcoin ETF has become one of the firm’s top fee-earning products, a fact Lee used to show growing involvement from legacy finance. That kind of institutional participation, he argued, points to deeper engagement from big players who were previously on the sidelines.

Adoption Gap Suggests Large Upside

According to Lee, only 4.4 million bitcoin wallets hold more than $10,000 in BTC, while nearly 900 million people globally have more than $10,000 in retirement savings.

He said that gap shows how early the market still is and argued that if just a fraction of those savers put money into bitcoin, adoption could expand by as much as 200 times. The figure is speculative, he acknowledged, but he used it to show the potential scale for future demand.

What This Means For Investors Now

Lee questioned whether the old four-year cycle should be used as a strict guide. He suggested recent moves were driven more by de-leveraging and structural shifts than by the halving rhythm that shaped earlier cycles.

Featured image from Unsplash, chart from TradingView

This 11.7 Billion Dogecoin Wall Could Be Key Resistance For DOGE, Analyst Says

An analyst has pointed out where a key resistance could be located for Dogecoin, based on on-chain supply distribution data.

Dogecoin Has A Large Supply Cluster Present At $0.20

In a new post on X, analyst Ali Martinez has talked about where resistance lies for Dogecoin based on Glassnode’s Cost Basis Distribution (CBD). The CBD is an indicator that tells us about the amount of DOGE supply that was last acquired at the various price levels that the memecoin has visited in its history.

Below is the chart shared by Martinez that shows the recent CBD heatmap for Dogecoin.

Dogecoin CBD

As is visible in the graph, the Dogecoin CBD has flagged the zone around $0.20 as one where investors did some heavy buying. More specifically, over 11.7 billion tokens have their cost basis at this level.

Considering that DOGE is trading notably under the mark right now, all this supply would naturally be in the red. The asset rising to this level could cause a strong reaction from the investors, as these tokens will get back to their break-even.

Generally, holders in loss can be desperate for the price to reach back to their cost basis. Once the asset does rise to their acquisition level, some of these investors choose to sell, fearing that the rebound is only temporary. This can make large cost basis levels above the asset’s price potential zones of resistance.

Between the current price and $0.20, there aren’t any other regions in the CBD that are as dense with supply. Based on this, Martinez has noted, “$0.20 is the key resistance for Dogecoin.” It now remains to be seen whether DOGE will retest this level anytime soon.

In some other news, the memecoin has seen a spike in network activity recently, as the analyst has pointed out in another X post.

Dogecoin Active Addresses

In the chart, the indicator shown is the Number of Active Addresses, which measures, as its name suggests, the daily number of addresses that are participating in some kind of transaction activity on the Dogecoin network.

It would appear that this indicator has registered a surge recently, with a peak 71,589 addresses making transfers on the blockchain. This is the largest spike that the metric has observed since September.

The trend suggests that attention has returned back to the Dogecoin network after a slump, but only time will tell whether this activity pertains to accumulation or distribution.

DOGE Price

At the time of writing, Dogecoin is trading around $0.138, down over 7% in the last week.

Dogecoin Price Chart

Russia Steps Deeper Into Crypto As State Bank Prepares Direct Trading

VTB, Russia’s second-largest bank, has told clients it plans to let them buy and sell real cryptocurrencies through its brokerage service, with a target rollout in 2026 pending regulator approval.

According to the bank, the move would go beyond the derivative products that most Russian banks have offered so far. It is a clear shift toward opening traditional finance to digital assets, at least for now among wealthy clients.

Client Eligibility And Timetable

Reports have disclosed that VTB intends to begin with high-net-worth customers only. The bank set thresholds for its initial offering: clients with assets above $1.3 million or annual income over $649,000 would be eligible at first.

Andrey Yatskov, who heads VTB’s brokerage arm, said there is “sharp demand” from clients for access to actual crypto, not just paper products tied to token prices. The bank has picked 2026 as the planned start year, but it made that clear the launch depends on regulators signing off.

Real Crypto, Not Just Contracts

Based on reports, the service would allow ownership of the underlying coins — not merely derivative contracts or token-linked notes. That is a significant distinction in Russia, where until recently banks were limited to offering exposure through derivative instruments.

Allowing customers to hold coins directly would require legal and compliance work, from custody arrangements to anti-money-laundering controls. Those steps are on the critical path before any retail expansion can happen.

Potential Market Signals

VTB has also given investors a sense of how it views crypto as an asset class. The bank recommended a 7% allocation to crypto for some investor profiles, and its internal forecasts have mentioned medium-term Bitcoin price targets in the $200,000–$250,000 range under favorable conditions.

If VTB moves forward, it could be the first major Russian bank to operate in this way — a signal that some parts of the financial sector see token ownership as something to be offered through mainstream channels.

Regulatory Hurdles And Geopolitics

The plan is not risk free. Russian regulation of crypto is still evolving, and any permit to offer direct trading will require approval from the relevant authorities. Sanctions and other geopolitical pressures could alter timelines or force changes to how the service is structured. Compliance teams will need to reconcile domestic rules with international restrictions that affect many big banks operating in or dealing with Russia.

For now, the rollout remains conditional. VTB’s timeline, client criteria, and product design all hinge on legal clarifications and regulator consent. Market participants and clients will likely follow announcements from the Bank of Russia and other agencies to judge how soon broader access might come.

Featured image from Pexels, chart from TradingView

Binance Founder Crushes Bitcoin Critic In Game-Changing BTC Vs. Gold Debate

The Binance Blockchain Week event in Dubai became the center of a high-stakes showdown between traditional and digital innovation, with Bitcoin and gold going head-to-head. Investors, tech enthusiasts, and financial experts watched closely as Binance founder Changpeng Zhao expertly debated renowned Bitcoin critic Peter Schiff, making a compelling argument for why Bitcoin is better than gold. 

Binance Founder Dominates Bitcoin And Gold Debate

During the Binance Blockchain Week in Dubai, Schiff and CZ faced off in a high-profile debate over the value of Bitcoin versus Gold. Schiff defended gold as a safe, stable, and tangible asset while the Binance founder made a compelling case for Bitcoin’s adoption, utility, value, and global reach. 

Throughout the debate, which lasted over an hour, CZ consistently demonstrated the practical advantages of Bitcoin, leaving Schiff’s gold argument largely on the defensive. The Binance founder emphasized Bitcoin’s transparent and predictable supply and its role in the modern financial systems. He pointed to hundreds of millions of users who rely on Bitcoin for payments, savings, and transfers. 

Schiff argued that Bitcoin lacks inherent value and is mainly driven by hype and faith that its price will rise. He stated that gold remains tangible, centuries old, scarce, and valuable in industry, making it superior to BTC. He further asserted that “nobody needs” Bitcoin and that the cryptocurrency is “backed by nothing.”

Practical demonstrations played a key role in the debate between Schiff and CZ. The Binance founder explained how Bitcoin and crypto payments already improve financial efficiency, especially in emerging markets. Schiff questioned whether these transactions truly count as money, since merchants ultimately receive traditional currency. CZ’s response highlighted the importance of adoption and network effects, noting that people who use BTC directly for payments give it real-world significance.

The debate also considered the preferences of younger generations. CZ asked Schiff whether millennials and Gen Z favoured Bitcoin or gold. The Bitcoin critic responded sharply, suggesting that they would choose gold. He pointed out that, with many young investors losing money on BTC, gold offers a safer, more appealing alternative. The Binance founder countered that younger people understand digital value more intuitively and prefer mobile, borderless, and censorship-resistant assets. 

Digital Value And The Future Of Money

The debate between CZ and Schiff also highlighted the changing definition of money. Bitcoin functions as a decentralized network that enables instant settlement and transparent verification. Its adoption has also helped evolve the financial economy, facilitating faster and more seamless cross-border payments. Schiff argued that gold’s scarcity and industrial demand preserve its value and make it a reliable hedge against economic uncertainty. 

Tokenization also became a point of agreement during the discussion, with Schiff emphasizing that gold can be digitized and tokenized for easier ownership and distribution without moving the physical metal. CZ contended that Bitcoin offers similar advantages while also enabling global financial inclusion. They also discussed the supply of both assets, with the Binance founder noting that Bitcoin has a visible supply, while gold doesn’t. 

They also talked about the performance of both assets over the years. Schiff argued that gold had outperformed BTC over the past four years. CZ contended that Bitcoin has far outpaced gold over the last 8 years, and since its launch in 2009, it has skyrocketed from a few cents to an ATH above $126,000. He concluded his debate, predicting that Bitcoin’s growth will outpace gold over time.

Bitcoin

Is The Bitcoin Bottom In? Top Analyst Assigns 91.5% Probability

Crypto analyst Miles Deutscher has issued one of the most forceful bottom calls of this cycle, assigning a 91.5% probability that Bitcoin’s low is already in. In a X thread on December 4, he wrote: “F*ck it. I’m putting my neck on the line here. I’m 91.5% certain that the BTC bottom is in. And if it is, A LOT of people are about to be caught offside.”

Is The Bitcoin Bottom In?

Deutscher bases his conviction on four “pillars”: market reaction to news, the historical behaviour of FUD events, a shift in flows, and an improving global liquidity backdrop. Each pillar is scored in an internal model that culminates in a 91.5/100 bullish reading.

He starts with price behaviour versus headlines. Over recent days, he notes, the market has digested an “influx of bad news” – including renewed Tether FUD, another round of “China banning crypto,” MicroStrategy scrutiny and concerns around a Bank of Japan–driven yen carry trade unwind.

“Despite all this bad news, price rallied,” he writes, calling this “the first time since the major selloff began” that Bitcoin has responded positively to a destructive news cycle. He underscores an old trading adage: “The reaction to news is more important than the news itself. This tells you everything you need to know.”

The second pillar is a systematic look at whether such FUD clusters tend to coincide with local lows. Deutscher says he backtested “every single time Tether, China, BOJ, and Microstrategy FUD entered the market” in a similar way. His conclusion is stark: “Every single time, these FUD events marked a local bottom. Tether FUD = bottom.

China ‘banning’ crypto = bottom. Bank of Japan/carry trade concerns = bottom. Microstrategy FUD = bottom.” On this basis, his AI model assigns the maximum score of 28/28 to this pillar. He cautions that “in isolation, this factor doesn’t matter much,” but argues that, combined with the first pillar, it “starts to paint a convincing bull case.”

The third pillar is flows, which he calls “the most critical factor (net buy/sell pressure).” For the past weeks, flows were “aggressively negative” with OG whales selling and ETFs dumping. Recently, he argues, this picture has changed. ETF inflows are “starting to stabilise & uptick,” treasury-company holdings remain stable, and “OG whales have stopped relentlessly dumping (this is clear on the orderbooks).” This earns a 22.5/25 score in his model. He adds one key caveat: as long as DATs exist, “there are material risks.”

The fourth pillar is the liquidity and macro environment. Deutscher notes that market liquidity had been tightening for months, but now “things are shifting back toward increased market liquidity,” with global financial conditions “reloosened to near highs.” He highlights “macro tailwinds” and adds that a new, potentially more dovish Fed chair is coming and “QT has now officially ended.” This set of factors receives a 9/10 score in his framework.

Aggregating all four pillars leads to the headline figure: “With all four market pillars taken into account, we arrive at a final score of 91.5/100.”

Deutscher, however, explicitly lists caveats. He points out that US markets “have been on a massive run” and may need to cool off, that DATs “are still seeing some short-term pressure,” and that ETF flows “can flip negative at any time.” His conclusion is probabilistic rather than absolute: “Markets are a game of probabilities, and I think the odds are in favour of the bottom being in – given the extreme FUD we’ve had and the market’s reaction to it.”

At press time, Bitcoin traded at $91,035.

Bitcoin price

Here’s Why Bitcoin Volatility Sparks Fresh Attention On MicroStrategy

The Bitcoin price volatility is once again drawing attention to MicroStrategy, the company whose strategy has become a major market reference point, with billions in accumulated BTC and a track record of aggressive buying during downturns. As traders search for stability in a shaky market, Strategy’s stance is being watched closely for what it might signal about the next phase of BTC’s trend.

Why MicroStrategy’s Next Move Could Redirect Market Momentum

Bitcoin’s recent volatility has put MicroStrategy (MSTR), the largest corporate holder of BTC, in the limelight. Walter Bloomberg has revealed on X that analysts are watching closely to see if the company could influence the cryptocurrency’s price if it sells some of its holdings.

According to JPMorgan, Strategy can avoid forced sales as long as its enterprise value-to-BTC holdings ratio stays above 1.0, which currently stands at 1.13 BTC. However, analysts continue to debunk these claims, accusing JPMorgan of spreading misinformation about market manipulation and the company.

Walter stated that if the ratio remains above this level, BTC markets may stabilize and ease recent market pressure. Due to the market pressure, the firm has slowed its BTC purchases, adding 9,062 BTC last month compared to 134,480 BTC a year ago, reflecting a more cautious accumulation approach amid a broader crypto downturn. Its stock has dropped roughly 42% over the past three months.

Additionally, challenges include the potential exclusion from MSCI indices, which could trigger $8.8 billion in passive fund outflows if index funds are forced to divest. However, MicroStrategy holds a $1.4 billion reserve for dividends and interest, helping it avoid selling its BTC even if the price falls further. In the meantime, there is no proof that MicroStrategy is in danger of liquidation.

How Institutional Behavior Builds A Higher Floor For Bitcoin

In a market speculation, Bitcoin is currently experiencing one of the most significant capital migrations in its history, fueled by institutional adoption. Analyst Matthew noted that the current BTC market cycle from 2022 to 2025 has already absorbed an unprecedented amount of new capital, surpassing all previous BTC cycles. This growth is a reflection of the market’s maturity and the ecosystem’s innovative approach to liquidity through regulated instruments.

Bitcoin

Furthermore, the network has incorporated more than $732 billion in fresh capital in the current cycle, surpassing the $388 billion that was injected during the 2018 to 2022 cycle. At that time, the surge helped push BTC market capitalization to an all-time high record of $1.1 trillion, a metric that indicates a much higher aggregate cost base for new institutional investors.

Related Reading: Why Bitcoin Traders Fear A Repeat Of July 2024’s Crash Next Week

Meanwhile, the total settlement volume in the decentralized BTC protocol was approximately $6.9 trillion in just 90 days. Despite this, the number of active on-chain entities dropped from 240,000 to 170,000 per day, which is a reflection of liquidity migration of capital flows into spot ETFs.

Bitcoin

The $13.5 Billion Liquidity Injection That Could Send Bitcoin And Crypto Prices Flying

Bitcoin has been struggling to build momentum in recent weeks, and the return of cash into the system is raising questions about whether this could be the moment that changes the tone of the crypto market. That growing sense of anticipation has already started to show up in prices, with the total crypto market cap climbing more than $250 billion from its $3.016 trillion low on December 2.

What Happened: The Liquidity Injection And Why It Matters

After officially bringing its multi-year quantitative tightening (QT) program to an end, the central bank followed up with a $13.5 billion overnight repo operation, funneled through the New York Fed. Banks brought $13.5 billion in Treasuries to the Fed, the Fed accepted all of it, and instantly injected $13.5 billion of fresh reserves into the system.

The move, which is the second-largest liquidity injection since the COVID-19 crisis, effectively puts an end the steady shrinkage of bank reserves that has persisted for years, easing pressure on short-term funding markets and signaling a more accommodative liquidity environment.

The crypto market responded almost instantly. A handful of major assets began turning green within hours of the injection, with Bitcoin leading the charge with an instant break above $92,000.

The influx was visible at a macro level as well: the total crypto market cap climbed from a December 2 low of $3.016 trillion to $3.269 trillion by December 4. A gain of more than $250 billion in under 48 hours

What Investors Should Watch Next

Ending QT leads to better liquidity and often create a bullish environment for equities and other riskier investments like cryptocurrencies. However, although a single liquidity event does not guarantee a sustained multi-month rally, this injection stands out not just for its size but for what it represents. 

Related Reading: 4 Bitcoin Indicators That Led To Market Rallies In The Last 2 Years Have Returned

In a CNBC interview, Fundstrat’s Tom Lee stated that the Fed’s decision to stop QT will be a turning point for the cryptocurrency market. Lee pointed out that the last time the Fed ended QT, the market rose about 17% within three weeks.

The previous time the Fed brought quantitative tightening to a stop was in July 2019, roughly a year after it began reducing its balance sheet. In the three weeks that followed, the S&P 500 climbed about 5%. Bitcoin’s also initially rallied in the same period, but its strongest reaction came months after, towards late 2019 and early 2020.

Bitcoin

Trend Reversal Puts Dogecoin On A Path To $0.188

Dogecoin has quietly been trying to find its footing again. The price has started to firm up after a period of declines that dragged the meme coin to as low as $0.134 in early December, trading around $0.14 to $0.15 and showing signs that bearish pressure might be easing. 

In that backdrop, a recent chart analysis shared by crypto analyst BitGuru on X shows that Dogecoin could be forming a bullish base, and it offers a possible setup for a rebound towards $0.2.

A Recovery Attempt Begins To Take Shape

The daily candlestick price chart shows Dogecoin rebounding from the lower boundary of its demand zone after briefly dipping beneath it on December 1. That bounce is significant because it represents the willingness to defend the area that held price earlier in July and again during the October pullback. This playout means that Dogecoin has now created a higher low relative to the November breakdown, and this detail means that bullish movement might be moving in.

As it stands, Dogecoin’s price is now pushing back toward the middle of the broader range highlighted in green and teal on the chart below. Recent bullish candle closes on the daily timeframe show that the Dogecoin price is trying to push into that region once again, suggesting that buyers have begun testing the strength of mid-range resistance.

The chart reflects this pattern by displaying earlier price expansions in July and September, both of which unfolded after the Dogecoin price created a higher low.

Dogecoin prIce

Dogecoin Price Chart. Source: @bitgu_ru On X

Dogecoin On A Path To $0.188

Dogecoin’s higher-low structure is the signal BitGuru highlights as the earliest sign that momentum may be shifting. Now that the price is now climbing away from the demand zone, the first area to watch is the dotted mid-range line on the chart, which is at $0.188. 

A clean move above that level would mean that buyers have regained control of the market structure. This could open the door for a broader recovery and see Dogecoin returning above $0.20.

At its current price of $0.148, the targets at $0.188 and $0.20 represent gains of roughly 27% and 35%. These levels fall within a range of short-term price targets that Dogecoin could realistically reach before the end of the year if there’s even a little bullish momentum.

However, Dogecoin’s near-term outlook isn’t just about its own chart. Its fate is linked to the broader crypto market, especially Bitcoin. Therefore, Dogecoin’s price action might remain vulnerable to more declines and consolidations unless the wider crypto market turns bullish again. On the other hand, tentative signs of recovery, including rising trading volume, point to a bullish setup for Dogecoin.

Dogecoin price chart from Tradingview.com

Bitcoin Must Break $97K To Restore Confidence Among Youngest Long-Term Holders – Details

Bitcoin is trading around $91,000 after a minor dip earlier today, and uncertainty continues to dominate sentiment. The market sits at a crossroads: a small but vocal group of analysts argues that the recent correction served as a healthy reset before a continuation of the broader uptrend, while the majority of traders believe the first leg of a new bear market is already underway. With price action still showing hesitation, the debate grows louder by the day.

According to top analyst Darkfost, a critical threshold will help determine Bitcoin’s next major direction. He highlights the importance of the Realized Price of the youngest Long-Term Holder (LTH) band, which currently sits at $96,956. This metric marks the transition point between short-term and long-term holders and is viewed as a psychological and structural barrier for market stability.

Reclaiming this level would push these young LTHs back into a comfortable profit zone, reducing their incentive to sell and helping to restore confidence across the market. Until Bitcoin closes decisively above $97K, Darkfost warns that caution is warranted, as volatility remains high and the risk of further downside persists.

Why the $97K Threshold Matters for Bitcoin’s Next Major Move

Darkfost emphasizes that the $96,956–$97,000 zone plays a crucial role in shaping Bitcoin’s next phase. This level represents the Realized Price of the youngest Long-Term Holder band, meaning it reflects the average cost basis of investors who recently transitioned from short-term to long-term holding behavior. When Bitcoin trades below this threshold, these holders sit at an unrealized loss, increasing the likelihood of panic selling and adding pressure to the market.

Bitcoin Realized Price UTXO Age Bands

Breaking above this zone would flip sentiment for this group almost immediately. Darkfost explains that reclaiming $97K would place these investors back into a comfortable profit position, restoring their confidence and expectations of potential gains. Once this psychological weight lifts, these holders typically choose to keep accumulating rather than selling, which naturally brings more stability to the market.

However, he cautions that Bitcoin’s failure to close above $97,000 keeps the risk tilted to the downside. As long as the price remains below this band, the market stays vulnerable, and volatility may continue.

Even if BTC successfully reclaims $97K, Darkfost reminds that this is only the first step. The market would still need stronger structural confirmation—such as reclaiming key moving averages and rebuilding demand—to validate a true bullish reversal that could eventually lead to a new all-time high.

BTC Weekly Structure Shows Early Signs of Stabilization

Bitcoin’s weekly chart reflects a market trying to stabilize after a sharp multi-week correction that dragged the price from above $115,000 down toward the mid-$80,000s. The latest weekly candle shows a firm rebound from the 100-week moving average (green line), now acting as dynamic support around the $84,000–$86,000 region. This level historically attracts long-term buyers, and the strong wick rejection confirms renewed demand.

BTC consolidates around key level | Source: BTCUSDT chart on TradingView

BTC is currently trading near $91,300, sitting just below the 50-week moving average (blue line), which now acts as resistance. A clean reclaim of this moving average—currently positioned around $95K–$97K—would significantly improve the technical outlook and align with on-chain signals calling for a recovery. Until then, the trend remains neutral-to-bearish on higher timeframes.

Volume during the recent bounce stands out, showing one of the strongest buying reactions since early 2025. This suggests that long-term holders and institutional buyers may be stepping in as the price approaches key value zones.

However, Bitcoin is not out of danger. Failures to break above $97K would leave the structure vulnerable to another leg down, potentially retesting $86K or even deeper liquidity pockets around $80K.

Featured image from ChatGPT, chart from TradingView.com

XRP Price On The Verge Of Another Crash, But There’s Still Hope

Crypto analyst CryptoInsight has indicated that the XRP price is on the verge of another crash, with a potential drop below the psychological $2 level. The analyst also revealed the level that the altcoin needs to reclaim to invalidate this bearish outlook. 

XRP Price Risks Crash To Another Low

In an X post, CryptoInsight suggested that the XRP price could crash to a new low. This came as the analyst noted that on the lower time frame, the altcoin has made a higher low after bouncing from range lows. However, it has yet to make a higher high, which provides a bearish outlook. 

The analyst further remarked that until the XRP price makes a higher high, there is likely to be more chop while questioning the possibility of another low revisit. He indicated that XRP will need to break the descending triangle and through the $2.30 level before a reversal can be on the cards. 

XRP

However, CryptoInsight is still bullish on the XRP price in the long term. He noted that the higher-time-frame structure is still well and truly intact. The analyst added that the altcoin is holding the yearly range lows as support, which is also the previous 7-year resistance. In line with this, he declared that it is inevitable that XRP records a new all-time high (ATH) in the near future based on liquidity alone. 

Meanwhile, the analyst remarked that he is uncertain whether the XRP price will wick out to the bottom first to regain momentum. Overall, he remains bullish on XRP. Crypto analyst CasiTrades had stated that XRP might need to record one last low before it reverses and rallies to new highs. She highlighted $1.80 and $1.64 as areas that XRP could bottom at. 

XRP Likely To Retest $2.04 With Two Likely Scenarios

In her latest X post, CasiTrades stated that the XRP price is likely heading to retest the macro .5 Fib at $2.04. She noted that this level has been the most important one in the entire correction. Based on this, she outlined two scenarios that could play out if the altcoin drops to that level. The analyst described the first scenario as the bullish new trend. 

Under this scenario, if $2.04 holds as support, the XRP price could break above the $2.41 resistance and push toward $2.65, confirming a new bullish wave structure is forming. CasiTrades remarked that this potential move would strongly suggest that the macro low is already in, with the altcoin eyeing new highs between $7 and $10. 

Meanwhile, the second scenario is a bearish .618 support test. If the XRP price fails to hold $2.04, CasiTrades predicts that it would likely head toward $1.64, completing the full macro .618 retracement before launching into the macro Wave 3. 

At the time of writing, the XRP price is trading at around $2.08, down over 4% in the last 24 hours, according to data from CoinMarketCap.

XRP

❌