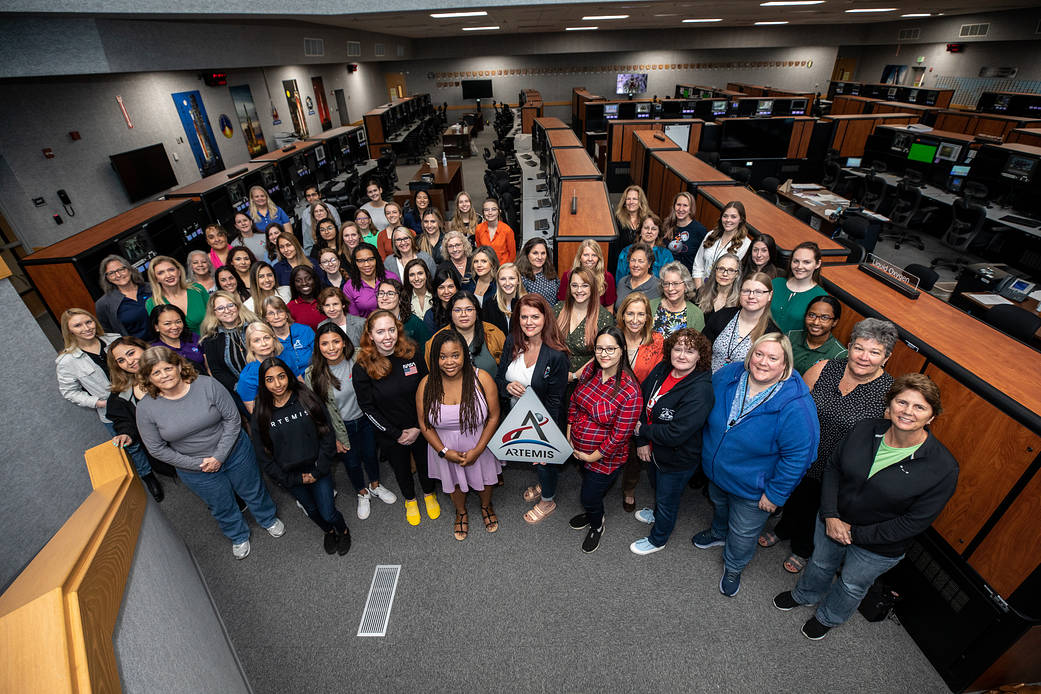
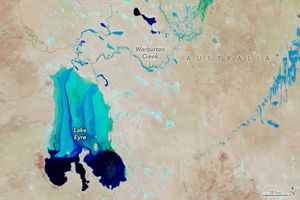
Detergent bottles and other litter can travel thousands of miles across the ocean before washing up on the remote Island of Kaho’olawe in Hawaii. JPL remote-sensing technology recently showed that it can spot plastic pollution on land, but doing so in the sea presents challenges.
NOAA
Space-based technology could help track plastic and other flotsam by its ‘fingerprints.’
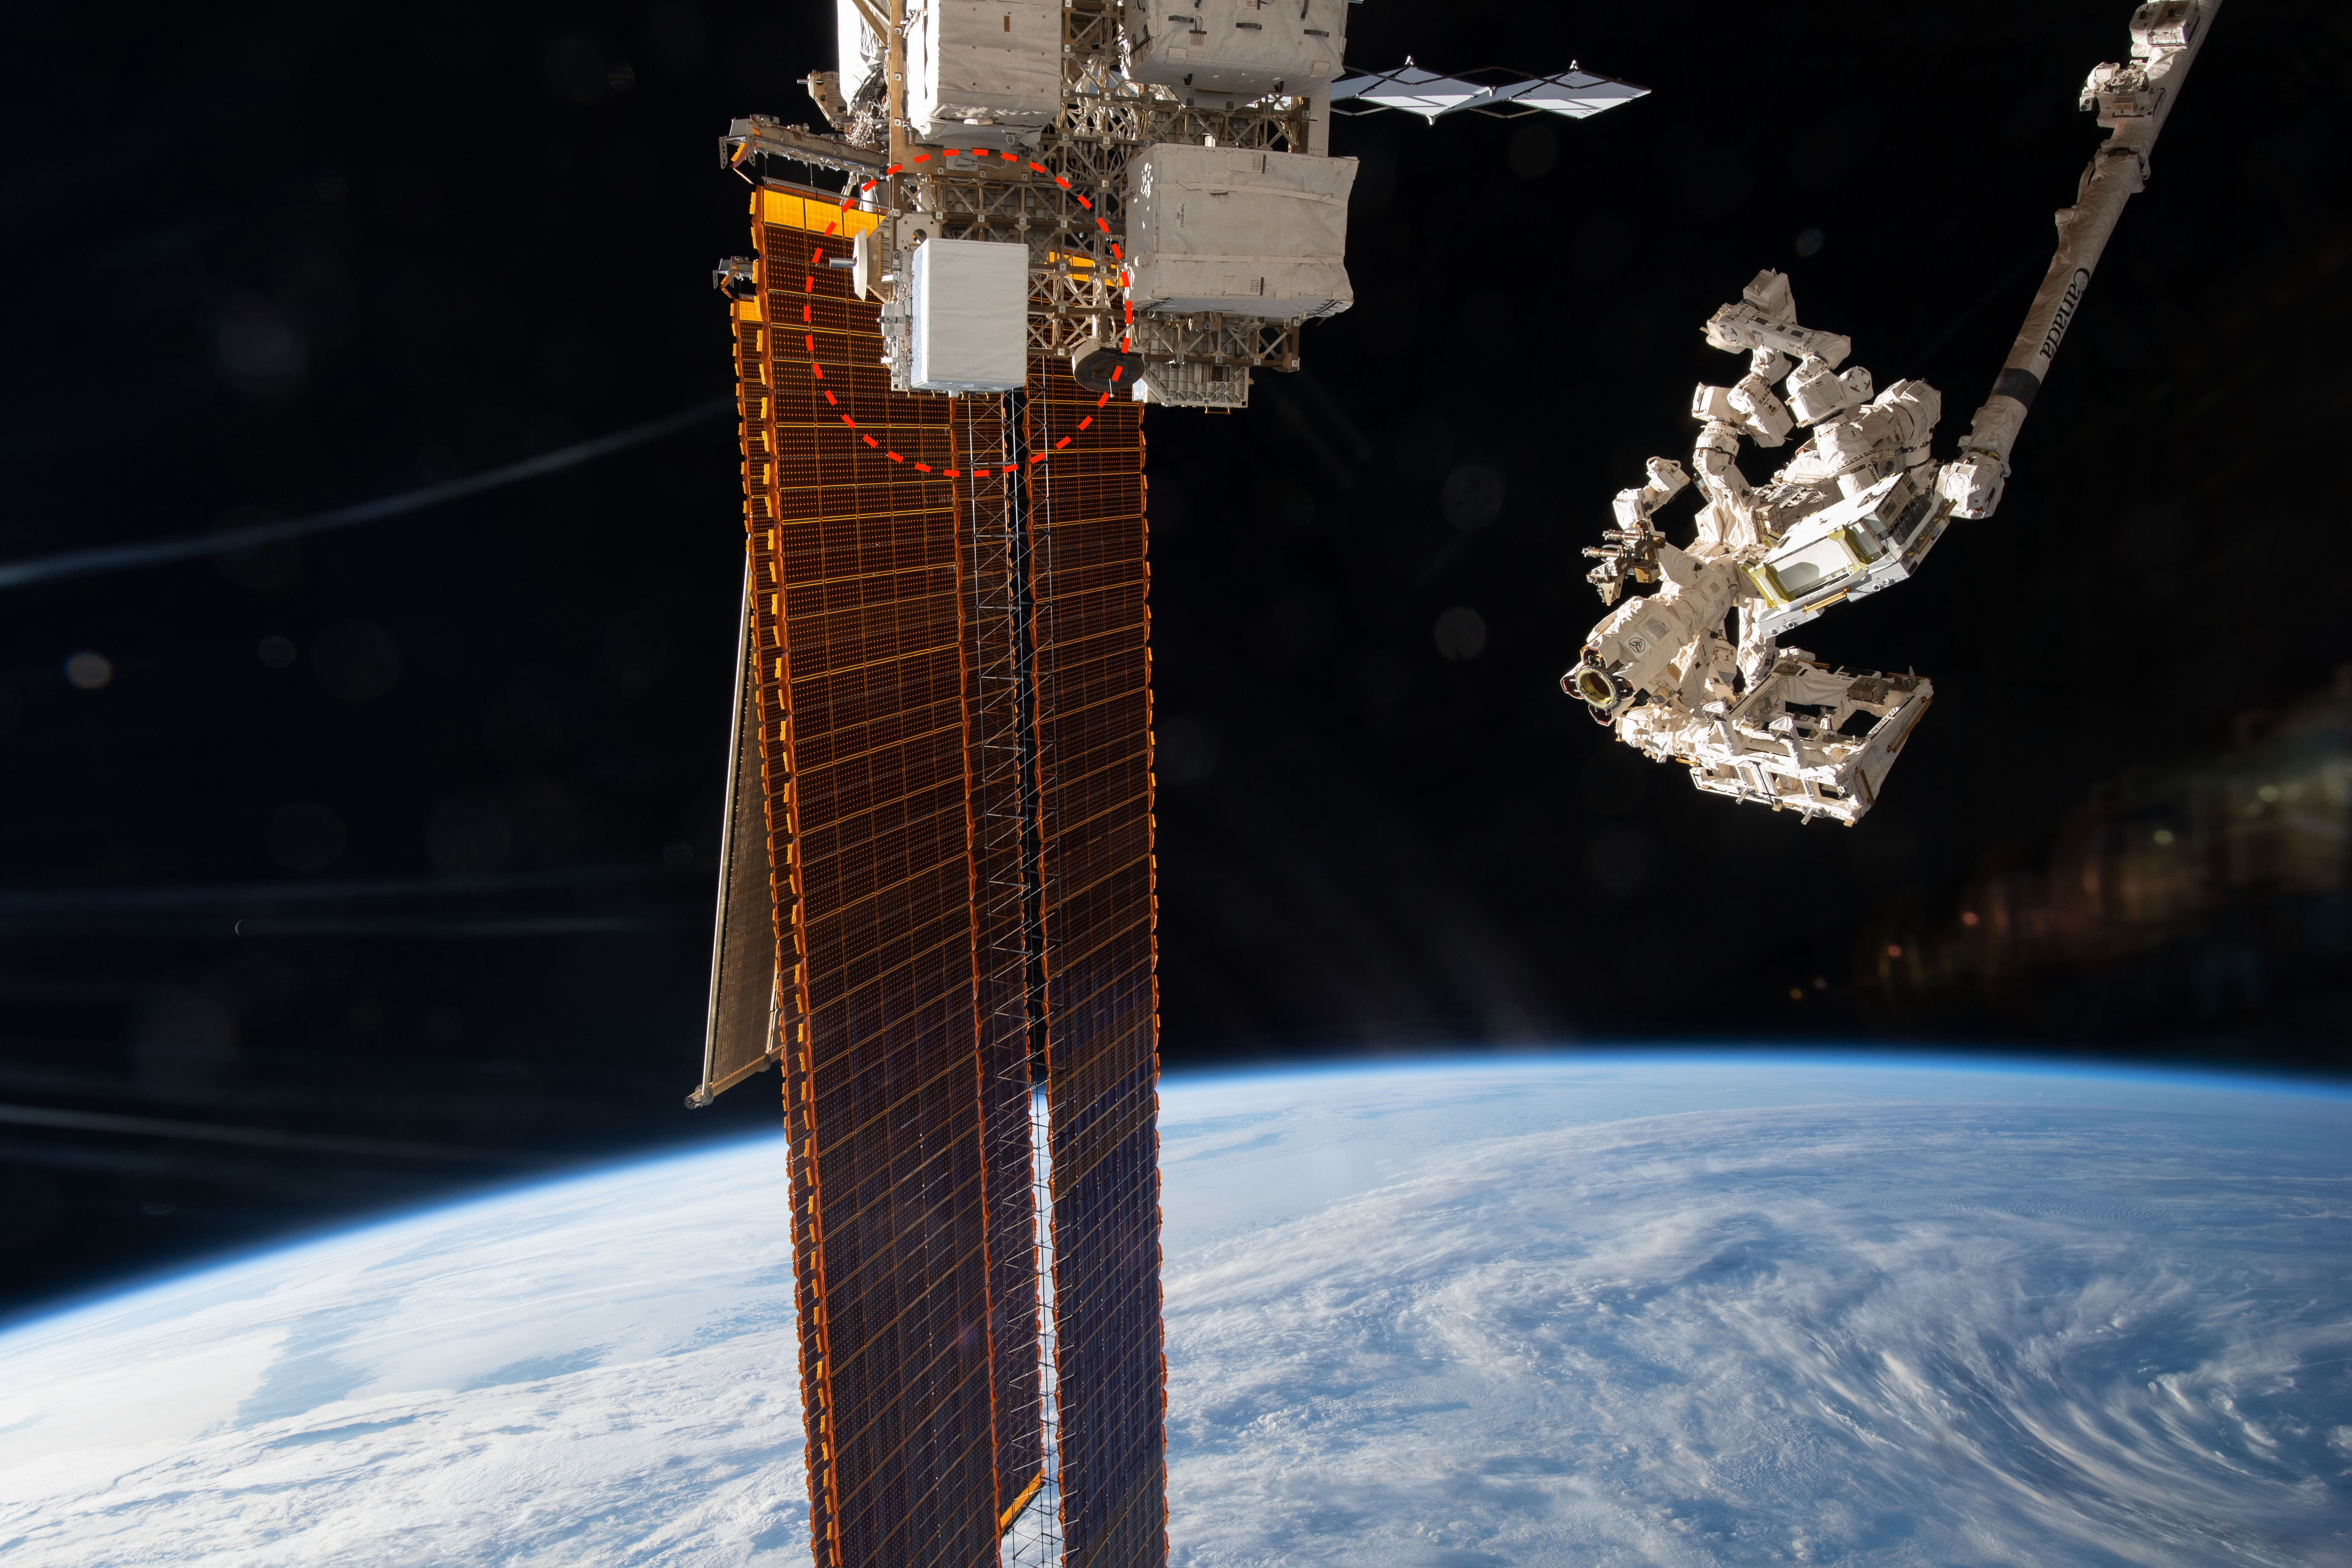
In late 2025, scientists reported that, for the first time, they were able to detect concentrations of plastic pollution on land using NASA’s Earth Surface Mineral Dust Source Investigation (EMIT) sensor aboard the International Space Station. The technology has inspired marine researchers to see whether it could also help track debris in our waters.
Before future generations of sensors like EMIT can be called upon to detect ocean litter, scientists need to know what to look for. Working with collaborators, NASA intern Ashley Ohall has built a newly published reference library containing nearly 25,000 molecular “fingerprints” from all manner of flotsam and jetsam, including rope, tires, metal, bubble wrap, buoys, and bottle caps. Given the overwhelming presence of plastic in marine debris, the library includes some 19 types of polymer.
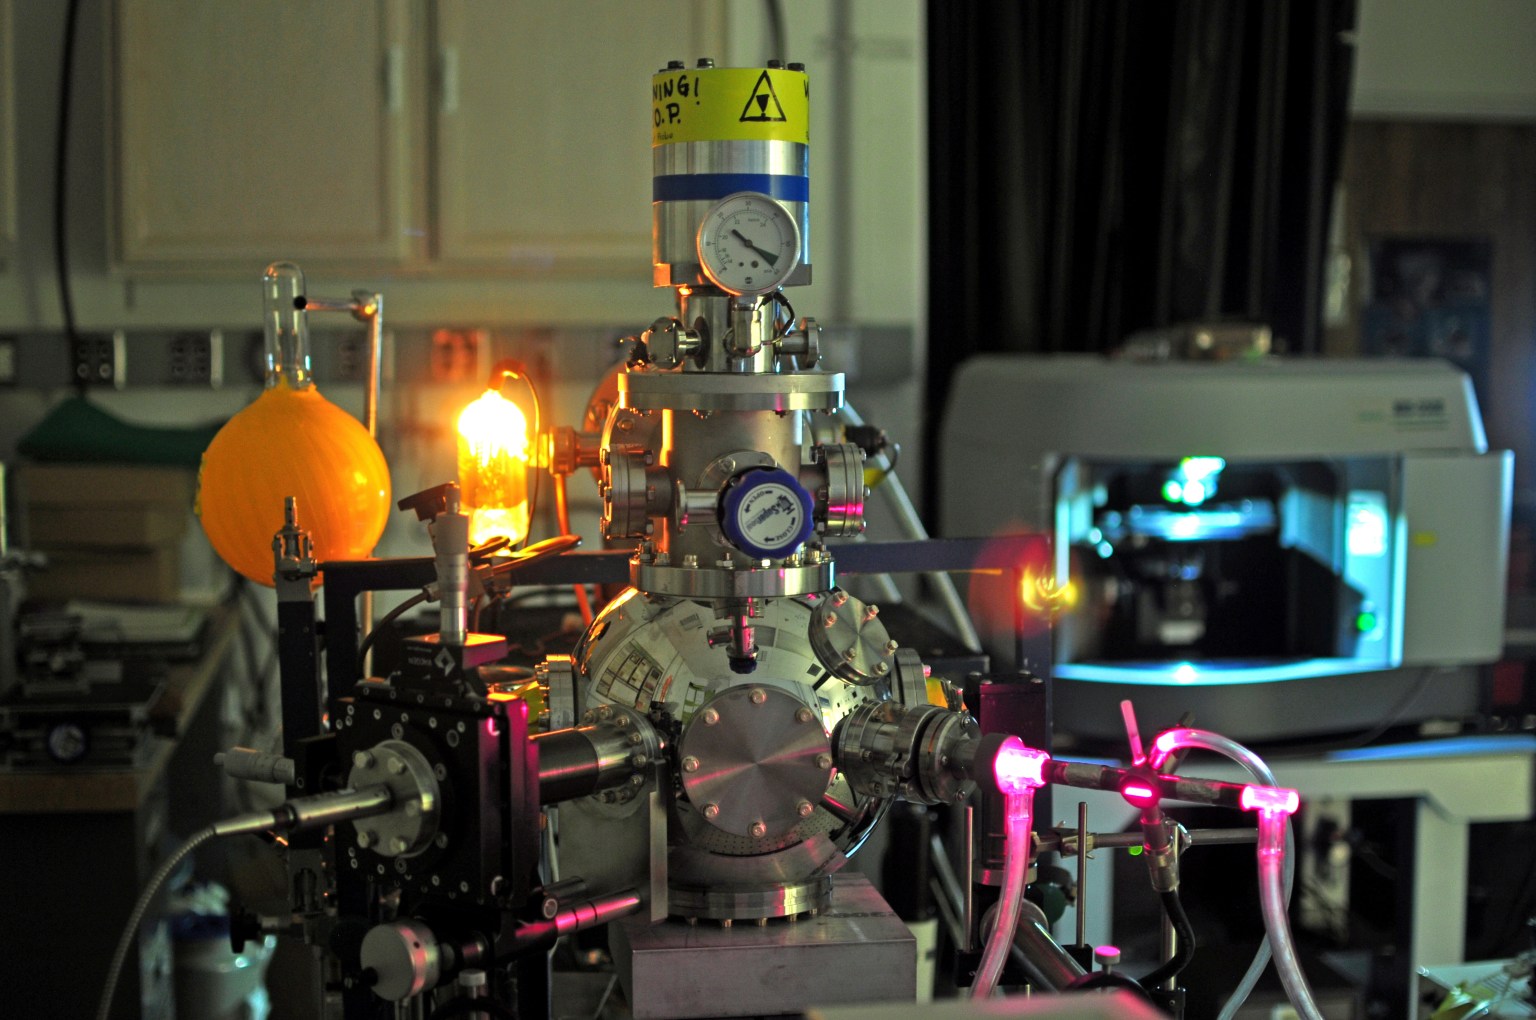
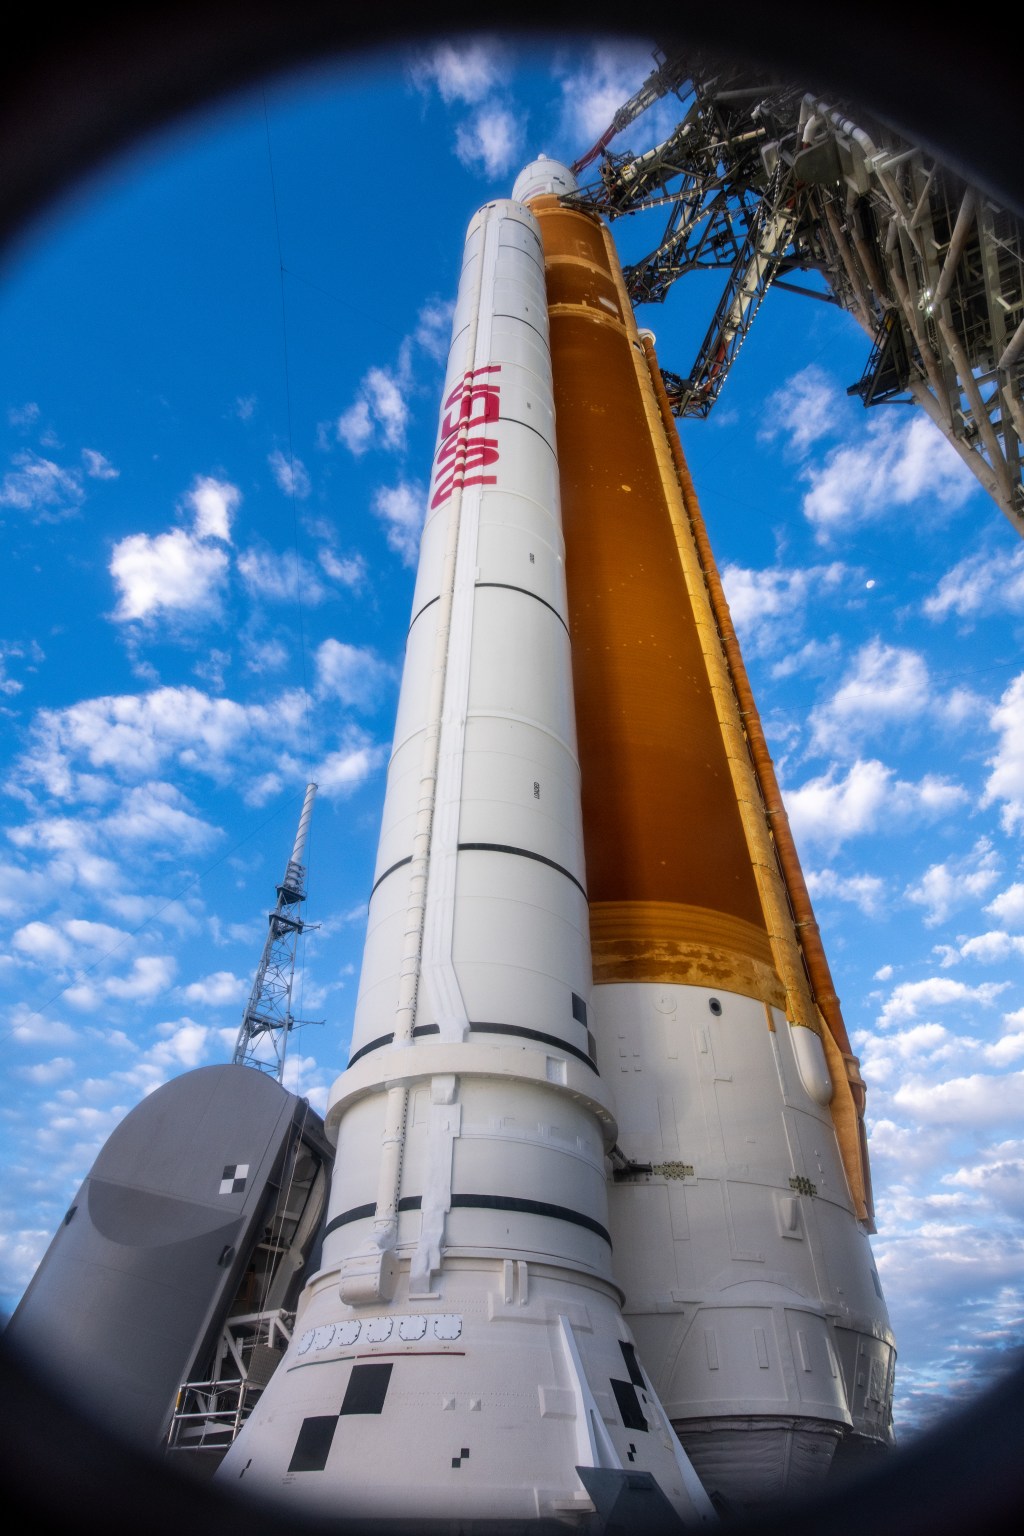
NASA’s EMIT, shown in the red circle, was launched to the International Space Station in 2022 to map minerals. Its data is now advancing fields from agriculture to water science.
NASA
Most of the estimated 8 million tons or more of plastic that enter the ocean every year comes from land, so mapping pollution hot spots near coastlines could be a first step toward reducing what ends up on beaches and washed out to sea. That’s exactly what NASA’s sensor showed it could do, though detecting plastic wasn’t its first mission. Launched in 2022, EMIT maps minerals across desert regions to help determine how the dust can heat or cool the atmosphere.
But the instrument has proved itself incredibly nimble. From its perch on the space station, it can identify hundreds of compounds on Earth via the unique spectral patterns they make in reflected sunlight. The technology behind EMIT, called imaging spectroscopy, was pioneered at NASA’s Jet Propulsion Laboratory in Southern California and is used on missions throughout the solar system. One of EMIT’s cousins discovered lunar water in 2009, and another is set to return to the Moon to help future astronauts identify scientifically valuable areas to sample.
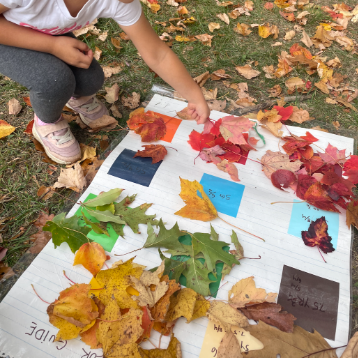
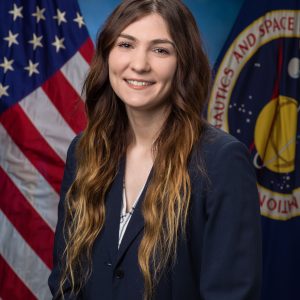
Marine scientist Ashley Ohall checked out aircraft at NASA’s Langley Research Center in Hampton, Virginia, during her recent internship with the agency in which she led the creation of a spectral library containing nearly 25,000 molecular “fingerprints” from all manner of debris.
Kelsey Bisson
The same technology has now shown that it can find plastic compounds in landfills and large-scale structures like greenhouses, said JPL’s David Thompson, who coauthored the 2025 study. However, detecting plastic once it enters the ocean is more challenging: Seawater absorbs infrared light, masking many of plastic’s prominent spectral features.
Litter library
That’s where the work of Ohall and her collaborators comes in. Their open-source library compiles the work of many researchers over the years who’ve analyzed marine debris using handheld instruments in laboratories. Standardizing the various datasets into one searchable repository is crucial because different kinds of debris have slightly different spectra based on material, color, and condition. Weathered water bottles, for example, “look” different than washed-up hurricane detritus. Once the patterns are known, detection algorithms can be developed.
Carried by ocean currents, debris can travel thousands of miles from the source, so a better understanding of where it is and where it’s headed could be a boon for public health and coastal tourism, said Ohall, a Florida native who recently graduated from the University of Georgia.
“My biggest hope is that people see remote sensing as an important and useful tool for marine debris monitoring,” Ohall said. “Just because it hasn’t been done yet doesn’t mean it can’t be done.”
Planet-scale challenge
Conventional methods for quantifying plastic in the ocean — including dragging nets through garbage patches — can’t sample the millions of tons that flow in. With NASA’s support, scientists are learning more about the ability of existing sensors as well as what’s still needed to spot marine debris. Teams are also training AI tools to sift through satellite imagery.
It remains a planet-scale endeavor, said Kelsey Bisson, a program manager at NASA Headquarters in Washington. The groundwork being done by Ohall and other scientists brings us a step closer to leveraging a powerful technology flying in air and space today.
“Humans have a visceral connection to the ocean and its health,” Bisson said. “Detecting marine debris is the kind of incredible challenge that NASA can help solve.”
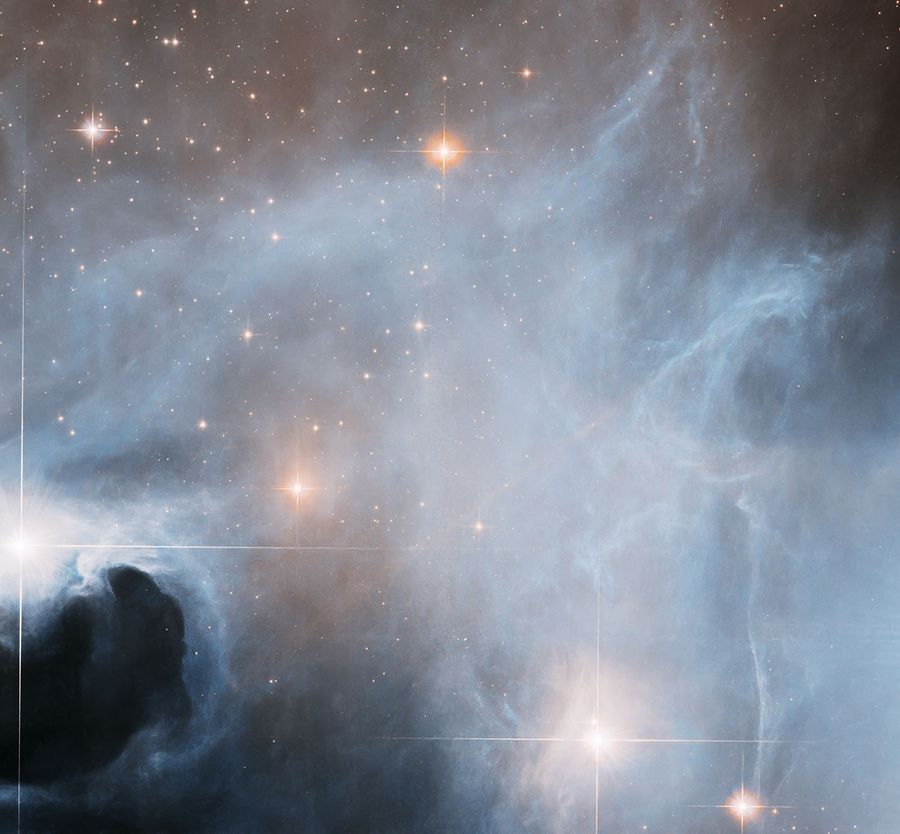
A seemingly serene landscape of gas and dust is hopping with star formation behind the scenes.
NASA, ESA, and K. Stapelfeldt (Jet Propulsion Laboratory); Processing: Gladys Kober (NASA/Catholic University of America)
While this eerie NASA Hubble Space Telescope image may look ghostly, it’s actually full of new life. Lupus 3 is a star-forming cloud about 500 light-years away in the constellation Scorpius.
White wisps of gas swirl throughout the region, and in the lower-left corner resides a dark dust cloud. Bright T Tauri stars shine at the left, bottom right, and upper center, while other young stellar objects dot the image.
T Tauri stars are actively forming stars in a specific stage of formation. In this stage, the enveloping gas and dust dissipates from radiation and stellar winds, or outflows of particles from the emerging star. T Tauri stars are typically less than 10 million years old and vary in brightness both randomly and periodically due to the environment and nature of a forming star. The random variations may be due to instabilities in the accretion disk of dust and gas around the star, material from that disk falling onto the star and being consumed, and flares on the star’s surface. The more regular, periodic changes may be caused by giant sunspots rotating in and out of view.
T Tauri stars are in the process of contracting under the force of gravity as they become main sequence stars which fuse hydrogen to helium in their cores. Studying these stars can help astronomers better understand the star formation process.
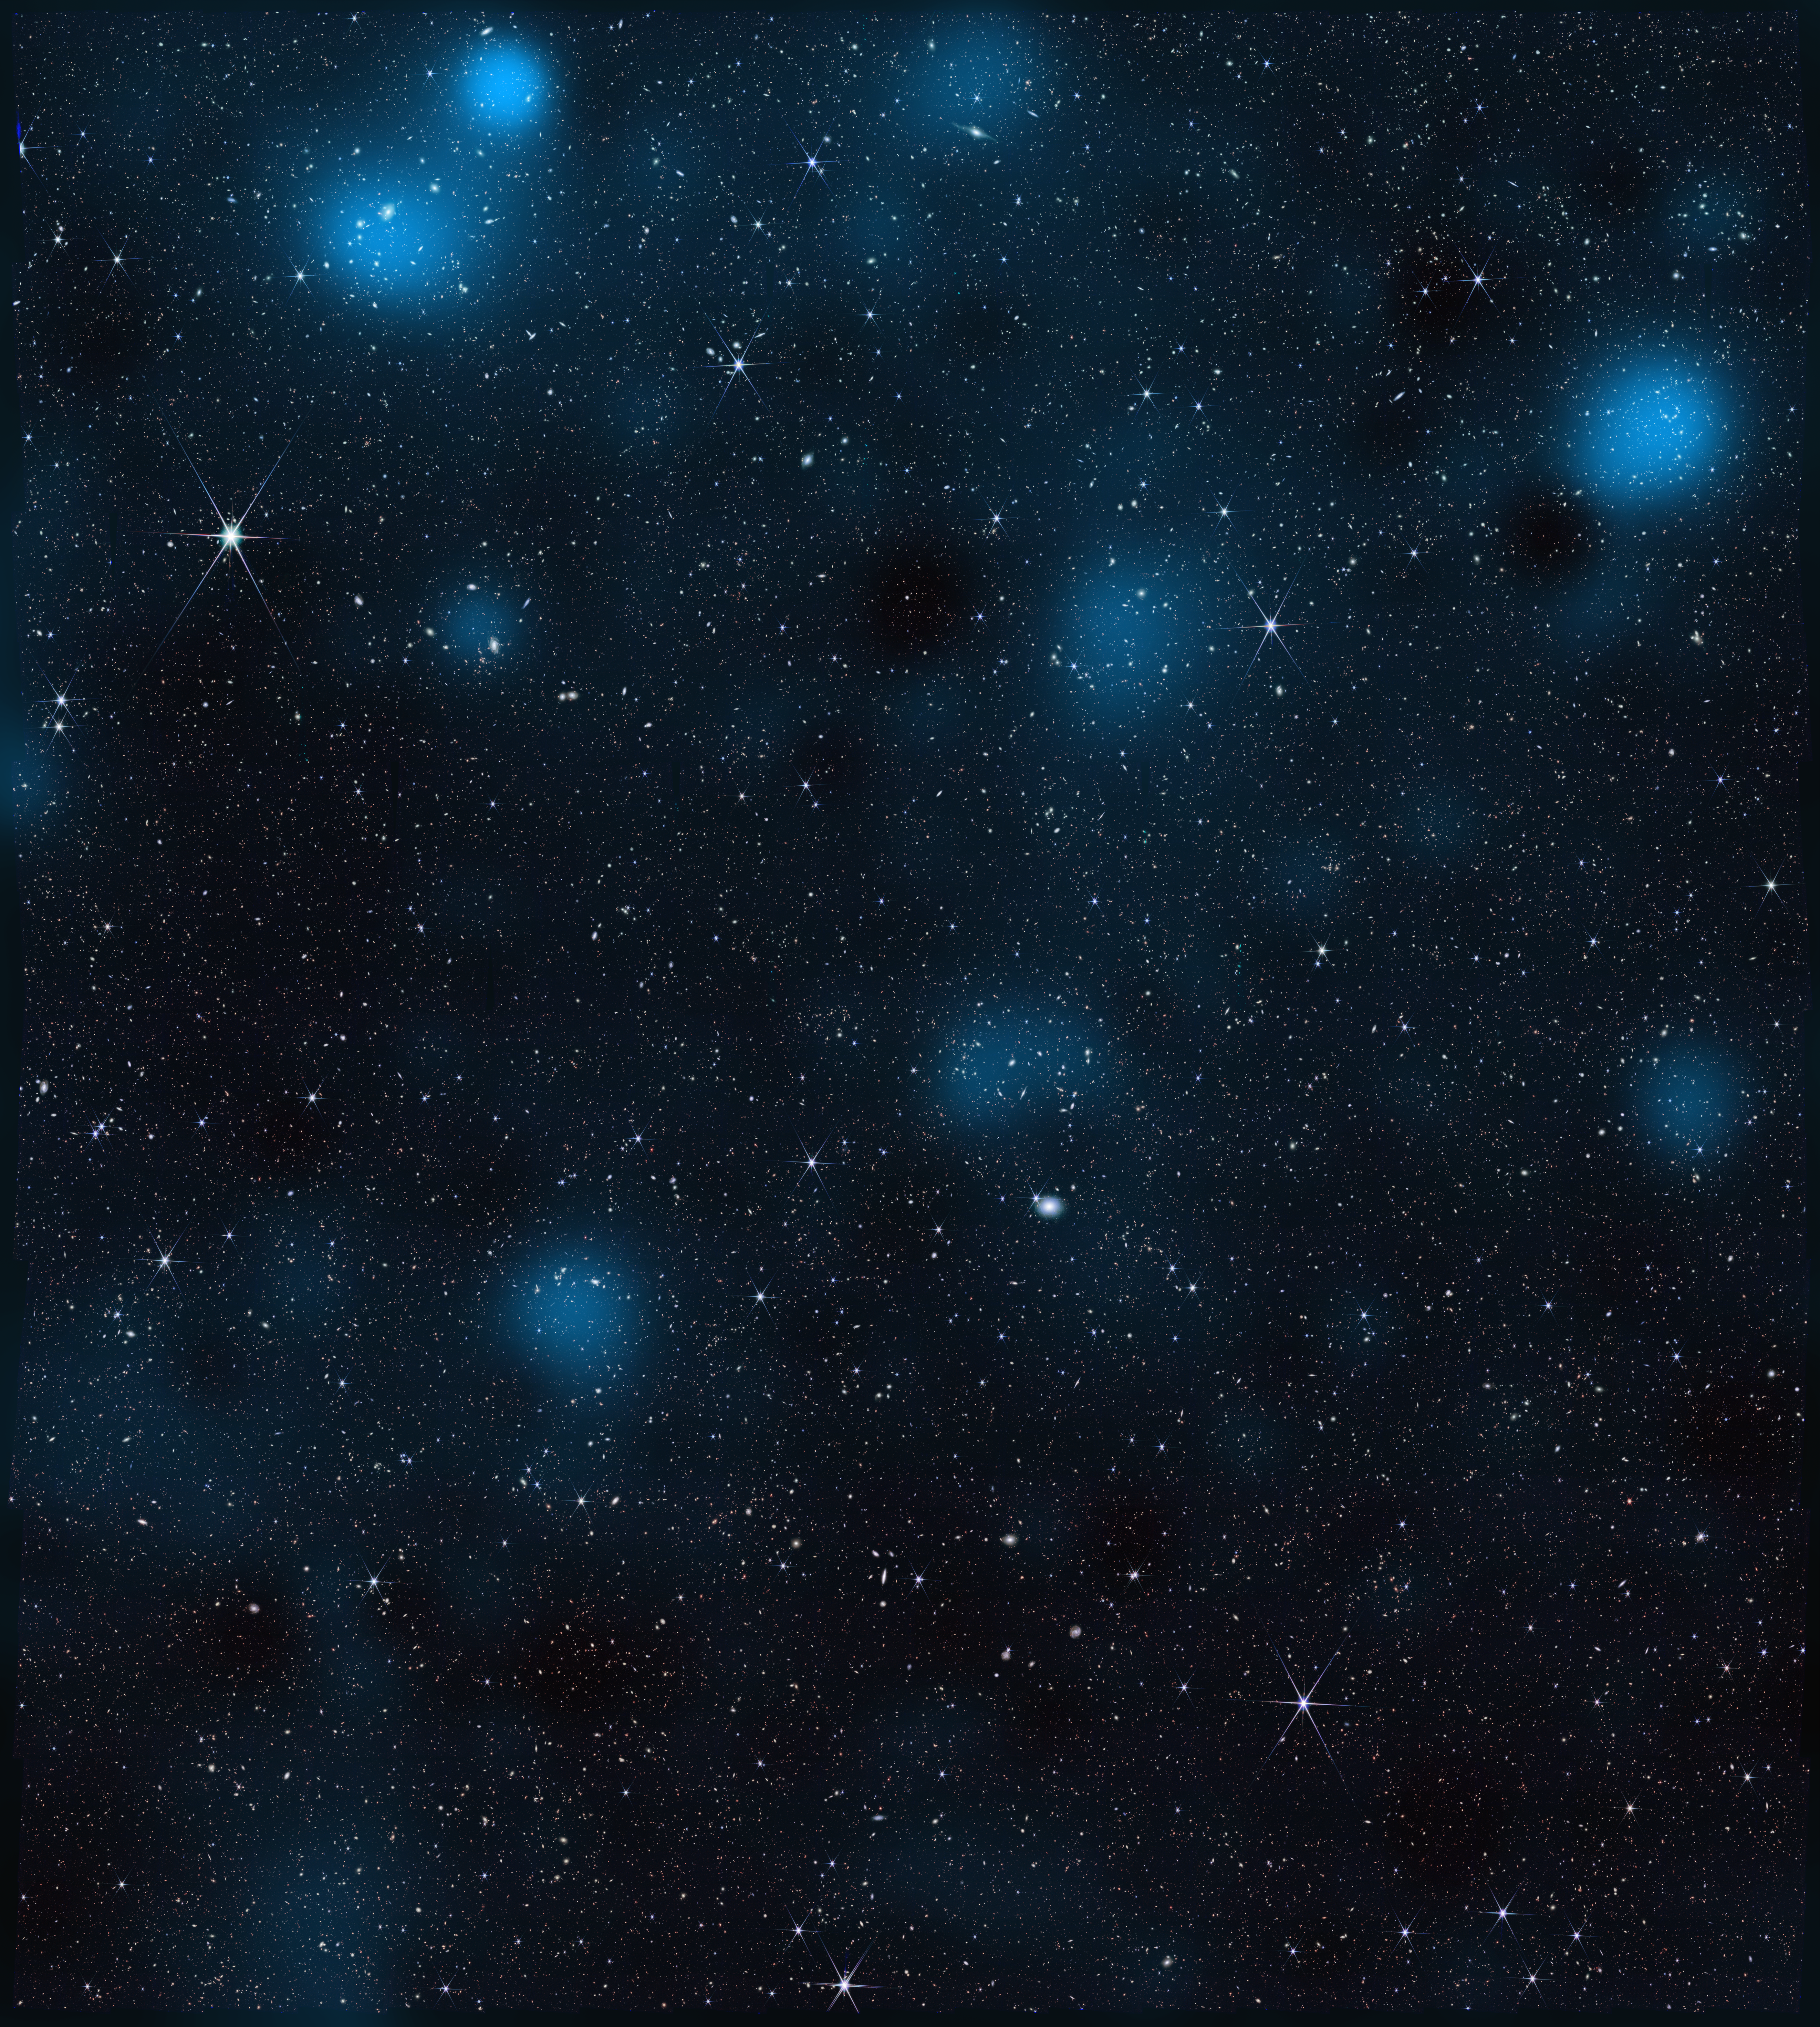
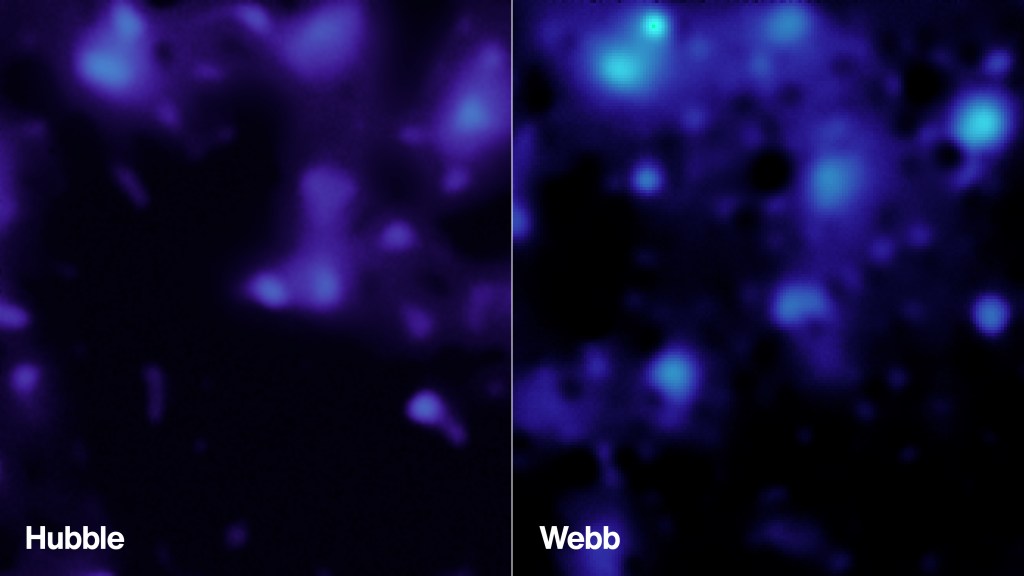
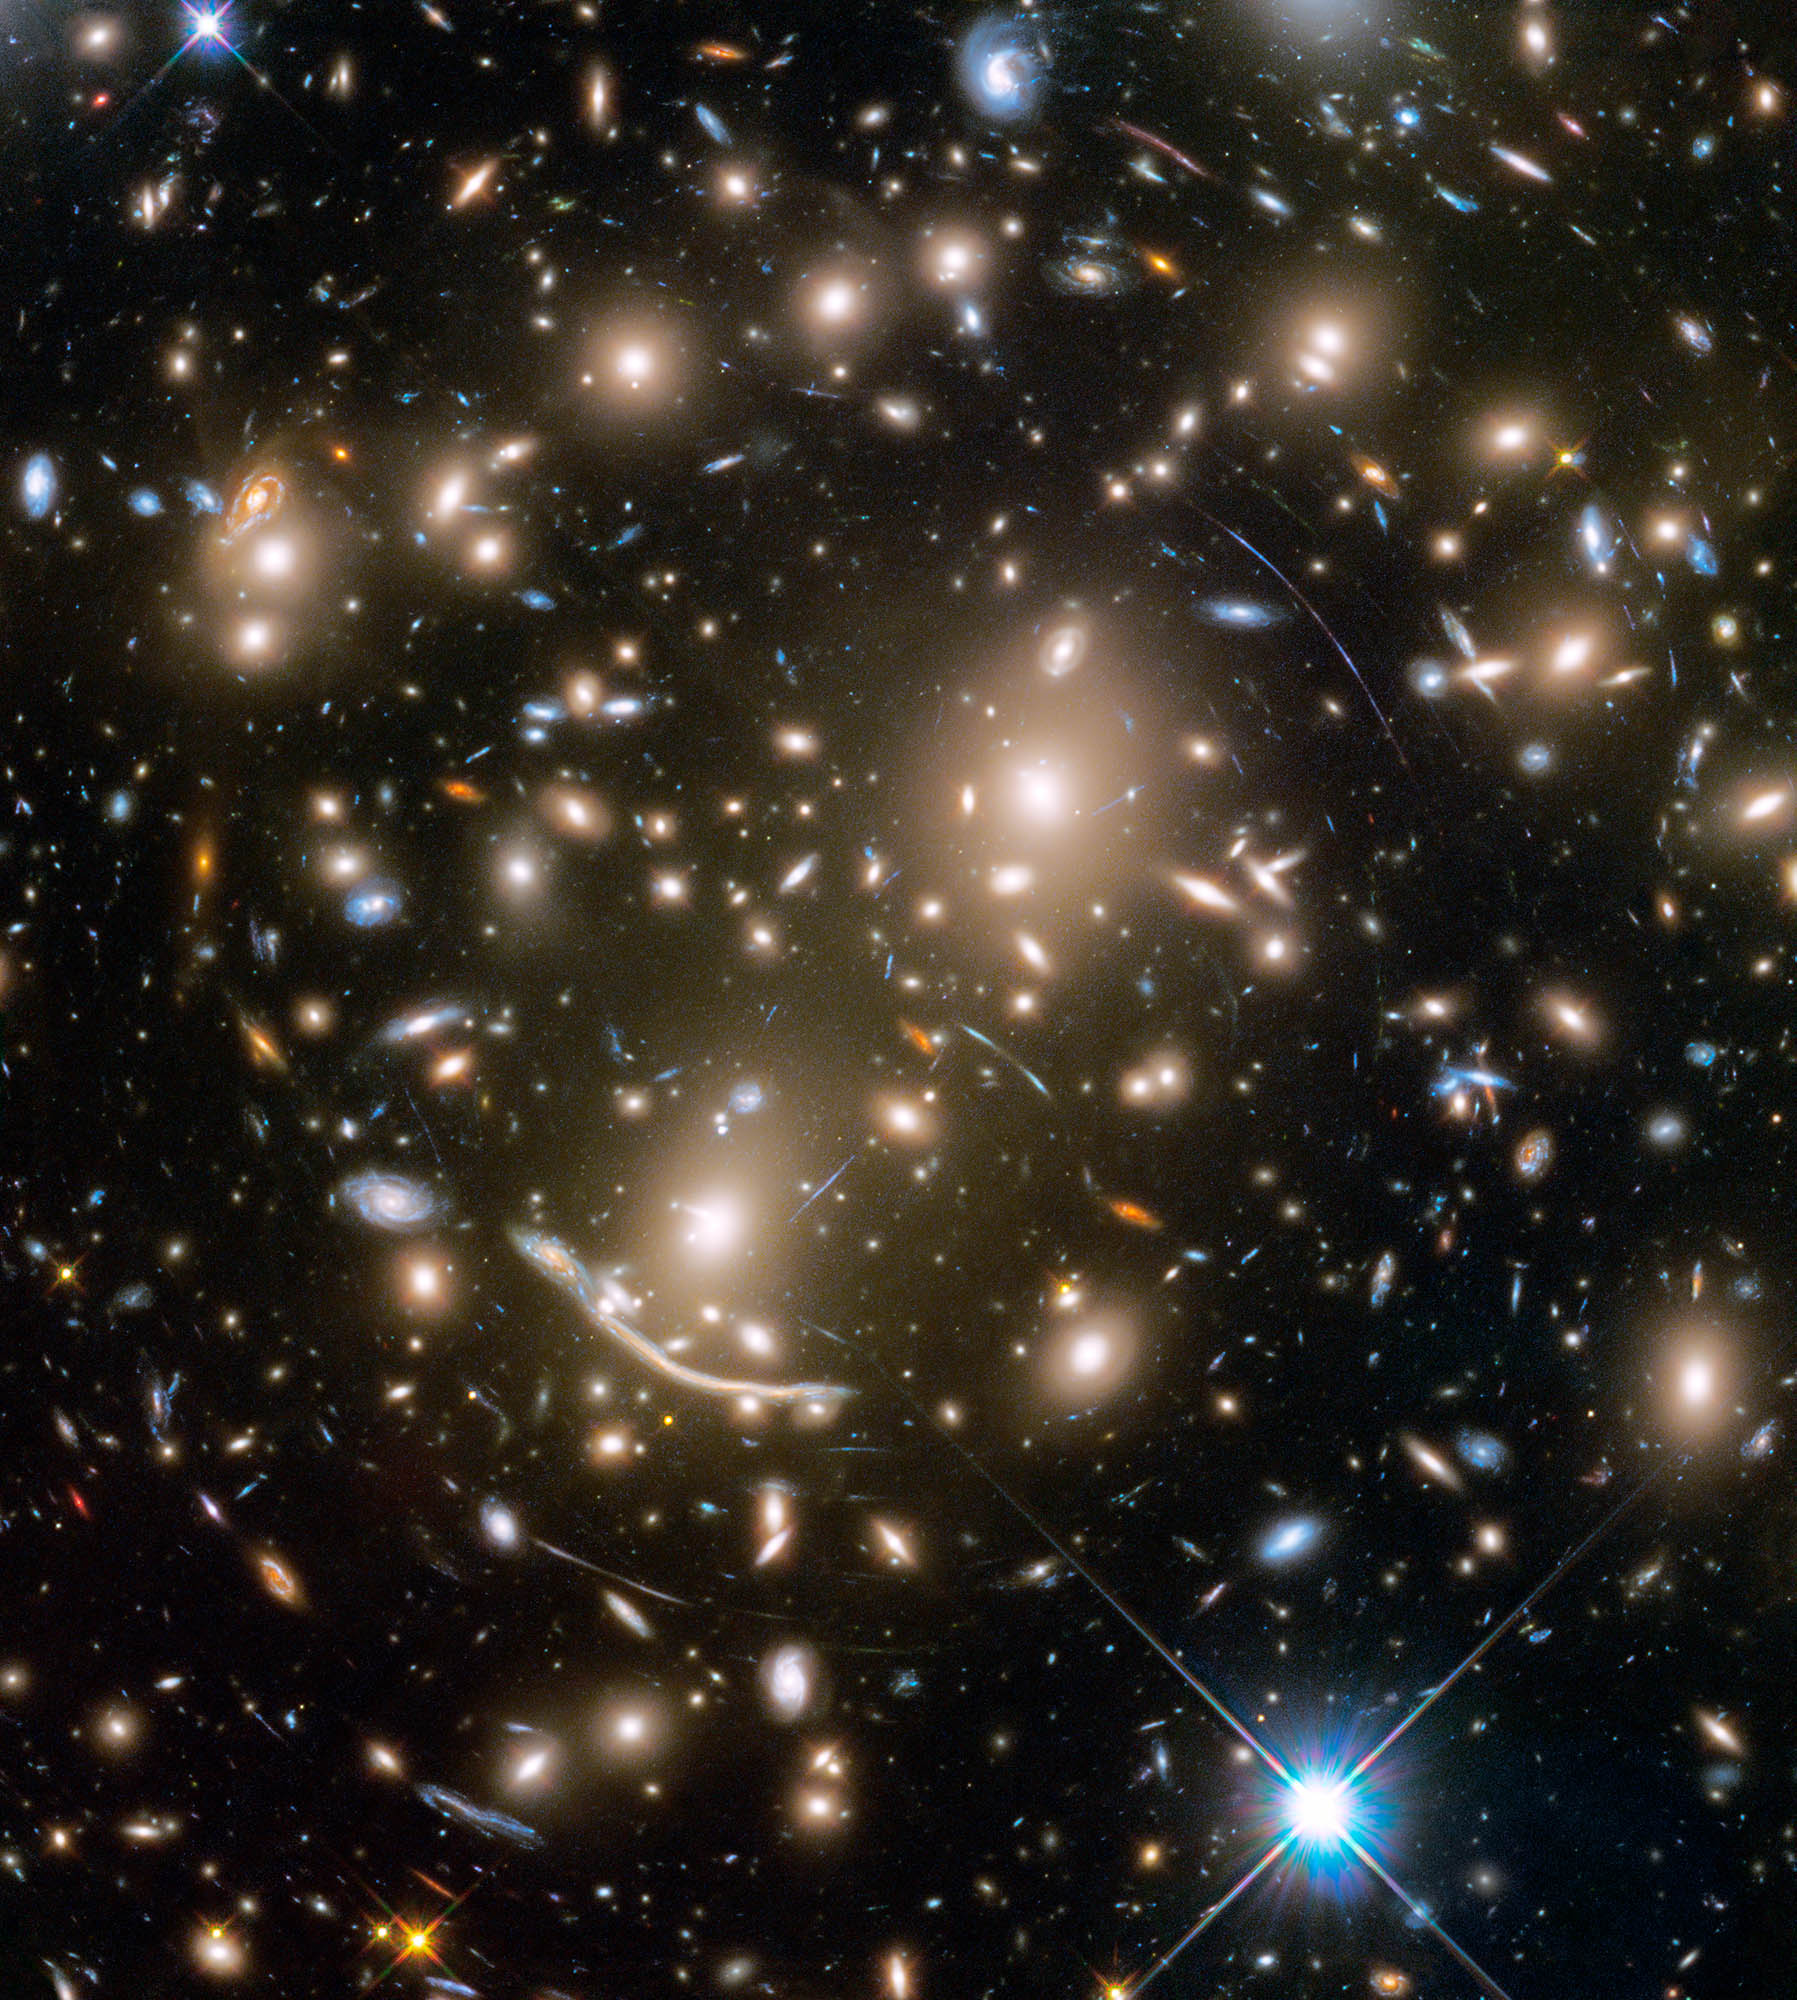
Containing nearly 800,000 galaxies, this image from NASA’s James Webb Space Telescope is overlaid with a map of dark matter, represented in blue. Researchers used Webb data to find the invisible substance via its gravitational influence on regular matter.
NASA/STScI/J. DePasquale/A. Pagan
With the Webb telescope’s unprecedented sensitivity, scientists are learning more about dark matter’s influence on stars, galaxies, and even planets like Earth.
Scientists using data from NASA’s James Webb Space Telescope have made one of the most detailed, high-resolution maps of dark matter ever produced. It shows how the invisible, ghostly material overlaps and intertwines with “regular” matter, the stuff that makes up stars, galaxies, and everything we can see.
Published Monday, Jan. 26, in Nature Astronomy, the map builds on previous research to provide additional confirmation and new details about how dark matter has shaped the universe on the largest scales — galaxy clusters millions of light-years across — that ultimately give rise to galaxies, stars, and planets like Earth.
“This is the largest dark matter map we’ve made with Webb, and it’s twice as sharp as any dark matter map made by other observatories,” said Diana Scognamiglio, lead author of the paper and an astrophysicist at NASA’s Jet Propulsion Laboratory in Southern California. “Previously, we were looking at a blurry picture of dark matter. Now we’re seeing the invisible scaffolding of the universe in stunning detail, thanks to Webb’s incredible resolution.”
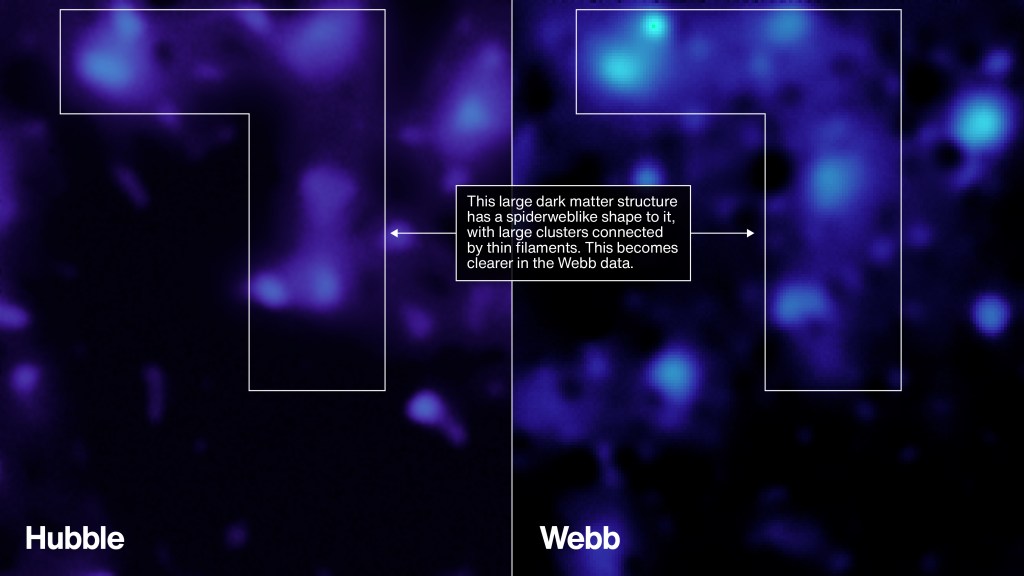
Created using data from NASA’s Webb telescope in 2026 (right) and from the Hubble Space Telescope in 2007 (left), these images show the presence of dark matter in the same region of sky. Webb’s higher resolution is providing new insights into how this invisible component influences the distribution of ordinary matter in the universe.
NASA/STScI/A. Pagan
Dense regions of dark matter are connected by lower-density filaments, forming a weblike structure known as the cosmic web. This pattern appears more clearly in the Webb data than in the earlier Hubble image. Ordinary matter, including galaxies, tends to trace this same underlying structure shaped by dark matter.
NASA/STScI/A. Pagan
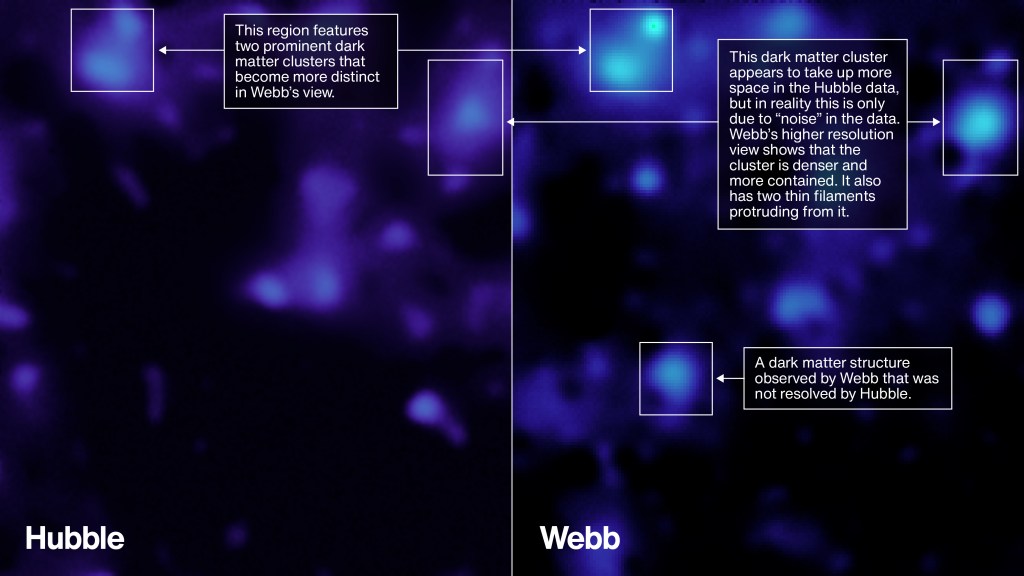
Some dark matter structures appear smaller in the Webb data because they are coming into sharper focus. Webb’s higher resolution also makes it possible to better confine the size and location of the dark matter clusters in the lower left of the image.
NASA/STScI/A. Pagan
Dark matter doesn’t emit, reflect, absorb, or even block light, and it passes through regular matter like a ghost. But it does interact with the universe through gravity, something the map shows with a new level of clarity. Evidence for this interaction lies in the degree of overlap between dark matter and regular matter. According to the paper’s authors, Webb’s observations confirm that this close alignment can’t be a coincidence but, rather, is due to dark matter’s gravity pulling regular matter toward it throughout cosmic history.
“Wherever we see a big cluster of thousands of galaxies, we also see an equally massive amount of dark matter in the same place. And when we see a thin string of regular matter connecting two of those clusters, we see a string of dark matter as well,” said Richard Massey, an astrophysicist at Durham University in the United Kingdom and a coauthor of the new study. “It’s not just that they have the same shapes. This map shows us that dark matter and regular matter have always been in the same place. They grew up together.”
Closer look
Found in the constellation Sextans, the area covered by the new map is a section of sky about 2.5 times larger than the full Moon. A global community of scientists have observed this region with at least 15 ground- and space-based telescopes for the Cosmic Evolution Survey (COSMOS). Their goal: to precisely measure the location of regular matter here and then compare it to the location of dark matter. The first dark matter map of the area was made in 2007 using data from NASA’s Hubble Space Telescope, a project led by Massey and JPL astrophysicist Jason Rhodes, a coauthor of the paper.
Webb peered at this region for a total of about 255 hours and identified nearly 800,000 galaxies, some of which were detected for the first time. Scognamiglio and her colleagues then looked for dark matter by observing how its mass curves space itself, which in turn bends the light traveling to Earth from distant galaxies. When observed by researchers, it’s as if the light of those galaxies has passed through a warped windowpane.
The Webb map contains about 10 times more galaxies than maps of the area made by ground-based observatories and twice as many as Hubble’s. It reveals new clumps of dark matter and captures a higher-resolution view of the areas previously seen by Hubble.
When the universe began, regular matter and dark matter were probably sparsely distributed. Scientists think dark matter began to clump together first and that those dark matter clumps then pulled together regular matter, creating regions with enough material for stars and galaxies to begin to form.
In this way, dark matter determined the large-scale distribution of galaxies in the universe. And by prompting galaxy and star formation to begin earlier than they would have otherwise, dark matter’s influence also played a role in creating the conditions for planets to eventually form. That’s because the first generations of stars were responsible for turning hydrogen and helium — which made up the vast majority of atoms in the early universe — into the rich array of elements that now compose planets like Earth. In other words, dark matter provided more time for complex planets to form.
“This map provides stronger evidence that without dark matter, we might not have the elements in our galaxy that allowed life to appear,” said Rhodes. “Dark matter is not something we encounter in our everyday life on Earth, or even in our solar system, but it has definitely influenced us.”
Scognamiglio and some of her coauthors will also map dark matter with NASA’s upcoming Nancy Grace Roman Space Telescope over an area 4,400 times bigger than the COSMOS region. Roman’s primary science goals include learning more about dark matter’s fundamental properties and how they may or may not have changed over cosmic history. But Roman’s maps won’t beat Webb’s spatial resolution. More detailed looks at dark matter will be possible only with a next-generation telescope like the Habitable Worlds Observatory, NASA’s next astrophysics flagship concept.
More about Webb
The James Webb Space Telescope is solving mysteries in our solar system, looking beyond to distant worlds around other stars, and probing the mysterious structures and origins of our universe and our place in it. Webb is an international program led by NASA with its partners, ESA (European Space Agency) and CSA (Canadian Space Agency).
NASA’s SpaceX Crew-12 crew, from left to right, is NASA astronauts Jessica Meir and Jack Hathaway, ESA (European Space Agency) astronaut Sophie Adenot, and Roscosmos cosmonaut Andrey Fedyaev.
Credit: SpaceX
NASA and its partners will discuss the upcoming crew rotation to the International Space Station during a pair of news conferences on Friday, Jan. 30, from the agency’s Johnson Space Center in Houston.
At 11 a.m. EST, mission leadership will discuss final launch and mission preparations in a news conference that will stream on the agency’s YouTube channel.
Next, the crew of NASA’s SpaceX Crew-12 mission will participate in a virtual news conference from NASA Johnson crew quarters at 1 p.m., also on the agency’s YouTube channel. Individual streams for each of the events will be available on that page. This is the final media opportunity with Crew-12 before they travel to NASA’s Kennedy Space Center in Florida for launch.
Crew-12 will carry NASA astronauts Jessica Meir and Jack Hathaway, ESA (European Space Agency) astronaut Sophie Adenot, and Roscosmos cosmonaut Andrey Fedyaev to the orbiting laboratory. The crew will launch aboard a SpaceX Dragon spacecraft on the company’s Falcon 9 rocket from Space Launch Complex 40 at Cape Canaveral Space Force Station in Florida. The agency is working with SpaceX and its international partners to review options to advance the launch of Crew-12 from its original target date of Sunday, Feb. 15.
United States-based media interested in attending in person must contact the NASA Johnson newsroom no later than 5 p.m. CST on Thursday, Jan. 29, at 281-483-5111 or jsccommu@mail.nasa.gov.
Media wishing to join the news conferences by phone must contact the Johnson newsroom by 9:45 a.m. on the day of the event. A copy of NASA’s media accreditation policy is available online.
Briefing participants are as follows (all times Eastern and subject to change based on real-time operations):
11 a.m.: Mission Overview News Conference
Ken Bowersox, associate administrator, NASA’s Space Operations Mission Directorate
Steve Stich, manager, Commercial Crew Program, NASA Kennedy
Dana Weigel, manager, International Space Station Program, NASA Johnson
Andreas Mogensen, Human Exploration Group Leader, ESA
This will be the second flight to the space station for Meir, who was selected as a NASA astronaut in 2013. The Caribou, Maine, native earned a bachelor’s degree in biology from Brown University, a master’s degree in space studies from the International Space University, and a doctorate in marine biology from Scripps Institution of Oceanography in San Diego. On her first spaceflight, Meir spent 205 days as a flight engineer during Expedition 61/62, and she completed the first three all-woman spacewalks with fellow NASA astronaut Christina Koch, totaling 21 hours and 44 minutes outside of the station. Since then, she has served in various roles, including assistant to the chief astronaut for commercial crew (SpaceX), deputy for the Flight Integration Division, and assistant to the chief astronaut for the human landing system.
A commander in the United States Navy, Hathaway was selected as part of the 2021 astronaut candidate class. This will be Hathaway’s first spaceflight. The South Windsor, Connecticut, native holds a bachelor’s degree in physics and history from the U.S. Naval Academy and master’s degrees in flight dynamics from Cranfield University and national security and strategic studies from the U.S. Naval War College, respectively. Hathaway also is a graduate of the Empire Test Pilot’s School, Fixed Wing Class 70 in 2011. At the time of his selection, Hathaway was deployed aboard the USS Truman, serving as Strike Fighter Squadron 81’s prospective executive officer. He has accumulated more than 2,500 flight hours in 30 different aircraft, including more than 500 carrier arrested landings and 39 combat missions.
The Crew-12 mission will be Adenot’s first spaceflight. Before her selection as an ESA astronaut in 2022, Adenot earned a degree in engineering from ISAE-SUPAERO in Toulouse, France, specializing in spacecraft and aircraft flight dynamics. She also earned a master’s degree in human factors engineering at Massachusetts Institute of Technology in Cambridge. After earning her master’s degree, she became a helicopter cockpit design engineer at Airbus Helicopters and later served as a search and rescue pilot at Cazaux Air Base from 2008 to 2012. She then joined the High Authority Transport Squadron in Villacoublay, France, and served as a formation flight leader and mission captain from 2012 to 2017. Between 2019 and 2022, Adenot worked as a helicopter experimental test pilot in Cazaux Flight Test Center with DGA (Direction Générale de l’Armement – the French Defence Procurement Agency). She has logged more than 3,000 hours flying 22 different helicopters.
This will be Fedyaev’s second long-duration stay aboard the orbiting laboratory. He graduated from the Krasnodar Military Aviation Institute in 2004, specializing in aircraft operations and air traffic organization, and earned qualifications as a pilot engineer. Prior to his selection as a cosmonaut, he served as deputy commander of an Ilyushin-38 aircraft unit in the Kamchatka Region, logging more than 600 flight hours and achieving the rank of second-class military pilot. Fedyaev was selected for the Gagarin Research and Test Cosmonaut Training Center Cosmonaut Corps in 2012 and has served as a test cosmonaut since 2014. In 2023, he flew to the space station as a mission specialist during NASA’s SpaceX Crew-6 mission, spending 186 days in orbit, as an Expedition 69 flight engineer. For his achievements, Fedyaev was awarded the title Hero of the Russian Federation and received the Yuri Gagarin Medal.
NASA has selected ADNET Systems, Inc. of Bethesda, Maryland, to provide global modeling and data assimilation support at the agency’s Goddard Space Flight Center in Greenbelt, Maryland.
The Global Modeling and Assimilation Support contract is a single-award, cost-plus-fixed-fee, indefinite-delivery/indefinite-quantity contract with a maximum ordering value of approximately $84 million with a five-year period of performance beginning March 15, 2026.
Under this contract, the contractor will be responsible for supporting and maintaining NASA Goddard’s Global Modeling and Assimilation Office’s Goddard Earth Observing System (GEOS) model and data assimilation system. Tasks include supporting the development and validation of individual model components within GEOS and the development and integration of external components like sea and land-ice models within the modeling and assimilation system.
For information about NASA and other agency programs, visit:
NASA Selects Participants to Track Artemis II Mission
A visual representation of NASA’s Artemis I mission.
Credits: NASA
NASA has selected 34 global volunteers to track the Orion spacecraft during the crewed Artemis II mission’s journey around the Moon.
The Artemis II test flight will launch NASA’s Space Launch System (SLS) rocket, carrying the Orion spacecraft and a crew of four astronauts, on a mission into deep space. The agency’s second mission in the Artemis campaign is a key step in NASA’s path toward establishing a long-term presence at the Moon and confirming the systems needed to support future lunar surface exploration and paving the way for the first crewed mission to Mars.
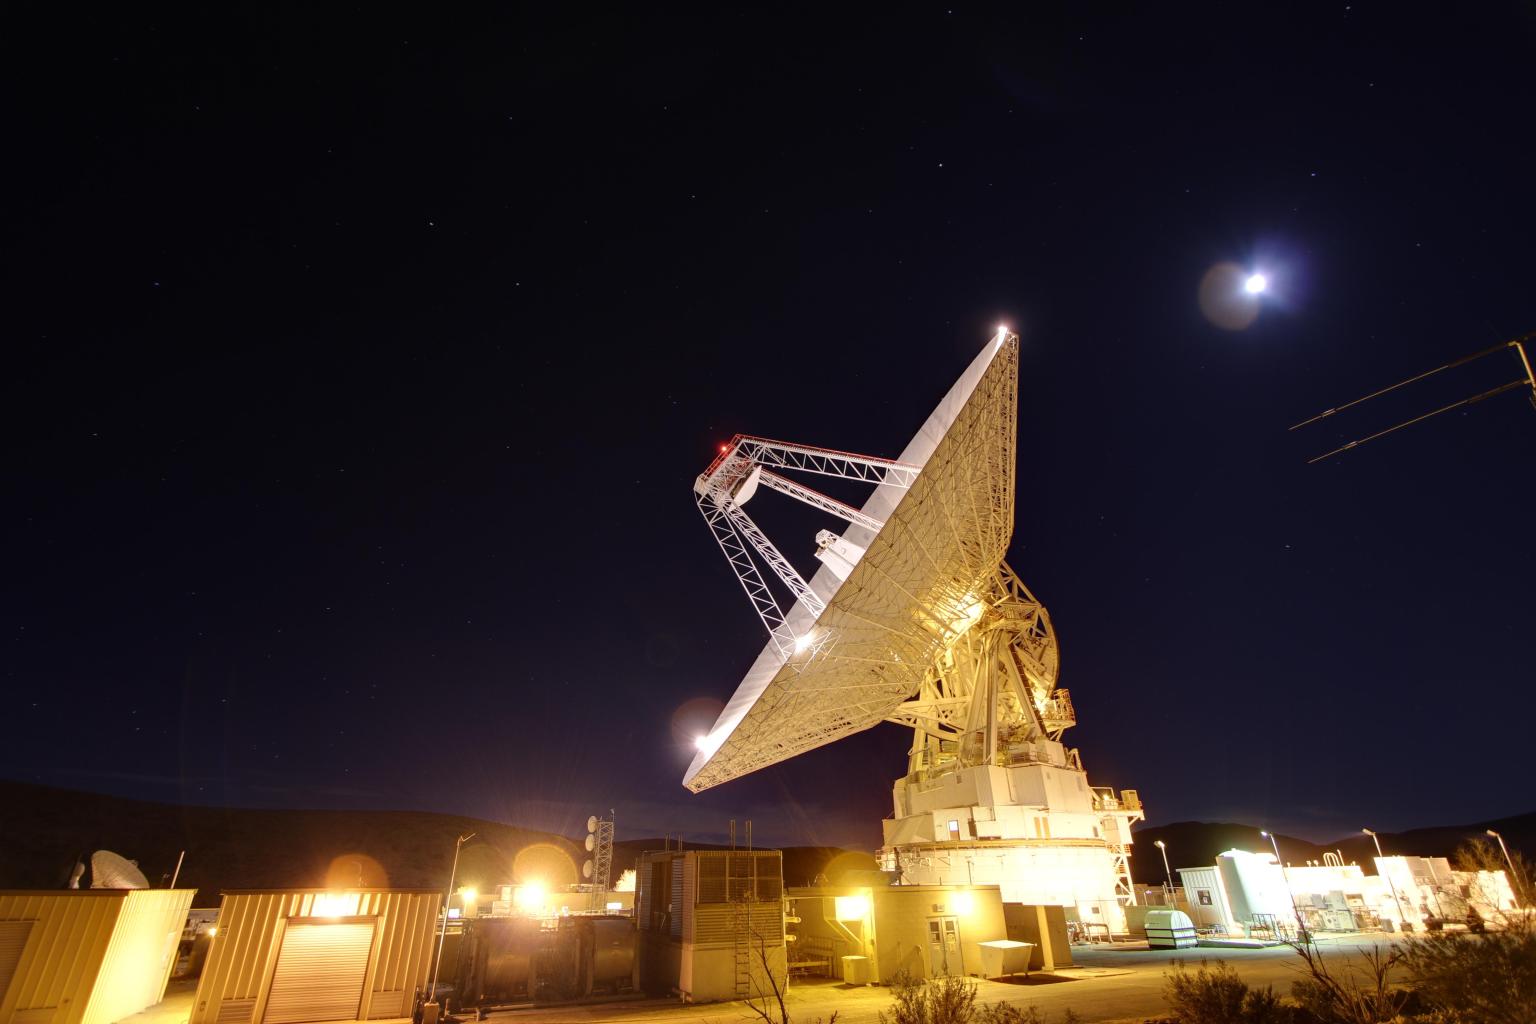
While NASA’s Near Space Network and Deep Space Network, coordinated by the agency’s SCaN (Space Communication and Navigation) program , will provide primary communications and tracking services to support Orion’s launch, journey around the Moon, and return to Earth, participants selected from a request for proposals published in August 2025, comprised of established commercial service providers, members of academia, and individual amateur radio enthusiasts will use their respective equipment to passively track radio waves transmitted by Orion during its approximately 10-day journey.
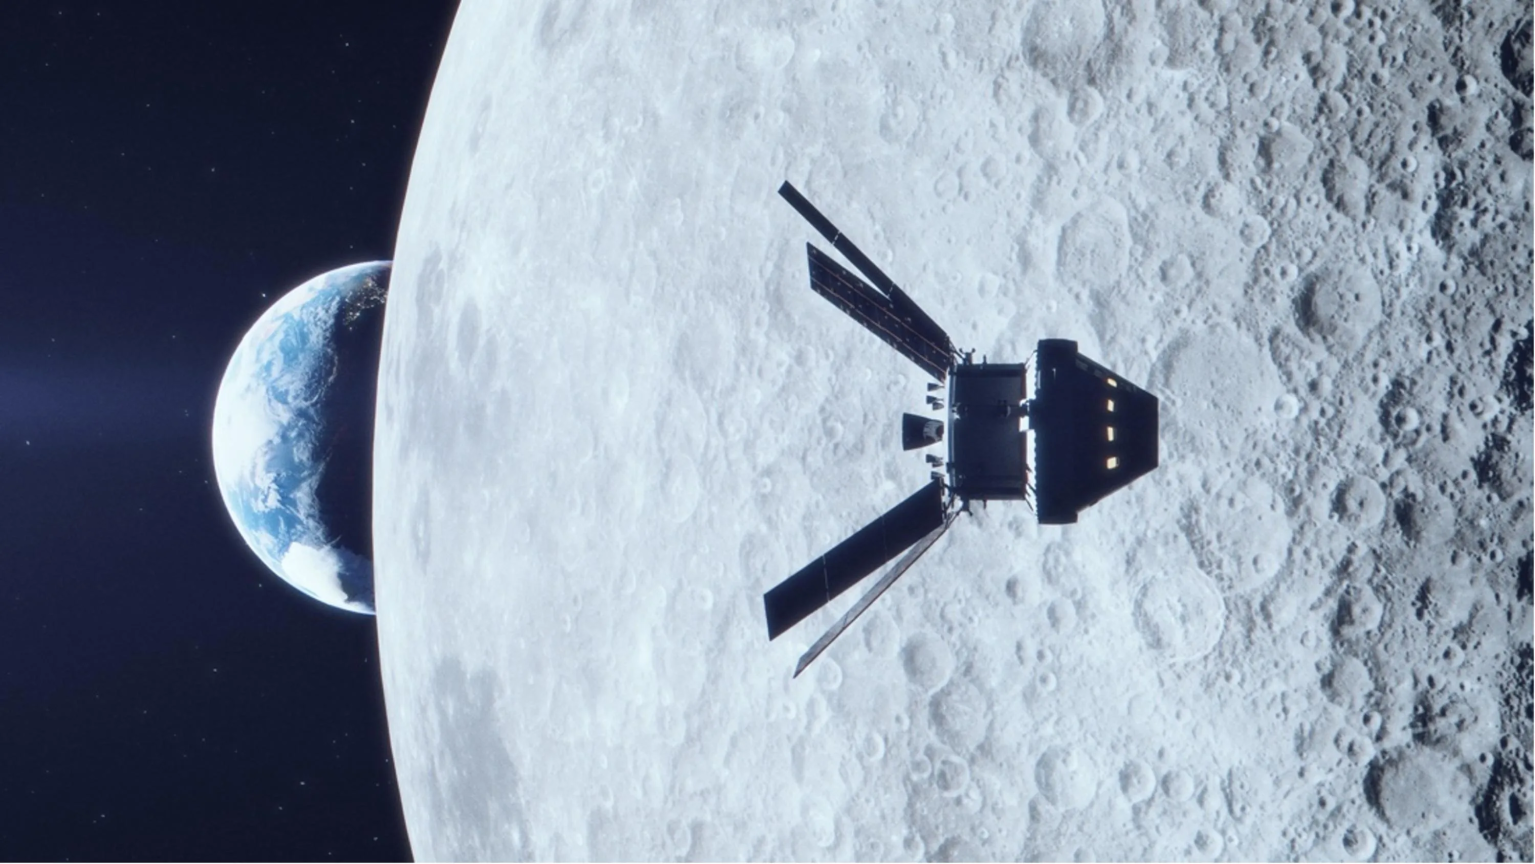
The Orion capsule viewing the Moon during Artemis I.
NASA
“The Artemis II tracking opportunity is a real step toward SCaN’s commercial-first vision. By inviting external organizations to demonstrate their capabilities during a human spaceflight mission, we’re strengthening the marketplace we’ll rely on as we explore farther into the solar system,” said Kevin Coggins, deputy associate administrator for SCaN at NASA Headquarters in Washington. “This isn’t about tracking one mission, but about building a resilient, public-private ecosystem that will support the Golden Age of innovation and exploration.”
This isn’t about tracking one mission, but about building a resilient, public-private ecosystem that will support the Golden Age of innovation and exploration.”
KEvin Coggins
NASA Deputy Associate Administrator for SCaN
These volunteers will submit their data to NASA for analysis, helping the agency better assess the broader aerospace community’s tracking capabilities and identify ways to augment future Moon and Mars mission support. There are no funds exchanged as a part of this collaborative effort.
This initiative builds on a previous effort in which 10 volunteers successfully tracked the Orion spacecraft during Artemis I in 2022. That campaign produced valuable data and lessons learned, including implementation, formatting, and data quality variations for Consultative Committee for Space Data Systems, which develops communications and data standards for spaceflight. To address these findings, SCaN now requires that all tracking data submitted for Artemis II comply with its data system standards.
Compared to the previous opportunity, public interest in tracking the Artemis II mission has increased. About 47 ground assets spanning 14 different countries will be used for to track the spacecraft during its journey around the Moon.
Participants List:
Government:
Canadian Space Agency (CSA), Canada
The German Aerospace Center (DLR), Germany
Commercial:
Goonhilly Earth Station Ltd, United Kingdom
GovSmart, Charlottesville, Virginia
Integrasys + University of Seville, Spain
Intuitive Machines, Houston
Kongsberg Satellite Services, Norway
Raven Defense Corporation, Albuquerque, New Mexico
Reca Space Agency + University of Douala, Cameroon
Rincon Research Corporation & the University of Arizona, Tucson
Sky Perfect JSAT, Japan
Space Operations New Zealand Limited, New Zealand
Telespazio, Italy
ViaSat, Carlsbad, California
Von Storch Engineering, Netherlands
Individual:
Chris Swier, South Dakota
Dan Slater, California
Loretta A Smalls, California
Scott Tilley, Canada
Academia:
American University, Washington
Awara Space Center + Fukui University of Technology, Japan
Morehead State University, Morehead, Kentucky
Pisgah Astronomical Research Institute, Rosman, North Carolina
University of California Berkeley, Space Sciences Laboratory, California
University of New Brunswick, ECE, Canada
University of Pittsburgh, ECE, Pittsburgh
University of Zurich – Physics Department, Switzerland
Non-Profit & Amateur Radio Organizations:
AMSAT Argentina, Argentina
AMSAT Deutschland, Germany
Amateur Radio Exploration Ground Station Consortium, Towson, Maryland
CAMRAS, Netherlands
Deep Space Exploration Society, Kiowa County, Colorado
Neu Golm Ground Station, Germany
Observation Radio Pleumeur-bodou, France
Artemis II will fly around the Moon to test the systems which will carry astronauts to the lunar surface for economic benefits and scientific discovery in the Golden Age of exploration and innovation.
The networks supporting Artemis receive programmatic oversight from NASA’s SCaN Program office. In addition to providing communications services to missions, SCaN develops the technologies and capabilities that will help propel NASA to the Moon, Mars, and beyond. The Deep Space Network is managed by NASA’s Jet Propulsion Laboratory in Southern California, and the Near Space Network is managed by NASA’s Goddard Space Flight Center in Greenbelt, Maryland.
Katrina Lee is a writer for the Space Communications and Navigation (SCaN) Program office and covers emerging technologies, commercialization efforts, exploration activities, and more.
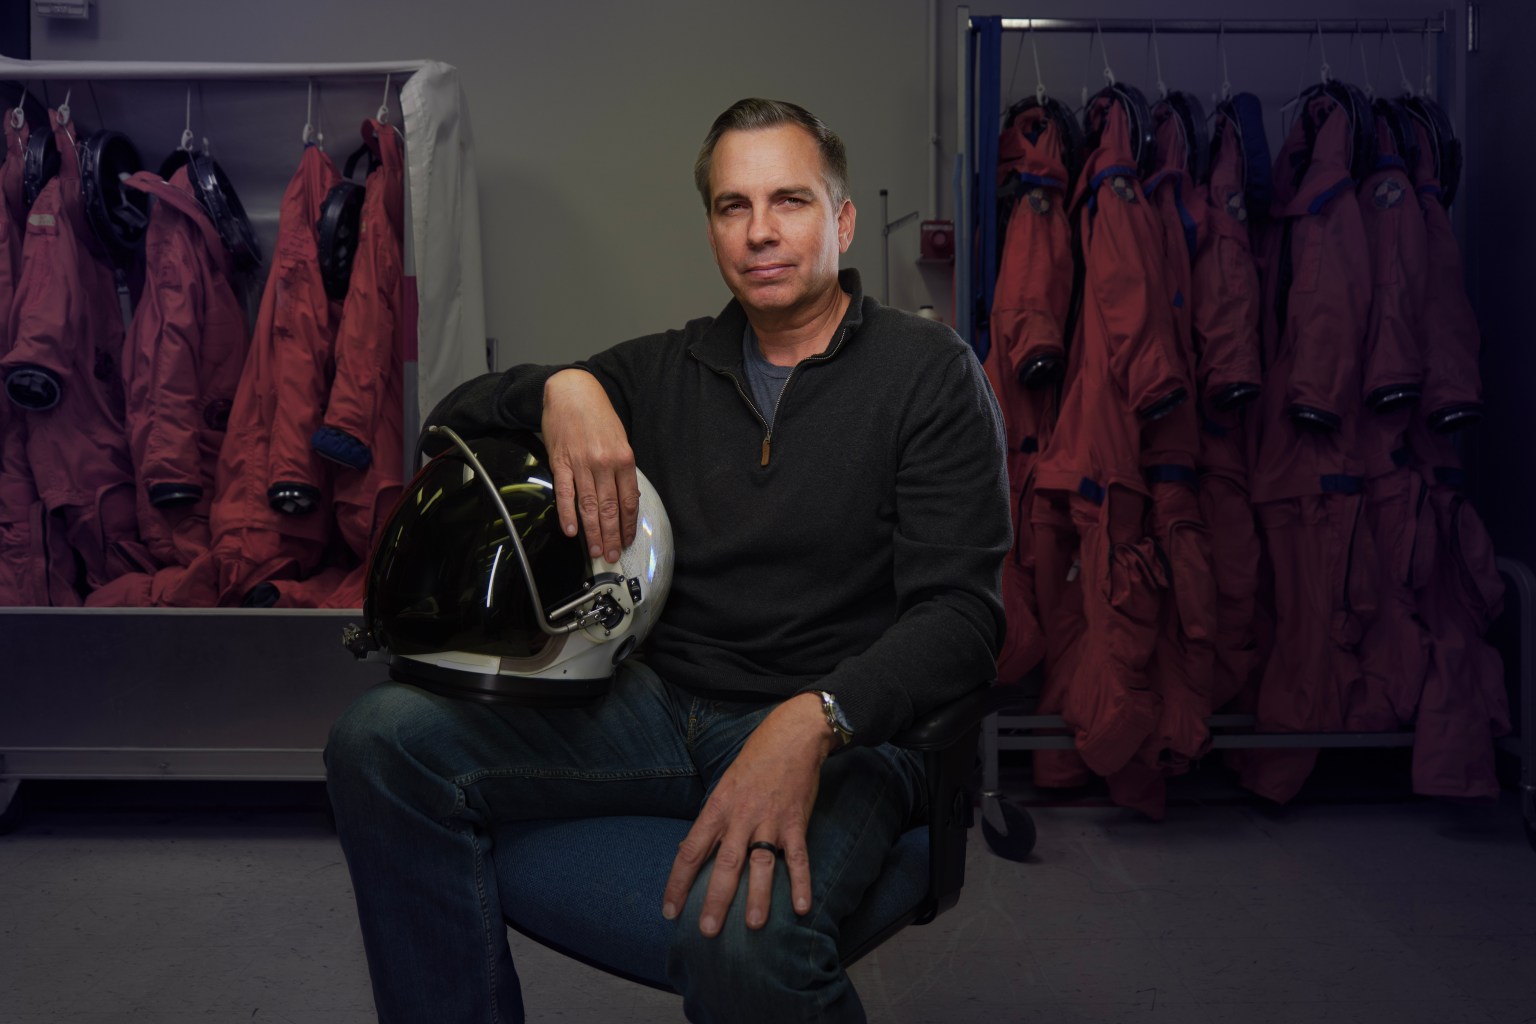
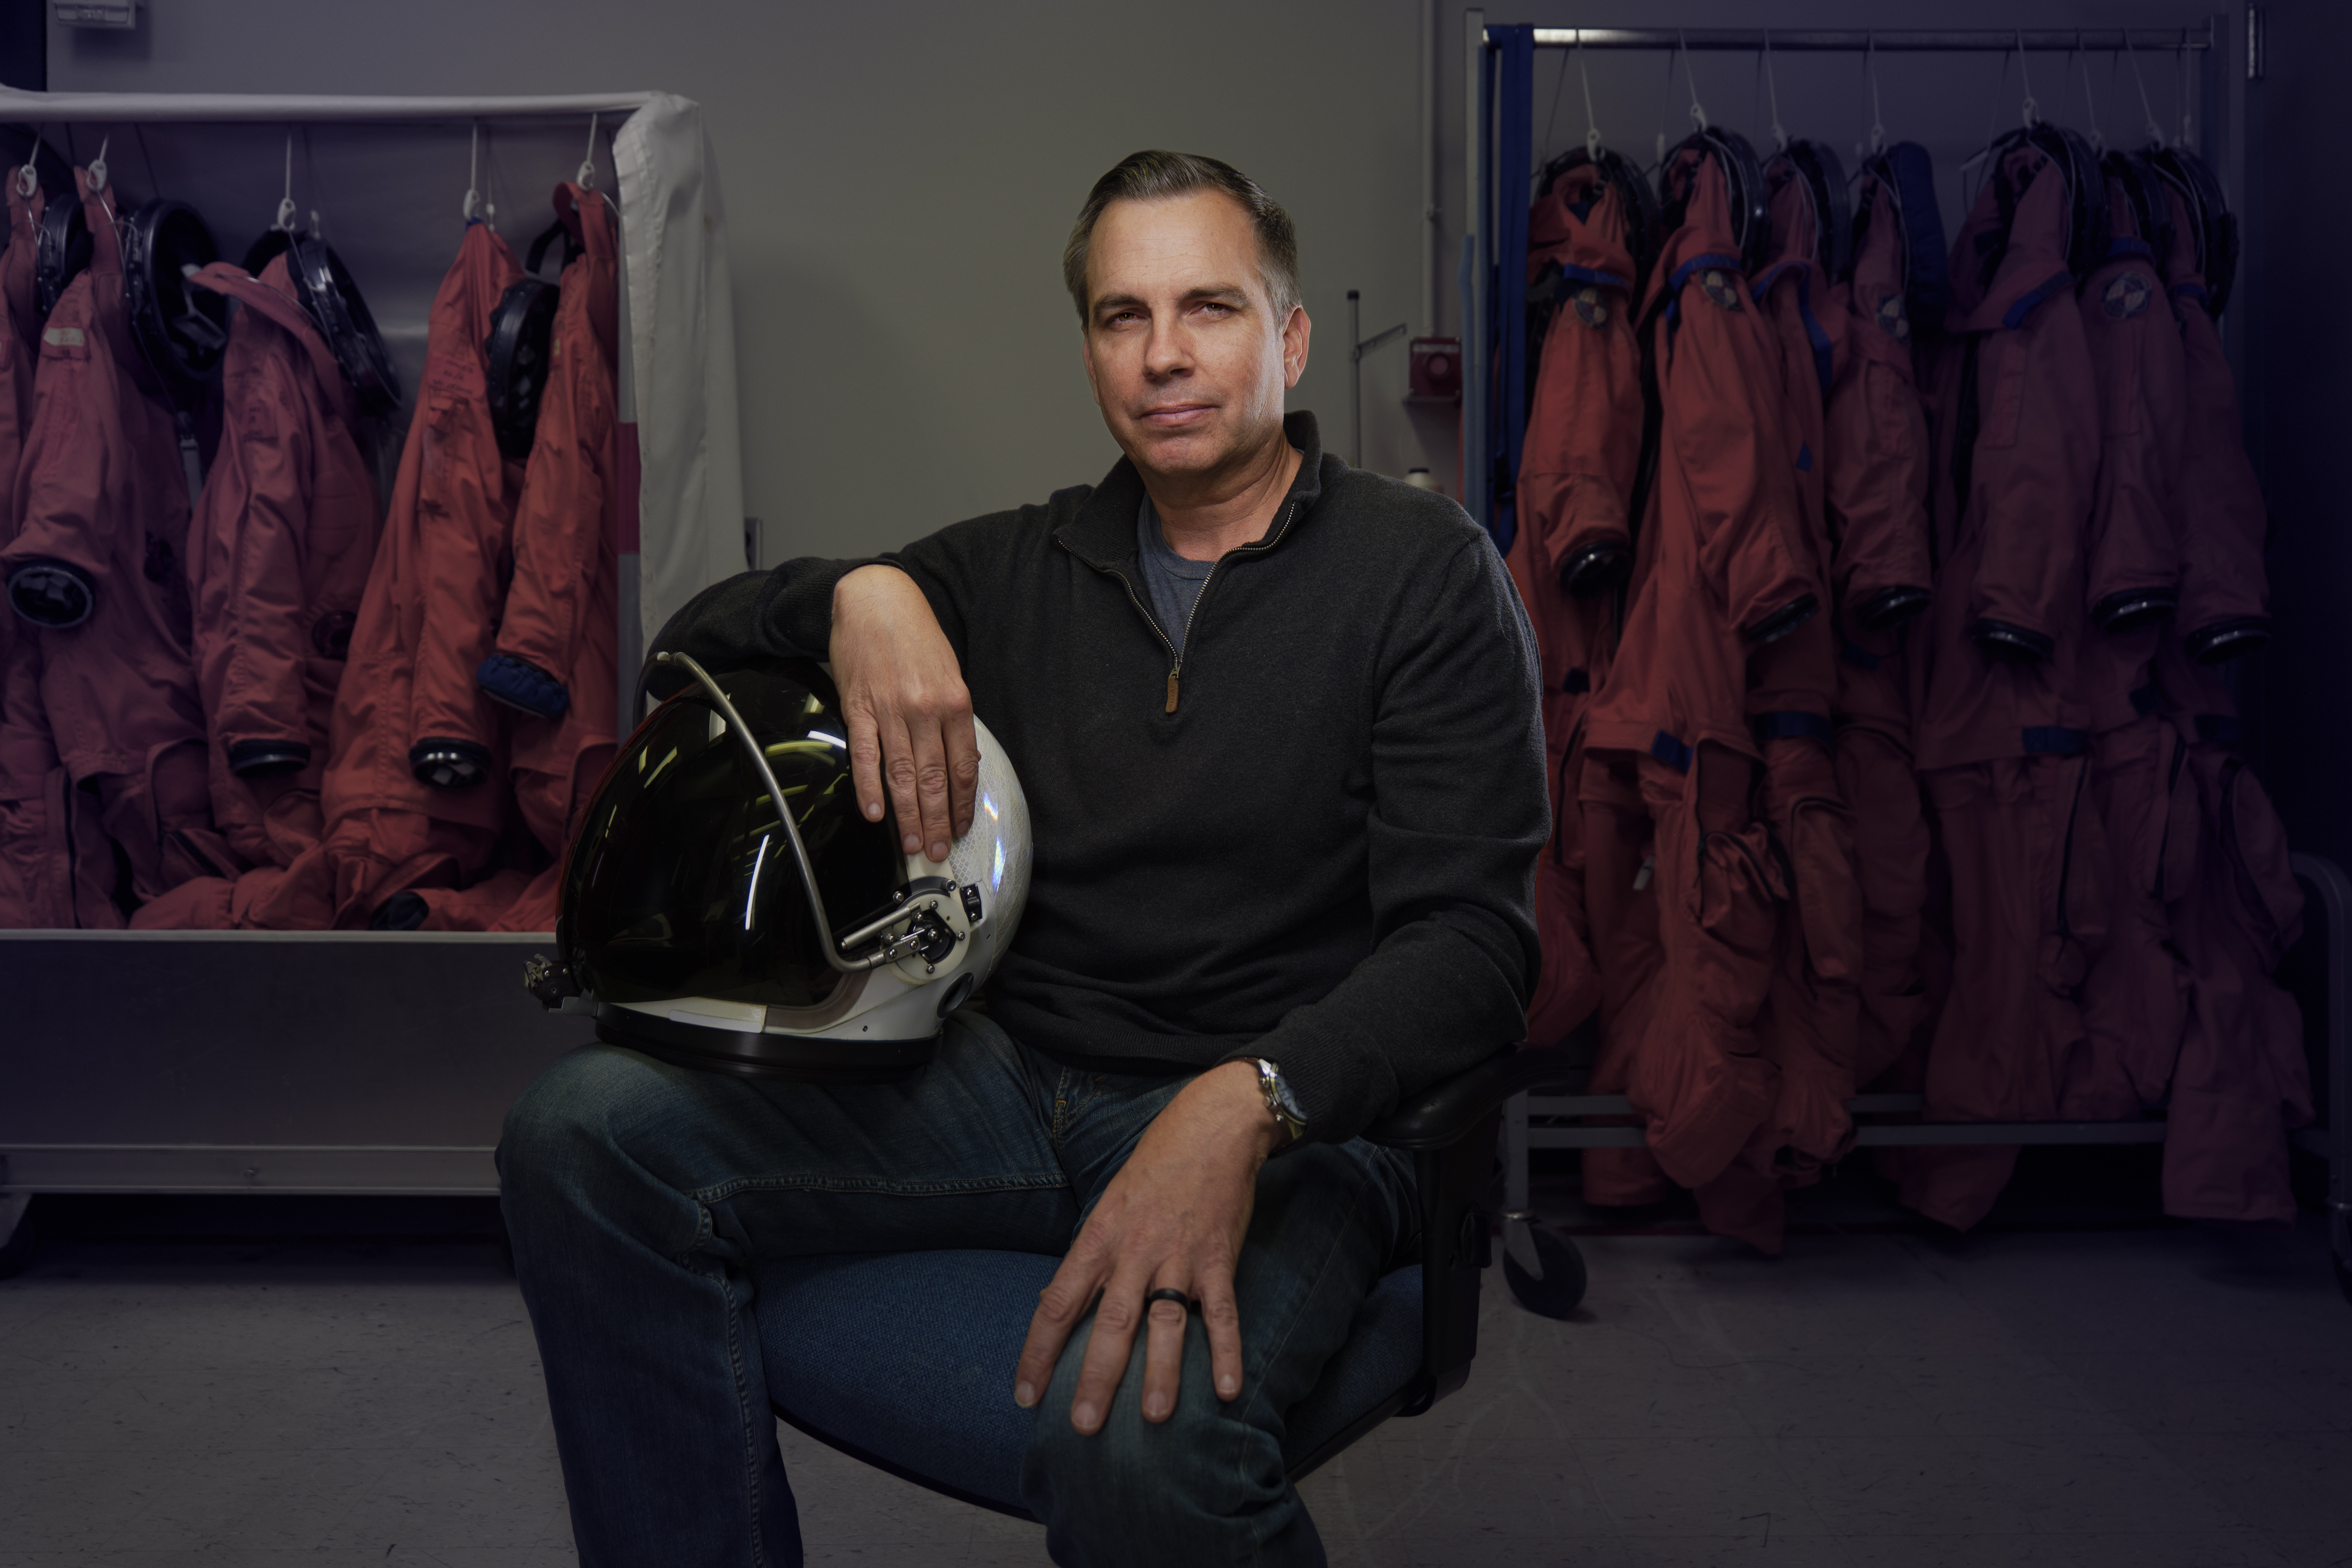
Dustin Gohmert, Orion Crew Survival System (OCSS) manager, sits in the OCSS Lab at NASA’s Johnson Space Center in Houston.
Credits: NASA/Rad Sinyak
Listen to this audio excerpt from Dustin Gohmert, Orion Crew Survival System (OCSS) manager:
0:00 / 0:00
During NASA’s Artemis II mission around the Moon, the astronauts inside the Orion spacecraft will be wearing specialized pressure suits designed to protect them throughout their journey. At NASA’s Johnson Space Center in Houston, Dustin Gohmert leads the team responsible for these suits, known as the Orion Crew Survival System (OCSS).
“We work with the crew to say, ‘Here’s this design concept we have. How does this really work in the spaceflight environment?’” Gohmert said. “As we evolve the design, we take the crew’s input and we adapt the suit over time to take into account not only the desire we have for safety, but the real-world impacts that it has.”
The suits will protect astronauts on launch day, throughout high-risk parts of missions near the Moon, during the high-speed return to Earth, and in emergency situations if such events arise. The OCSS suits are engineered to sustain life for up to six days in the event of an emergency, and can provide the astronauts oxygen, hydration, food, and waste management needed on their way back to Earth.
Dustin Gohmert, Orion Crew Survival System (OCSS) manager, sits in the OCSS Lab at NASA’s Johnson Space Center in Houston.
Credits: NASA/Rad Sinyak
“In an emergency, you’re essentially living in a personal spacecraft that’s only an inch bigger than your body,” Gohmert said. “That’s the reality of survival in space.”
Gohmert’s team in the Orion Crew Survival Systems Lab manages every phase of the suits, including processing, designing, qualifying, and testing them for the mission, as well as integrating them with the Orion spacecraft. Their work addresses engineering challenges, such as how much internal pressure the suit can safely maintain and for how long.
The team custom-builds each suit to fit the anatomy of the astronauts. Crew members undergo detailed sizing and multiple fit checks to ensure precision, and their feedback is a key part of the design evolution and refinement of the suit.
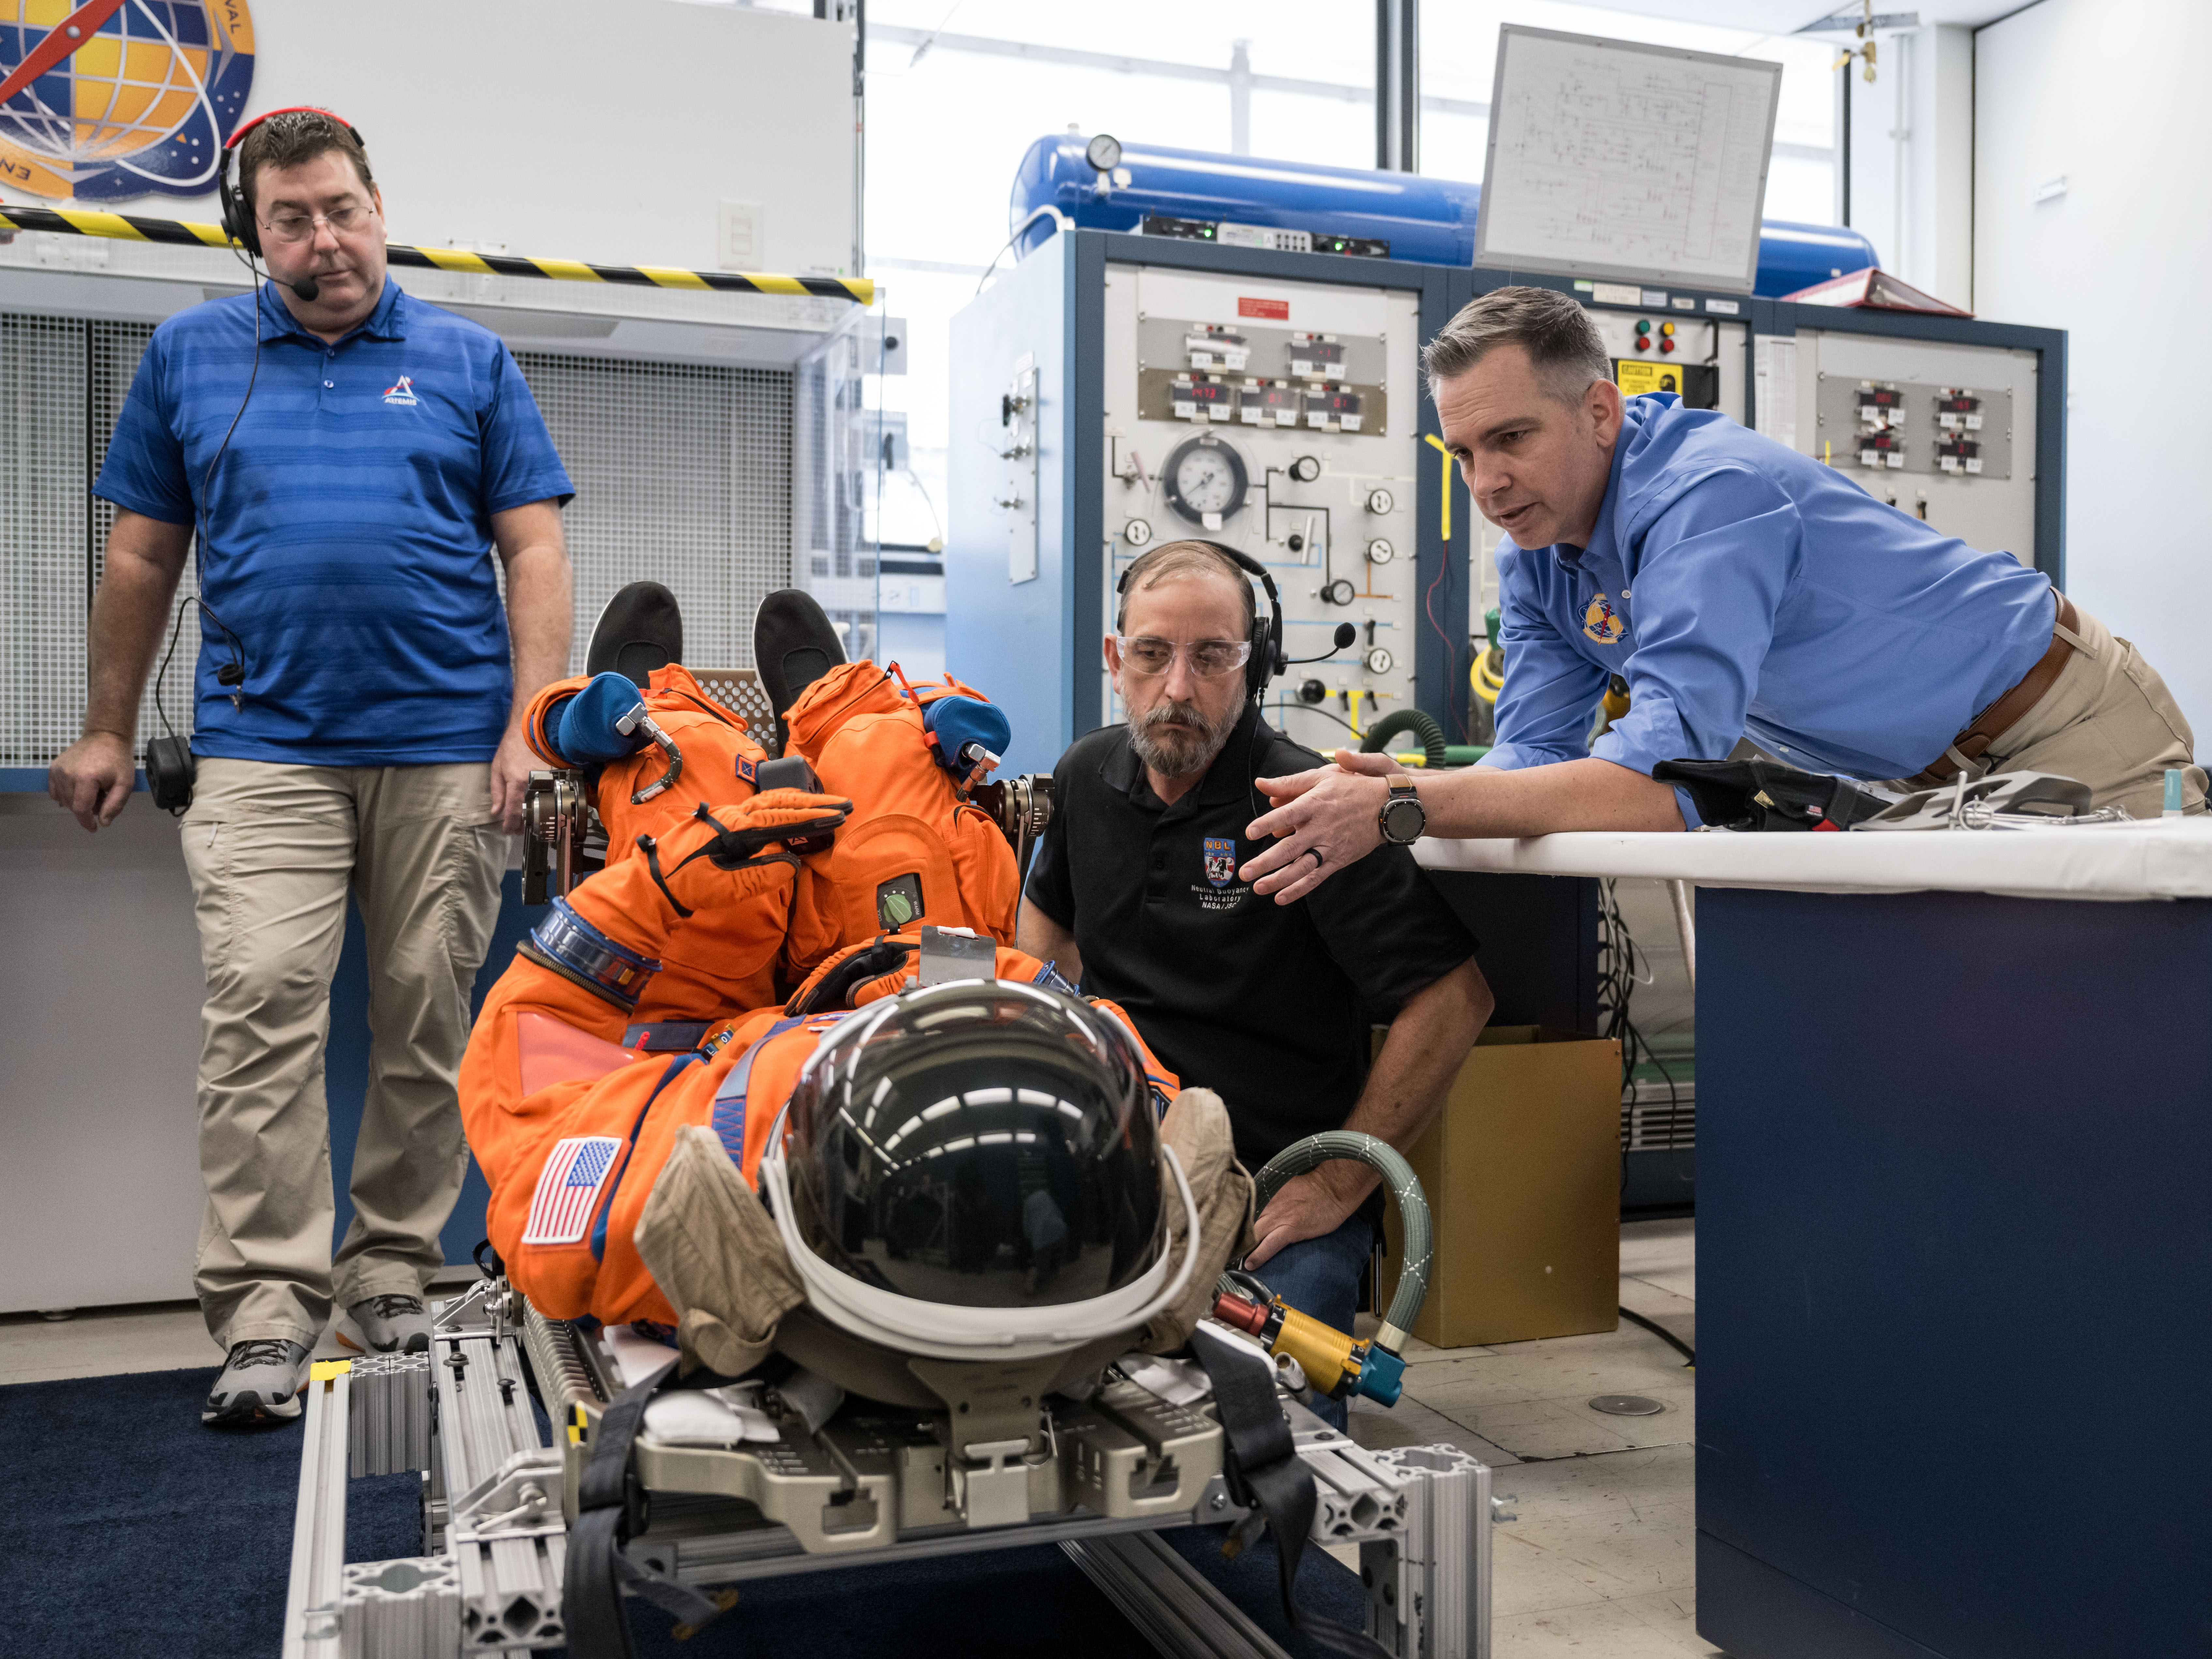
Orion Crew Survival System (OCSS) Manager Dustin Gohmert and his team perform a flight suit long duration fit check with Artemis II crew member Christina Koch in the OCSS Lab at NASA’s Johnson Space Center in Houston.
Credit: NASA/Josh Valcarcel
After earning his bachelor’s in mechanical engineering from the University of Texas at San Antonio and his master’s in engineering from the University of Texas at Austin, Gohmert joined United Space Alliance before becoming a NASA civil servant. He worked through the end of the Space Shuttle Program and later transitioned to Orion. Working on the suit throughout his career has been both technically challenging and a deeply personal responsibility.
The weight of it is incredible; knowing the ultimate responsibility you and the team share in the safety of the crew and the mission. Every thought we have, every piece of paper we write — crew is the number one priority.
dustin Gohmert
Orion Crew Survival Systems (OCSS) Manager
As NASA prepares to explore deep space with Artemis II, Gohmert’s role will play a part in safely sending crew members around the Moon and returning them home.
“I was born after the last Moon landing,” he said. “To actually be a part of the next round is kind of overwhelming. It’s awe-inspiring in every possible way.”
A green and red aurora streams across Earth’s horizon above the city lights of Europe in this Jan. 19, 2026, photograph, which looks north across Italy toward Germany. The International Space Station was orbiting 262 miles above the Mediterranean Sea at approximately 10:02 p.m. local time when the image was captured.
Also known as the northern lights (aurora borealis) or southern lights (aurora australis), auroras are colorful, dynamic, and often visually delicate displays of an intricate dance of particles and magnetism between the Sun and Earth called space weather. When energetic particles from space collide with atoms and molecules in the atmosphere, they can cause the colorful glow that we call auroras.
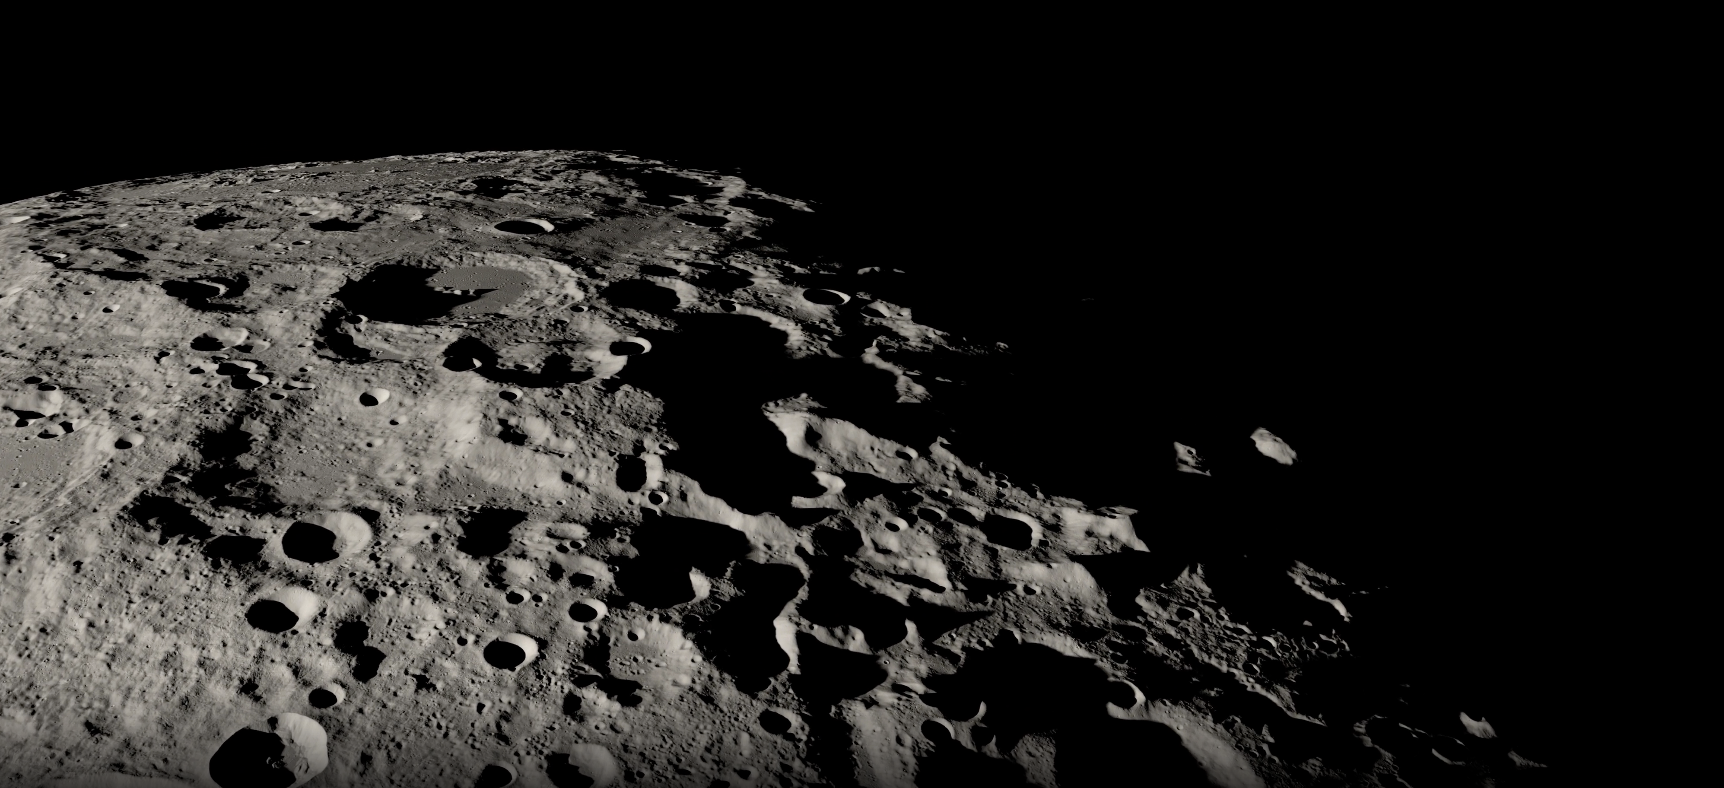
NASA Finds Lunar Regolith Limits Meteorites as Source of Earth’s Water
A close-up view of a portion of a “relatively fresh” crater, looking southeast, as photographed during the third Apollo 15 lunar surface moonwalk.
Credit: NASA
A new NASA study of its Apollo lunar soils clarifies the Moon’s record of meteorite impacts and timing of water delivery. These findings place upper bounds on how much water meteorites could have supplied later in Earth’s history.
Research has previously shown that meteorites may have been a significant source of Earth’s water as they bombarded our planet early in the solar system’s development. In a paper published Tuesday in the Proceedings to the National Academy of Sciences, researchers led by Tony Gargano, a postdoctoral fellow at NASA’s Johnson Space Center and the Lunar and Planetary Institute (LPI), both in Houston, used a novel method for analyzing the dusty debris that covers the Moon’s surface called regolith. They learned that even under generous assumptions, meteorite delivery since about four billion years ago could only have supplied a small fraction of Earth’s water.
The Moon serves as an ancient archive of the impact history the Earth-Moon system has experienced over billions of years. Where Earth’s dynamic crust and weather erase such records, lunar samples preserve them. The records don’t come without challenge, though. Traditional methods of studying regolith have relied on analyzing metal-loving elements. These elements can get muddied by repeated impacts on the Moon, making it harder to untangle and reconstruct what the original meteoroids contained.
Enter triple oxygen isotopes, high precision “fingerprints” that take advantage of the fact that oxygen, the dominant element by mass in rocks, is unaffected by impact or other external forces. The isotopes offer a clearer understanding of the composition of meteorites that impacted the Earth-Moon system. The oxygen-isotope measurements revealed that at least ~1% by mass of the regolith contained material from carbon-rich meteorites that were partially vaporized when they hit the Moon. Using the known properties of such meteorites allowed the team to calculate the amount of water that would have been carried within.
“The lunar regolith is one of the rare places we can still interpret a time-integrated record of what was hitting Earth’s neighborhood for billions of years,” said Gargano. “The oxygen-isotope fingerprint lets us pull an impactor signal out of a mixture that’s been melted, vaporized, and reworked countless times.”
The findings have implications for our understanding of water sources on Earth and the Moon. When scaled up by roughly 20 times to account for the substantially higher rate of impacts on Earth, the cumulative water shown in the model made up only a small percent of the water in Earth’s oceans. That makes it difficult to reconcile the hypothesis that late delivery of water-rich meteorites was the dominant source of Earth’s water.
“Our results don’t say meteorites delivered no water,” added co-author Justin Simon, a planetary scientist at NASA Johnson’s Astromaterials Research and Exploration Science Division. “They say the Moon’s long-term record makes it very hard for late meteorite delivery to be the dominant source of Earth’s oceans.”
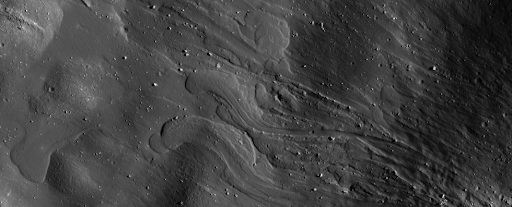
For the Moon, the implied delivery since about 4 billion years ago is tiny on an Earth-ocean scale but is not insignificant for the Moon. The Moon’s accessible water inventory is concentrated in small, permanently shadowed regions at the North and South Poles. These are some of the coldest spots in the solar system and introduce unique opportunities for scientific discovery and potential resources for lunar exploration when NASA lands astronauts on the Moon through Artemis III and beyond.
The samples analyzed for this study came from parts of the Moon near the equator on the side of the Moon facing Earth, where all six Apollo missions landed. The rocks and dust collected more than 50 years ago continue to reveal new insights but are constrained to a small portion of the Moon. Samples delivered through Artemis will open the door for a new generation of discoveries for decades to come.
“I’m part of the next generation of Apollo scientists —people who didn’t fly the missions, but who were trained on the samples and the questions Apollo made possible,” said Gargano. “The value of the Moon is that it gives us ground truth: real, physical material we can measure in the lab and use to anchor what we infer from orbital data and telescopes. I can’t wait to see what the Artemis samples have to teach us and the next generation about our place in the solar system.”
For more information on NASA’s Astromaterials Research and Exploration Science Division, visit:
NASA’s Chandra Releases Deep Cut From Catalog of Cosmic Recordings
Like a recording artist who has had a long career, NASA’s Chandra X-ray Observatory has a “back catalog” of cosmic recordings that is impossible to replicate. To access these X-ray tracks, or observations, the ultimate compendium has been developed: the Chandra Source Catalog (CSC).
The CSC contains the X-ray data detected up to the end of 2020 by Chandra, the world’s premier X-ray telescope and one of NASA’s “Great Observatories.” The latest version of the CSC, known as CSC 2.1, contains over 400,000 unique compact and extended sources and over 1.3 million individual detections in X-ray light.
before
after
This image contains lower-, medium-, and higher-energy X-rays in red, green, and blue respectively.
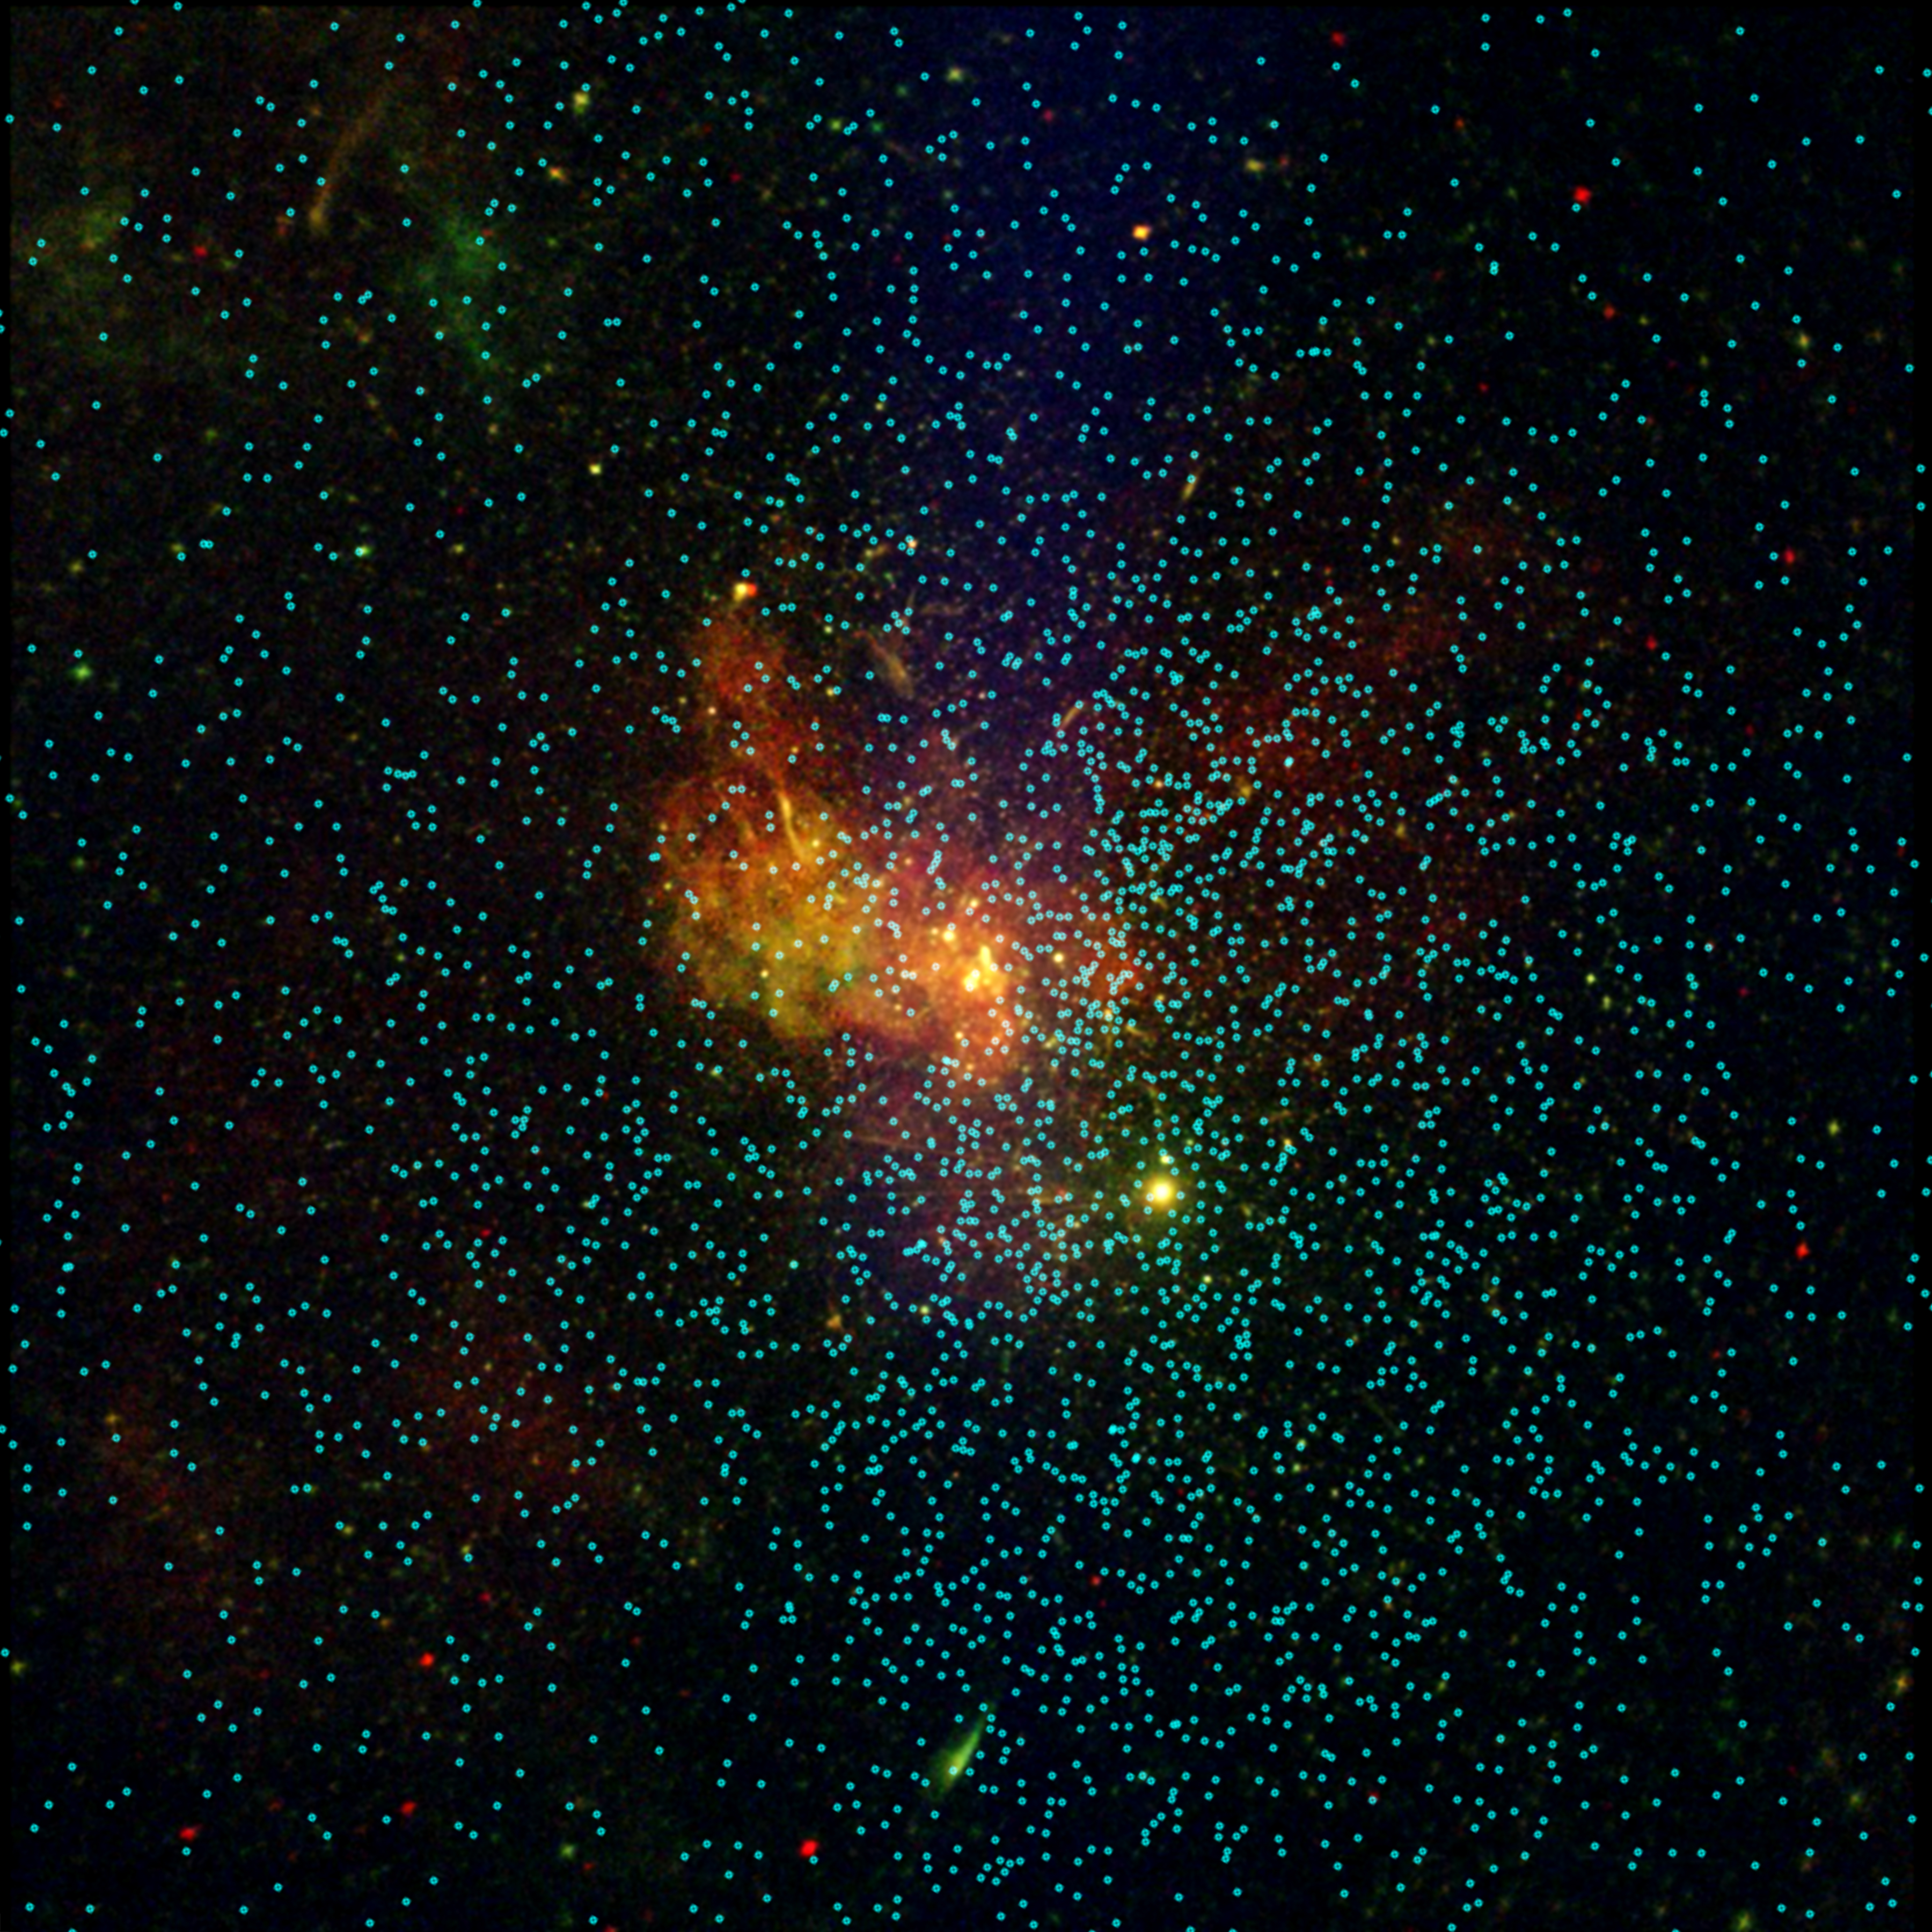
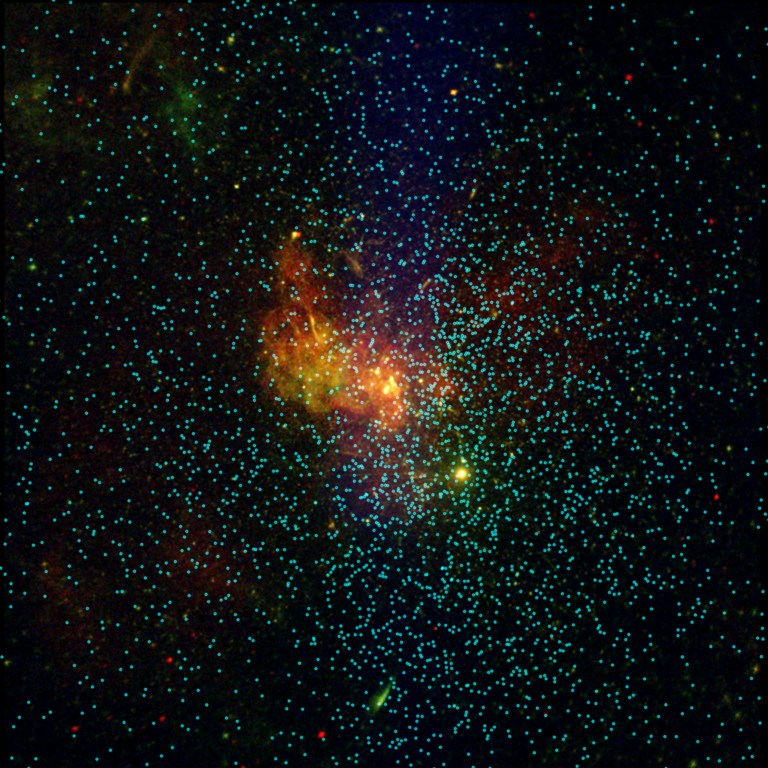
This image is the sum of 86 observations added together, representing over three million seconds of Chandra observing time. It spans just about 60 light-years across, which is a veritable pinprick on the entire sky. The underlying image contains lower-, medium-, and higher-energy X-rays in red, green, and blue respectively. The annotations on the image show where Chandra has detected over 3,300 individual sources in this field of view over a 22-year timeframe.
This image is the sum of 86 observations added together, representing over three million seconds of Chandra observing time. It spans just about 60 light-years across, which is a veritable pinprick on the entire sky. The underlying image contains lower-, medium-, and higher-energy X-rays in red, green, and blue respectively. The annotations on the image show where Chandra has detected over 3,300 individual sources in this field of view over a 22-year timeframe.
This image is the sum of 86 observations added together, representing over three million seconds of Chandra observing time. It spans just about 60 light-years across, which is a veritable pinprick on the entire sky. The underlying image contains lower-, medium-, and higher-energy X-rays in red, green, and blue respectively. The annotations on the image show where Chandra has detected over 3,300 individual sources in this field of view over a 22-year timeframe.
Within the CSC, there is a wealth of information gleaned from the Chandra observations — from precise positions on the sky to information about the the X-ray energies detected. This allows scientists using other telescopes — both on the ground and in space including NASA’s James Webb and Hubble Space Telescopes — to combine this unique X-ray data with information from other types of light.
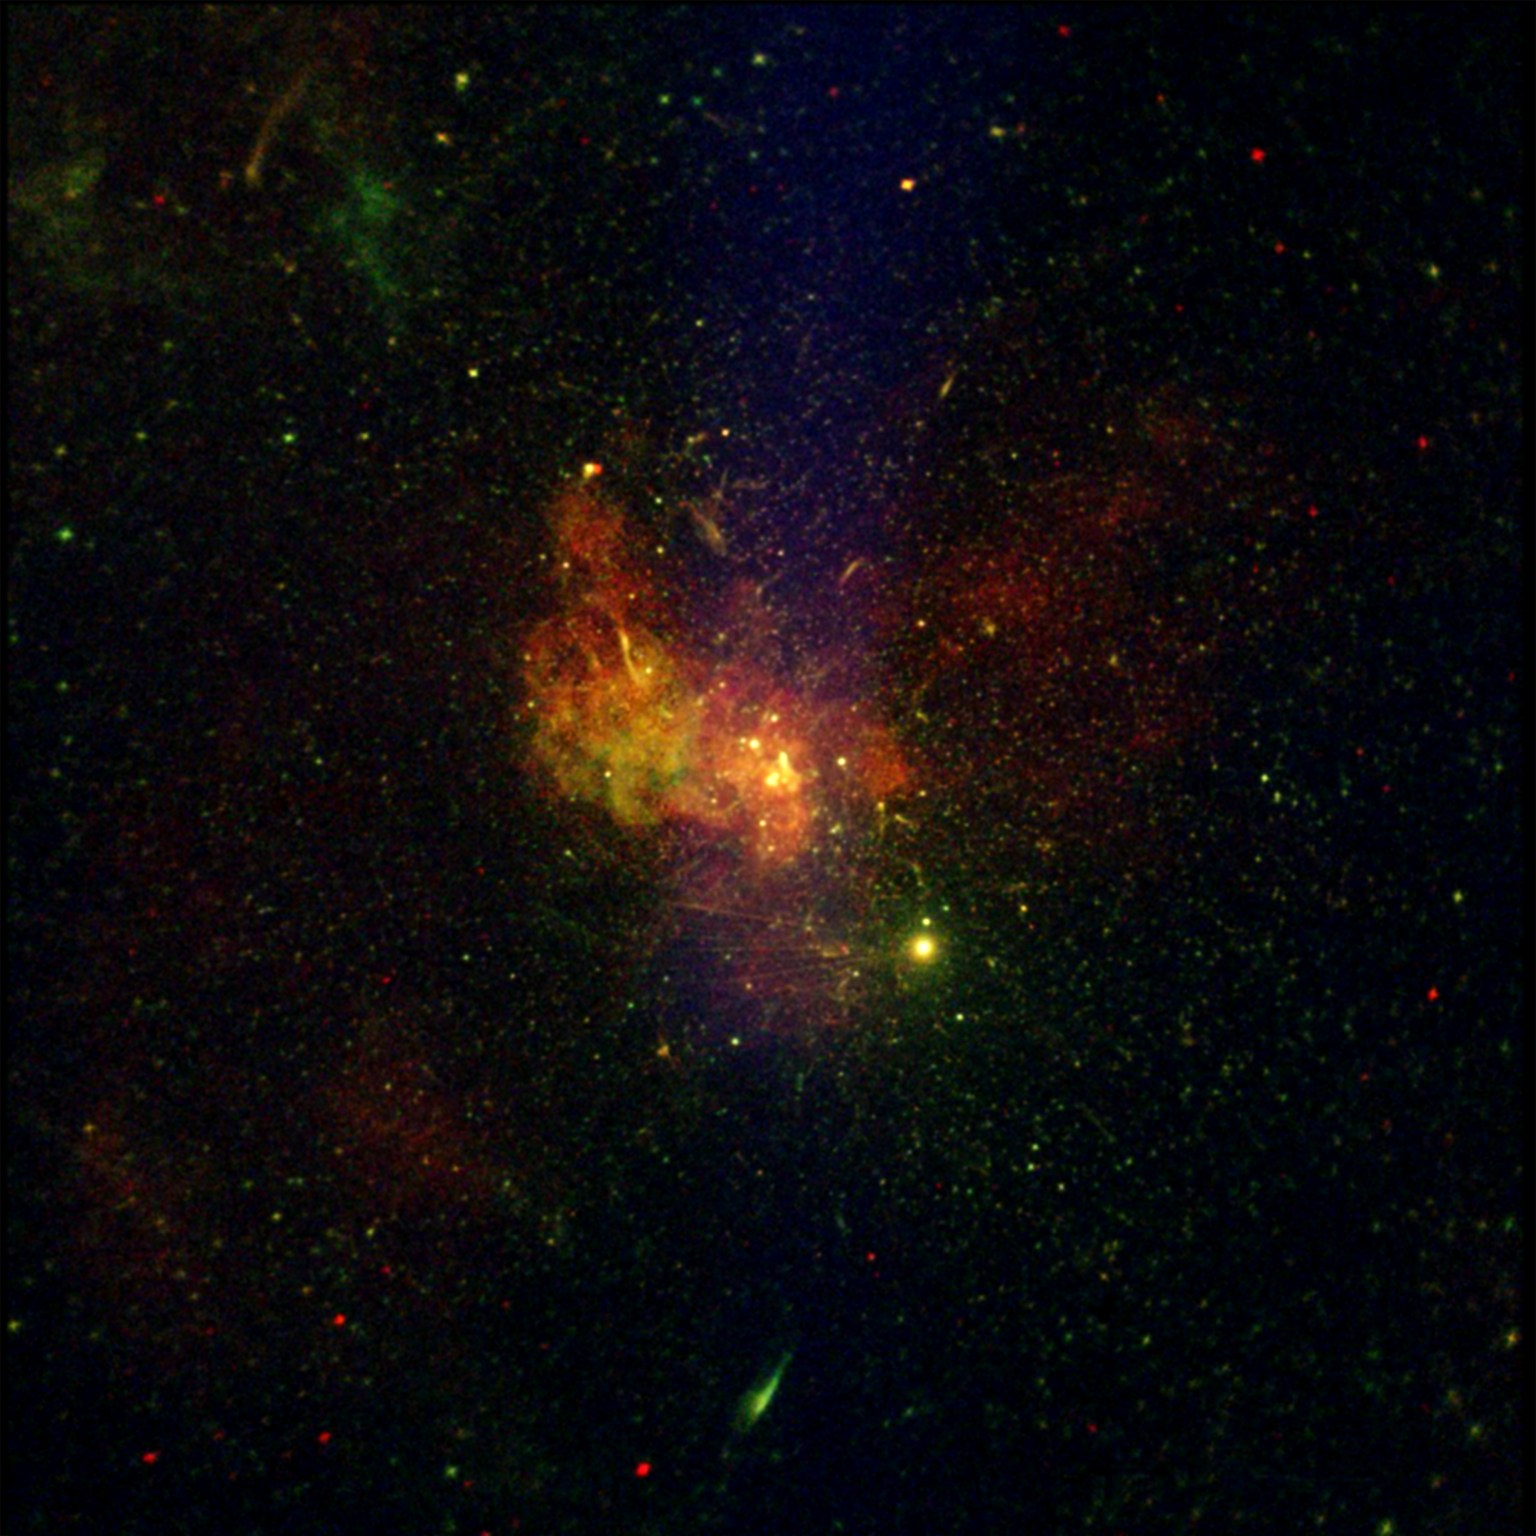
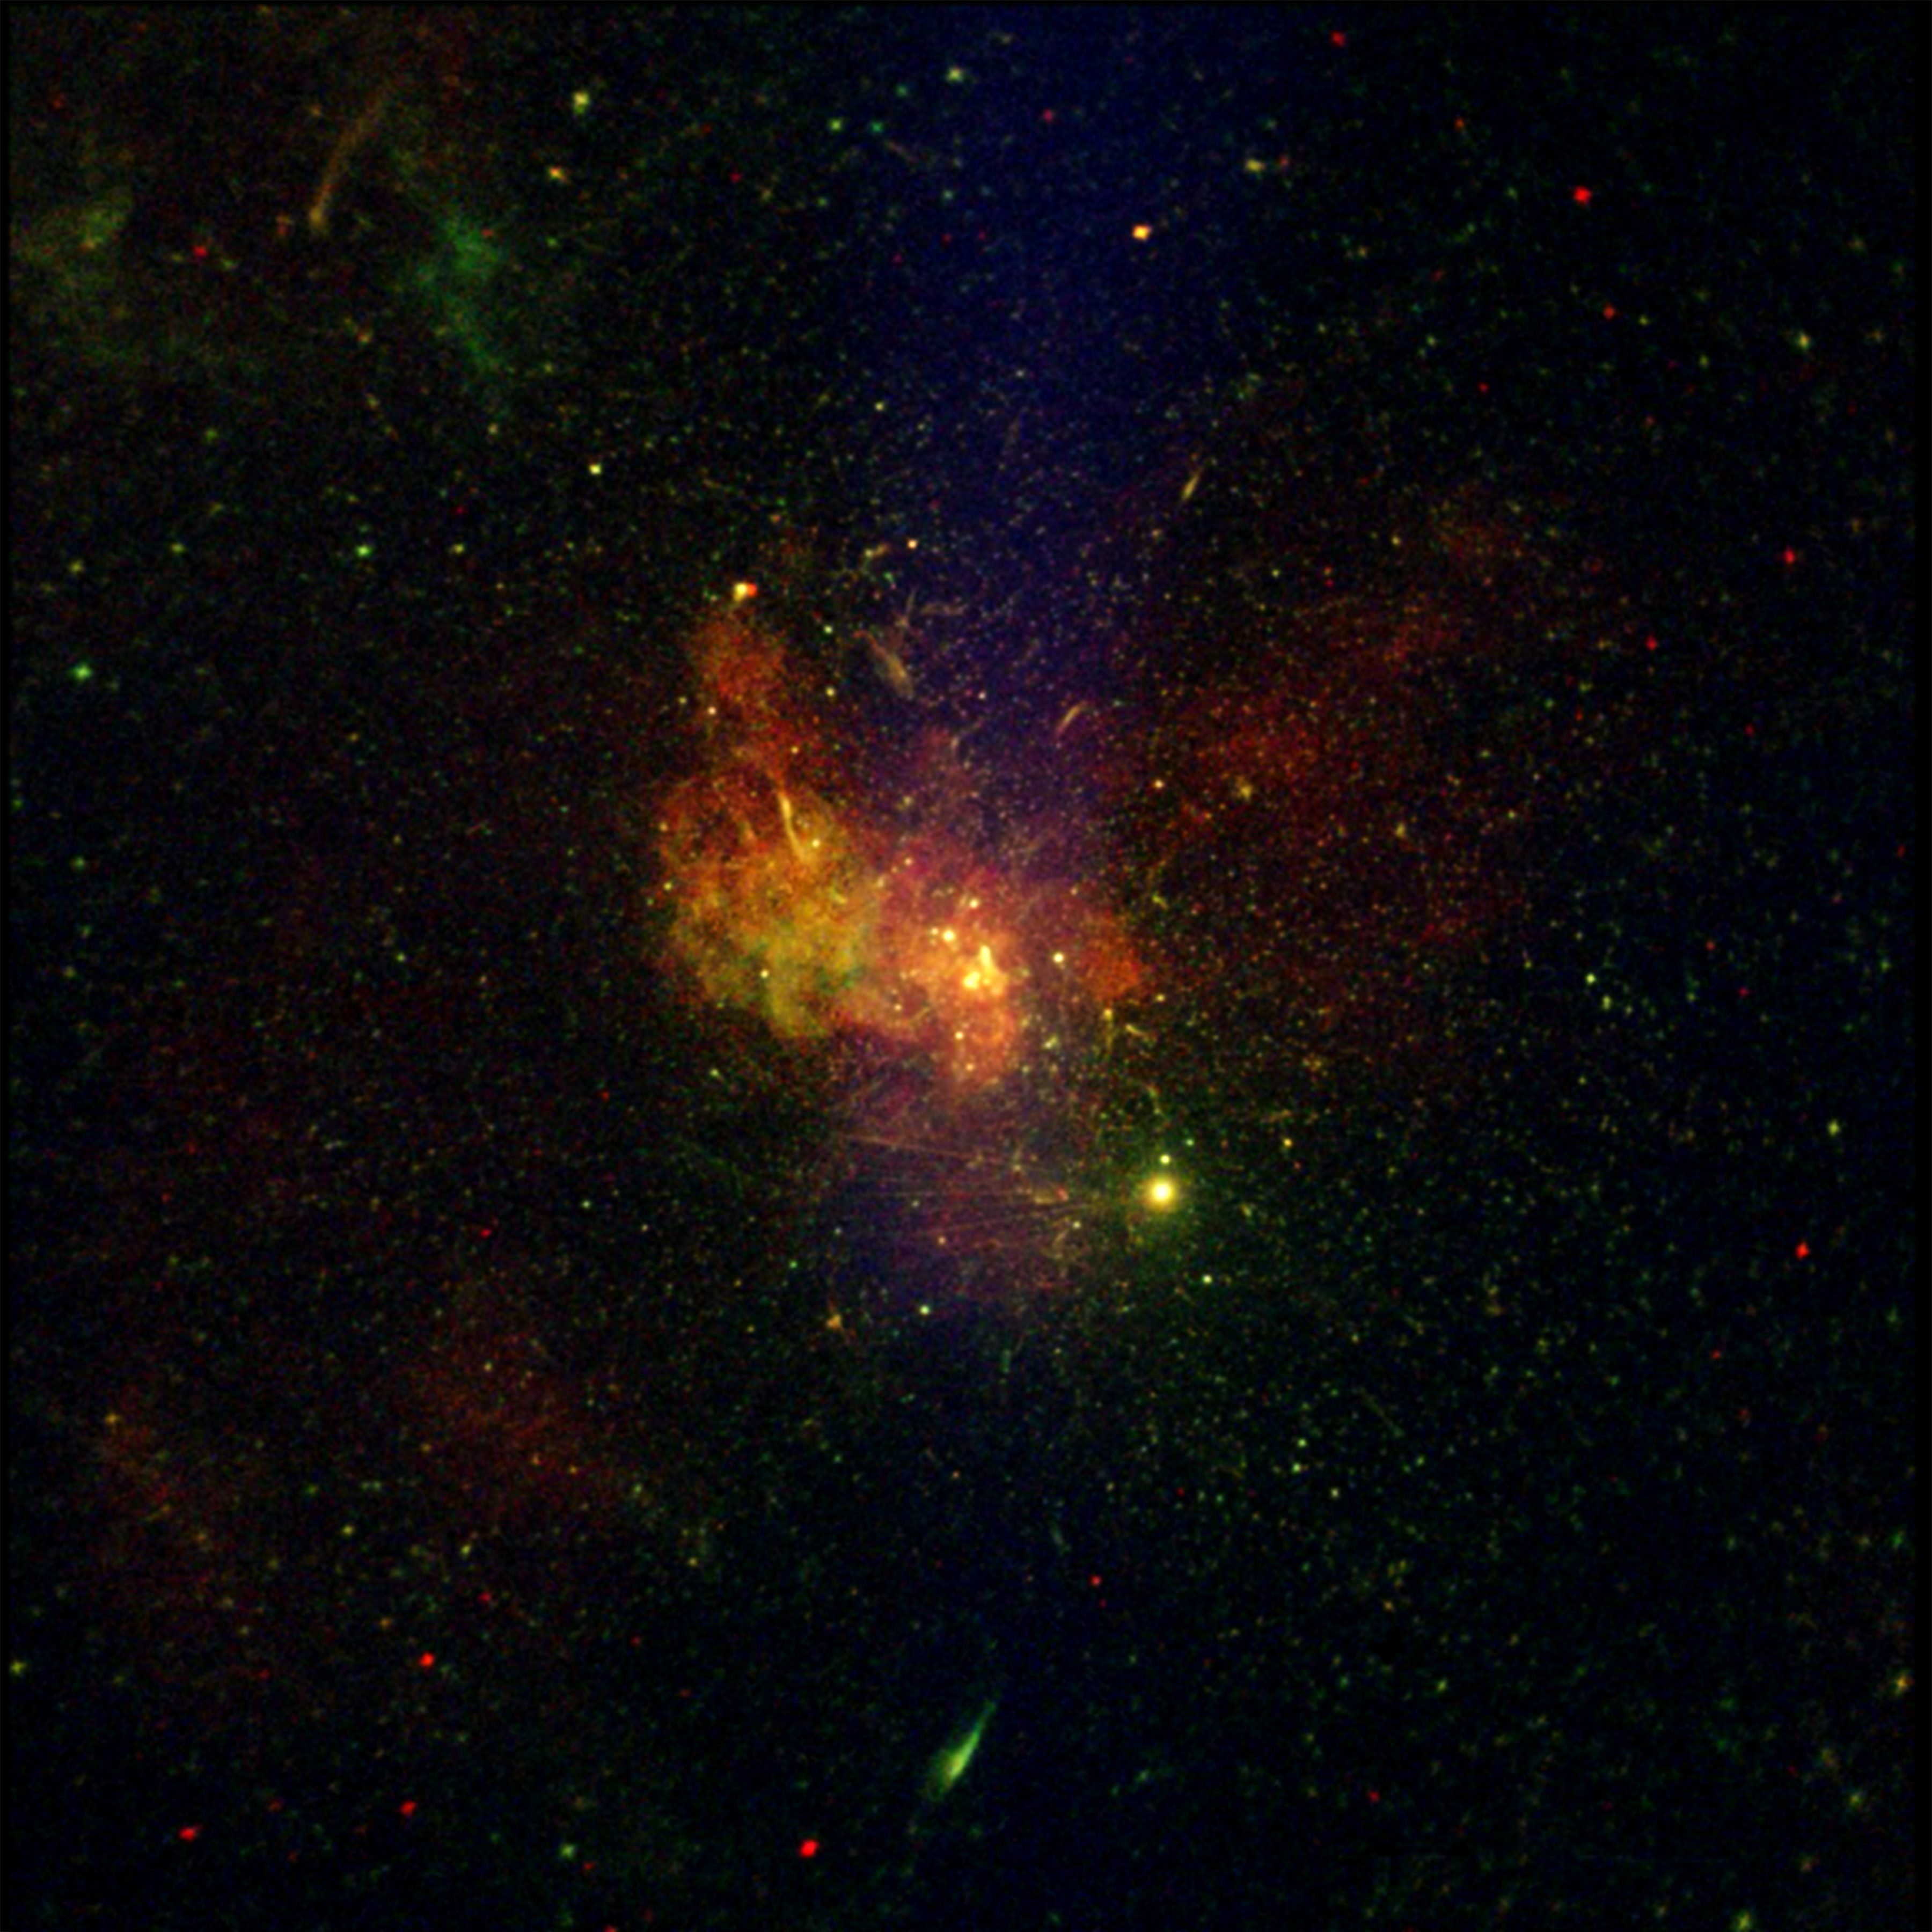
The richness of the Chandra Source Catalog is illustrated in a new image of the Galactic Center, the region around the supermassive black hole at the center of the Milky Way galaxy called Sagittarius A*. In this image that spans just about 60 light-years across, a veritable pinprick on the entire sky, Chandra has detected over 3,300 individual sources that emit X-rays. This image is the sum of 86 observations added together, representing over three million seconds of Chandra observing time.
Another new representation of the vast scope of the Chanda Source Catalog is found in a just-released sonification, the translation of astronomical data into sound. This sonification encompasses the new map that includes 22 years of Chandra observations across the sky, beginning from its launch through its observations in 2021. Because many X-ray sources have been observed multiple times over the life of the Chandra mission, this sonification represents those repeat X-ray sightings over time through different notes.
Chandra Source Catalog Sonification.
NASA/CXC/SAO/K.Arcand, SYSTEM Sounds (M. Russo, A. Santaguida
In the view of the sky, projected in a similar way to how the Earth is often depicted in world maps, the core of the Milky Way is in the center and the Galactic plane is horizontal across the middle of the image. A circle appears at the position of each detection and the size of the circle is determined by the number of detections in that location over time. A year counter appears at the top of the frame. Since Chandra continues to be fully operational, the text changes to “… and beyond” after 2021 as the telescope continues to collect observations. During the video, a collage of images produced by Chandra fades in as a background. In the final frames of the video, thumbnail images representing the thousands of Chandra observations taken over the lifetime of the mission appear behind the sky map.
NASA’s Marshall Space Flight Center in Huntsville, Alabama, manages the Chandra program. The Smithsonian Astrophysical Observatory’s Chandra X-ray Center controls science operations from Cambridge, Massachusetts, and flight operations from Burlington, Massachusetts.
A very deep Chandra X-ray Observatory image around the Sagittarius A* supermassive black hole, located in the center of the Milky Way galaxy, is shown. The image is dominated by burnt orange, deep gold and blue hues, with a sprinkling of rich green. The area looks both intricate and full, with a dense population of tiny dots, along with larger clumps and diffuse areas and nebulous areas peeking through.
At the center of the image, there is a bright, lumpy area in pale gold showing the intense X-ray radiation emanating from the Sagittarius A* black hole. In the surrounding area, there are more smaller lumps layered throughout, feathering out to a large almost butterfly shape filling much of the screen. The image appears textured, like dozens of blue and orange glow worms are paused in their wriggling.
The image offers an unprecedented view of lobes of hot gas extending for a dozen light years on either side of the black hole. These lobes provide evidence for powerful eruptions occurring several times over the last ten thousand years. The image also contains several mysterious X-ray filaments, some of which may be huge magnetic structures interacting with streams of energetic electrons produced by rapidly spinning neutron stars. Such features are known as pulsar wind nebulas. Chandra has detected over 3,300 individual sources that emit X-rays in this field of view. This image is the sum of 86 observations added together, representing over three million seconds of Chandra observing time.
106thAmerican Meteorological Society (AMS) Meeting, January 25 – 29, 2026
Join NASA in the Exhibit Hall (Booth #323) for Hyperwall Storytelling by NASA experts. Full Hyperwall Agenda below.
MONDAY, JANUARY 26
6:05 – 6:20 p.m.
Expanding Discovery from Earth Science Missions in Space Highlights of NASA Earth Science Missions to Advance Research, Data, Models, and Actionable Science
Karen St. Germain
6:20 – 6:35 p..m.
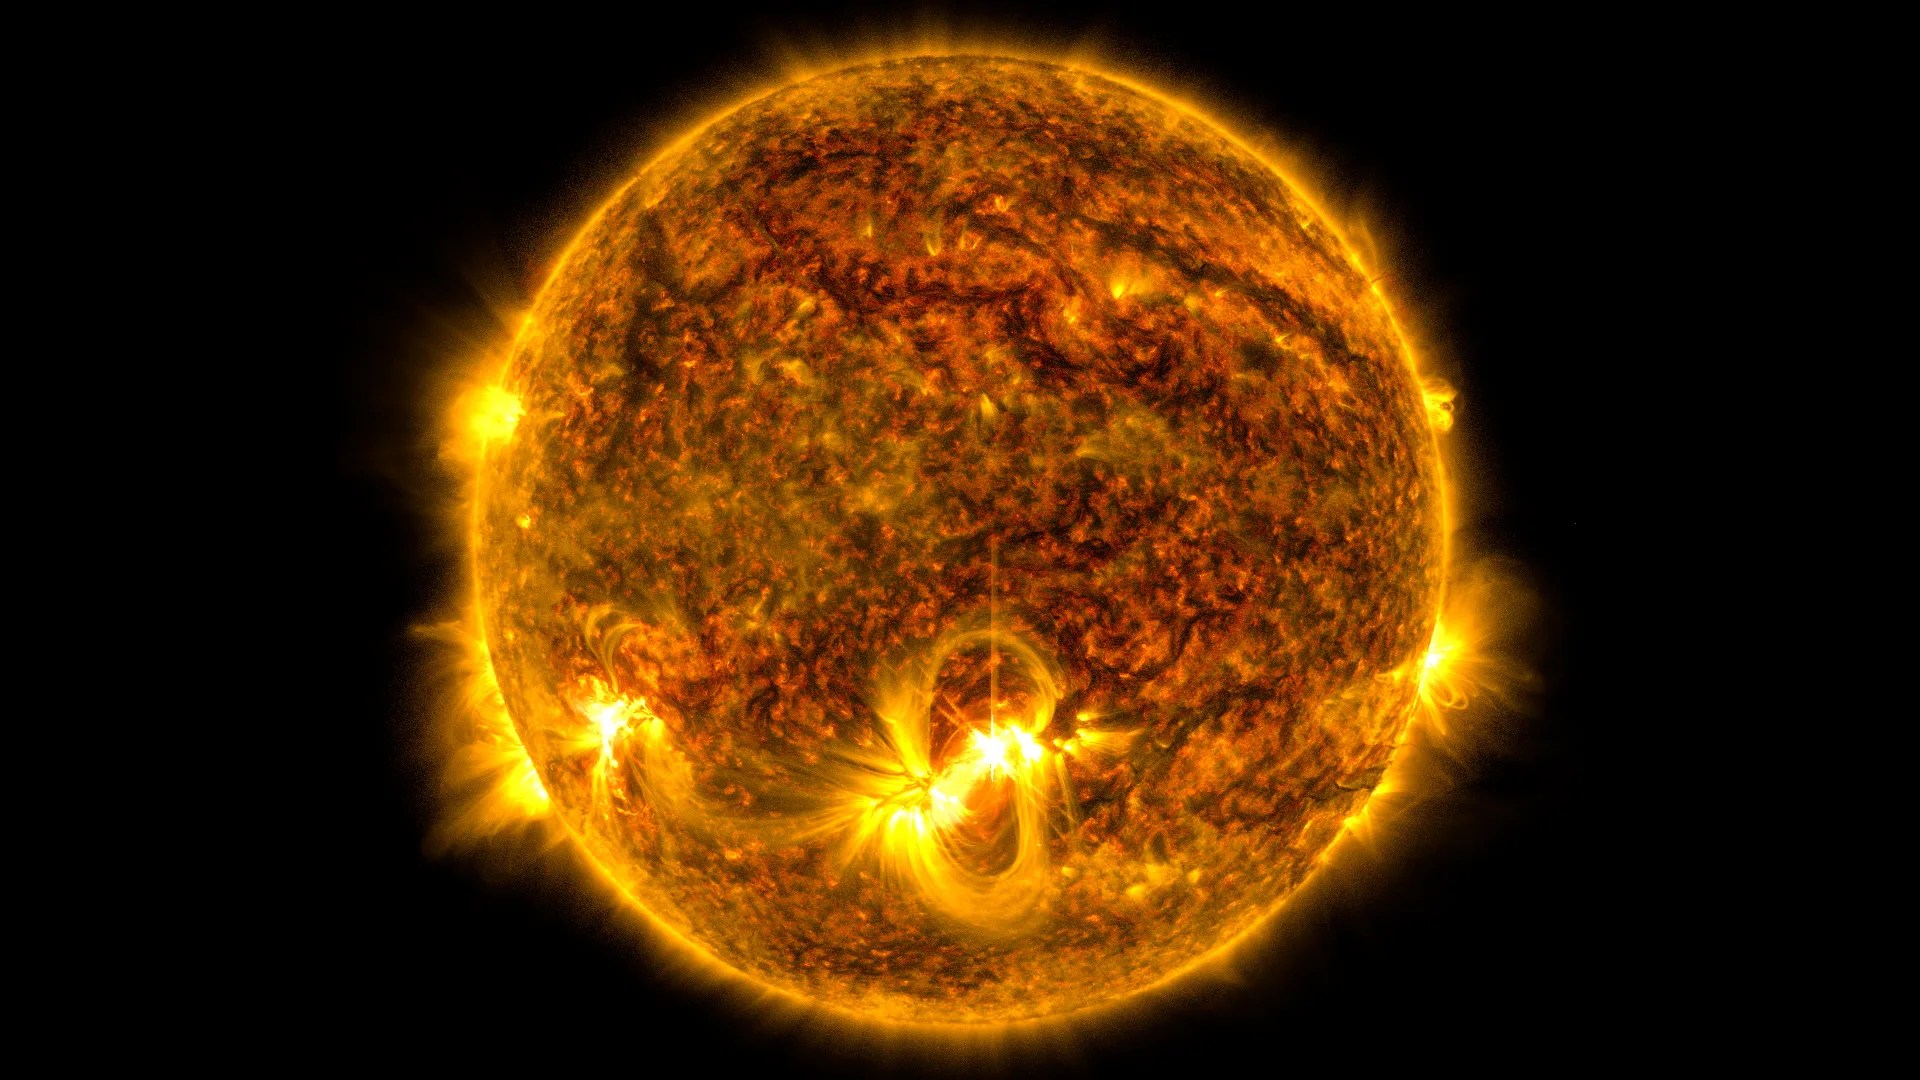
Revolutionizing Exploration of the Sun
Jamie Favors
6:40 – 6:55 p.m.
Space Weather for Astronauts
Jamie Favors Gina DiBraccio
6:55 – 7:10 p.m.
See Global Precipitation Without Writing Code
George Huffman
TUESDAY, JANUARY 27
10:00 – 10:15 a.m.
Removing Barriers to Utilizing NASA Research Data
Paul Stackhouse
10:30 – 10:45 a.m.
Connecting Satellite Data to the One Health Approach
Helena Chapman
3:00 – 3:15 p.m.
New Solar Observations and Solar Wind Measurements From the SOLAR-1 Mission
Dimitris Vassiliadis
3:15 – 3:30 p.m.
Aerosols Around the World
Robert Levy
3:30 – 3:45 p.m.
NASA’s Mission to the Sun
Eric Christian
3:45 – 4:0 p.m.
Expanding Discovery from Earth Science Missions in Space
Julie Robinson
4:00 – 4:15 p.m.
Explore Space Weather through the Community Coordinated Modeling Center and OpenSpace
Elana Resnick
5:10 – 5:25 p.m.
Think Fast, Think Sun: Exploring NASA’s HelioData for Space-Weather Awareness
Alex Young
5:30 – 5:45 p.m.
Early Career Research Program: Empowering Emerging Talent
Yaitza Luna-Cruz
WEDNESDAY, JANUARY 28
10:00 – 10:15 a.m.
NASA Space Weather Year of Launches
Kelly Korreck
10:15 – 10:30 a.m.
A Bird’s-Eye View of Air Pollution in Megacities
Laura Judd
10:30 – 10:45 a.m.
Next-Gen Operational Microwave Sounding Through 2050
Edward Kim
3:15 – 3:30 p.m.
The Ultimate Collab: NASA and NOAA Space Weather
Kelly Korreck & Yaireska (Yari) Collado-Vega
3:30 – 3:45 p.m.
See Global Precipitation Without Writing Code
George Huffman
3:45 – 4:00 p.m.
From Investment to Impact: How LEO Innovations Benefit Users
Jeremy Goldstein
4:00 – 4:15 p.m.
Early Career Research Program: Empowering Emerging Talent
Yaitza Luna-Cruz
4:15 – 4:30 p.m.
Accelerating Health and Air Quality Solutions Through Earth Observations
John Haynes
5:10 – 5:25 p.m.
The Interstellar Mapping and Acceleration Probe (IMAP)
Eric Christian
THURSDAY, JANUARY 29
10:00 – 10:15 a.m.
Think Fast, Think Sun: Exploring NASA’s HelioData for Space-Weather Awareness
Alex Young
10:30 – 10:45 a.m.
From Investment to Impact: How LEO Innovations Benefit Users
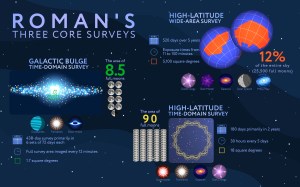
At the heart of our own galaxy, there is a dense thicket of stars with a supermassive black hole at the very center. NASA’s Nancy Grace Roman Space Telescope will provide the deepest-ever view of this zone, revealing stars, planets, and unique objects that resist definition.
Based on the input of astronomers from across the globe, the Roman Space Telescope will spend three-quarters of its five-year primary mission conducting three revolutionary surveys of unprecedented scale. Their combined results will transform all areas of astronomy and answer longstanding questions about dark matter, dark energy, and planets outside of our solar system, called exoplanets.
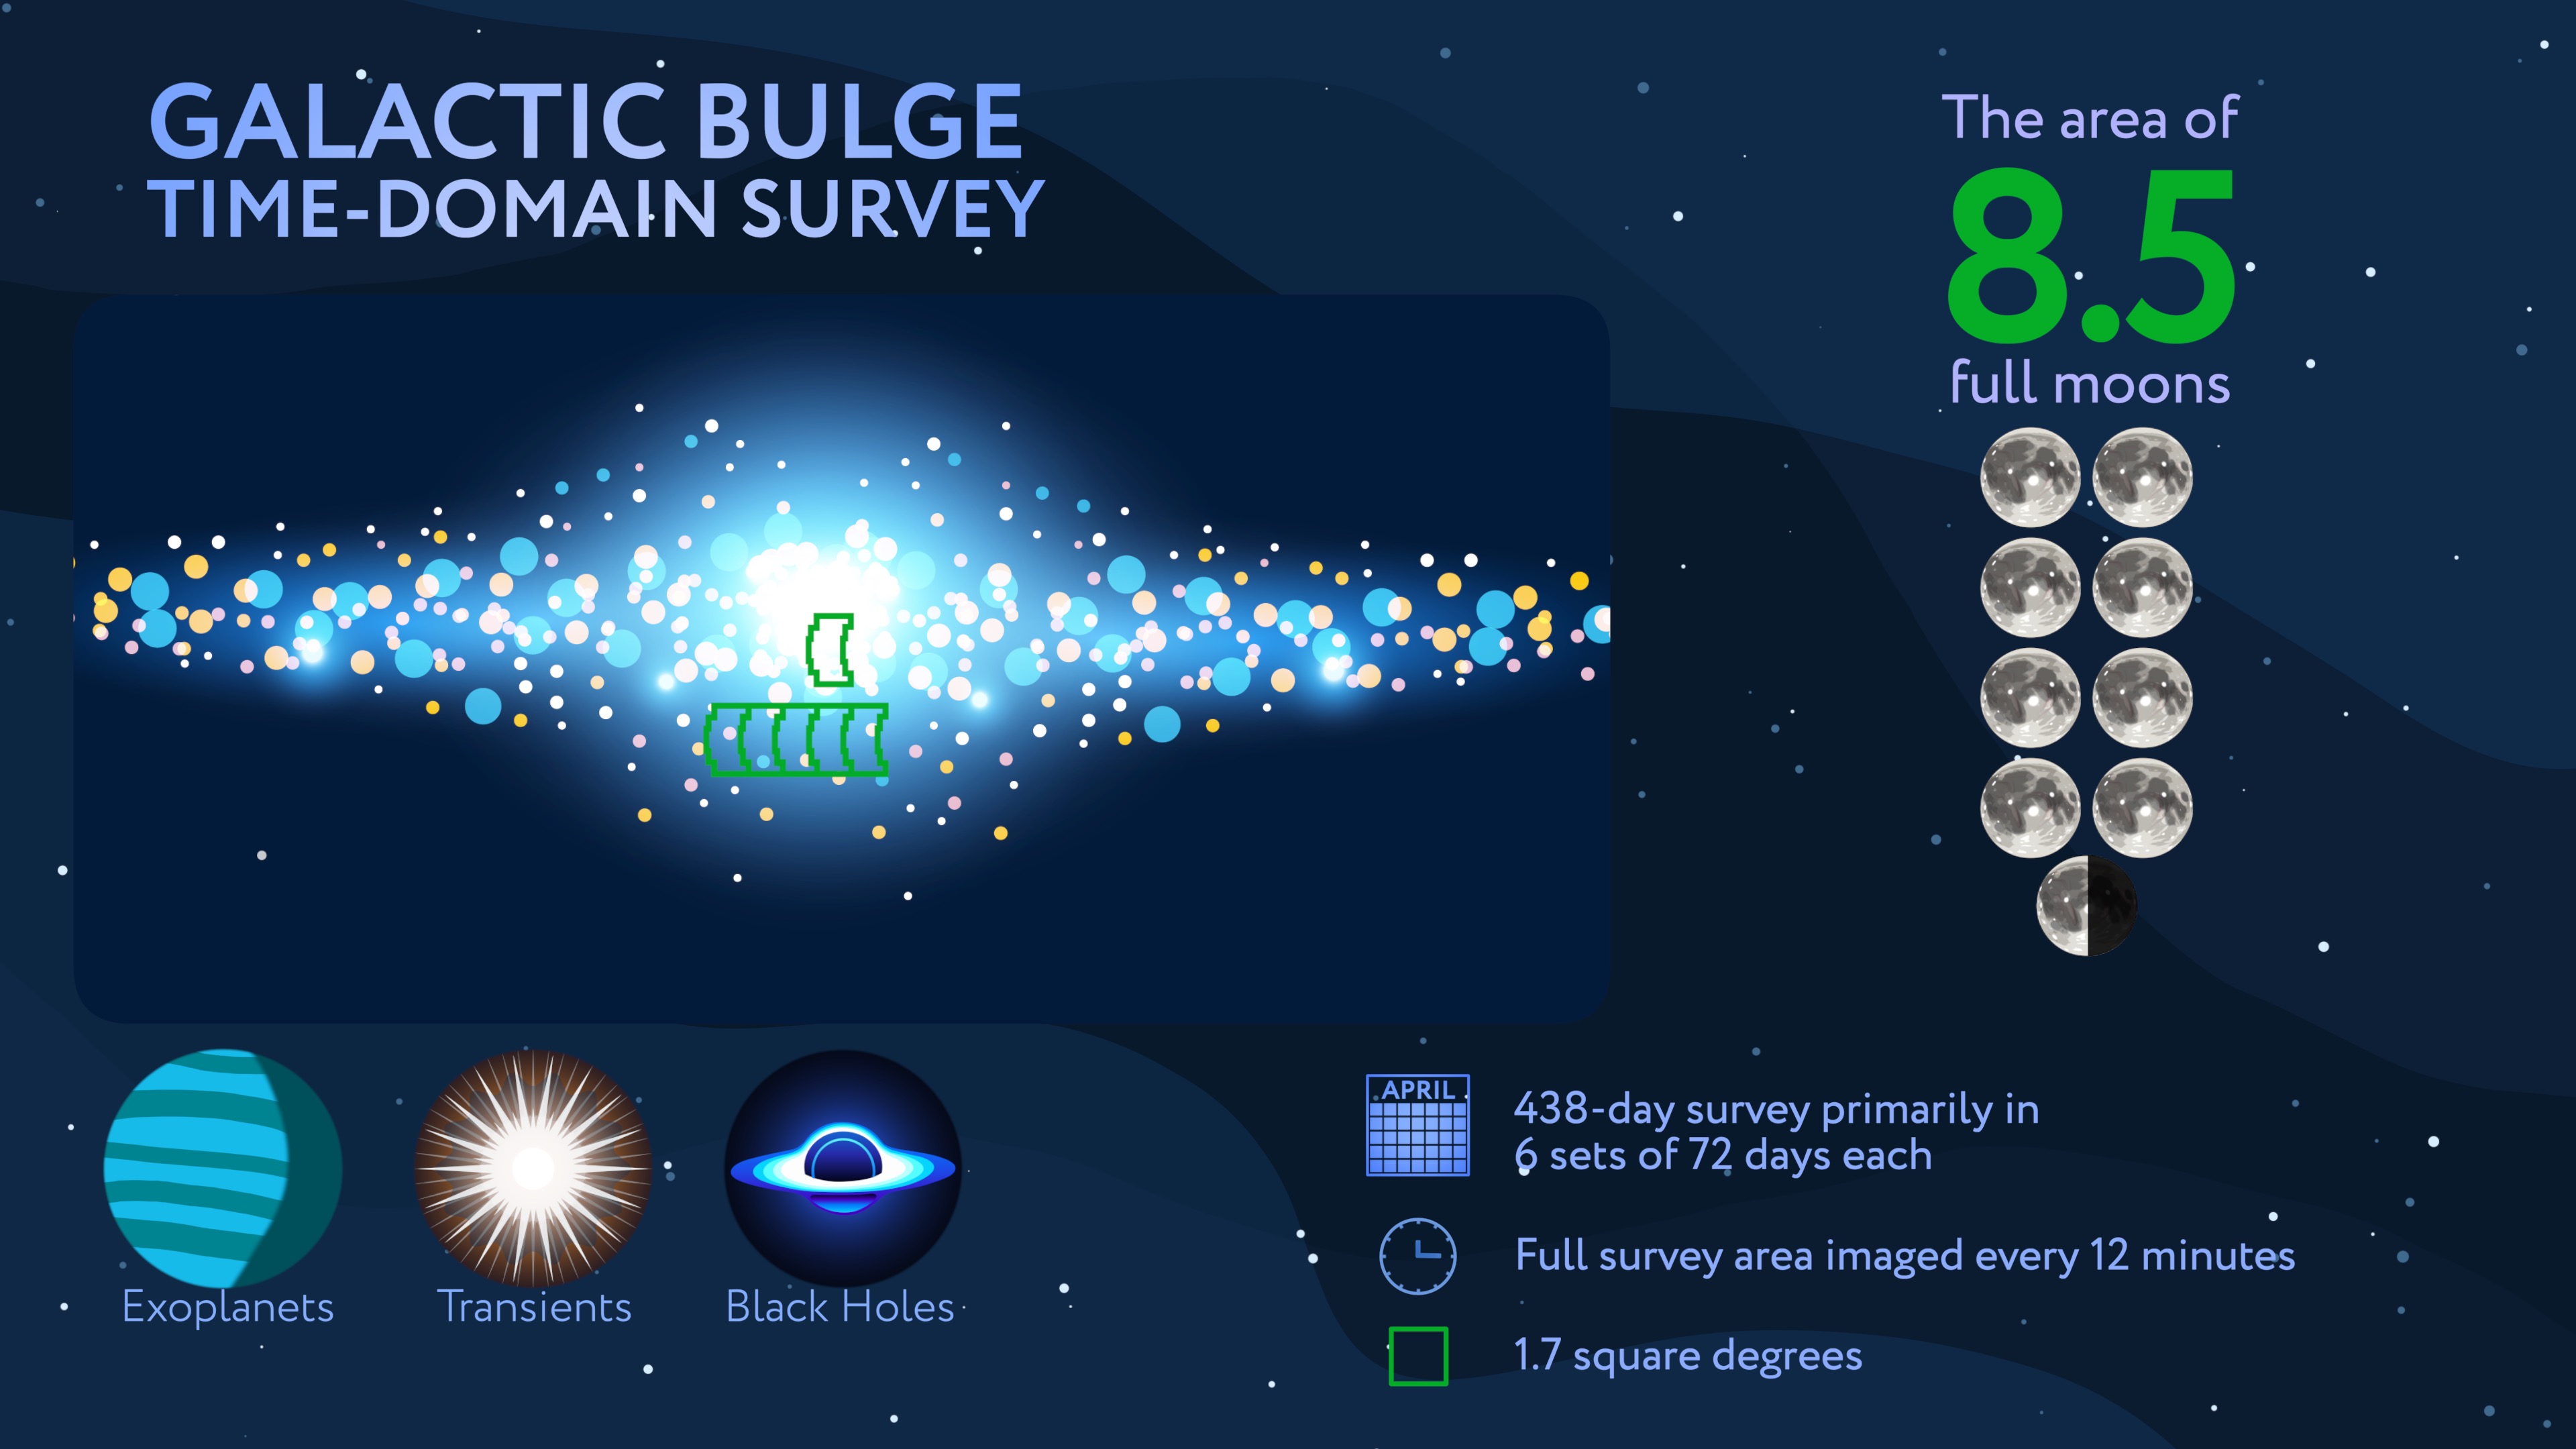
That last theme will be addressed by the Galactic Bulge Time-Domain Survey, which will peer into the center of our galaxy to study the stars and exoplanets that make up the densely populated region around the center of the Milky Way, known as the galactic bulge.
This infographic describes the Galactic Bulge Time-Domain Survey that will be conducted by NASA’s Nancy Grace Roman Space Telescope. The smallest of Roman’s core surveys, this observation program will consist of repeat visits to six fields covering 1.7 square degrees total. One field will pierce the very center of the galaxy, and the others will be nearby — all in a region of the sky that will be visible to Roman for two 72-day stretches each spring and fall. The survey will mainly consist of six seasons (three early on, and three toward the end of Roman’s primary mission), during which Roman will view each field every 12 minutes. Roman will also view the six fields with less intensity at other times throughout the mission, allowing astronomers to detect microlensing events that can last for years, signaling the presence of isolated, stellar-mass black holes.
Credit: NASA’s Goddard Space Flight Center
The survey will observe six patches of the galactic bulge, one pinpointing the center and five nearby, every 12 minutes during 438 days of total observing time. The observations will be separated into six “seasons” spread out over five years.
Spending so much time focusing on a relatively small area of the sky, the mission will be able to track changes in the motion and light of hundreds of millions of stars, and any planets that orbit them, over long periods — the “time-domain” aspect of the survey.
“This survey will be the highest precision, highest cadence, longest continuous observing baseline survey of our galactic bulge, where the highest density of stars in our galaxy reside,” said Jessie Christiansen of Caltech/IPAC, who served as co-chair of the committee that defined the Galactic Bulge Time-Domain Survey.
Exoplanet microlensing
Roman will use a method called microlensing to search for exoplanets, a technique that has so far identified just over 200 exoplanets, compared to more than 4,000 discovered with the transit method, out of the greater than 6,000 currently confirmed.
With this survey, scientists expect to see over 1,000 new planets orbiting other stars just using microlensing alone. This would increase the number of exoplanets identified using this method by more than fivefold.
A microlensing event is when light from a distant star in the background is warped slightly by a foreground object, like a star and its planet. This warping of light is called gravitational lensing, with the gravity from the star and planet bending the fabric of space that light is traveling through and focusing it like a magnifying glass.
This animation illustrates the concept of gravitational microlensing. When one star in the sky appears to pass nearly in front of another, the light rays of the background source star become bent due to the warped space-time around the foreground star. This star is then a virtual magnifying glass, amplifying the brightness of the background source star, so we refer to the foreground star as the lens star. If the lens star harbors a planetary system, then those planets can also act as lenses, each one producing a short deviation in the brightness of the source. Thus we discover the presence of exoplanets, and measure its mass and separation from its star. Credit: NASA’s Goddard Space Flight Center/CI Lab
While the transit method is very good at identifying exoplanets that orbit close to their star, the microlensing method can discover exoplanets that orbit farther away from their star, and in planetary systems farther from Earth than ever studied before. Roman will be versatile enough to see exoplanets dwelling from the inner edge of the habitable zone out to great distances from their stars, with a wide range of masses from planets smaller than Mars to the size of gas giants like Jupiter and Saturn. It may even discover “rogue planets” without host stars that either formed alone or were ejected from their host systems long ago.
“For the first time, we will have a big picture understanding of Earth and our solar system within the broader context of the exoplanet population of the Milky Way galaxy,” Christiansen said. “We still don’t know how common Earth-like planets are, and the Roman Galactic Bulge Time-Domain Survey will provide us with this answer.”
This survey will create a census of exoplanets for scientists to draw statistical conclusions from, revealing common patterns found in exoplanets and furthering our understanding of planetary formation and habitability.
One survey; lots of science
Because of the immense amount of observing time and subsequent data produced, the Galactic Bulge Time-Domain Survey will advance not only the field of exoplanet microlensing, but other areas of astronomy, too.
“There is an incredibly rich diversity of science that can be done with a high-precision, high-cadence survey like this one,” said Dan Huber of the University of Hawaii, the other survey co-chair.
The core survey was optimized not only for microlensing, but also to observe changes in brightness from small, fast blips to long-term trends. This property allows astronomers to discover and characterize transiting planets, red giant stars, stellar-mass black holes and other stellar remnants, and eclipsing binaries, and can lead to a deeper understanding about the physics of star formation and evolution.
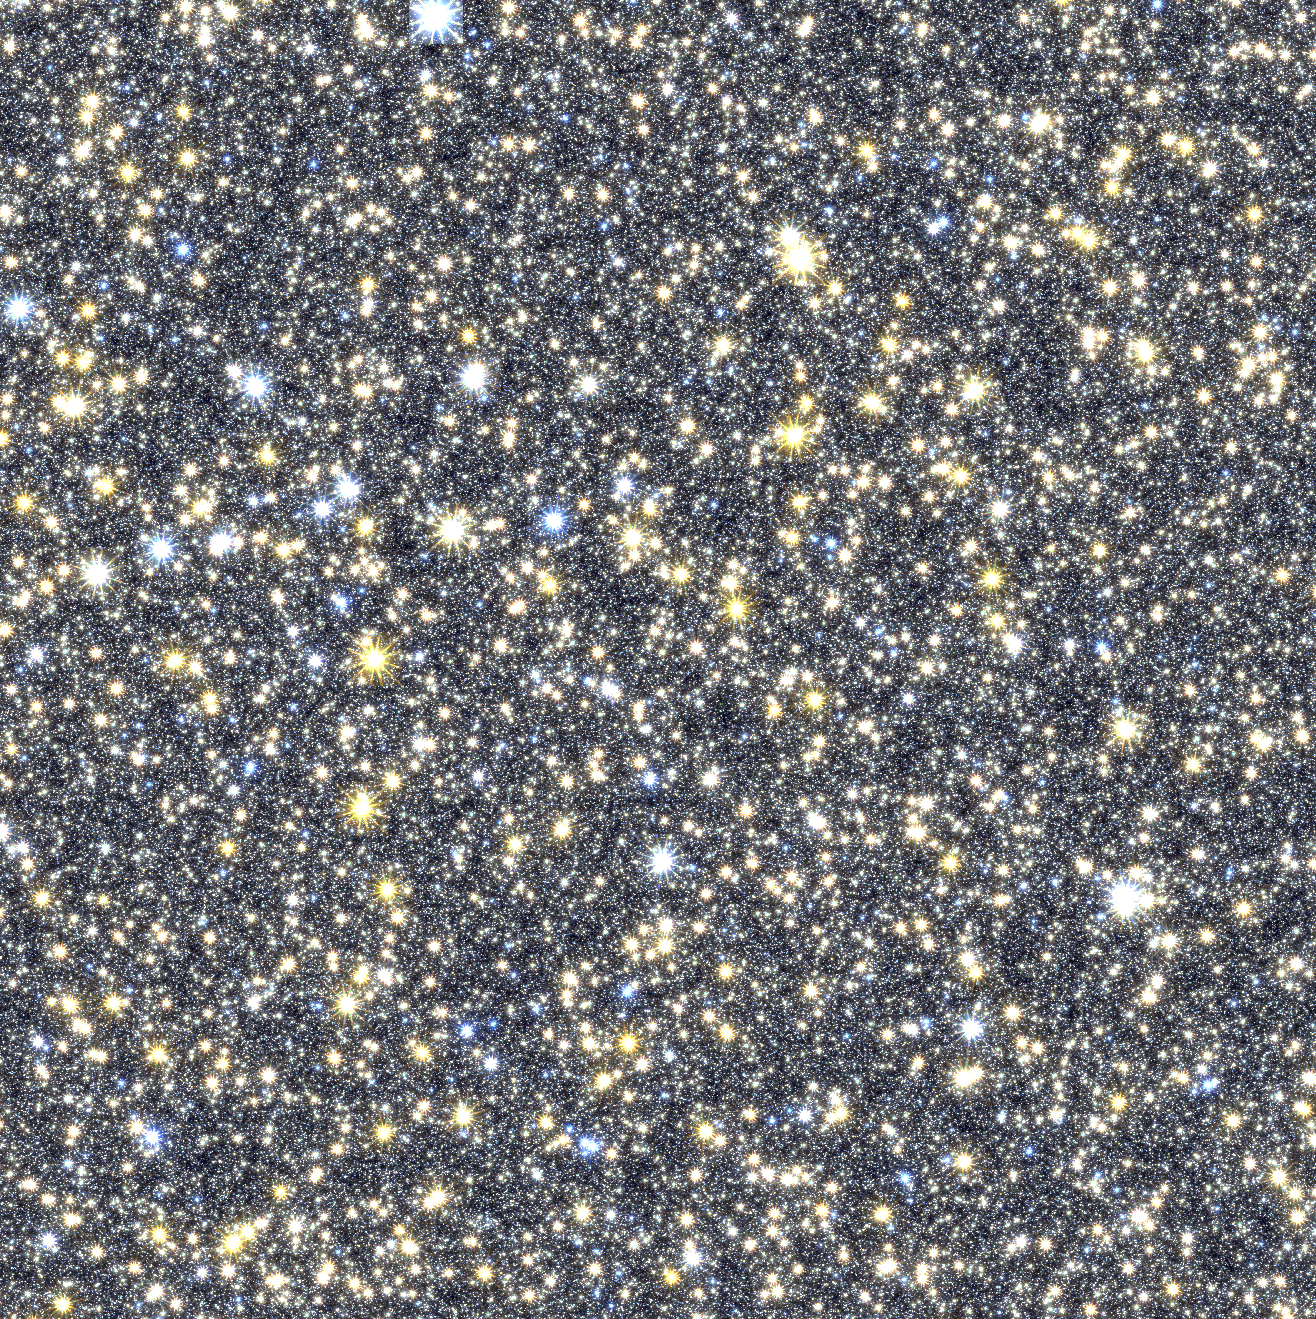
A simulated image of Roman’s observations toward the center of our galaxy, spanning only less than 1 percent of the total area of Roman’s galactic bulge time-domain survey. The simulated stars were drawn from the Besançon Galactic Model.
Credit: Matthew Penny (Louisiana State University)
“The stars in the bulge and center of our galaxy are unique and not yet well understood,” Huber said. “The data from this survey will allow us to measure how old these stars are and how they fit into the formation history of our Milky Way galaxy.”
Roman’s observing strategy in the Galactic Bulge Time-Domain Survey, as well as the High-Latitude Time-Domain Survey and the High-Latitude Wide-Area Survey, will allow astronomers to maximize scientific output, all with one telescope.
Abundance of data to explore
Roman will observe hundreds of millions of stars every 12 minutes during the survey period, providing an unprecedented volume of data for astronomers to parse through.
The Roman Science Support Center at Caltech/IPAC in Pasadena, California, will be responsible for the high-level science data processing for the Galactic Bulge Time Domain Survey, including exoplanet microlensing and general community outreach for Roman exoplanet science. The Science Support Center’s monitoring of these stars has been automated to detect microlensing and variable events within the data. This helps scientists understand features like how frequently a star’s brightness is changing, or if there are planets lurking near the lensed stars, or other sources of variability. The number of stars and frequency of the observations make the Roman data an ideal dataset for finding such sources.
All Roman observations will be made publicly available after a short processing period. The mission is scheduled to launch no later than May 2027, with the team on track for launch in fall 2026.
The Nancy Grace Roman Space Telescope is managed at NASA’s Goddard Space Flight Center in Greenbelt, Maryland, with participation by NASA’s Jet Propulsion Laboratory in Southern California; Caltech/IPAC in Pasadena, California; the Space Telescope Science Institute in Baltimore; and a science team comprising scientists from various research institutions. The primary industrial partners are BAE Systems Inc. in Boulder, Colorado; L3Harris Technologies in Rochester, New York; and Teledyne Scientific & Imaging in Thousand Oaks, California.
This animation illustrates the concept of gravitational microlensing. When one star in the sky appears to pass nearly in front of another, the light rays of ...
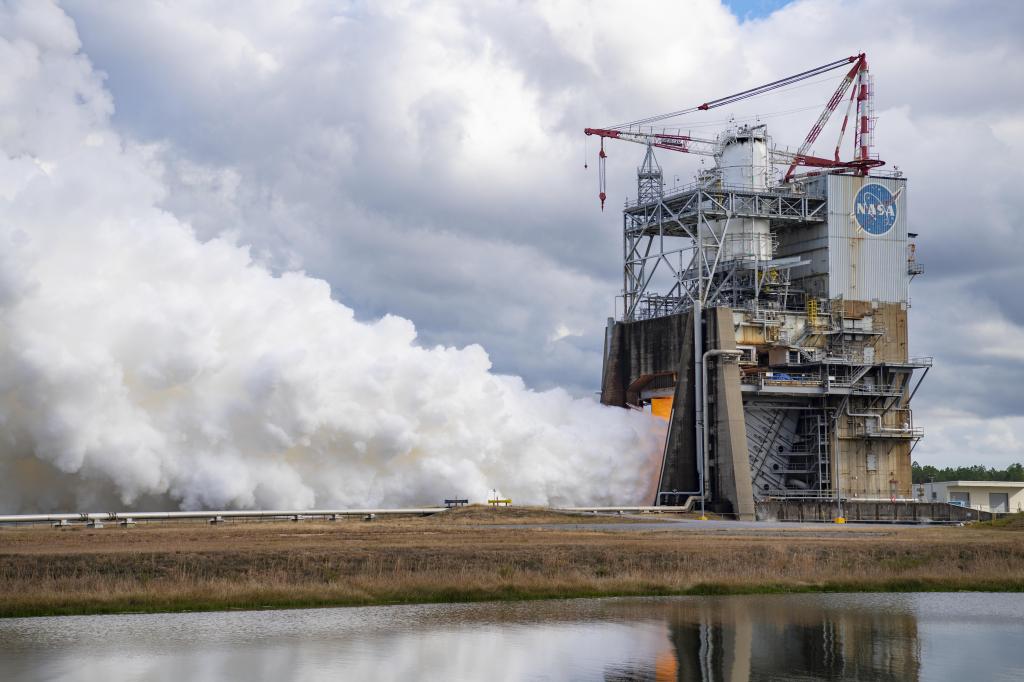
NASA conducts a hot fire of RS-25 engine No. 2063 on the Fred Haise Test Stand at NASA’s Stennis Space Center near Bay St. Louis, Mississippi, on Jan. 22, 2026.
NASA/Chris Russell
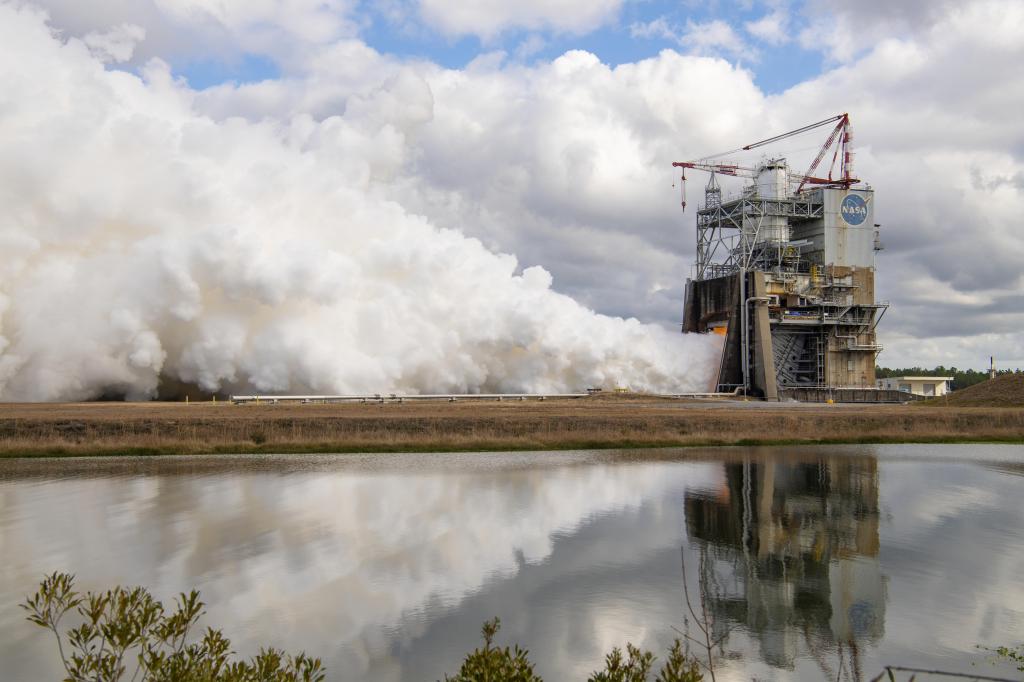
NASA conducts a hot fire of RS-25 engine No. 2063 on the Fred Haise Test Stand at NASA’s Stennis Space Center near Bay St. Louis, Mississippi, on Jan. 22, 2026.
NASA/Chris Russell
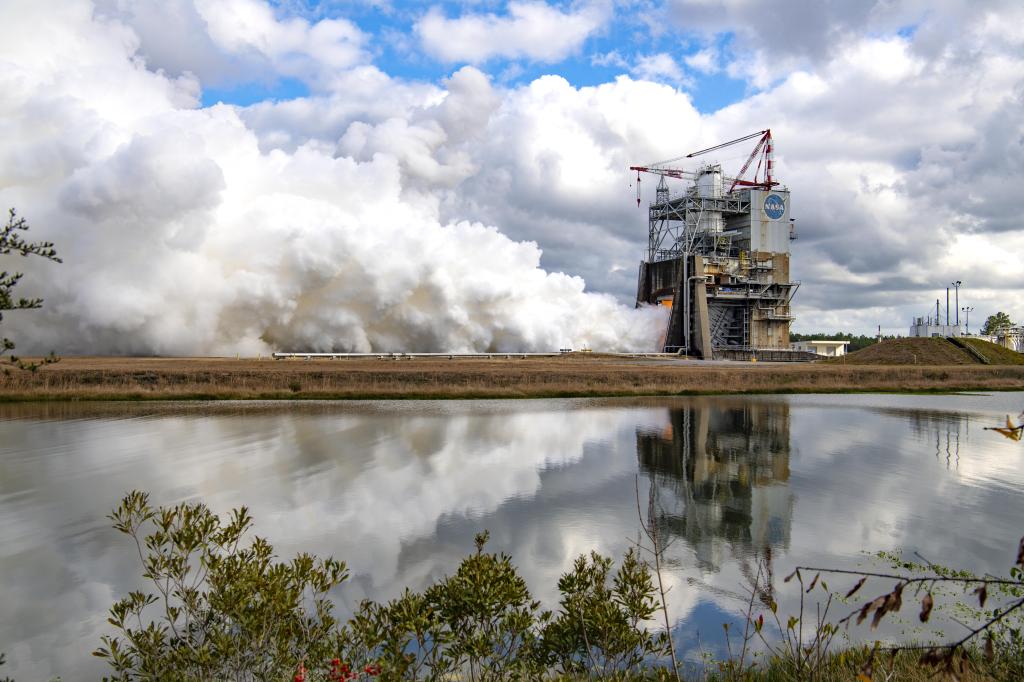
NASA conducts a hot fire of RS-25 engine No. 2063 on the Fred Haise Test Stand at NASA’s Stennis Space Center near Bay St. Louis, Mississippi, on Jan. 22, 2026.
NASA/Chris Russell
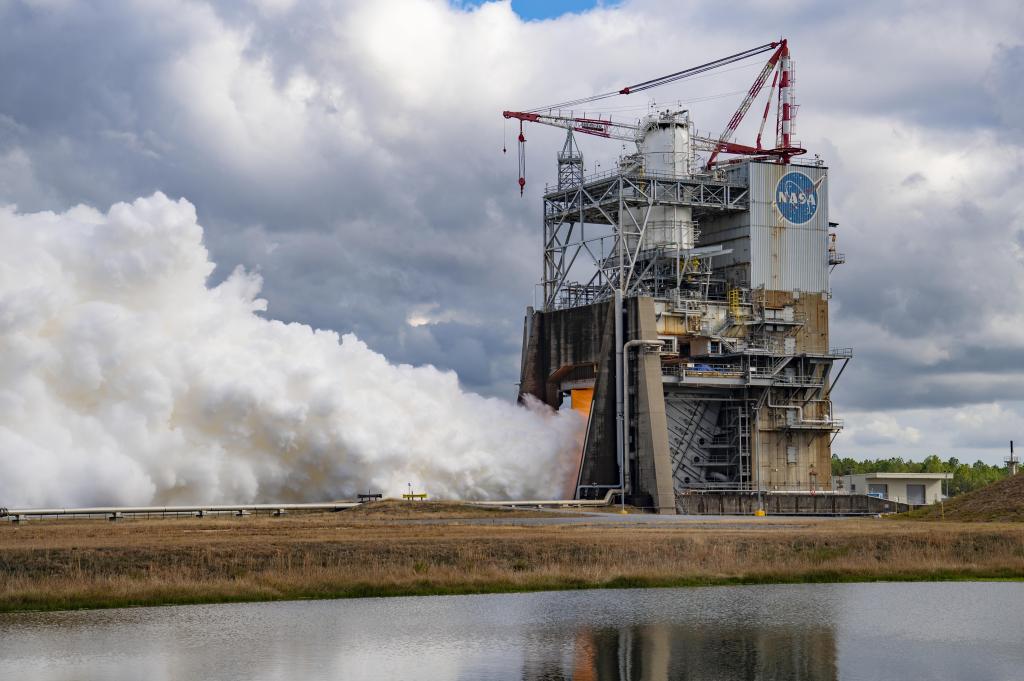
NASA conducts a hot fire of RS-25 engine No. 2063 on the Fred Haise Test Stand at NASA’s Stennis Space Center near Bay St. Louis, Mississippi, on Jan. 22, 2026.
NASA/Chris Russell
NASA successfully conducted a hot fire of RS-25 engine No. 2063 on Jan. 22 at the Fred Haise Test Stand at NASA’s Stennis Space Center near Bay St. Louis, Mississippi, clearing the way for the engine to be installed for the agency’s Artemis IV mission.
The RS-25 engines help power NASA’s SLS (Space Launch System) rocket that will carry astronauts to the Moon under the Artemis campaign.
Engine No. 2063 originally was installed on the SLS core stage for the Artemis II mission but was removed in 2025 after engineers discovered a hydraulic leak on the engine’s main oxidizer valve actuator, which controls propellant flow into the engine combustion chamber.
Following standard NASA procedures, teams removed the engine from the core stage and replaced the actuator.
Because NASA requires any significantly modified or repaired engine to undergo hot fire testing before flight, teams at NASA Stennis fired the engine for five minutes (300 seconds), at up to 109% of its rated power level in a test known as a confidence test that demonstrates the engine is ready for flight.
The test was conducted by a team of operators from NASA, L3Harris Technologies, and Sierra Lobo, Inc., the NASA Stennis test operations contractor. NASA Stennis provides critical data to L3Harris, the prime engines contractor for the SLS rocket.
With the successful test complete, engine No. 2063 is scheduled to be installed on the SLS core stage for Artemis IV. All RS-25 engines for NASA’s Artemis missions are tested and proven flightworthy at NASA Stennis before flight.
NASA is targeting as soon as February to send four astronauts around the Moon and back on Artemis II, the first crewed mission under the Artemis campaign. During launch, the SLS rocket will use four RS-25 engines, along with a pair of solid rocket boosters, to help lift the Orion spacecraft and the crew away from Earth using more than 8.8 million pounds of thrust.
Under the Artemis campaign, NASA is returning humans to the Moon for economic benefits, scientific discovery, and to prepare for crewed missions to Mars.
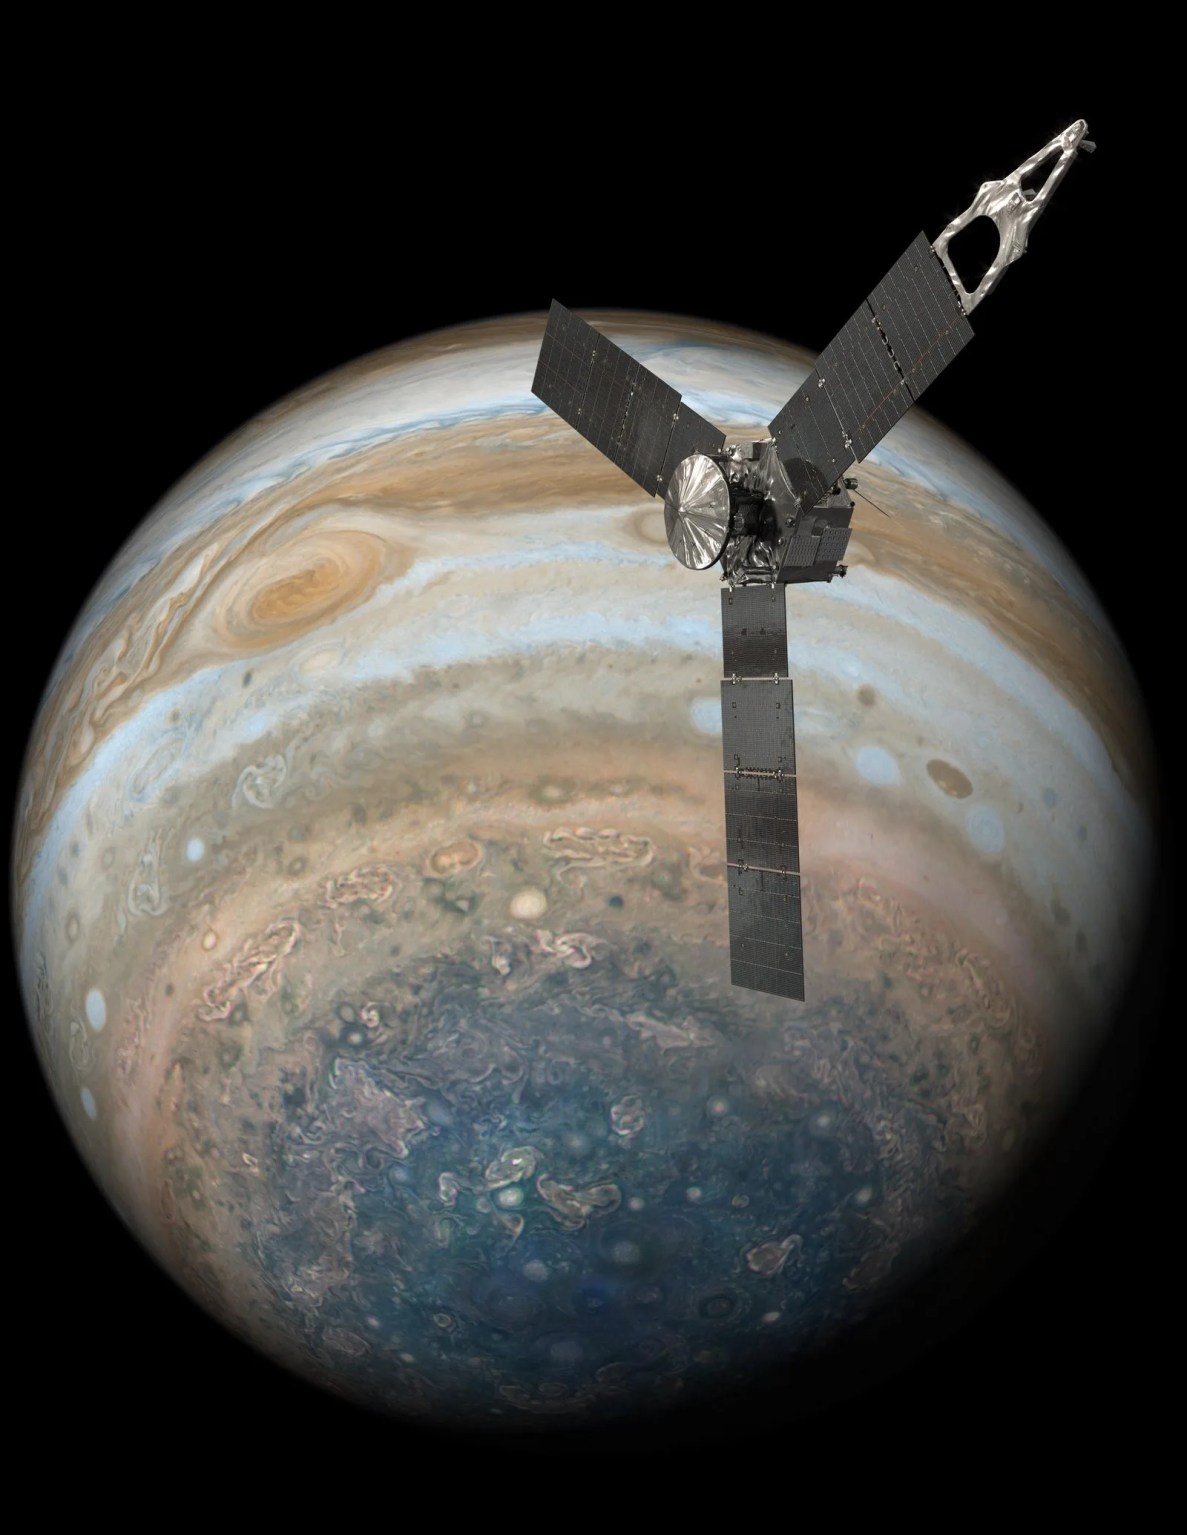
The operations team determined the issue arose when TESS slewed to point at a target, but its solar panels did not rotate to remain pointed at the Sun relative to the spacecraft’s new direction. The off-Sun angle of the solar arrays resulted in a slow discharge of TESS’s batteries. As designed and planned for in situations of this kind, the satellite entered a safe mode after detecting the low-power condition.
At the time of the safe mode, TESS was conducting a week-long observation of comet 3I/ATLAS and resumed those observations Jan. 18. Data from TESS is publicly available through archives at the Mikulski Archive for Space Telescopes.
May 7, 2024
NASA’s TESS Returns to Science Operations
NASA’s TESS (Transiting Exoplanet Survey Satellite) returned to science operations May 3 and is once again making observations. The satellite went into safe mode April 23 following a separate period of down time earlier that month.
The operations team determined this latest safe mode was triggered by a failure to properly unload momentum from the spacecraft’s reaction wheels, a routine activity needed to keep the satellite properly oriented when making observations. The propulsion system, which enables this momentum transfer, had not been successfully repressurized following a prior safe mode event April 8. The team has corrected this, allowing the mission to return to normal science operations. The cause of the April 8 safe mode event remains under investigation.
The TESS mission is a NASA Astrophysics Explorer operated by the Massachusetts Institute of Technology in Cambridge, Massachusetts. Launched in 2018, TESS has been scanning almost the entire sky looking for planets beyond our solar system, known as exoplanets. The TESS mission has also uncovered other cosmic phenomena, including star-shredding black holes and stellar oscillations. Read more about TESS discoveries at nasa.gov/tess.
April 24, 2024
NASA’s Planet-Hunting Satellite Temporarily on Pause
During a routine activity April 23, NASA’s TESS (Transiting Exoplanet Survey Satellite) entered safe mode, temporarily suspending science operations. The satellite scans the sky searching for planets beyond our solar system.
The team is working to restore the satellite to science operations while investigating the underlying cause. NASA also continues investigating the cause of a separate safe mode event that took place earlier this month, including whether the two events are connected. The spacecraft itself remains stable.
The TESS mission is a NASA Astrophysics Explorer operated by the Massachusetts Institute of Technology in Cambridge, Massachusetts. Launched in 2018, TESS recently celebrated its sixth anniversary in orbit. Visit nasa.gov/tess for updates.
April 17, 2024
NASA’s TESS Returns to Science Operations
NASA’s TESS (Transiting Exoplanet Survey Satellite) has returned to work after science observations were suspended on April 8, when the spacecraft entered into safe mode. All instruments are powered on and, following the successful download of previously collected science data stored in the mission’s recorder, are now making new science observations.
Analysis of what triggered the satellite to enter safe mode is ongoing.
The TESS mission is a NASA Astrophysics Explorer operated by MIT in Cambridge, Massachusetts. Launched in 2018, TESS has been scanning almost the entire sky looking for planets beyond our solar system, known as exoplanets. The TESS mission has also uncovered other cosmic phenomena, including star-shredding black holes and stellar oscillations. Read more about TESS discoveries at nasa.gov/tess.
NASA’s TESS (Transiting Exoplanet Survey Satellite) entered into safe mode April 8, temporarily interrupting science observations. The team is investigating the root cause of the safe mode, which occurred during scheduled engineering activities. The satellite itself remains in good health.
The team will continue investigating the issue and is in the process of returning TESS to science observations in the coming days.
The TESS mission is a NASA Astrophysics Explorer operated by MIT in Cambridge, Massachusetts. Launched in 2018, TESS has been scanning almost the entire sky looking for planets beyond our solar system, known as exoplanets. The TESS mission has also uncovered other cosmic phenomena, including star-shredding black holes and stellar oscillations. Read more about TESS discoveries at nasa.gov/tess.
A winter chill descended on the Great Lakes region of North America in January 2026. Some of the effects were apparent in this satellite image as newly formed lake ice and a fresh layer of snow. The image, acquired by the MODIS (Moderate Resolution Imaging Spectroradiometer) instrument on NASA’s Terra satellite, shows the region on the morning of January 20, 2026.
In the days prior, a winter storm blanketed many parts of western Michigan near the lake with nearly a foot of snow, according to the National Weather Service. West of Walker, snowfall totals surpassed that amount, reaching nearly 14 inches (36 centimeters). The storm’s effects extended beyond Michigan as well, including blizzard conditions in parts of Ontario east of Lake Huron.
Lake effect snow is common in the Great Lakes area during late fall and winter, occurring when cold air moves over relatively warm, unfrozen water. As the air picks up heat and moisture, it rises to form narrow cloud bands that can produce heavy snowfall.
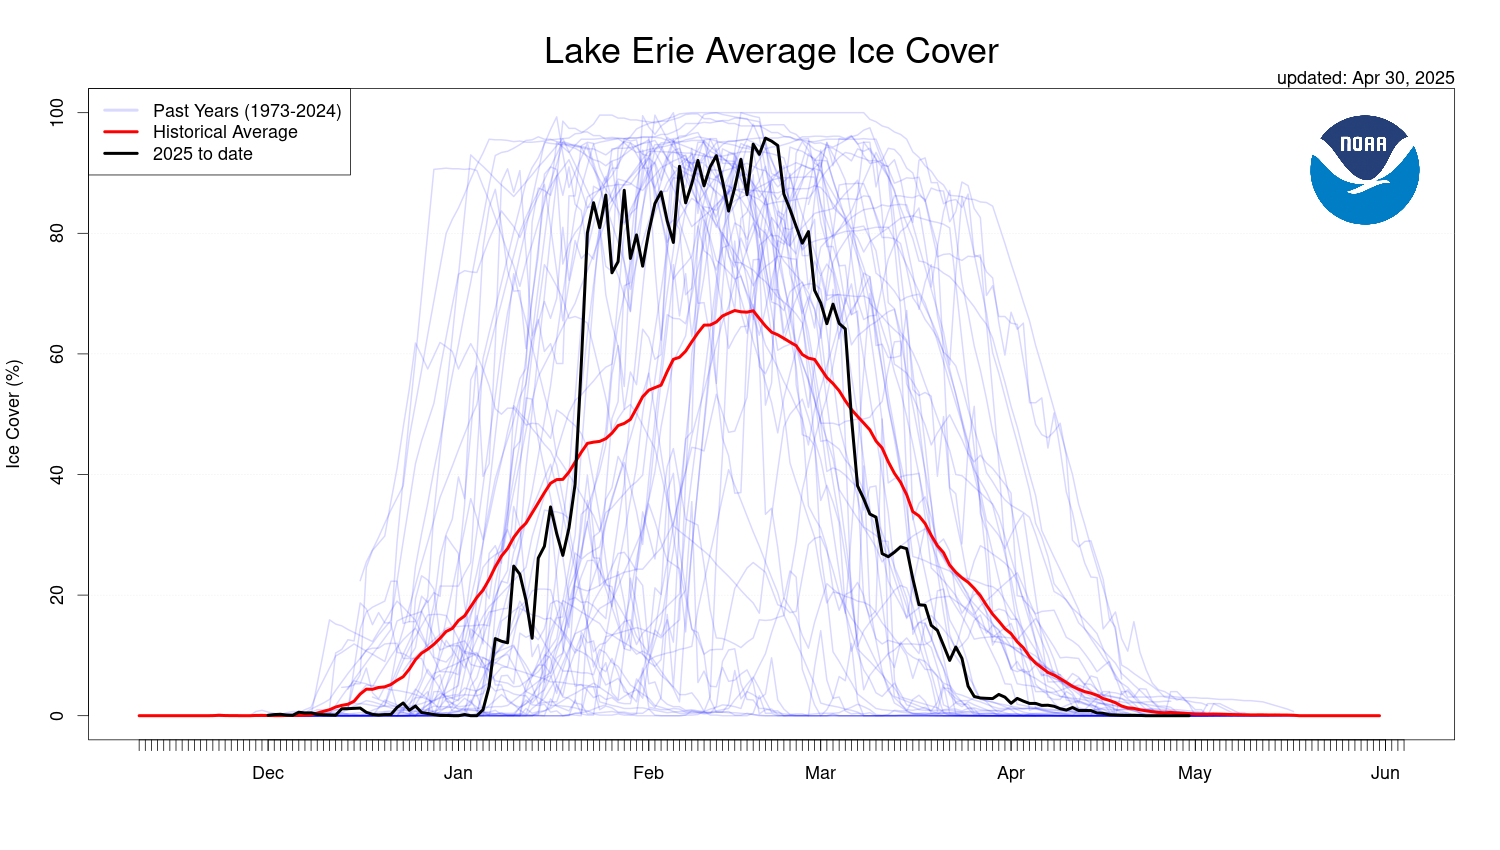
The air over Lake Erie was still moist enough for clouds to form, though the amount of open water on this lake has decreased sharply in recent days. Around mid-month, during a period of unseasonably warm air temperatures, ice coverage dropped to cover about 2 percent of the lake, according to the NOAA Great Lakes Environmental Research Laboratory. It then spiked to nearly 85 percent on January 21 after temperatures plummeted.
The frigid temperatures were brought about by an Arctic cold front that moved across the region. In Cleveland, for instance, the weather service issued a cold weather advisory on January 19 for wind chills as low as minus 15 to 20 degrees Fahrenheit. On that day, even colder wind chills were reported in the area around Chicago. Forecasts called for another round of cold Arctic air to spill over the Great Plains and Eastern U.S. over the coming weekend, accompanied by heavy snow.
NASA Earth Observatory image by Michala Garrison, using MODIS data from NASA EOSDIS LANCE and GIBS/Worldview. Story by Kathryn Hansen.
The Space Shuttle Challenger Memorial is seen during a wreath laying ceremony that was part of NASA’s Day of Remembrance, Thursday, Jan. 22, 2026, at Arlington National Cemetery in Arlington, Va. Wreaths were laid in memory of those men and women who lost their lives in the quest for space exploration.
Each January, NASA pauses to honor members of the NASA family who lost their lives while furthering the cause of exploration and discovery, including the crews of Apollo 1 and space shuttles Challenger and Columbia. We celebrate their lives, their bravery, and contributions to human spaceflight.
This letter from SARA is to issue a waiver for NASA grantees attending LPSC2026, allowing them to be reimbursed out of their grants for their actual lodging, although it’s expected to be above the approved GSA amount. This waiver does not supersede the travel policy of your institution if it is more restrictive. Note: I have specified grants (including cooperative agreements). This may also apply to those traveling on NASA contracts, but they should communicate with their contracting officers.
The host hotel for the 57th Lunar and Planetary Science Conference on March 16–20, 2026, is The Woodlands Waterway Marriott Hotel and Convention Center. Hotel information for this conference may be found at https://www.hou.usra.edu/meetings/lpsc2026/plan/
The GSA-allowed daily lodging expense for March 2026 for zip code 77380 (for The Woodlands Waterway Marriott Hotel and Convention Center) is $128 per night. Many of the hotels may be significantly higher than the GSA allowed rate of $128. Grantee travelers may need a waiver to cover lodging in excess of the GSA value, depending on the travel policy of your organization. This waiver does not supersede the travel policy of your institution if it is more restrictive.
By the power vested in me by the NSSC to issue approval of the actual lodging costs for a conference in “bulk” instead of individual approvals, I hereby affirm that for the 57th Lunar and Planetary Science Conference NASA, SMD grants may be charged up to $276/night plus taxes and fees, consistent with the average actual cost of the conference hotel, even though this exceeds the $128 allotted for lodging by GSA for The Woodlands for March 2026.
NASA AI Model That Found 370 Exoplanets Now Digs Into TESS Data
This artist’s impression shows the star TRAPPIST-1 with two planets transiting across it. ExoMiner++, a recently updated open-source software package developed by NASA, uses artificial intelligence to help find new transiting exoplanets in data collected by NASA’s missions.
NASA, ESA, and G. Bacon (STScI)
Scientists have discovered over 6,000 planets that orbit stars other than our Sun, known as exoplanets. More than half of these planets were discovered thanks to data from NASA’s retired Kepler mission and NASA’s current TESS (Transiting Exoplanet Survey Satellite) mission. However, the enormous treasure trove of data from these missions still contains many yet-to-be-discovered planets. All of the data from both missions is publicly available in NASA archives, and many teams around the world have used that data to find new planets using a number of techniques.
In 2021, a team from NASA’s Ames Research Center in California’s Silicon Valley created ExoMiner, a piece of open-source software that used artificial intelligence (AI) to validate 370 new exoplanets from Kepler data. Now, the team has created a new version of the model trained on both Kepler and TESS data, called ExoMiner++.
Artist’s impression of NASA’s Transiting Exoplanet Survey Satellite (TESS), which launched in 2018 and has discovered nearly 700 exoplanets so far. NASA’s ExoMiner++ software is working toward identifying more planets in TESS data using artificial intelligence.
NASA’s Goddard Space Flight Center
The new algorithm, which is discussed in a recent paper published in the Astronomical Journal, identified 7,000 targets as exoplanet candidates from TESS on an initial run. An exoplanet candidate is a signal that is likely to be a planet but requires follow-up observations from additional telescopes to confirm.
ExoMiner++ can be freely downloaded from GitHub, allowing any researcher to use the tool to hunt for planets in TESS’s growing public data archive.
“Open-source software like ExoMiner accelerates scientific discovery,” said Kevin Murphy, NASA’s chief science data officer at NASA Headquarters in Washington. “When researchers freely share the tools they’ve developed, it lets others replicate the results and dig deeper into the data, which is why open data and code are important pillars of gold-standard science.”
ExoMiner++ sifts through observations of possible transits to predict which ones are caused by exoplanets and which ones are caused by other astronomical events, such as eclipsing binary stars. “When you have hundreds of thousands of signals, like in this case, it’s the ideal place to deploy these deep learning technologies,” said Miguel Martinho, a KBR employee at NASA Ames who serves as the co-investigator for ExoMiner++.
This animation shows a graph of the tiny amount of dimming that takes place when a planet passes in front of its host star. NASA’s Kepler and TESS missions spot exoplanets by looking for these transits. ExoMiner++ uses artificial intelligence to help separate real planet transits from other, similar-looking astronomical phenomena.
NASA’s Goddard Space Flight Center
Kepler and TESS operate differently — TESS is surveying nearly the whole sky, mainly looking for planets transiting nearby stars, while Kepler looked at a small patch of sky more deeply than TESS. Despite these different observing strategies, the two missions produce compatible datasets, allowing ExoMiner++ to train on data from both telescopes and deliver strong results. “With not many resources, we can make a lot of returns,” said Hamed Valizadegan, the project lead for ExoMiner and a KBR employee at NASA Ames.
The next version of ExoMiner++ will improve the usefulness of the model and inform future exoplanet detection efforts. While ExoMiner++ can currently flag planet candidates when given a list of possible transit signals, the team is also working on giving the model the ability to identify the signals themselves from the raw data.
Open-source science and open-source software are why the exoplanet field is advancing as quickly as it is.
Jon Jenkins
Exoplanet Scientist, NASA Ames Research Center
In addition to the ongoing stream of data from TESS, future exoplanet-hunting missions will give ExoMiner users plenty more data to work with. NASA’s upcoming Nancy Grace Roman Space Telescope will capture tens of thousands of exoplanet transits — and, like TESS data, Roman data will be freely available in line with NASA’s commitment to Gold Standard Science and sharing data with the public. The advances made with the ExoMiner models could help hunt for exoplanets in Roman data, too.
“The open science initiative out of NASA is going to lead to not just better science, but also better software,” said Jon Jenkins, an exoplanet scientist at NASA Ames. “Open-source science and open-source software are why the exoplanet field is advancing as quickly as it is.”
NASA’s Office of the Chief Science Data Officer leads the open science efforts for the agency. Public sharing of scientific data, tools, research, and software maximizes the impact of NASA’s science missions. To learn more about NASA’s commitment to transparency and reproducibility of scientific research, visit science.nasa.gov/open-science. To get more stories about the impact of NASA’s science data delivered directly to your inbox, sign up for the NASA Open Science newsletter.
By Lauren Leese Web Content Strategist for the Office of the Chief Science Data Officer
It has been an eventful few months for the Northern Hemisphere atmosphere. An unusually early sudden stratospheric warming episode in late November appears to have factored into a weakened and distorted polar vortex at times in December, likely causing extra waviness in the polar jet stream. This helped fuel extensive intrusions of frigid air into the mid-latitudes, contributing to cold snaps in North America, Europe, and Asia, and priming the atmosphere for disruptive winter storms in January.
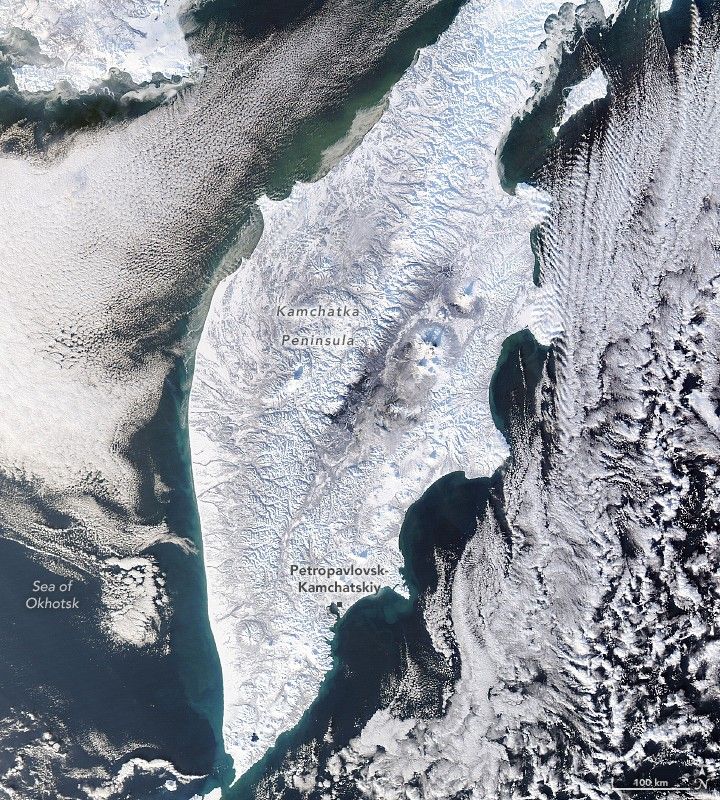
Russia’s Kamchatka Peninsula has been among the areas hit hard by cold and snowy weather in December and January. More than 2 meters (7 feet) of snow fell in the first two weeks of January, following 3.7 meters in December, according to news reports. Together, these totals make it one of the snowiest periods the peninsula has seen since the 1970s, according to Kamchatka’s Hydrometeorology Center. The onslaught brought Petropavlovsk-Kamchatsky, the regional capital, to a standstill, with reports of large snowdrifts burying cars and blocking access to buildings and infrastructure.
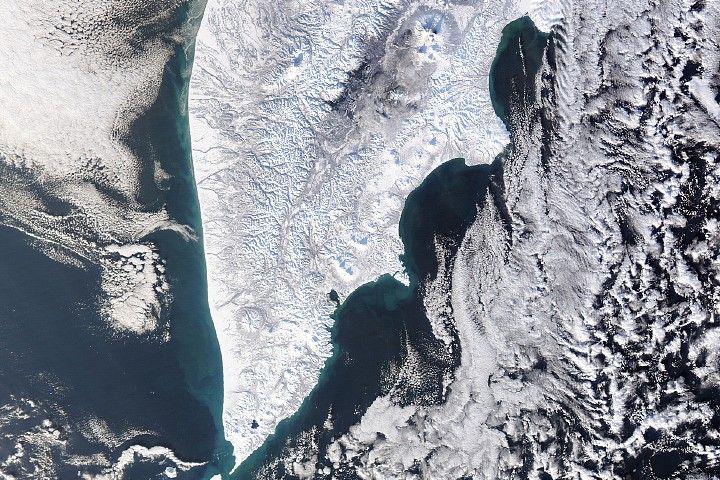
This image, acquired by the MODIS (Moderate Resolution Imaging Spectroradiometer) instrument on NASA’s Aqua satellite, shows fresh snow blanketing the peninsula’s rugged terrain on January 17, 2026. Several circular, snow-covered volcanic peaks are visible across the peninsula, one of the most volcanically active areas in the world. Petropavlovsk-Kamchatsky, home to more than 160,000 people, sits along Avacha Bay—a deep, sheltered bay formed by a combination of tectonic, volcanic, and glacial activity.
NASA Earth Observatory image by Lauren Dauphin, using MODIS data from NASA EOSDIS LANCE and GIBS/Worldview. Story by Adam Voiland.
The peninsula in eastern Siberia features rugged terrain with towering, snow-covered peaks and cloud-filled valleys stretching between the Pacific Ocean…


