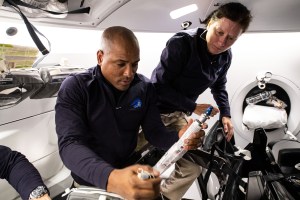
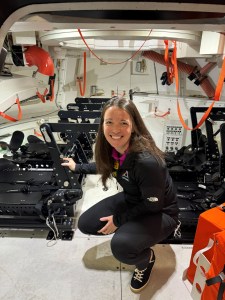
Clockwise from left, JAXA (Japan Aerospace Exploration Agency) astronaut Kimiya Yui and NASA astronauts Jonny Kim, Zena Cardman, and Mike Fincke pose for a playful portrait through a circular opening in a hatch thermal cover aboard the International Space Station on Sept. 18, 2025.
The cover provides micrometeoroid and orbital debris protection while maintaining cleanliness and pressure integrity in the vestibule between Northrop Grumman’s Cygnus XL cargo spacecraft and the orbital outpost. The opening allows for visual inspection of hatch alignment, access to the hatch handle or pressure equalization valve, and visibility for sensors or cameras during berthing operations.
Kim recently returned to Earth after 245 days in space aboard the orbital laboratory. Yui, Cardman, and Fincke remain aboard the space station, with Fincke as commander.
Preparations for Next Moonwalk Simulations Underway (and Underwater)
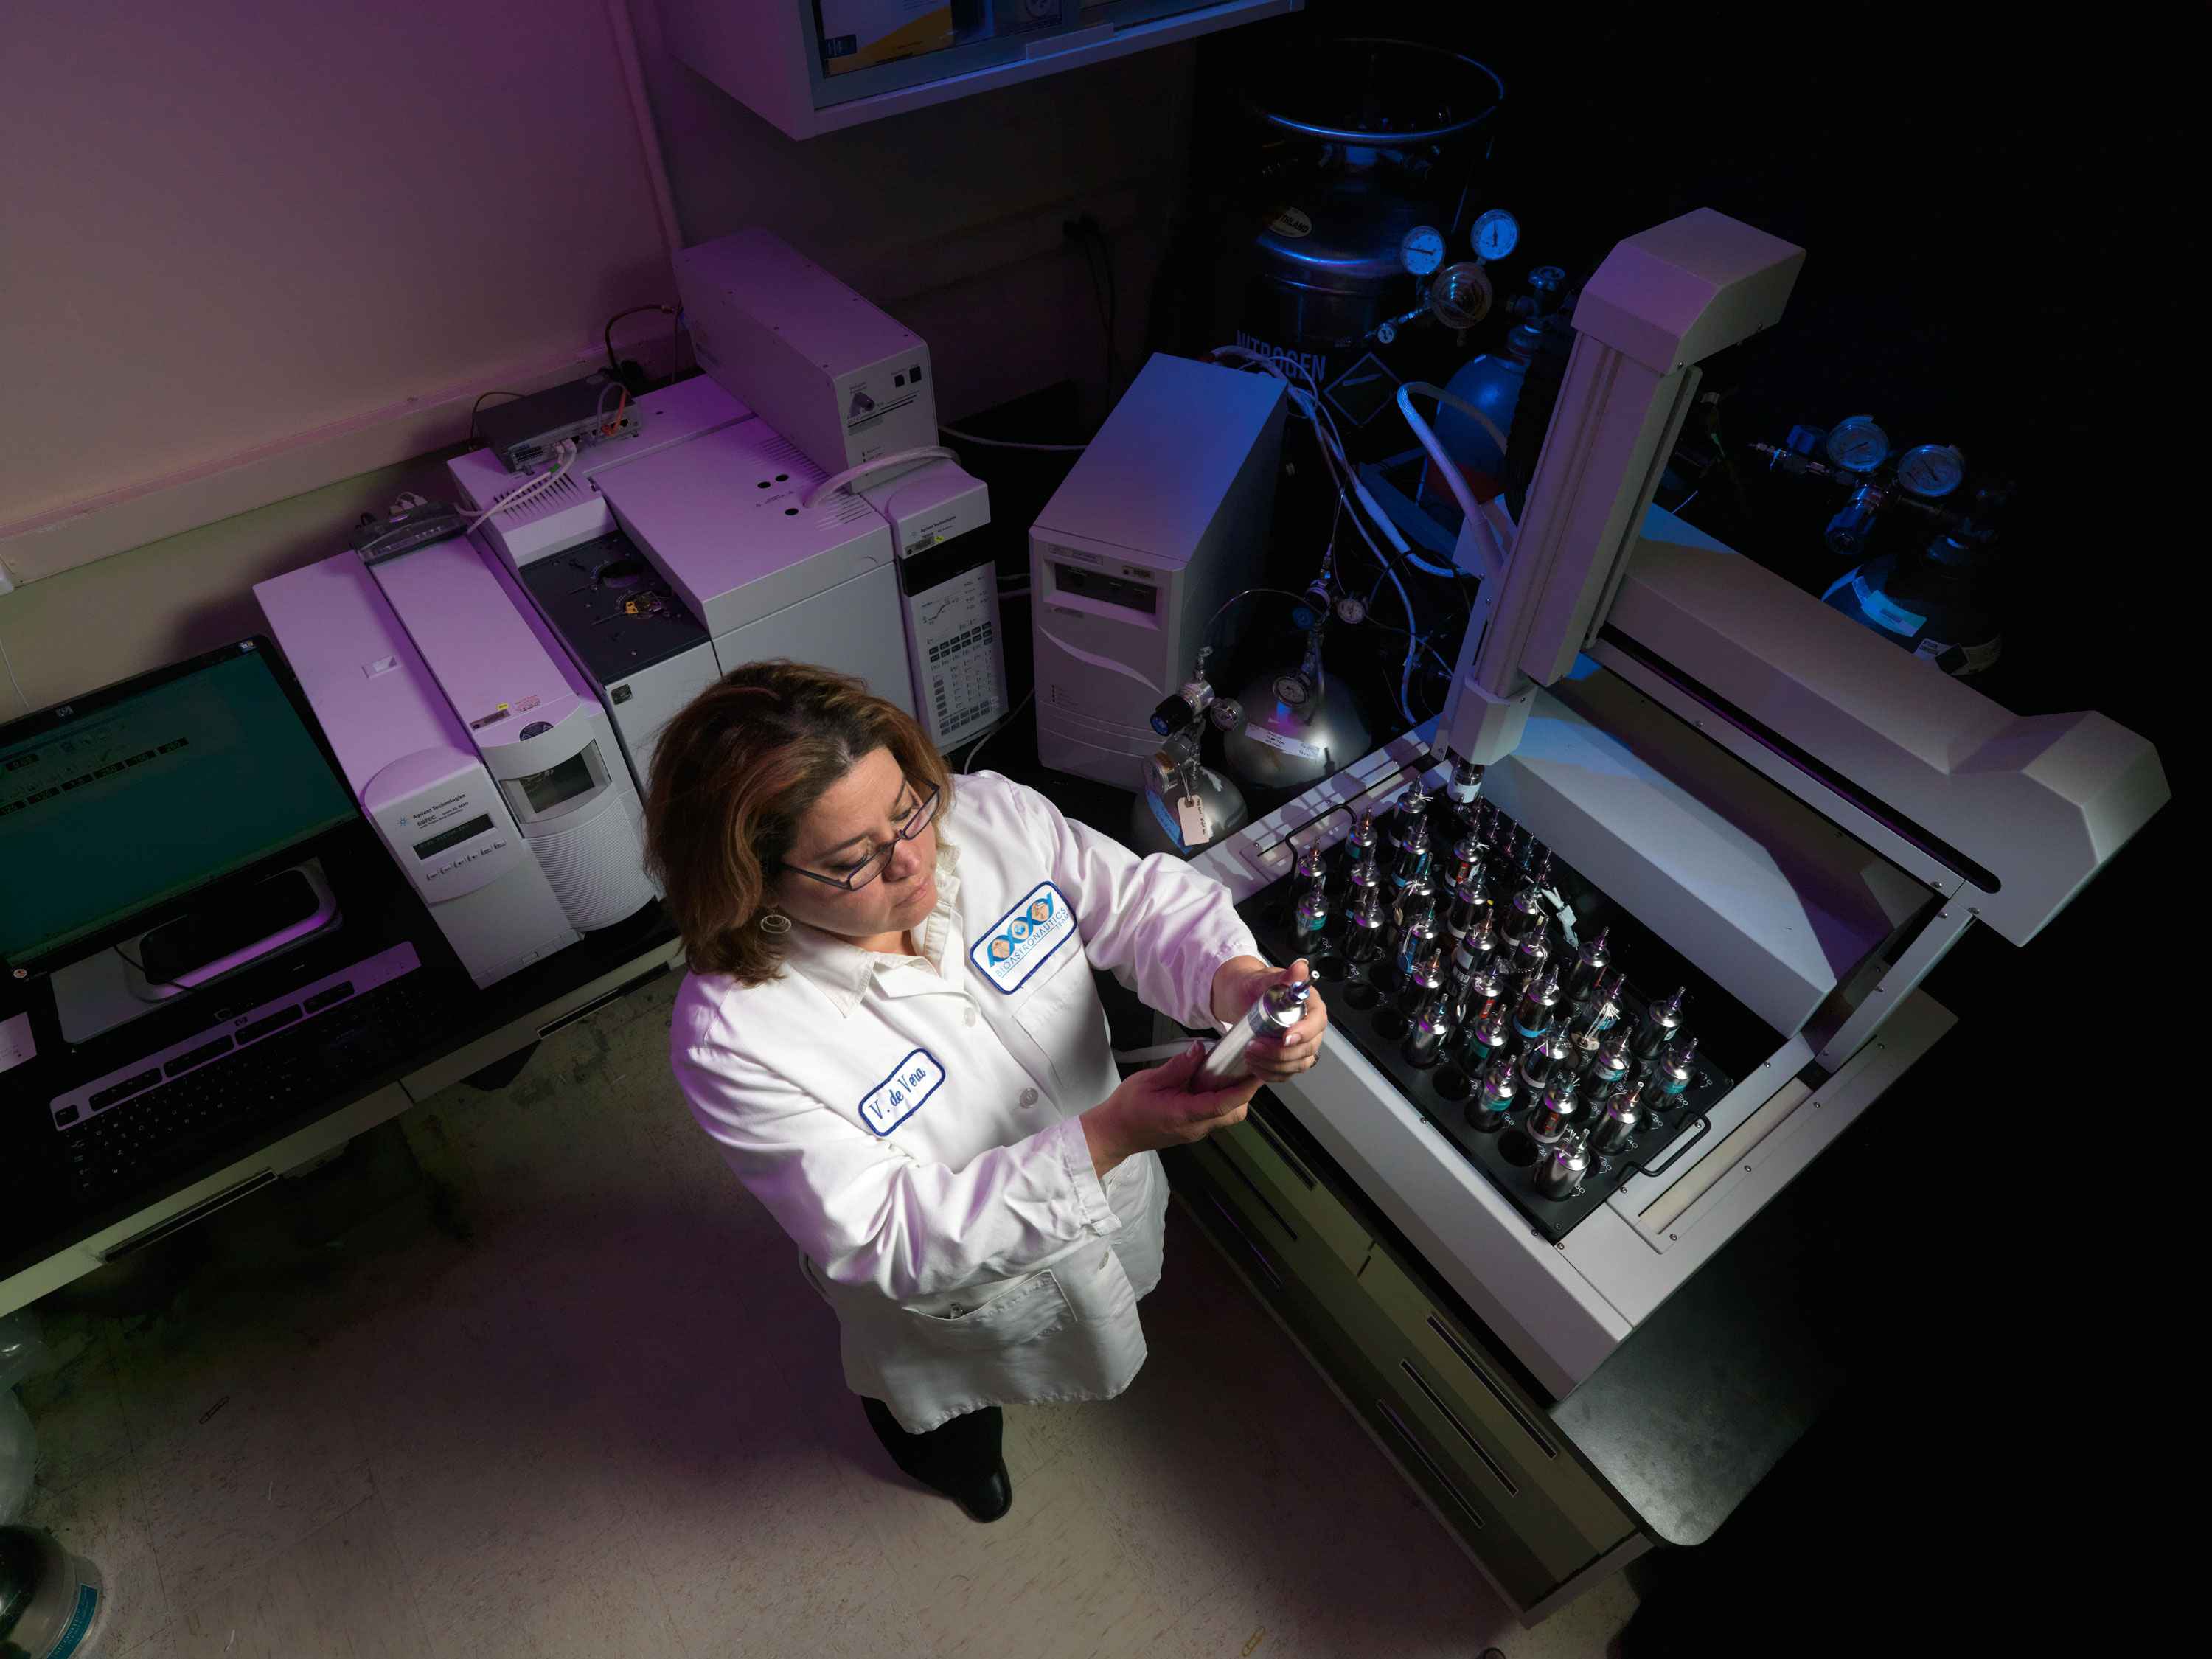
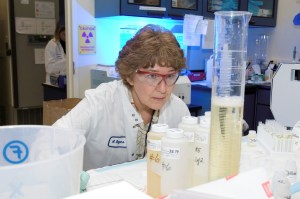
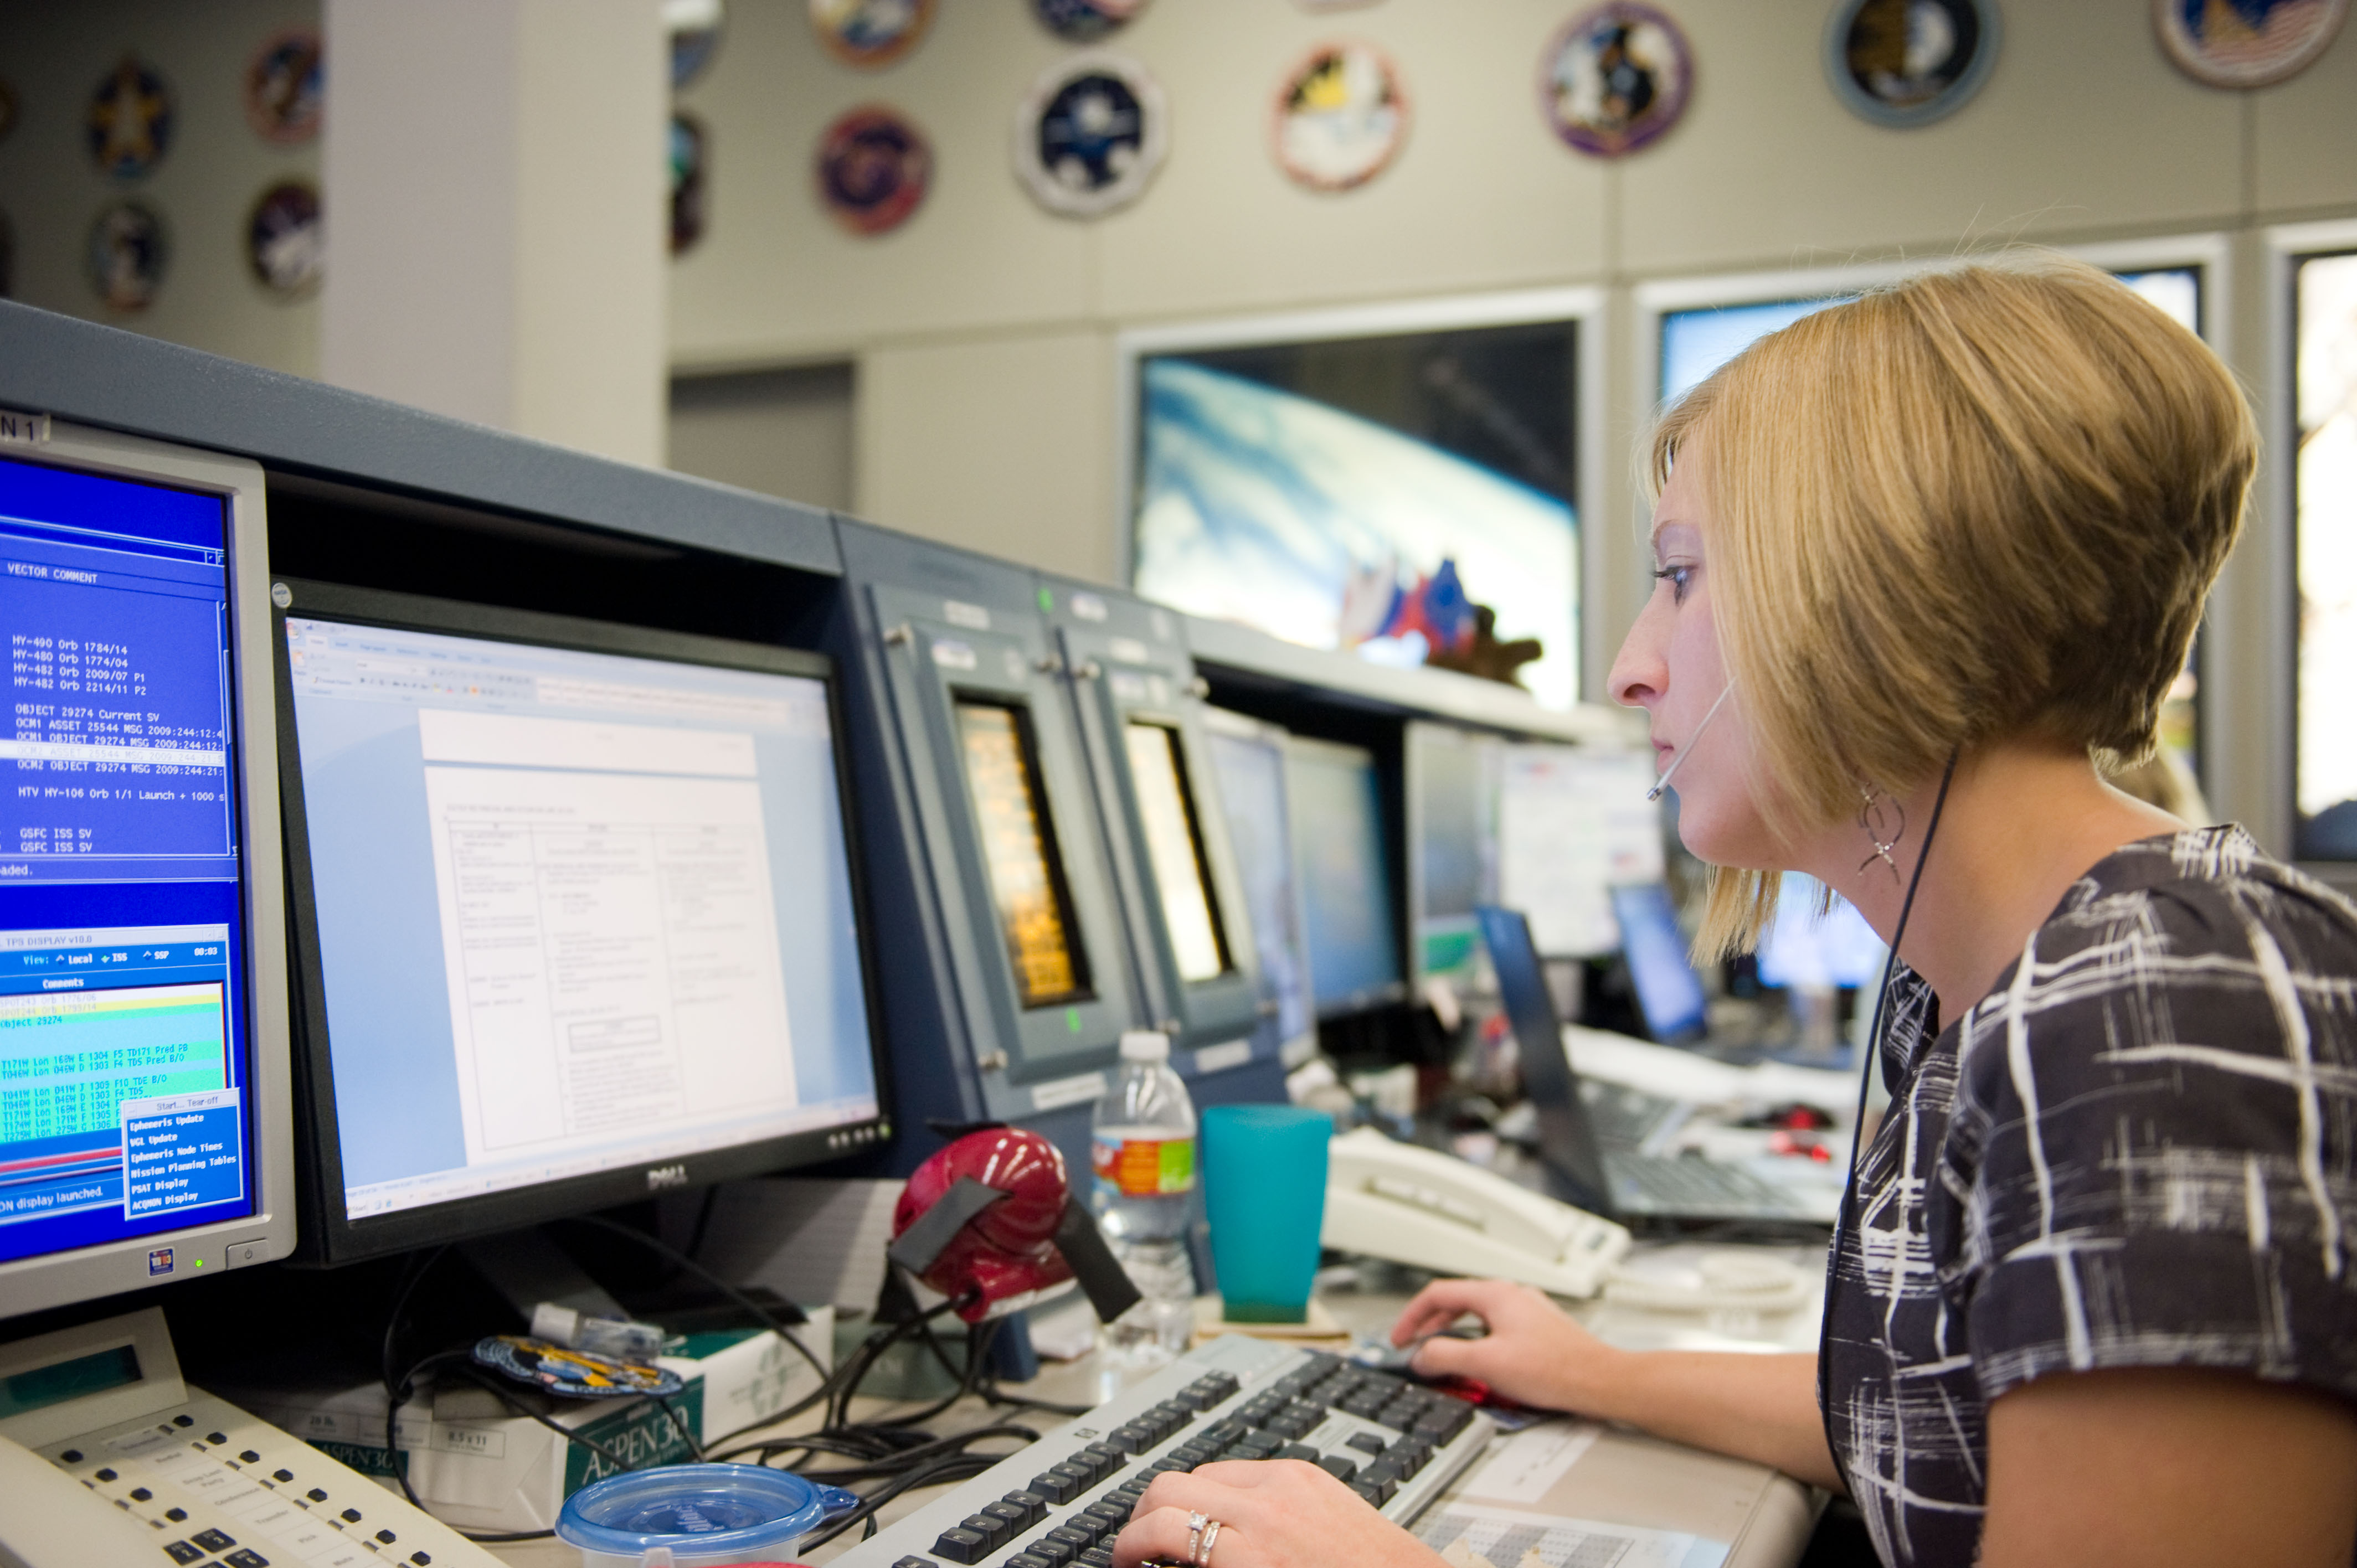
An environmental chemist at NASA JSC
NASA
Ensuring Astronaut Safety
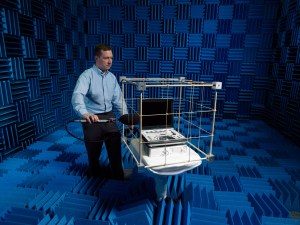
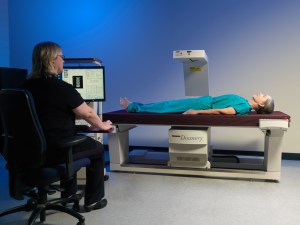
Achieving safe exploration of space in vehicles that rely upon closed environmental systems to recycle air and water to sustain life and are operated in extremely remote locations is a major challenge. The Toxicology and Environmental Chemistry (TEC) group at Johnson Space Center (JSC) is made up of 2 interrelated groups: Toxicology support and the Environmental Chemistry Laboratory. The scientists in both groups play an important role in ensuring that the crew of the ISS are breathing clean air and drinking clean water. Personnel within the TEC establish safe spacecraft environmental limits, monitor the air and water quality aboard current spacecraft (ISS and Commercial Crew and Cargo vehicles), and support technology advancements. The TEC employs in-flight monitoring capabilities as well as postflight sample analysis techniques to monitor the air and water quality from spaceflight.
Fun Fact: We are currently recovering 85% of the water from crew urine and turning it back into drinking water.
NASA
An Agency Resource
The Toxicology group at JSC serves as the NASA-wide resource for aspects of space toxicology and is responsible for several different duties that are focused on protecting crewmembers and spacecraft systems from toxic exposures in spaceflight. These include assessing chemical hazards for flight, establishing limits for contaminants in spacecraft air and water, assessing and evaluating environmental data from spacecraft in flight, and assessing the potential for off-gas products from new vehicles or modules. These assessments are documented in:
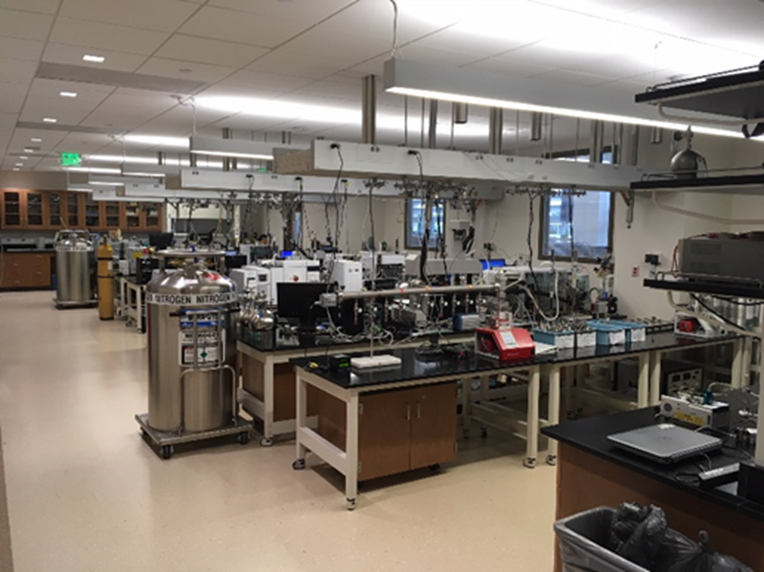
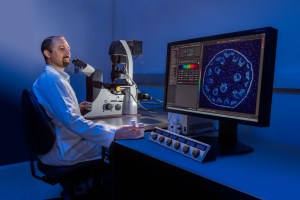
The Environmental Chemistry laboratory at JSC occupies approximately 6,000 sq. ft. of laboratory space in one of the newest buildings on site. This is a fully equipped environmental and analytical laboratory with analysts that have supported multiple human spaceflight programs and provided center support for both gas and liquid analysis. The work in the laboratories operates under an ISO 9001/AS9100-certified quality plan with dedicated and independent quality personnel.
Liquid chromatograph mass spectrometer.
NASA
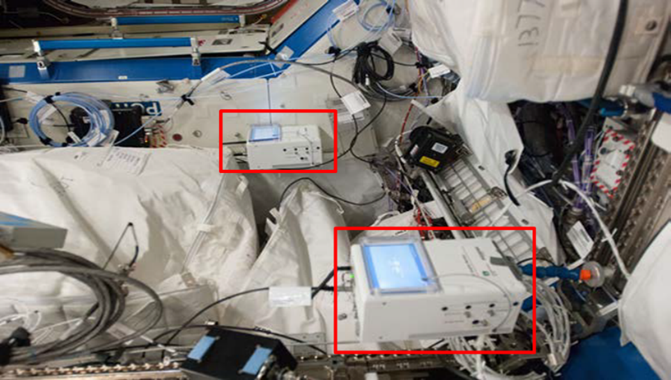
The Environmental Chemistry Laboratory monitors for contaminants in spacecraft air using both in-flight and post-flight methods. Onboard the International Space Station (ISS), 2 Air Quality Monitors (AQMs) use gas chromatography/differential mobility spectrometry to detect and quantify 23 target volatile organic compounds to provide near real-time insight into the status of the ISS atmosphere. Other real-time monitors supported by the Environmental Chemistry laboratory include the compound-specific analyzer-combustion products (CSA-CP), which use electrochemical sensors to analyze the atmosphere for the presence of compounds produced by fire, and the CO2 monitor, which uses non-dispersive infrared reflectance to monitor for the presence of elevated CO2. For detailed post-flight analysis in the Environmental Chemistry Laboratory, astronauts use grab sample containers to collect in-flight samples, which are then returned to JSC for a detailed environmental analysis. Similarly, formaldehyde monitoring kits contain badges used to collect formaldehyde. These also are returned to the ground for spectroscopic analysis.
Air quality monitors used for volatile organic compound detection positioned in the U.S. Lab on the ISS.
NASA
The Environmental Chemistry Laboratory also analyzes archival samples returned from the ISS. The majority of water consumed by crewmembers on the ISS is recycled from a combination of condensed atmospheric humidity and urine. This wastewater is then treated by the U.S. water processor assembly (WPA) to produce potable water, which is analyzed to ensure that the water meets U.S. potability requirements. Samples of the humidity condensate and condensate/urine distillate also are returned for analysis to provide insight into the operation of the WPA and the overall US water recovery system. The TEC relies upon the in-flight analytical capability provided by the ISS total organic carbon analyzer (TOCA) to determine real-time total organic carbon concentrations, which are used to protect ISS crew health as well as manage the U.S. water system consumables. Similarly, the colorimetric water quality monitoring kit (CWQMK) is used to provide insight into the biocide concentration in the U.S. water.
The CSA-CP used to monitor for evidence of fires or smoldering events on the ISS.
NASA
Water samples are also collected in flight and stored for return to Johnson Space Center. The following ground-based equipment is used to analyze archival samples to ensure suitable air and water quality:
Liquid Chromatography/Refractive Index Detection (LC/RI)
Gas Chromatography/Flame Ionization Detector (GC/FID)
Gas Chromatography/Thermal Conductivity Detector (GC/TCD)
In addition to analysis of flight samples and real-time data, the Environmental Chemistry laboratory team plays an important role in the development of new Environmental Control and Life Support Systems hardware by providing analytical support during ground testing. Similarly, the TEC scientists pursue and support technology demonstrations aimed at developing new methods for real-time data collection. Recent examples of this support have included the multi-gas monitor (MGM) and the personal CO2 monitor. TEC scientists make vital contributions to consolidating environmental monitoring hardware to reduce mass and volume requirements, both of which are important as NASA moves to more long-term missions in smaller vehicles.
The U.S. TOCA used to test water quality in real-time on the ISS
NASA
Spaceflight Air and Water Quality
Toxicology and Environmental Chemistry (TEC) monitors airborne contaminants in both spacecraft air and water. In-flight monitors are employed to provide real-time insight into the environmental conditions on ISS. Archival samples are collected and returned to Earth for full characterization of ISS air and water.
Preparations for Next Moonwalk Simulations Underway (and Underwater)
Statistics and Data Science
Enabling Successful Research
A major aim of biomedical research at NASA is to acquire data to evaluate, understand, and assess the biomedical hazards of spaceflight and to develop effective countermeasures. Data Science (S&DS) personnel provide statistical support to groups within the NASA JSC Human Health and Performance Directorate and other NASA communities. They have expertise in the development of complex study designs, the application of modern statistical methods, and the analysis of data collected under NASA operational constraints (small sample sizes, the limited population of astronauts).
Fun Fact: Did you know statistics is more than just means and standard deviations? Statistics is the science of collecting, analyzing, presenting and interpreting data. NASA depends on data to make decisions and statistics is crucial to making good decisions. Statistics and Data Science (S&DS) help transform data into evidence.
NASA
Data Science Support
Beyond statistics, the group aids with data engineering and exploring data. Data engineering includes extracting and transforming data in preparation for analysis and visualization. Data can come in many different formats, the S&DS team helps researchers harmonize (bring data sets together) information across sources. Exploration includes initial analysis and building informative visualizations to deepen the understanding of the evidence. Analyzing and interpreting data to produce insights follow.
S&DS statistician Dr. Alan Feiveson consulting with Lifetime Surveillance of Astronaut Health’s Statistical Data Analyst Caroline Schaefer at a Statistics helpdesk during the Human Research Program’s Investigators’ Workshop in 2017.
NASA
Statistical Consulting Services
The S&DS team provides collaboration and consulting expertise to the Directorate in the application of statistical theory and practice to ongoing biomedical research. Personnel aid in the preparation of sections of research proposals that deal with experiment design, statistical modeling, and subsequent analysis of anticipated research data. Once data are gathered, S&DS statisticians assist with analysis, visualization, and interpretation of results so that investigators can extract the most information while maintaining statistical integrity. A S&DS statistician may be a co-investigator on a project requiring sophisticated statistical modeling and/or analysis techniques. Through collaboration, members of the S&DS team expand their knowledge base in such diverse medical fields as environmental physiology, osteopathy, neurology, pharmacology, microbiology, cardiology, nutrition, and psychology. To meet the unique data collected by NASA, statisticians may develop new techniques to address challenges such as small sample sizes of ISS studies, missing data, operational constraints, and novel measures of outcome.
Outreach
Collaborators with the S&DS team often reside within the Directorate, but statistics and data science support is extended to other organizations within the Johnson Space Center, including the Engineering Directorate, Human Resources, and the Education Office. The S&DS team also provides a venue wherein high school, undergraduate, and graduate interns can participate in the analysis and interpretation of NASA biomedical data. Students assigned to the S&DS team have a rare opportunity to gain real-world experience with research in a variety of biomedical fields.
Preparations for Next Moonwalk Simulations Underway (and Underwater)
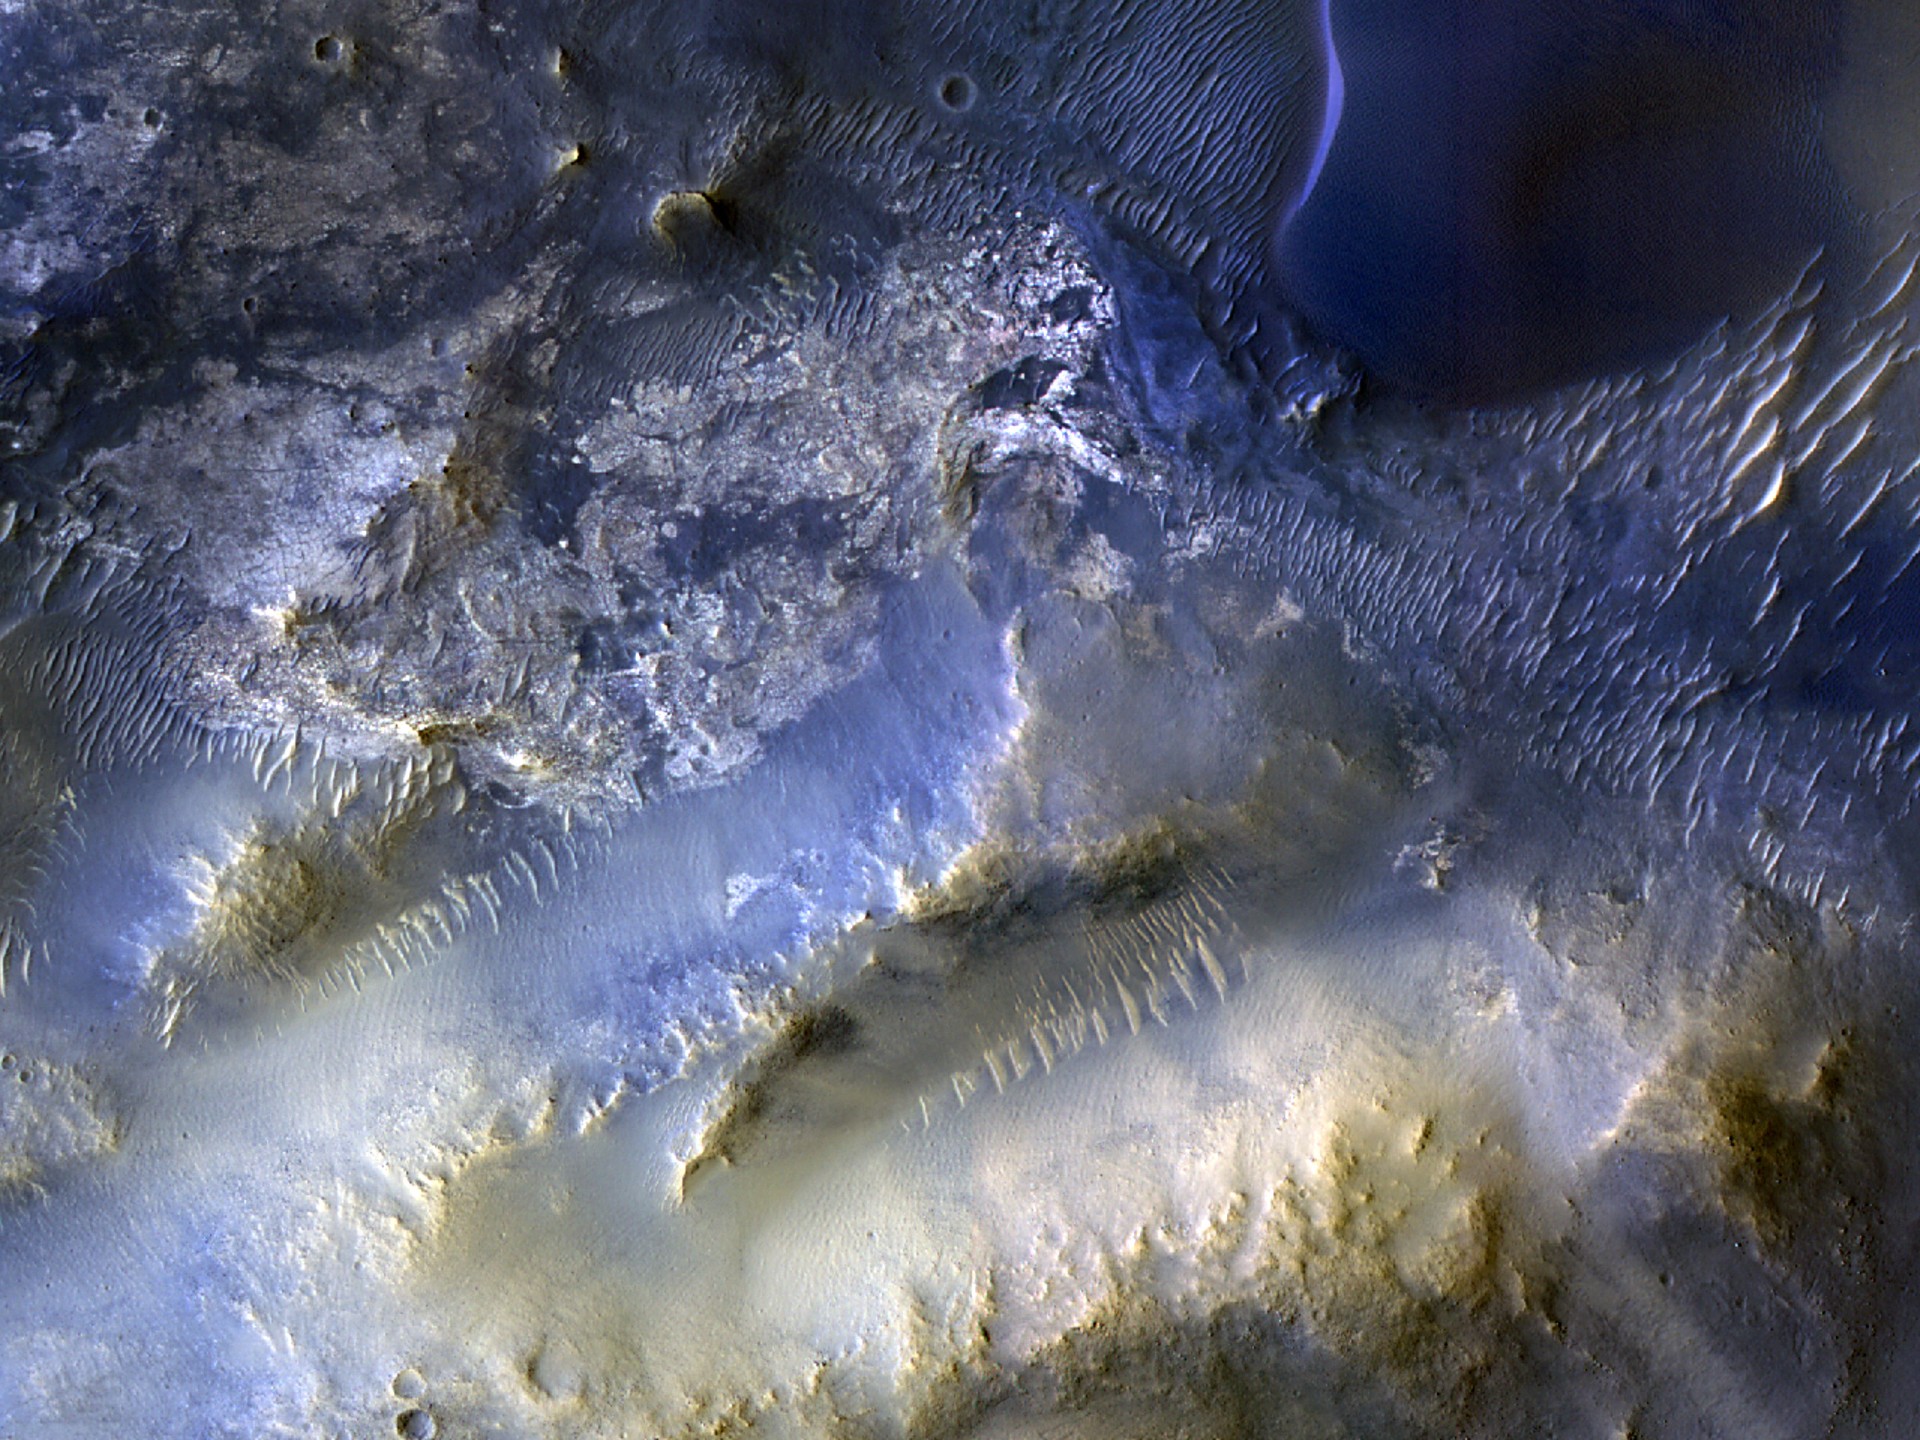
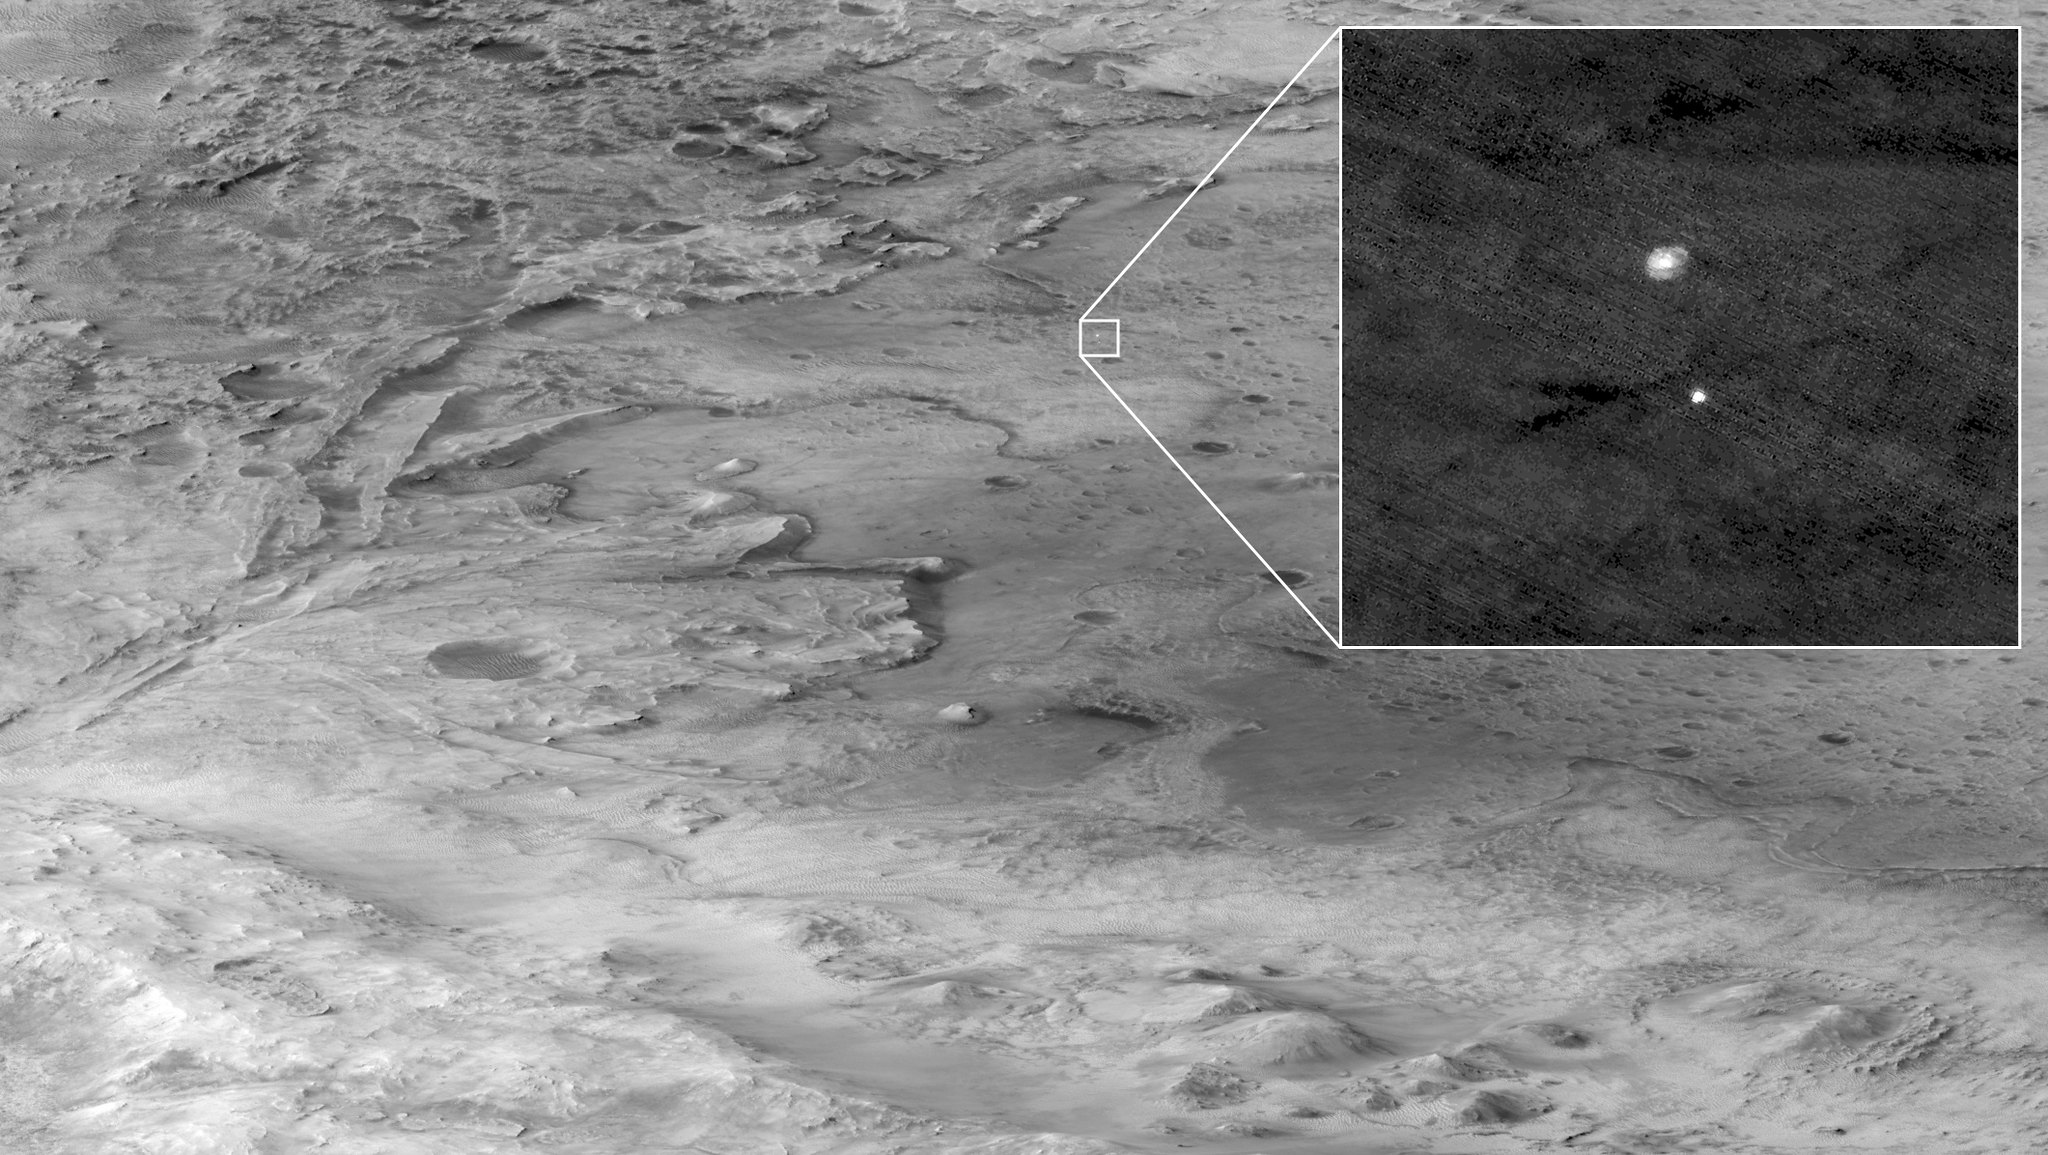
This view of a region called Syrtis Major is from the 100,000th image captured by NASA’s Mars Reconnaissance Orbiter using its HiRISE camera. Over nearly 20 years, HiRISE has helped scientists understand how the Red Planet’s surface is constantly changing.
NASA/JPL-Caltech/University of Arizona
Mesas and dunes stand out in the view snapped by HiRISE, one of the imagers aboard the agency’s Mars Reconnaissance Orbiter.
After nearly 20 years at the Red Planet, NASA’s Mars Reconnaissance Orbiter (MRO) has snapped its 100,000th image of the surface with its HiRISE camera. Short for High Resolution Imaging Science Experiment, HiRISE is the instrument the mission relies on for high-resolution images of features ranging from impact craters, sand dunes, and ice deposits to potential landing sites. Those images, in turn, help improve our understanding of Mars and prepare for NASA’s future human missions there.
Captured Oct. 7, this milestone image from the spacecraft shows mesas and dunes within Syrtis Major, a region about 50 miles (80 kilometers) southeast of Jezero Crater, which NASA’s Perseverance rover is exploring. Scientists are analyzing the image to better understand the source of windblown sand that gets trapped in the region’s landscape, eventually forming dunes.
“HiRISE hasn’t just discovered how different the Martian surface is from Earth, it’s also shown us how that surface changes over time,” said MRO’s project scientist, Leslie Tamppari of NASA’s Jet Propulsion Laboratory in Southern California. “We’ve seen dune fields marching along with the wind and avalanches careening down steep slopes.”
Watch highlights of images captured by HiRISE, the high-resolution camera aboard NASA’s Mars Reconnaissance Orbiter, including its 100,000th image, showing the plains and dunes of Syrtis Major.
NASA/JPL-Caltech/University of Arizona
The subject of the 100,000th image was recommended by a high school student through the HiWish site, where anyone can suggest parts of the planet to study. Team members at University of Arizona in Tucson, which operates the camera, also make 3D models of HiRISE imagery so that viewers can experience virtual flyover videos.
“Rapid data releases, as well as imaging targets suggested by the broader science community and public, have been a hallmark of HiRISE,” said the camera’s principal investigator, Shane Byrne of the University of Arizona in Tucson. “One hundred thousand images just like this one have made Mars more familiar and accessible for everyone.”
More about MRO
NASA’s Jet Propulsion Laboratory in Southern California manages MRO for NASA’s Science Mission Directorate in Washington as part of NASA’s Mars Exploration Program portfolio. Lockheed Martin Space in Denver built MRO and supports its operations.
The University of Arizona in Tucson operates HiRISE, which was built by Ball Aerospace & Technologies Corp., in Boulder, Colorado.
The Landsat Calibration and Validation (Cal/Val) group helps uphold Landsat’s reputation as the gold standard of satellite imagery. They ensure that the Operational Land Imager (OLI) and the Thermal Infrared Sensor (TIRS) aboard Landsats 8 and 9 provide high-quality scientific measurements to users around the world. In 2025, the Cal/Val group contributed over 60 pages to the second edition of “Comprehensive Remote Sensing” (Kaita et. al, 2026), organizing content from NASA, USGS, academia, and industry scientists. Cal/Val support staff authored multiple sections, including a summary of results from Landsat 9 and of the evolution of spectral, spatial, and radiometric characteristics throughout the Landsat missions.
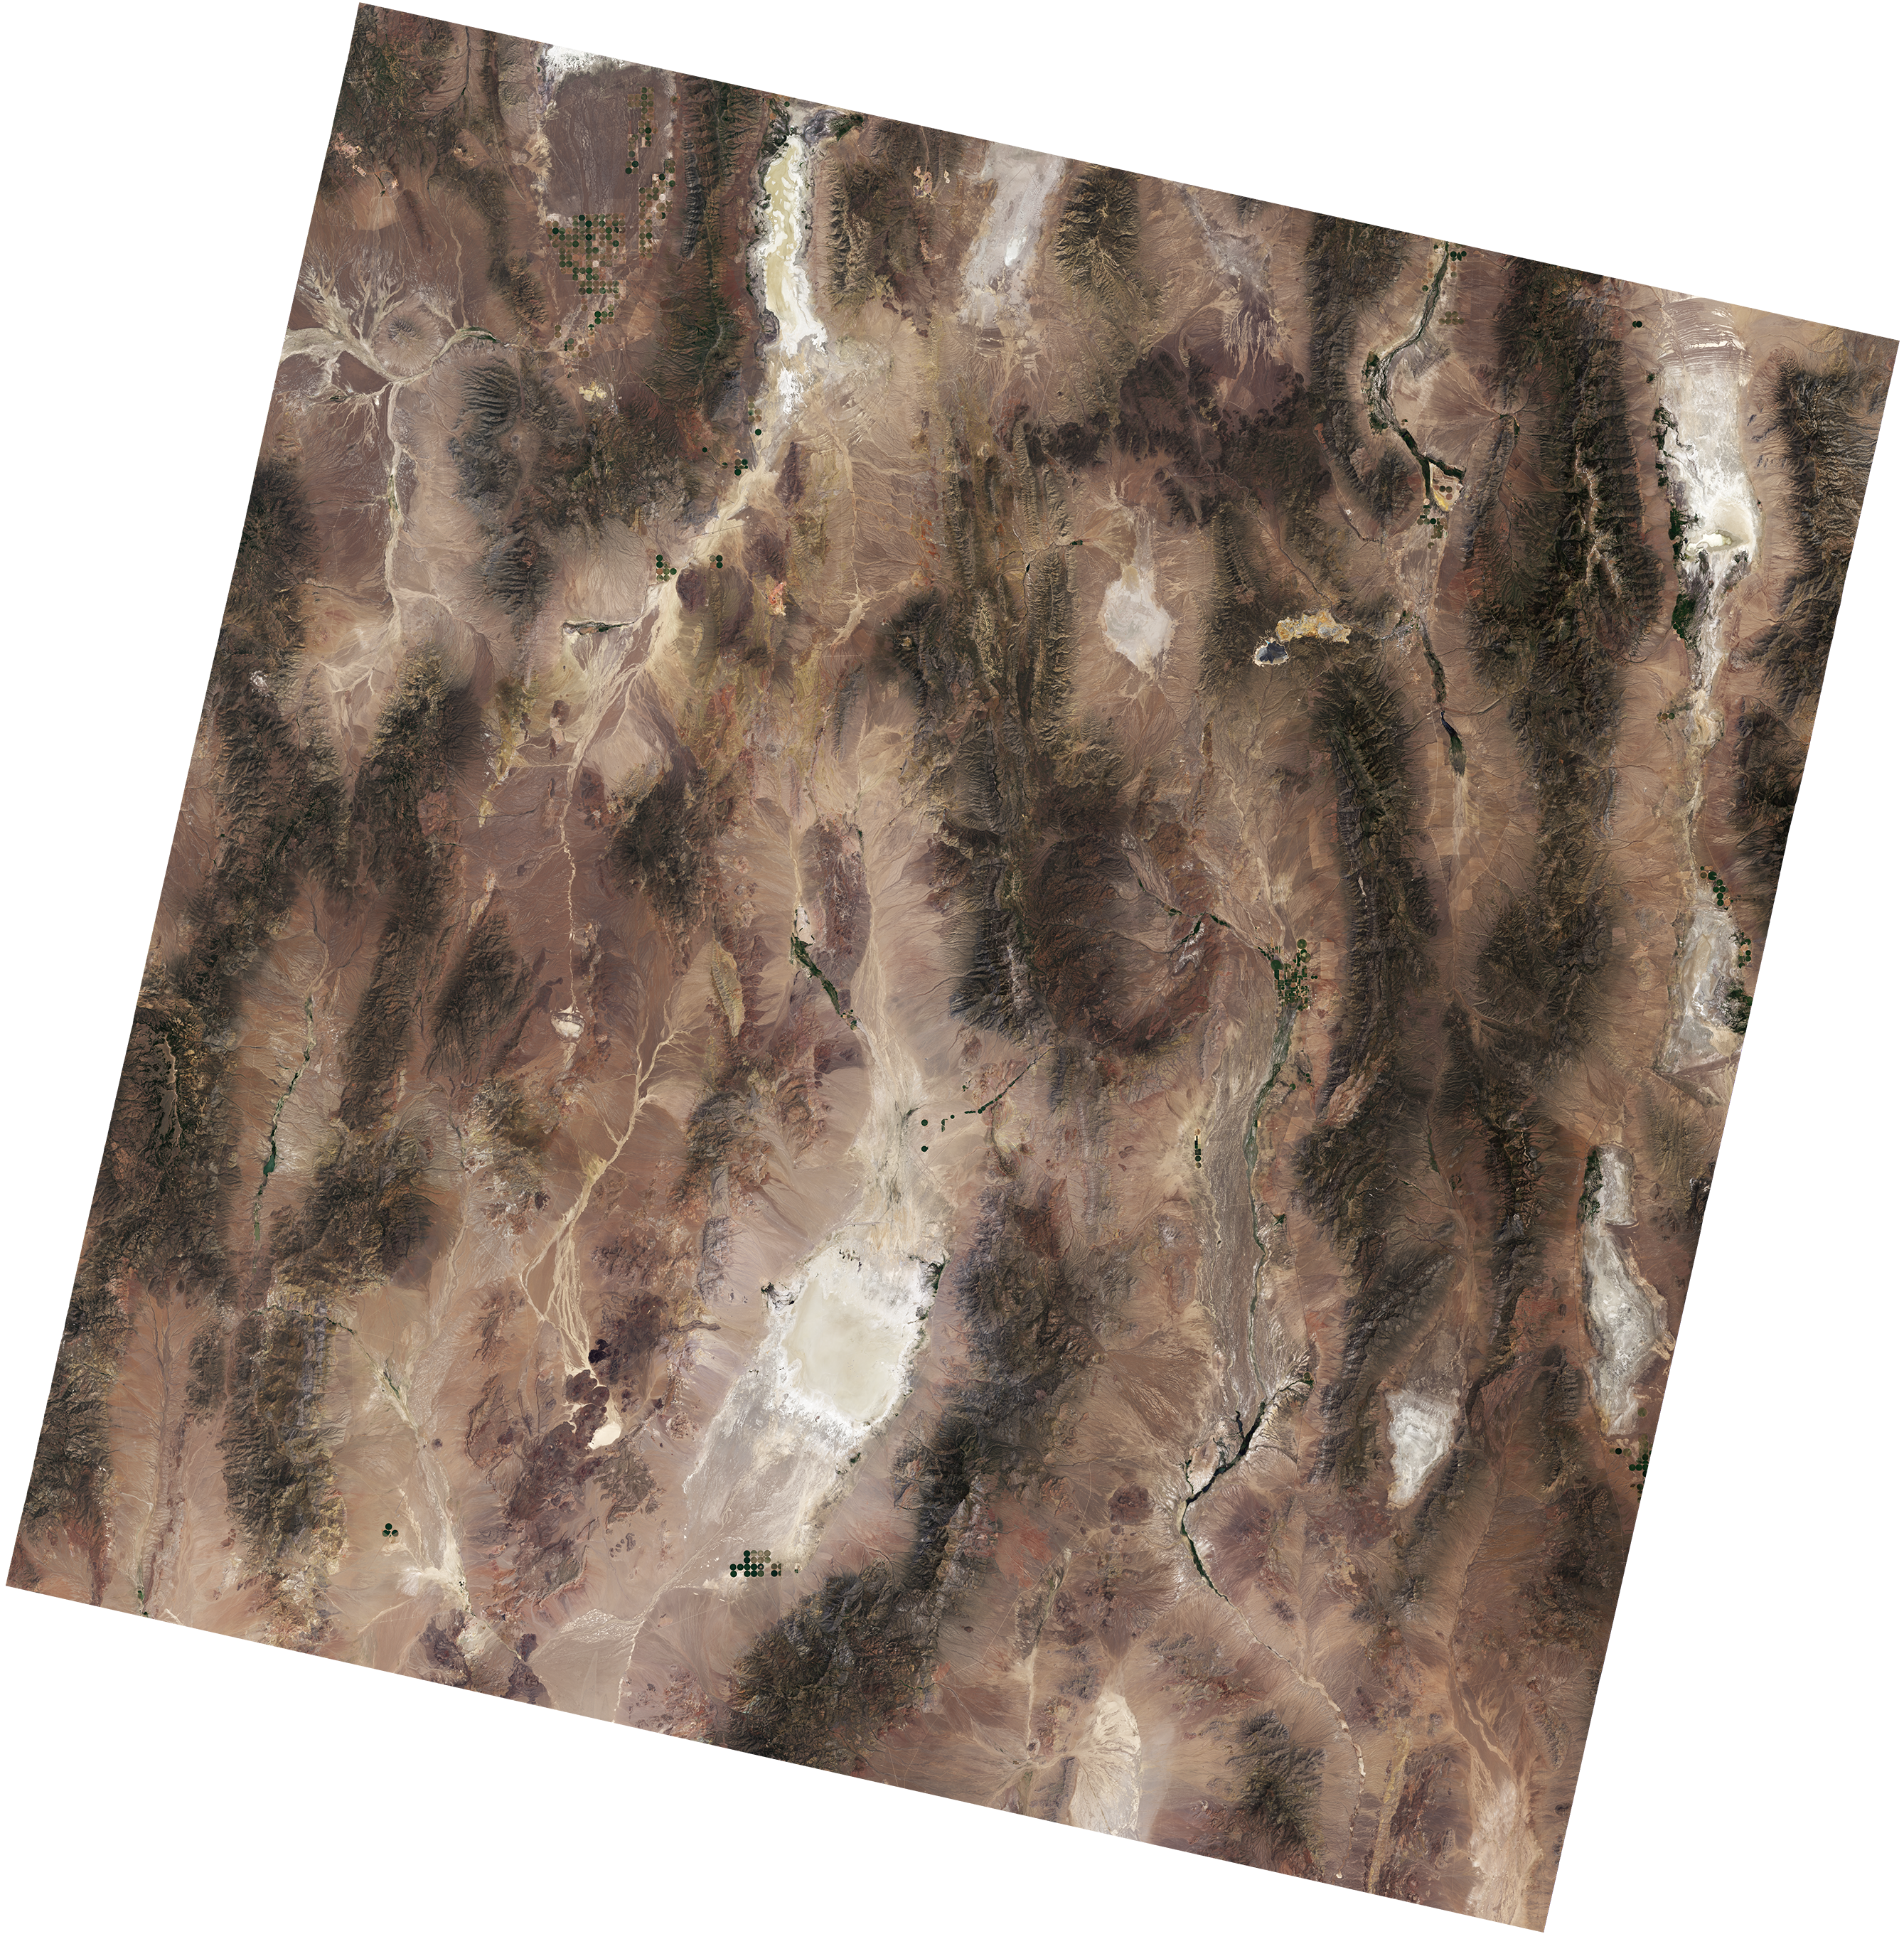
A natural-color Landsat 9 image of Railroad Valley Playa in Nevada, acquired on June 29, 2024. A portion of the playa is used as a radiometric calibration and validation site for various satellite sensors including Landsat 8 and 9’s OLI instruments.
NASA/USGS
The Cal/Val team at NASA Goddard Space Flight Center works closely with the Landsat Flight Operations Team to plan weekly calibration activities to maintain the radiometric accuracy of Landsat products. In October 2025, a Landsat 9 anomaly occurred related to its solar array drive assembly (SADA) potentiometer. The spacecraft and instruments were placed in a safehold, pausing data collections. The Cal/Val team assessed the instruments after they recovered from this anomaly, including monitoring the instrument telemetry, detector gains, and noise performance. The team identified a mis-loaded detector map and updated the calibration of both the reflective and thermal emissive bands to ensure consistent, accurate data. After six days in the safehold, the instrument resumed normal operations.
The NASA Cal/Val team supports their USGS counterparts with quarterly updates to the Calibration Parameter File (CPF) by providing inputs for relative and absolute gains as needed. This work involves collaborating with USGS scientists to ensure the consistency of the Combined Radiometric Model (CRaM). The CRaM approach integrates radiometric responses from on-board calibrators to enhance long-term calibration stability throughout mission lifetimes. The CRaM algorithm also provides an extensible framework for future satellite missions. A peer-reviewed publication detailing the CRaM’s approach and future applications was submitted to Science of Remote Sensing.
On January 14-16, 2025, the Landsat Cal/Val team organized and hosted the first semiannual Technical Information Meeting (TIM) at NASA Goddard Space Flight Center. NASA and USGS scientists welcomed collaborating scientists from South Dakota State University (SDSU), the University of Arizona Tucson, and Rochester Institute of Technology for presentations and discussions on Landsat imaging performance, algorithms, and instrument health. On May 28-29, 2025, the Cal/Val team attended the second semiannual TIM at SDSU.
The Landsat Cal/Val Team is validating the accuracy of the Harmonized Landsat and Sentinel-2 (HLS) v2.0 product, which combines data from multiple satellites to create a continuous record of Earth’s surface reflectance measurements since 2013. The team is testing the dataset using RadCalNet, a global network of automated ground stations that provide precise, standardized measurements. The team compared measurements from four RadCalNet sites, including the well-established Railroad Valley Playa site in Nevada, against near-simultaneous HLS data. Their analysis shows the satellite and ground measurements agree within expected uncertainty ranges—a strong validation of the HLS product’s accuracy.
The team presented these findings at the CEOS IVOS calibration meeting in Tucson, Arizona (September 1-5, 2025) and is currently preparing a peer-reviewed article to share the complete results.
Path Forward
The Cal/Val team applies lessons learned from Landsat missions to better plan calibration efforts for the next generation of instruments. Using instrument performance checklists from Landsat 8/9, the team is building a framework of in-house geometric and radiometric testing and extending algorithms for future Landsat instruments.
The Landsat Cal/Val Team is actively tackling a critical challenge in solar irradiance modeling. While new hyperspectral sensor technologies have made it possible to create highly accurate solar models with much lower uncertainty, the remote sensing community still lacks agreed-upon methods for applying these advanced models. A dedicated subgroup within the Landsat Cal/Val Team is now developing and testing standardized approaches to bridge this gap. Their goal is to create clear recommendations and best practices that the scientific community can refine together and implement consistently.
This work addresses a fundamental need—transforming promising hyperspectral solar modeling capabilities into practical, standardized tools that researchers can confidently use across different projects and applications.
Preparations for Next Moonwalk Simulations Underway (and Underwater)
Microbiology Laboratory at JSC NASA.
Microorganisms and Spaceflight
Spaceflight poses a risk of adverse health effects due to the interactions between microorganisms, their hosts, and their environment. The JSC Microbiology team addresses the benefits and risks related to microorganisms, including infectious disease, allergens, environmental and food contamination, and the impacts of changes in environmental and human microbial ecology aboard spacecraft. The team includes certified medical technologists, environmental microbiologists, mycologists, and biosafety professionals.
The JSC Microbiology laboratory is a critical component of the Human Health and Performance Directorate and is responsible for addressing crew health and environmental issues related to microbial infection, allergens, and contamination. This responsibility is achieved by operational monitoring and investigative research using classical microbiological, advanced molecular, and immunohistochemical techniques. This research has resulted in a significant number of presentations and peer-reviewed publications contributing to the field of Microbiology with articles in journals such as Infection and Immunity, Journal of Infectious Disease and Applied and Environmental Microbiology, Nature Reviews Microbiology, and Proceedings of the National Academies of Science.
Fun Fact: Microorganisms display unexpected responses when grown in the spaceflight environment compared to otherwise identically grown microbes on Earth.
NASA
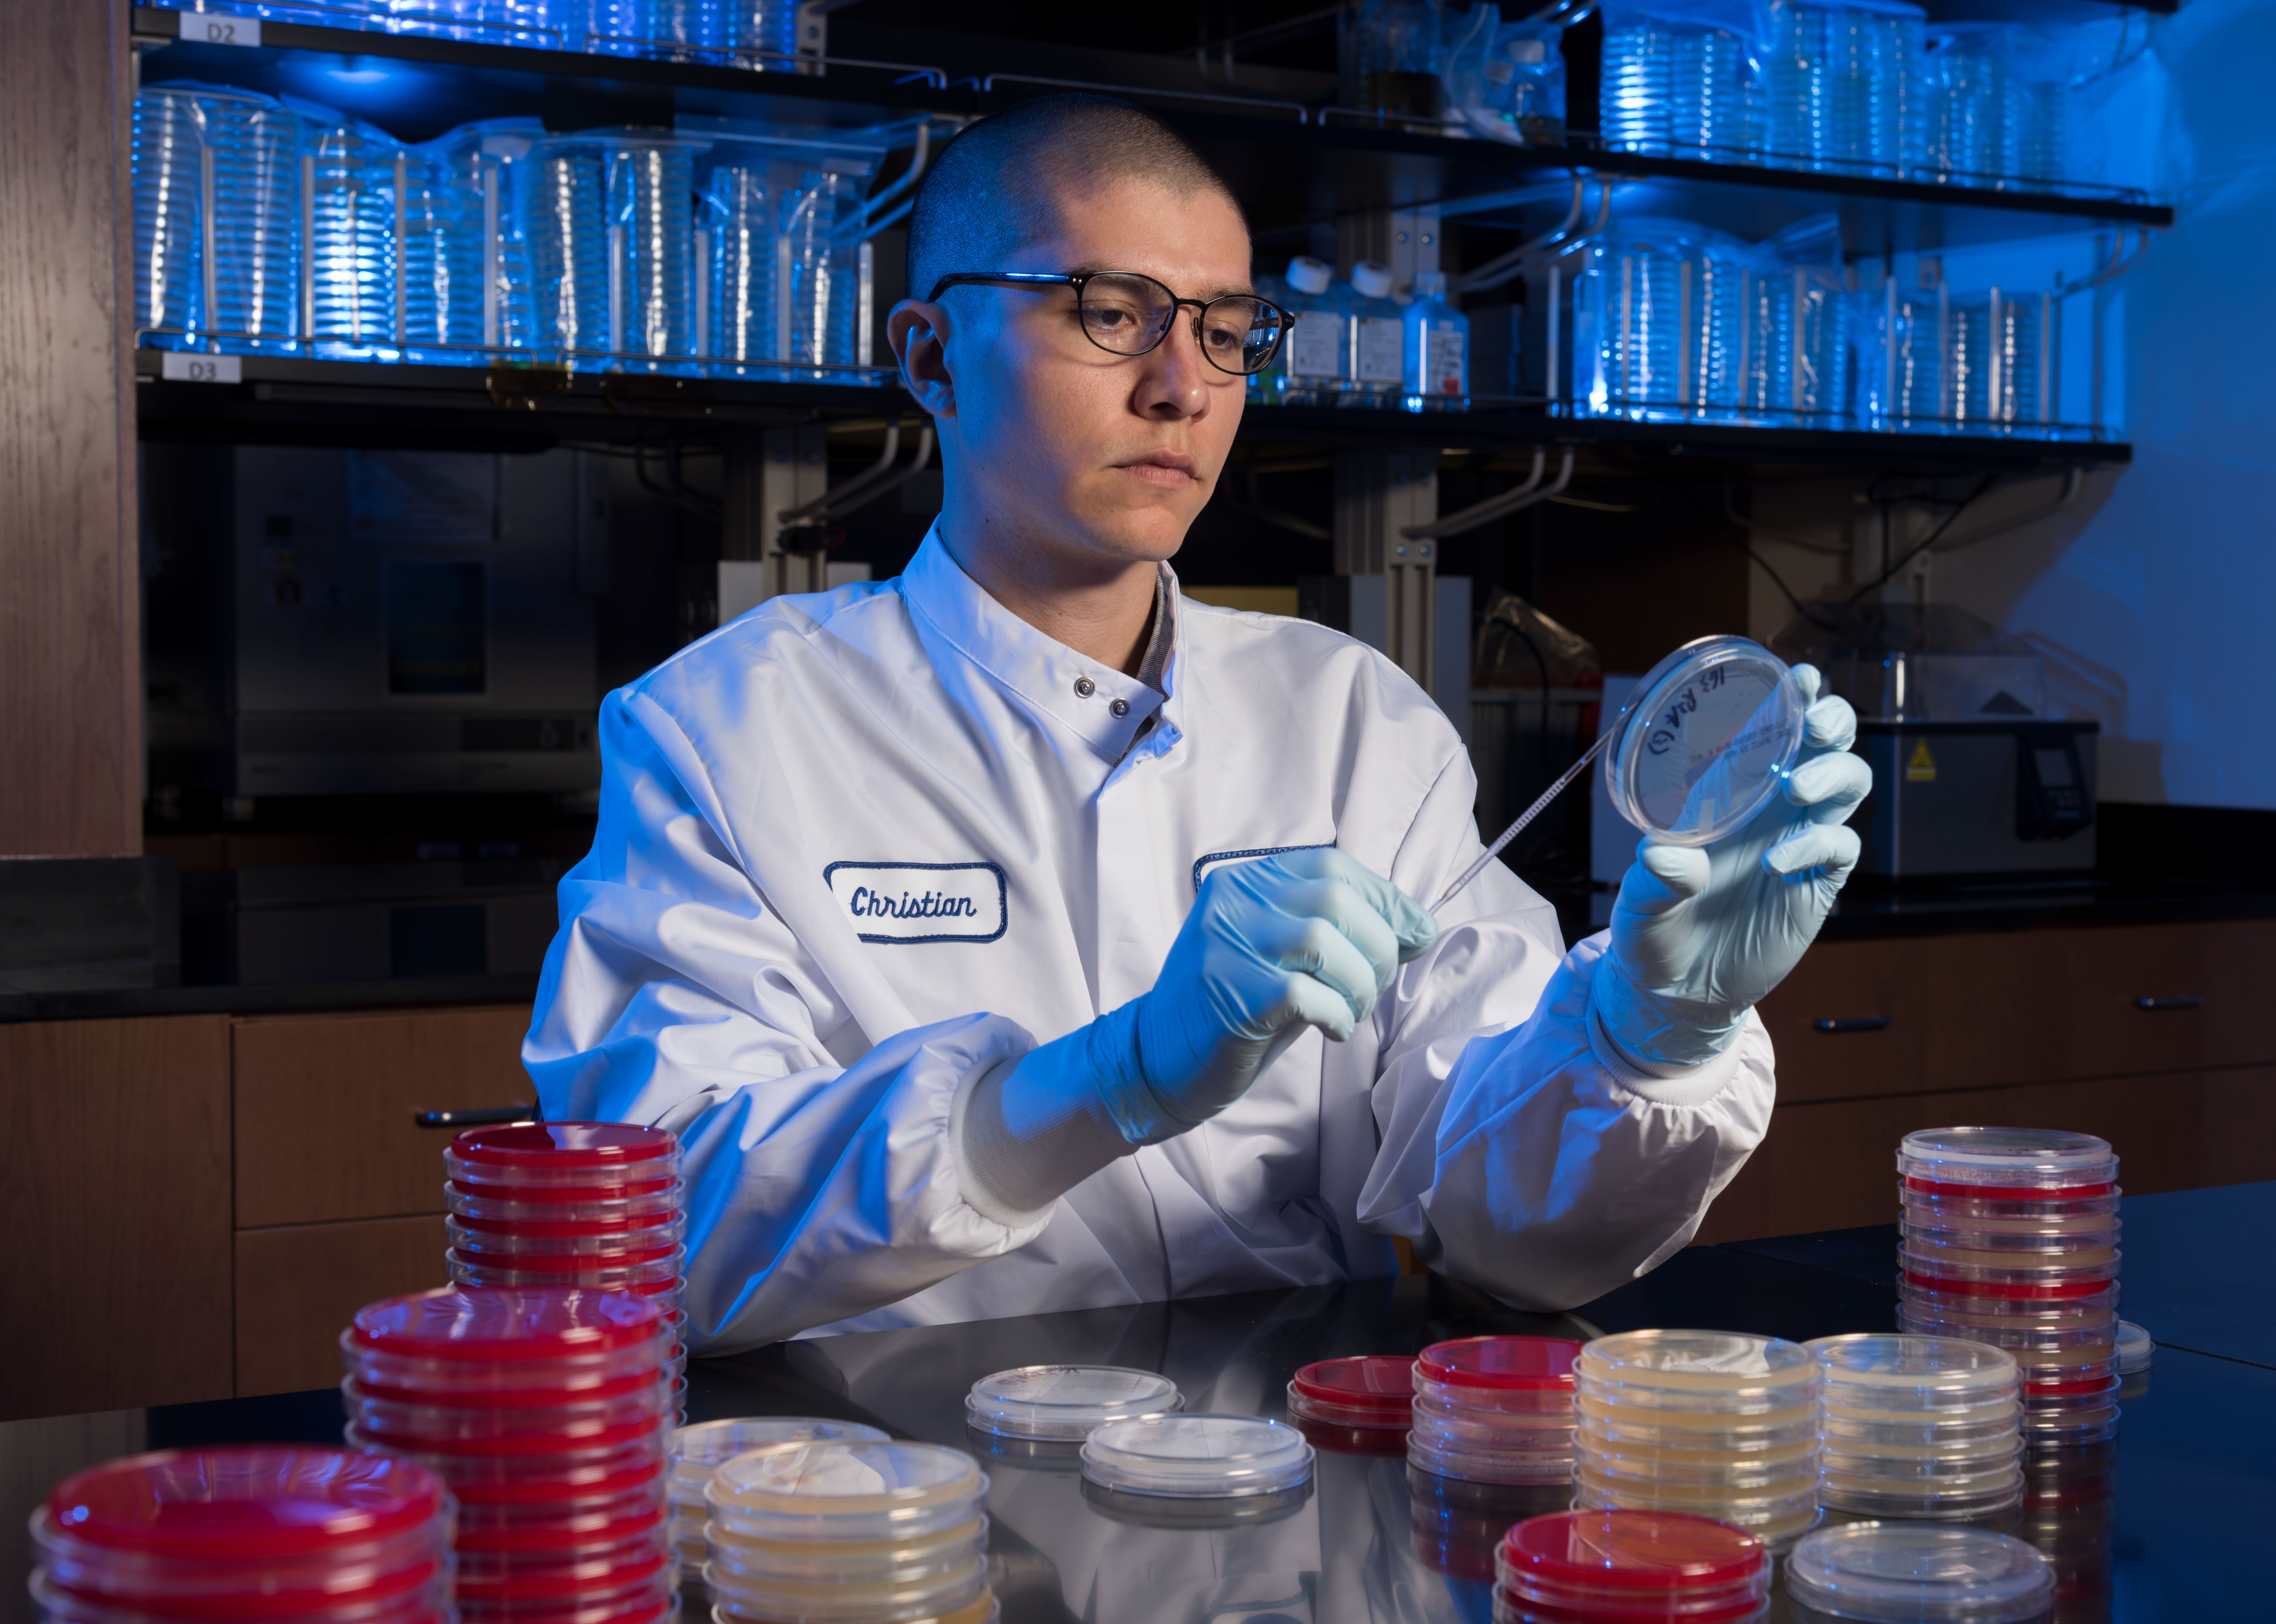
Christian Castro is streaking bacteria to be characterized using a variety of culture media. Photo Date: May 29, 2018. Location: Building 21 – Microbiology Lab.
NASA
Keeping Crew-members Safe
As a functional part of the Crew Health Care System and in support of Environmental Control and Life Support Systems engineers, the Microbiology Laboratory team defines requirements, coordinates and analyzes microbial sampling, and analysis of air, surface, and water samples. These environmental samples, including preflight and in-flight samples, re-analyzed to ensure that microorganisms do not adversely affect crew health or system performance.
Microbiologists also serve as team members when anomalous events occur that might affect crew health or life support systems operations. Spaceflight food samples also are evaluated preflight to decrease the risk of infectious disease to the crew.
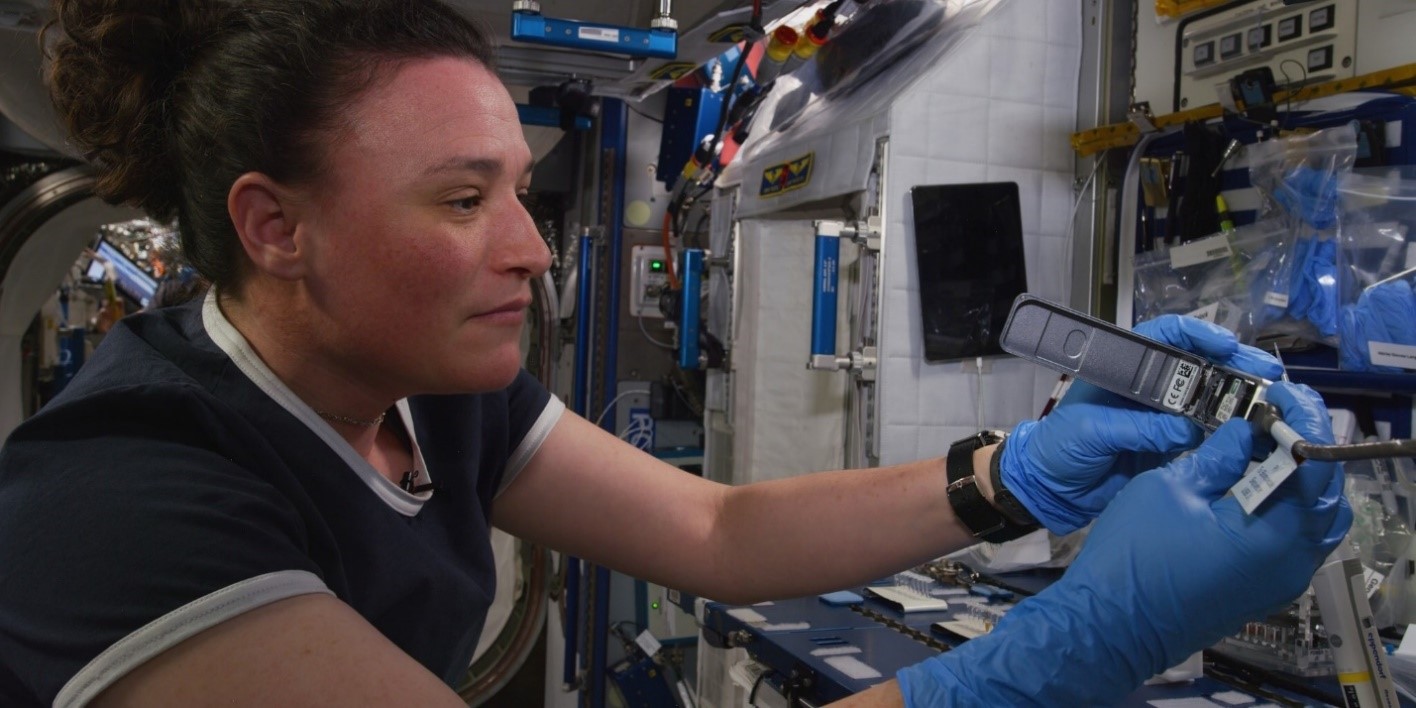
A crewmember identifies unknown environmental microbes aboard the ISS through DNA sequencing.
NASA
Technology and Hardware
ABI DNA sequencer
Illumina MiSeq desktop sequencer
Oxford Nanopore Technologies MinION DNA / RNA sequencers
Agilent Bioanalyzer
VITEK 2 Microbial Identification
Space analogue bioreactors
An example of in-flight Surface Sampler Kit results with growth of fungal cultures after 5 days
Preparations for Next Moonwalk Simulations Underway (and Underwater)
NASA Immunology and Virology Lab
NASA
Does Spaceflight Alter the Human Immune System?
Getting sick on Earth is nothing to sneeze at, but for astronauts on deep space exploration missions, the risk for contracting diseases may be elevated due to altered immunity. The Human Health and Performance Directorate’s Immunology/Virology Laboratory is ideally suited to study the effects of spaceflight on the immune system. When immune cells do not function properly, the immune system cannot respond properly to threats. This may increase susceptibility to infectious disease. Altered immunity can also lead to latent virus shedding, which is the “reawakening” of certain viruses we contract in our youth by which stay with us through adulthood. Reactivation of these viruses has been observed in some crewmembers. Conversely, when immune activity heightens, the immune system reacts excessively, resulting in things like allergy or persistent rashes, which also have been reported by some crewmembers during flight. Working in collaboration with the Human Research Program, the Immunology/Virology Laboratory is actively working to characterize the changes in astronauts’ immune system during spaceflight as well as developing countermeasures to help mitigate the clinical risks for astronauts during these missions to other planets, moons, or asteroids.
Understanding the Impact of Spaceflight on Human Immune Systems
Immunology/Virology Laboratory team supported studies conducted aboard the Space Shuttle and supports investigations currently performed aboard the ISS. For studies of astronauts, the laboratory validated a novel sampling strategy to return ambient live astronaut blood samples to Earth for comprehensive immunological testing and has developed several novel biomedical assays to evaluate immunity in humans. Results from a recent immunology investigation aboard the ISS called “Validation of Procedures for Monitoring Crewmember Immune Function” or “Integrated Immune”’ were published in the journal Nature Microgravity. The data confirms that ISS crews have alterations in both the number and function of certain types of immune cells and that these alterations persist for the duration of a 6-month spaceflight. Other data from the study published in the Journal of Interferon & Cytokine Research indicates that ISS crews have changes in their blood levels of specific immune proteins called ”cytokines” during flight which persist for the duration of a 6-month mission. The laboratory is currently preparing to support physiological monitoring of Artemis deep space astronauts via novel technology developed in-house.
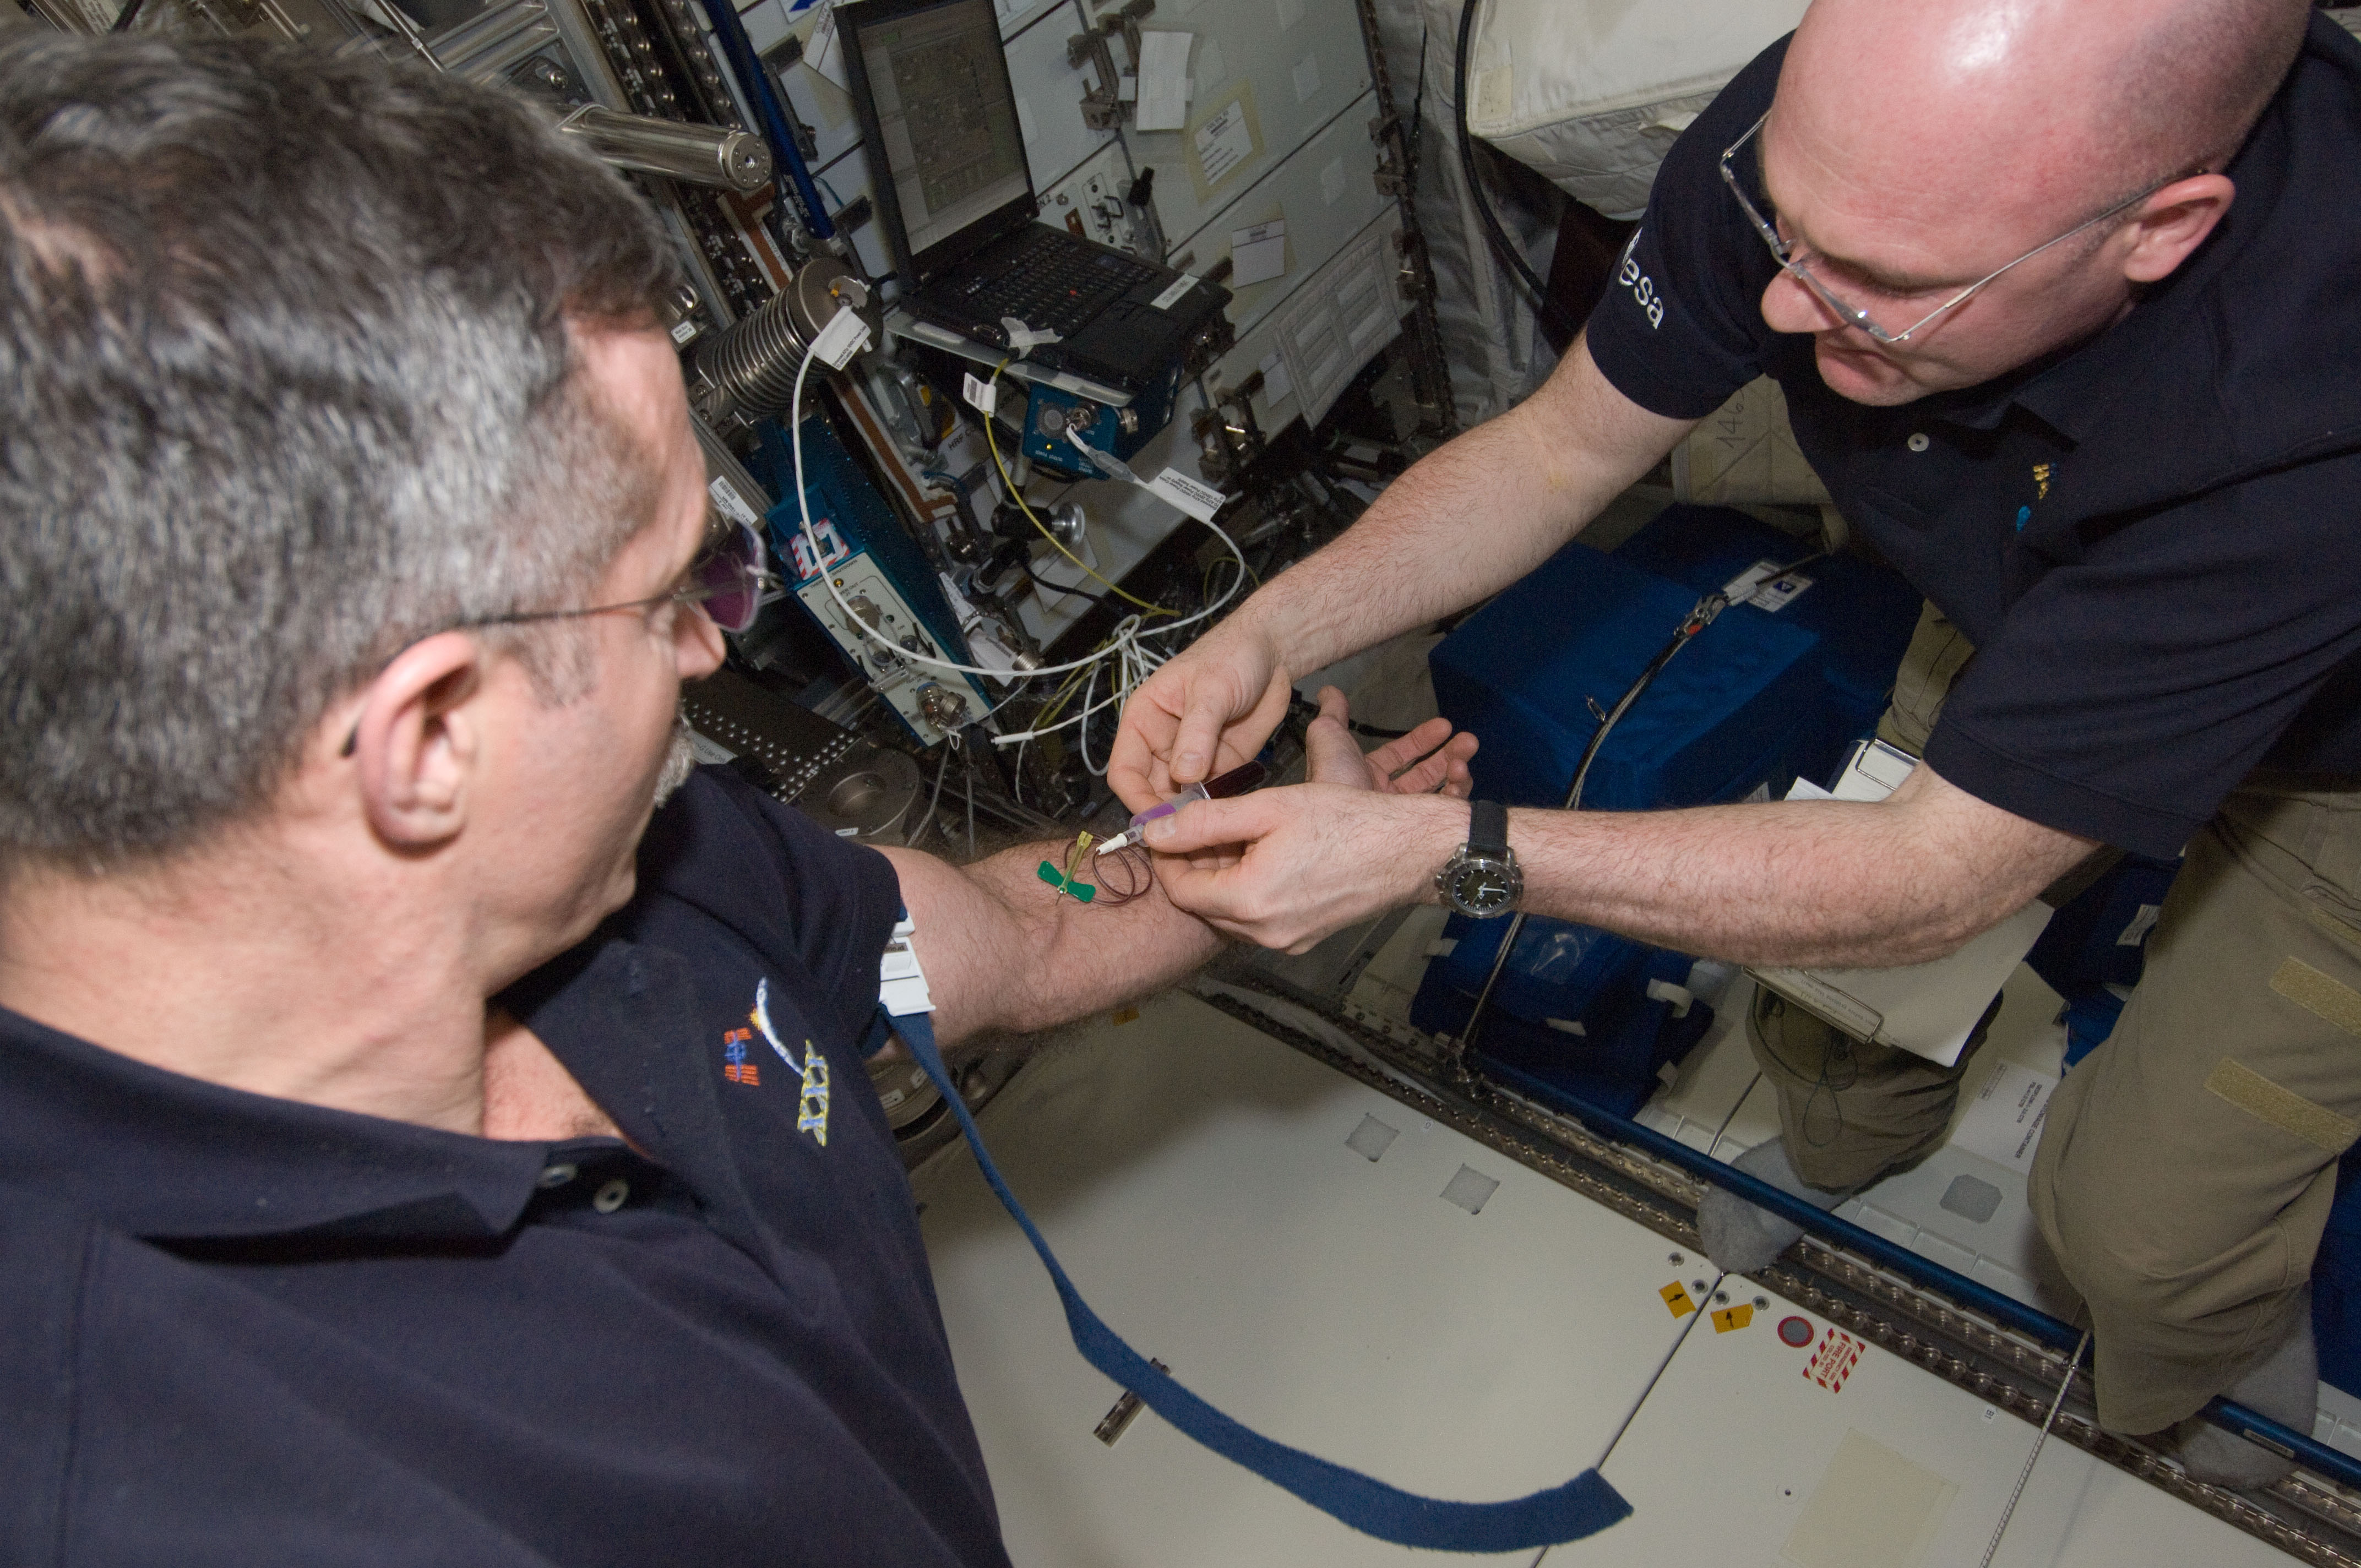
SS crewmembers work together during an Integrated Immune Study blood sample draw at the Human Research Facility (HRF).
NASA
Learning About Spaceflight While on Earth
The Immunology/Virology Laboratory also supports human investigations performed in Earth-based “space analog” situations. Such analogs are places where some specific conditions of spaceflight are replicated. Examples include undersea deployment, closed chamber isolation, or Antarctica winter over. Analog work may shed mechanistic light on the causes of alterations observed during flight or provide locations useful for the testing of countermeasures. The Immunology Laboratory recently supported a European Space Agency 2-year study performed at Concordia Station, Dome C, and Antarctica. Biomedical samples were collected, processed, and stabilized over the Antarctica winter by Concordia crewmembers, and preserved for shipment to NASA. The data revealed that Concordia crewmembers also experience unique patterns of immune dysregulation, some of which are like astronauts’ patterns. The laboratory also has supported recent studies in Antarctica at McMurdo Station, Neumayer III Station, and Palmer Station.
The Immunology/Virology Laboratory team also participates in ground-based investigations to determine the mechanistic reasons why certain types of immune cells do not function well during microgravity conditions. For these studies, a terrestrial “model” of microgravity cell culture is employed, referred to as “clinorotation.” Essentially, cell cultures are slowly rotated around a horizontal axis. During clinorotation, immune cells generally respond as they would during spaceflight.
NASA Immunologist Brian Crucian discusses the findings of a collaborative investigation that determined spaceflight causes changes to the immune system.
Improving Life in Space and on Earth
To “connect the dots” between observed immune changes in astronauts and potential adverse clinical consequences, the Immunology/Virology Laboratory team may support Earth-based clinical investigations. These investigations consist of studies, conducted in collaboration with physicians, of defined patent populations. The same assays, which define immune changes in astronauts, may be applied to clinical patients and the data will help NASA scientists and flight surgeons interpret the flight information, in the context of clinical risk to astronauts. To date, the Immunology/Virology Laboratory team has supported a European clinical investigation of emergency room patients, and a Houston-based investigation of shingles patients.
The Immunology/Virology Laboratory team has developed, working with translational scientists all over the world, a potential countermeasure to improve immunity in deep-space astronauts. The protocol published in the Frontiers in Immunology consists of stress-relieving techniques, certain nutritional supplements, a prescription of aerobic and resistive exercise, certain medications, and monitoring. This protocol soon will be tested at Palmer Station, Antarctica, to be followed by a flight validation aboard ISS.
Our Facility, Technology, and Hardware
Immunologists and virologists comprise the core research staff of the laboratory and postdoctoral associates, visiting scientists, and graduate students routinely perform rotations of varying lengths in the laboratory. The laboratory currently possesses an array of sophisticated research equipment, including:
Ten-, and Four-color Flow Cytometers
41-analyte capable Multiplex Analyzer
Real-time Polymerase Chain Reaction System
Fluorescent Microscopes
Confocal Microscope
Cell culture, including modeled-microgravity, facilities
In addition, we partner with the Bioanalytical Core Laboratory (BCL) to leverage equipment such as the environmental scanning electron microscope.
Points of Contact
Brian Crucian, PhD Mayra Nelman-Gonzalez Satish Mehta, PhD
NASA Immunologist Brian Crucian discusses the findings of a collaborative investigation that determined spaceflight causes changes to the immune system.
Preparations for Next Moonwalk Simulations Underway (and Underwater)
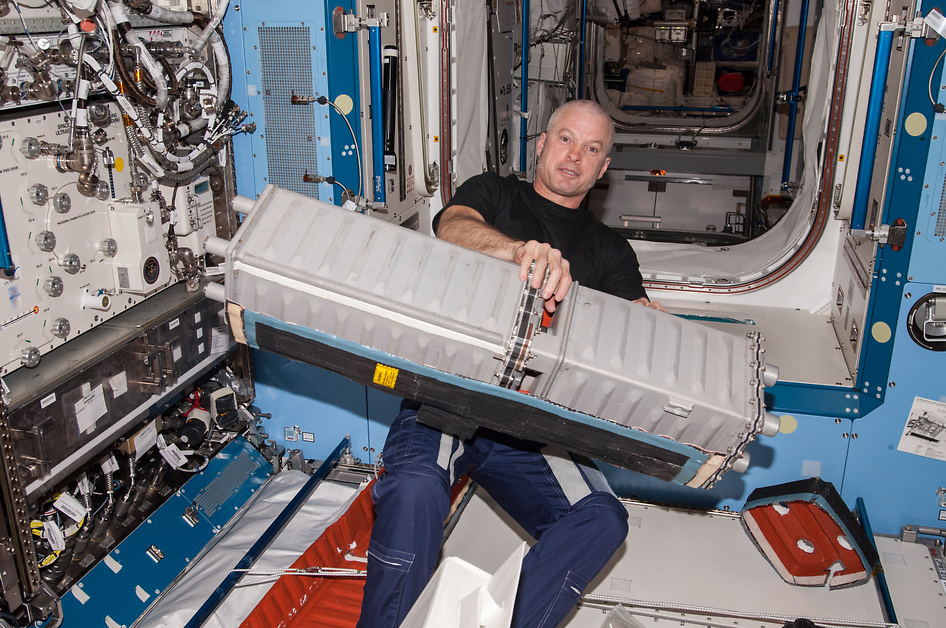
NASA astronaut Steve Swanson, Expedition 40 commander, holds the Carbon Dioxide Removal Assembly (CDRA) in the Kibo laboratory of the International Space Station. (30 June 2014)
NASA
The JSC toxicologists establish guidelines for safe and acceptable levels of individual chemical contaminants in spacecraft air (SMACs) and drinking water (SWEGs) in collaboration with the National Research Council’s Committee on Toxicology (NRC COT) and through peer-reviewed publication. The framework for establishing these levels is documented for SMACs and SWEGs, and recent refinements to the Methods reflect current risk assessment practices.
In addition to official SMACs used for the evaluation of spacecraft air, JSC toxicologists set interim 7-day SMAC values that are listed in NASA Marshall Space Flight Center’s Materials and Processes Technical Information System (“MAPTIS”), which is used to evaluate materials and hardware off-gassing data.
Spacecraft Maximum Allowable Concentrations for Selected Airborne Contaminants
A table listing the official NASA SMAC values is published in JSC 20584 (PDF, 1MB) (Last revised – June 2024). References for the published values are provided below:
NRC (1994) Spacecraft Maximum Allowable Concentrations for Selected Airborne Contaminants, Volume 1, National Academy Press, Washington, D.C.
NRC (1996) Spacecraft Maximum Allowable Concentrations for Selected Airborne Contaminants, Volume 2, National Academy Press, Washington, D.C.
NRC (1996) Spacecraft Maximum Allowable Concentrations for Selected Airborne Contaminants, Volume 3, National Academy Press, Washington, D.C.
NRC (2000) Spacecraft Maximum Allowable Concentrations for Selected Airborne Contaminants, Volume 4, National Academy Press, Washington, D.C.
NRC (2008) Spacecraft Maximum Allowable Concentrations for Selected Airborne Contaminants, Volume 5, National Academy Press, Washington, D.C.
Meyers VE, Garcia HD, James JT. Safe Human Exposure Limits for Airborne Linear Siloxanes during Spaceflight. Inhalation Toxicology 2013; 25(13):735-46.
Romoser AA, Ryder VE, McCoy JT. Spacecraft Maximum Allowable Concentrations for Manganese Compounds in Mars Dust. Aerosp Med Hum Perform. 2019; 90(8):709-719.
Scully RR, Garcia H, McCoy JT, Ryder VE. Revisions to Limits for Methanol in the Air of Spacecraft. Aerosp Med Hum Perform. 2019; 90(9):807-812.
Spacecraft Water Exposure Guidelines for Selected Waterborne Contaminants
A table listing the official NASA SWEG values is published in JSC 63414 Rev A (PDF, 426KB) (Last revised – November 2023). References for the published values are provided below:
NRC (2004) Spacecraft Water Exposure Guidelines for Selected Contaminants, Volume 1, National Academy Press, Washington, D.C.
NRC (2006) Spacecraft Water Exposure Guidelines for Selected Contaminants, Volume 2, National Academy Press, Washington, D.C.
NRC (2008) Spacecraft Water Exposure Guidelines for Selected Contaminants, Volume 3, National Academy Press, Washington, D.C.
Ramanathan R, James JT, McCoy T. (2012) Acceptable levels for ingestion of dimethylsilanediol in water on the International Space Station. Aviat Space Environ Med. 83(6):598-603.
Garcia, HD, Tsuji, JS, James, JT. (2014) Establishment of exposure guidelines for lead in spacecraft drinking water. Aviat Space Environ Med. 85:715-20.
Harmonized Landsat and Sentinel-2 PI Christopher Neigh shares milestones and a vision for the future
In 2025, the Harmonized Landsat and Sentinel-2 (HLS) program established itself as a cornerstone for global medium-resolution optical Earth observation and became one of NASA’s most downloaded products. The seamless, analysis-ready dataset is free for anyone to use and download on NASA Earthdata: HLSL30v2.0 and HLSS30v2.0. HLS version 2.0 (Ju et al., 2025), released in July, represents a major advancement in algorithm sophistication and dataset completeness. The improved surface reflectance dataset now extends globally back to 2013 (excluding Antarctica) and integrates observations from Landsat 8/9 and Sentinel-2A/B/C satellites, achieving an unprecedented median revisit interval of less than 1.6 days. This high frequency of observations transforms our ability to monitor Earth’s changing surface.
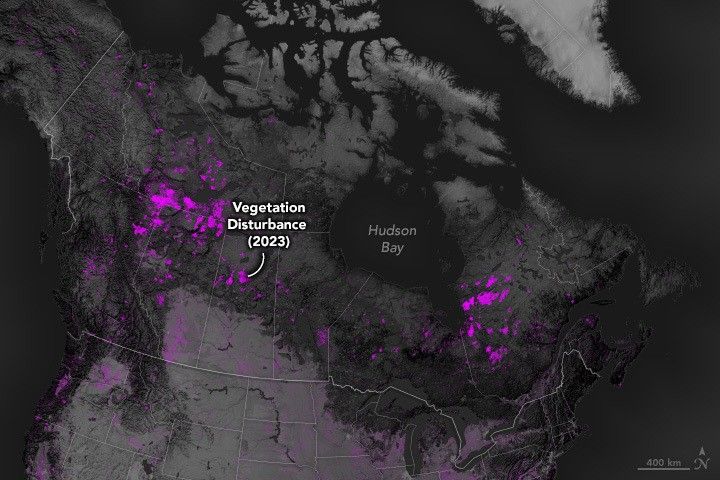
Patches of purple across Canada show where vegetation disturbances were detected in 2023.
NASA’s Earth Observatory/Wanmei Liang
June saw the first in-person HLS meeting between NASA headquarters, the Satellite Needs Working Group (SNWG), and representatives from NASA’s Goddard Space Flight Center and Marshall Space Flight Center, representing enhanced coordination and strategic alignment. The HLS project also serves as a critical steppingstone for advancing collaboration between NASA and the European Space Agency (ESA).
HLS’s frequent revisit is one of its key values to data users. Zhou et al. (2025) evaluated the cloud-free coverage of HLS V2.0 in 2022 and found that HLS data provided observations every 1.6 days at the global scale and 2.2 days in data-scarce tropical regions. This temporal resolution addresses one of the most persistent challenges in optical remote sensing: obtaining cloud-free observations for time-sensitive applications.
HLS Impacts
Already, scientists are putting HLS to use for practical and scientific applications. Zhou et al. (2025) evaluated the global consistency, reliability, and uncertainty of the newly-released suite of nine HLS vegetation indices. This assessment provides the scientific community with confidence in using HLS-derived vegetation indices for agriculture, forestry, ecosystem monitoring, and more.
Pickens et al. (2025) unveiled a global land change monitoring system, DIST-ALERT, based on HLS data. DIST-ALERT highlights HLS’s transformative impact on environmental monitoring, identifying new land change dynamics that are impossible to track with Landsat or Sentinel observations alone.
Vision for the Future
The HLS program continues to evolve to deliver high-quality, reliable data to its expanding user base. Shi et al. (2026, under review in Remote Sensing of Environment) developed Fmask version 5.0, employing a hybrid approach combining physical rules, machine learning, and deep learning for cloud masking. When released, this next-generation cloud detection algorithm will improve the accuracy and consistency of cloud/cloud-shadow screening—a critical component for maximizing usable observations in the HLS time series.
Looking forward, the HLS vision encompasses:
Enhanced Algorithms: Integrating Fmask v5.0 and refining harmonization algorithms to further reduce inter-sensor differences and improve accuracy across diverse conditions.
Meeting User Needs: Strengthening partnerships with operational agencies and downstream users to ensure HLS products effectively support applications including agriculture, water resources, disaster response, and climate adaptation.
Continuity and Sustainability: Planning for long-term data continuity as Landsat Next and future Sentinel missions come online, ensuring seamless transition and multi-decadal consistency.
Community Engagement: Expanding training, documentation, and outreach to maximize HLS adoption across the global user community, particularly in regions where frequent, free, analysis-ready data can transform environmental monitoring capabilities.
The HLS program exemplifies successful international collaboration in Earth observation, delivering on the promise of harmonized, frequent, global-scale monitoring. As we build on the foundation of HLS v2.0, the program is positioned to enable breakthrough science and operational applications that were previously impossible with individual satellite missions alone.
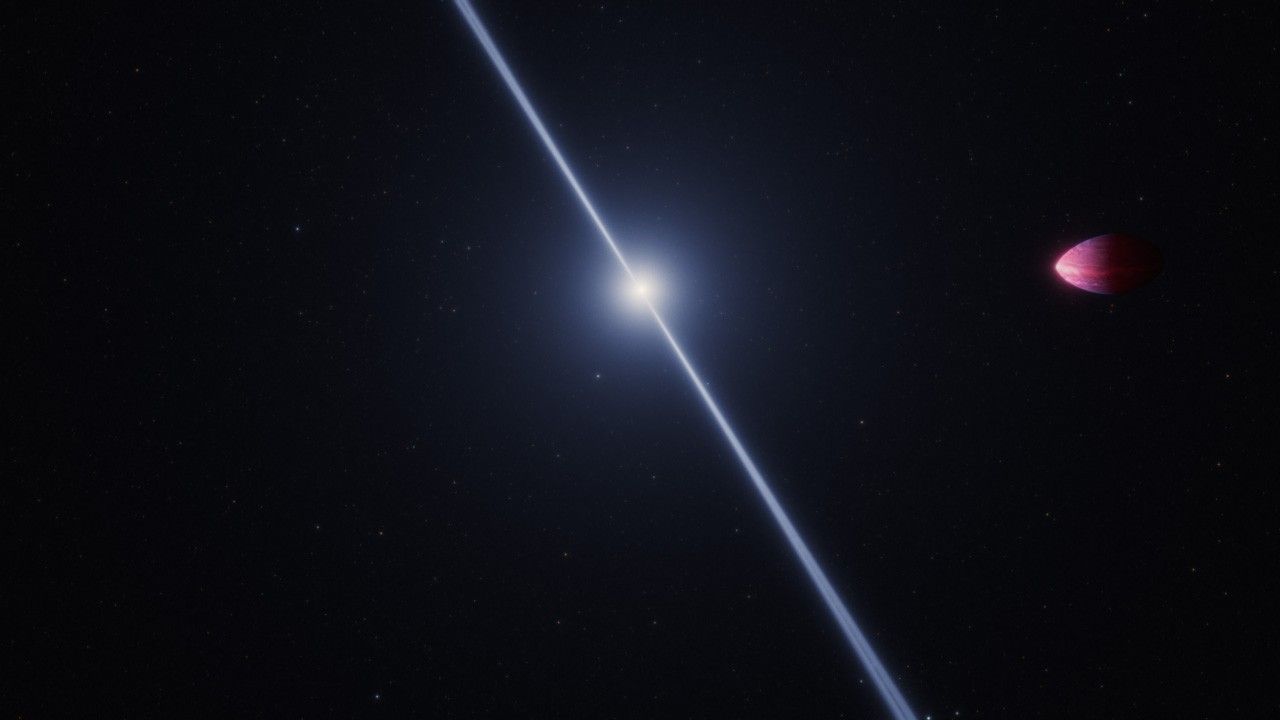
This artist’s concept shows what the exoplanet called PSR J2322-2650b (left) may look like as it orbits a rapidly spinning neutron star called a pulsar (right).
Credits: Illustration: NASA, ESA, CSA, Ralf Crawford (STScI)
Scientists using NASA’s James Webb Space Telescope have observed a rare type of exoplanet, or planet outside our solar system, whose atmospheric composition challenges our understanding of how it formed.
Officially named PSR J2322-2650b, this Jupiter-mass object appears to have an exotic helium-and-carbon-dominated atmosphere unlike any ever seen before. Soot clouds likely float through the air, and deep within the planet, these carbon clouds can condense and form diamonds. How the planet came to be is a mystery. The paper appears Tuesday in The Astrophysical Journal Letters.
“This was an absolute surprise,” said study co-author Peter Gao of the Carnegie Earth and Planets Laboratory in Washington. “I remember after we got the data down, our collective reaction was ‘What the heck is this?’ It’s extremely different from what we expected.”
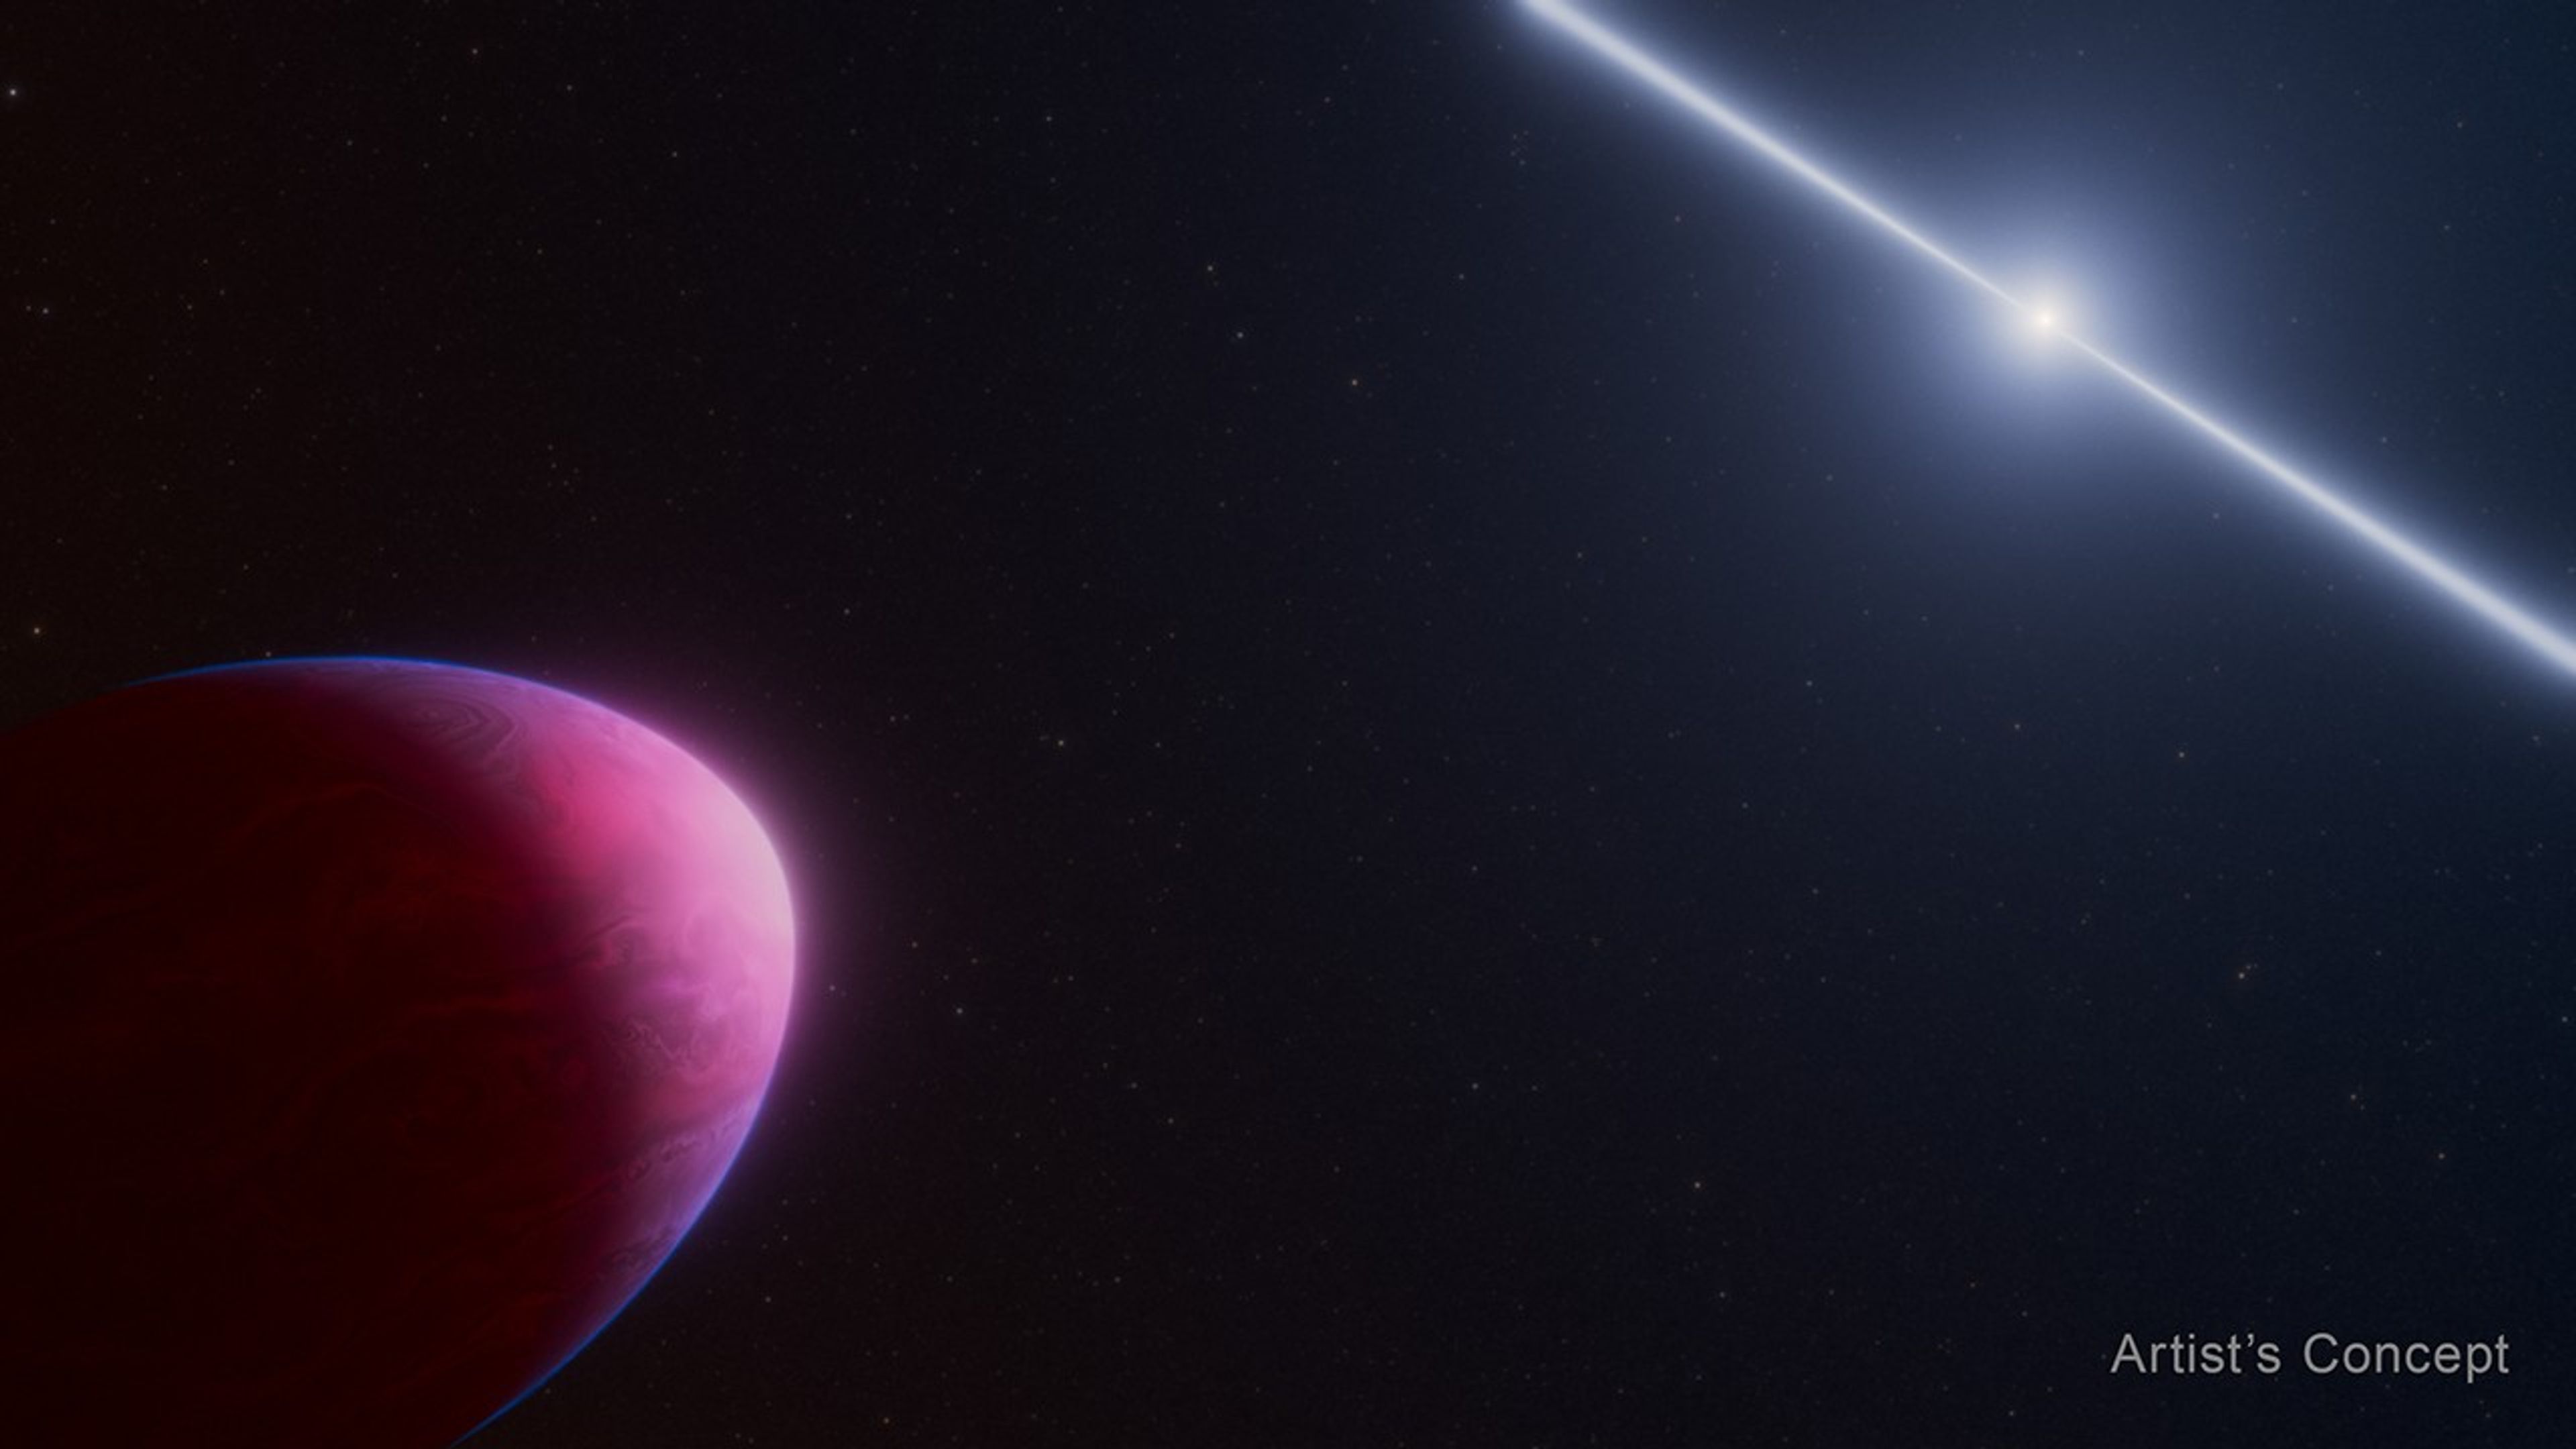
Image A: Exoplanet PSR J2322-2650b and Pulsar (Artist’s Concept)
This artist’s concept shows what the exoplanet called PSR J2322-2650b (left) may look like as it orbits a rapidly spinning neutron star called a pulsar (right). Gravitational forces from the much heavier pulsar are pulling the Jupiter-mass world into a bizarre lemon shape.
Illustration: NASA, ESA, CSA, Ralf Crawford (STScI)
This planet-mass object was known to orbit a pulsar, a rapidly spinning neutron star. A pulsar emits beams of electromagnetic radiation at regular intervals typically ranging from milliseconds to seconds. These pulsing beams can only be seen when they are pointing directly toward Earth, much like beams from a lighthouse.
This millisecond pulsar is expected to be emitting mostly gamma rays and other high energy particles, which are invisible to Webb’s infrared vision. Without a bright star in the way, scientists can study the planet in intricate detail across its whole orbit.
“This system is unique because we are able to view the planet illuminated by its host star, but not see the host star at all,” said Maya Beleznay, a third-year PhD candidate at Stanford University in California who worked on modeling the shape of the planet and the geometry of its orbit. “So we get a really pristine spectrum. And we can study this system in more detail than normal exoplanets.”
“The planet orbits a star that’s completely bizarre — the mass of the Sun, but the size of a city,” said the University of Chicago’s Michael Zhang, the principal investigator on this study. “This is a new type of planet atmosphere that nobody has ever seen before. Instead of finding the normal molecules we expect to see on an exoplanet — like water, methane, and carbon dioxide — we saw molecular carbon, specifically C3 and C2.”
Molecular carbon is very unusual because at these temperatures, if there are any other types of atoms in the atmosphere, carbon will bind to them. (Temperatures on the planet range from 1,200 degrees Fahrenheit at the coldest points of the night side to 3,700 degrees Fahrenheit at the hottest points of the day side.) Molecular carbon is only dominant if there’s almost no oxygen or nitrogen. Out of the approximately 150 planets that astronomers have studied inside and outside the solar system, no others have any detectable molecular carbon.
PSR J2322-2650b is extraordinarily close to its star, just 1 million miles away. In contrast, Earth’s distance from the Sun is about 100 million miles. Because of its extremely tight orbit, the exoplanet’s entire year — the time it takes to go around its star — is just 7.8 hours. Gravitational forces from the much heavier pulsar are pulling the Jupiter-mass planet into a bizarre lemon shape.
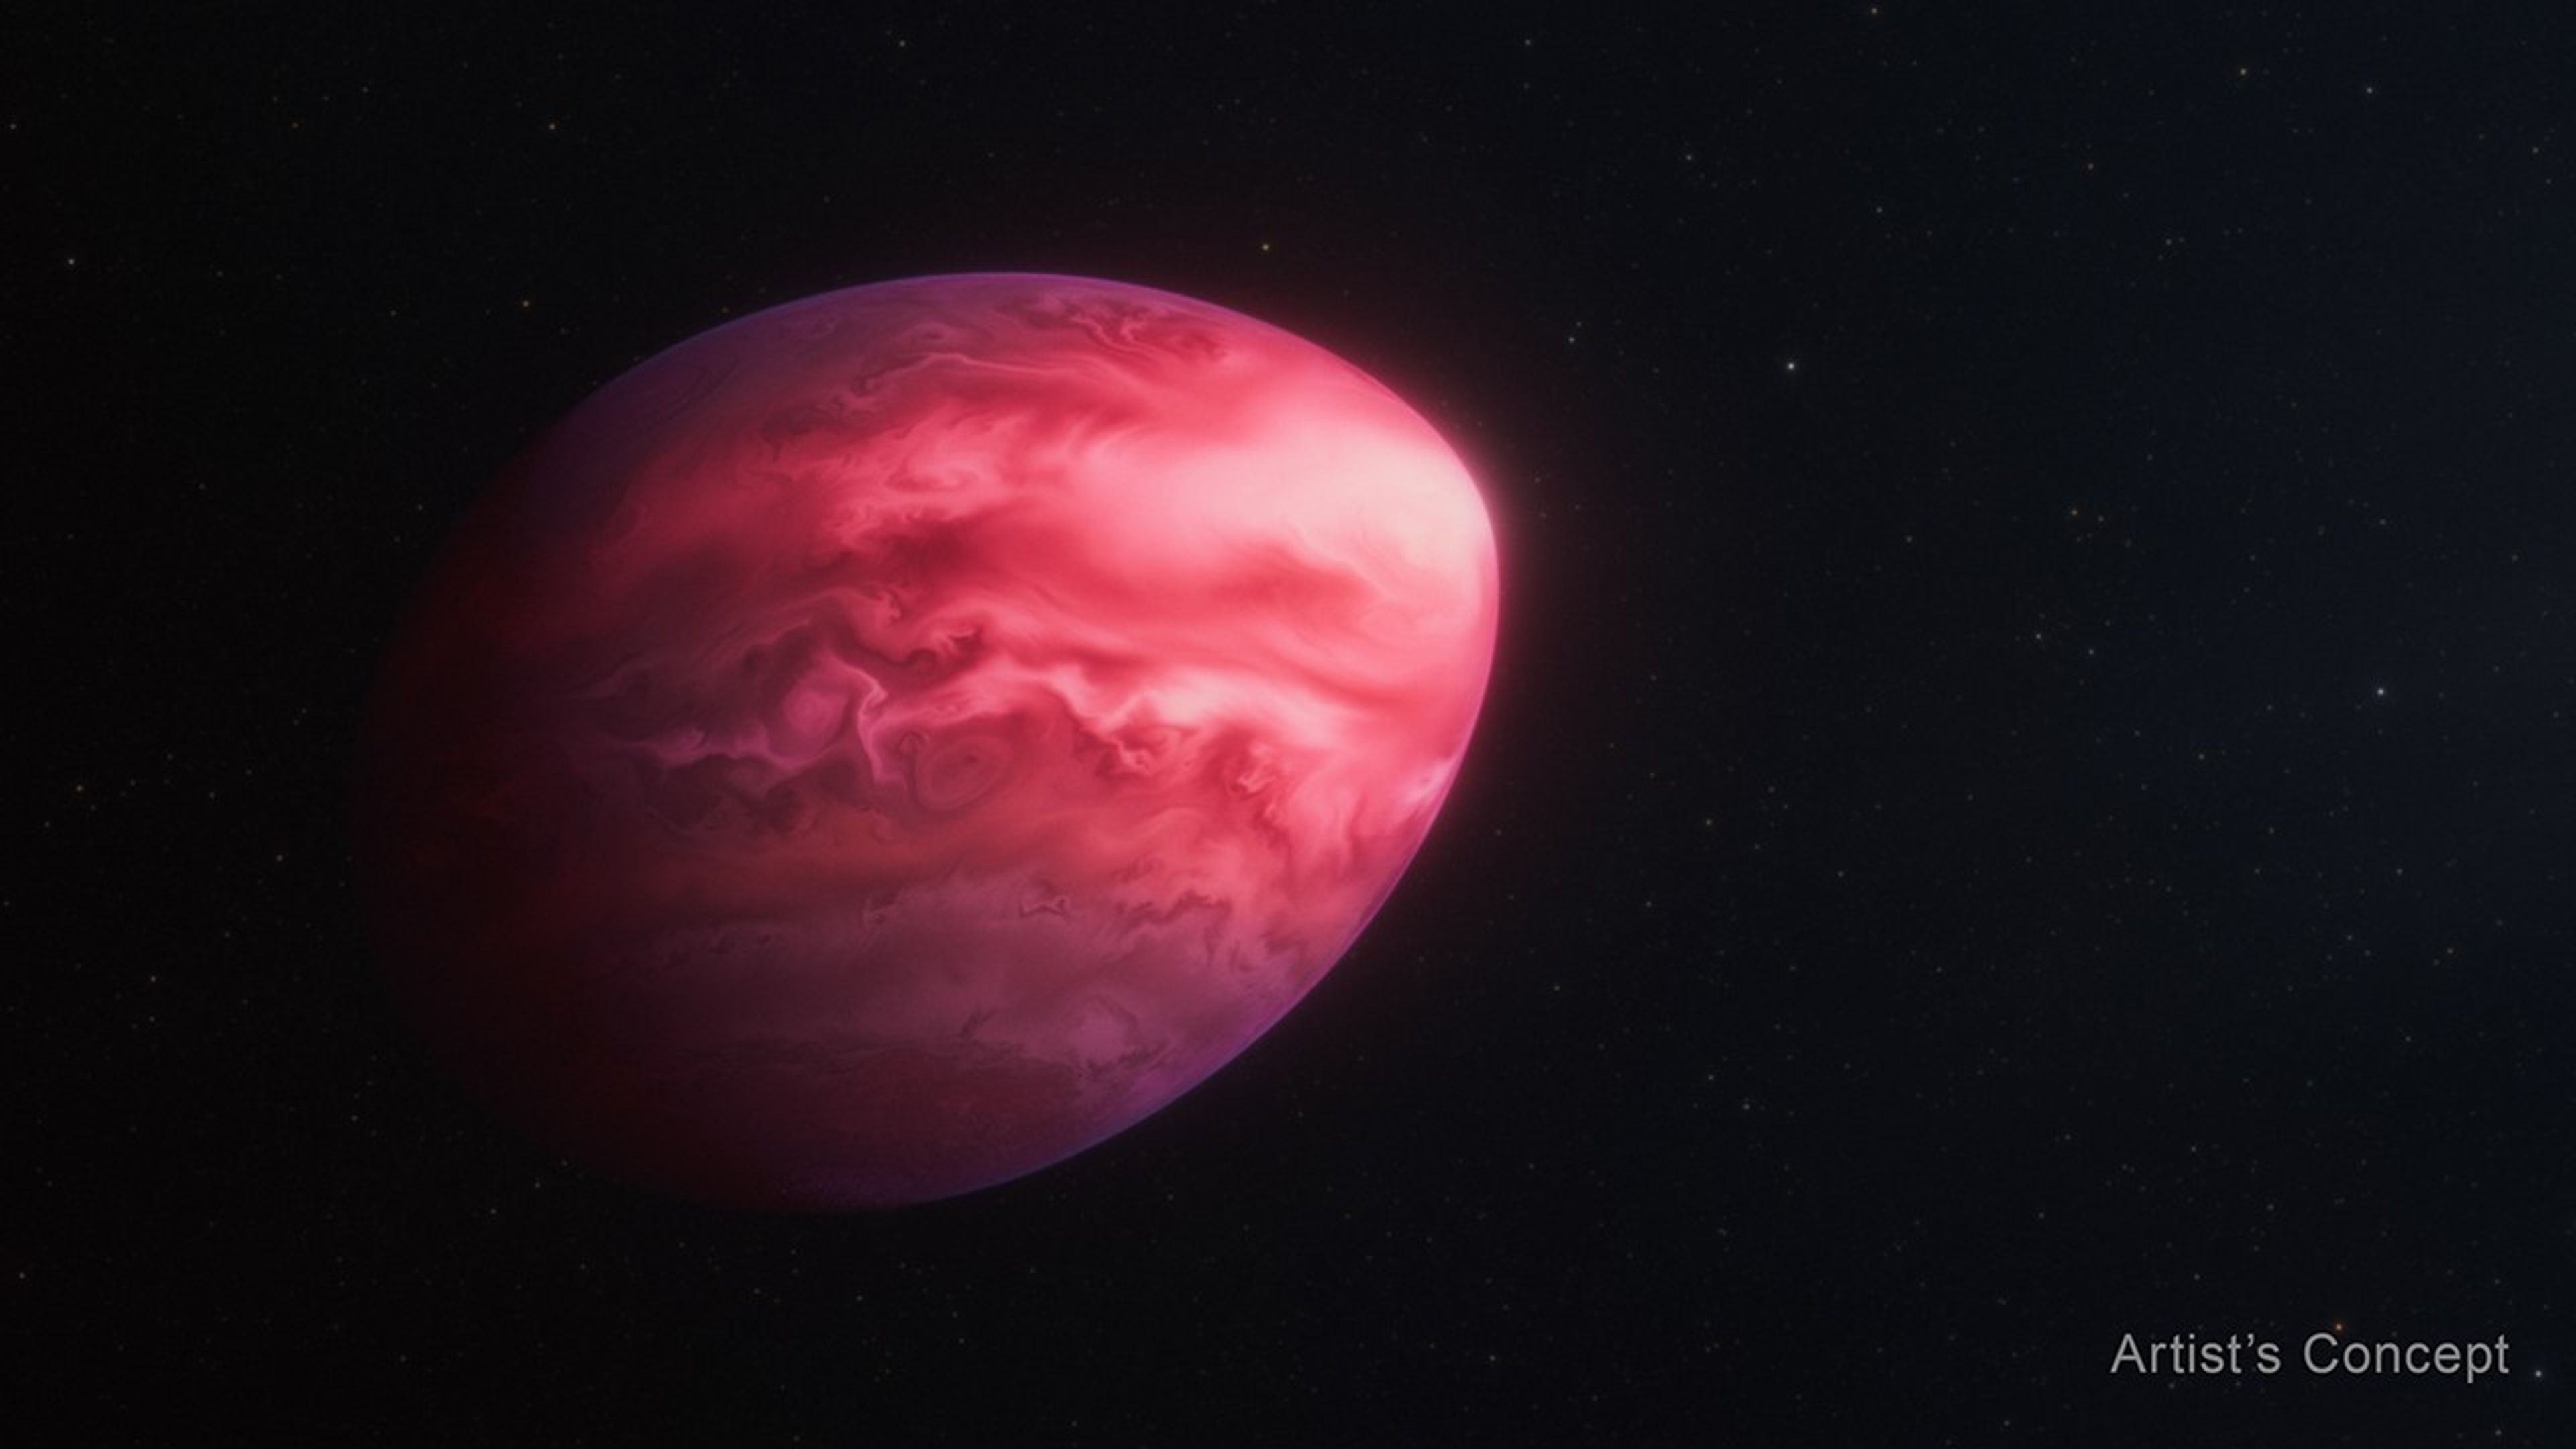
Image B: Exoplanet PSR J2322-2650b (Artist’s Concept)
This artist’s concept shows what the exoplanet PSR J2322-2650b may look like. Gravitational forces from the much heavier pulsar it orbits are pulling the Jupiter-mass world into this bizarre lemon shape.
Illustration: NASA, ESA, CSA, Ralf Crawford (STScI)
Together, the star and exoplanet may be considered a “black widow” system, though not a typical example. Black widow systems are a rare type of double system where a rapidly spinning pulsar is paired with a small, low-mass stellar companion. In the past, material from the companion streamed onto the pulsar, causing the pulsar to spin faster over time, which powers a strong wind. That wind and radiation then bombard and evaporate the smaller and less massive companion. Like the spider for which it is named, the pulsar slowly consumes its unfortunate partner.
But in this case, the companion is officially considered an exoplanet, not a star. The International Astronomical Union defines an exoplanet as a celestial body below 13 Jupiter masses that orbits a star, brown dwarf, or stellar remnant, such as a pulsar.
Of the 6,000 known exoplanets, this is the only one reminiscent of a gas giant (with mass, radius, and temperature similar to a hot Jupiter) orbiting a pulsar. Only a handful of pulsars are known to have planets.
“Did this thing form like a normal planet? No, because the composition is entirely different,” said Zhang. “Did it form by stripping the outside of a star, like ‘normal’ black widow systems are formed? Probably not, because nuclear physics does not make pure carbon. It’s very hard to imagine how you get this extremely carbon-enriched composition. It seems to rule out every known formation mechanism.”
Study co-author Roger Romani, of Stanford University and the Kavli Institute for Particle Astrophysics and Cosmology Institute, proposes one evocative phenomenon that could occur in the unique atmosphere. “As the companion cools down, the mixture of carbon and oxygen in the interior starts to crystallize,” said Romani. “Pure carbon crystals float to the top and get mixed into the helium, and that’s what we see. But then something has to happen to keep the oxygen and nitrogen away. And that’s where the mystery come in.
“But it’s nice to not know everything,” said Romani. “I’m looking forward to learning more about the weirdness of this atmosphere. It’s great to have a puzzle to go after.”
Video A: Exoplanet PSR J2322-2650b and Pulsar (Artist’s Concept)
This animation shows an exotic exoplanet orbiting a distant pulsar, or rapidly rotating neutron star with radio pulses. The planet, which orbits about 1 million miles away from the pulsar, is stretched into a lemon shape by the pulsar’s strong gravitational tides.
Animation: NASA, ESA, CSA, Ralf Crawford (STScI)
With its infrared vision and exquisite sensitivity, this is a discovery only the Webb telescope could make. Its perch a million miles from Earth and its huge sunshield keep the instruments very cold, which is necessary for these observations. It is not possible to conduct this study from the ground.
The James Webb Space Telescope is the world’s premier space science observatory. Webb is solving mysteries in our solar system, looking beyond to distant worlds around other stars, and probing the mysterious structures and origins of our universe and our place in it. Webb is an international program led by NASA with its partners, ESA (European Space Agency) and CSA (Canadian Space Agency).
The following sections contain links to download this article’s images and videos in all available resolutions followed by related information links, media contacts, and if available, research paper and spanish translation links.
Related Images & Videos
Exoplanet PSR J2322-2650b and Pulsar (Artist’s Concept)
This artist’s concept shows what the exoplanet called PSR J2322-2650b (left) may look like as it orbits a rapidly spinning neutron star called a pulsar (right). Gravitational forces from the much heavier pulsar are pulling the Jupiter-mass world into a bizarre lemon shape.
Exoplanet PSR J2322-2650b (Artist’s Concept)
This artist’s concept shows what the exoplanet PSR J2322-2650b may look like. Gravitational forces from the much heavier pulsar it orbits are pulling the Jupiter-mass world into this bizarre lemon shape.
Exoplanet PSR J2322-2650b Orbiting a Pulsar
This animation shows an exotic exoplanet orbiting a distant pulsar, or rapidly rotating neutron star with radio pulses. The planet, which orbits about 1 million miles away from the pulsar, is stretched into a lemon shape by the pulsar’s strong gravitational tides. NASA&rsqu…
The NASA ORBIT (Opportunities in Research, Business, Innovation, and Technology for the Workforce) Challenge is a multi-phase, student-focused challenge designed to inspire and empower the next generation of innovators, engineers, entrepreneurs, and researchers.
Compete for cash prizes, receive mentorship from NASA experts, and present your work at an in-person showcase. Finalists gain access to an exclusive accelerator program designed to launch careers in STEM and entrepreneurship.
NASA’s Carruthers Geocorona Observatory has captured its first images from space, revealing rare views of Earth and the Moon in ultraviolet light. Taken on Nov. 17 — still months before the mission’s science phase begins — these “first light” images confirm the spacecraft is healthy while hinting at the incredible views to come.
The initial images consist of two from Carruthers’ Wide Field Imager and two from its Narrow Field Imager. Each imager captured two different views: one showing a broad spectrum of far ultraviolet light, and one revealing light from Earth’s geocorona.
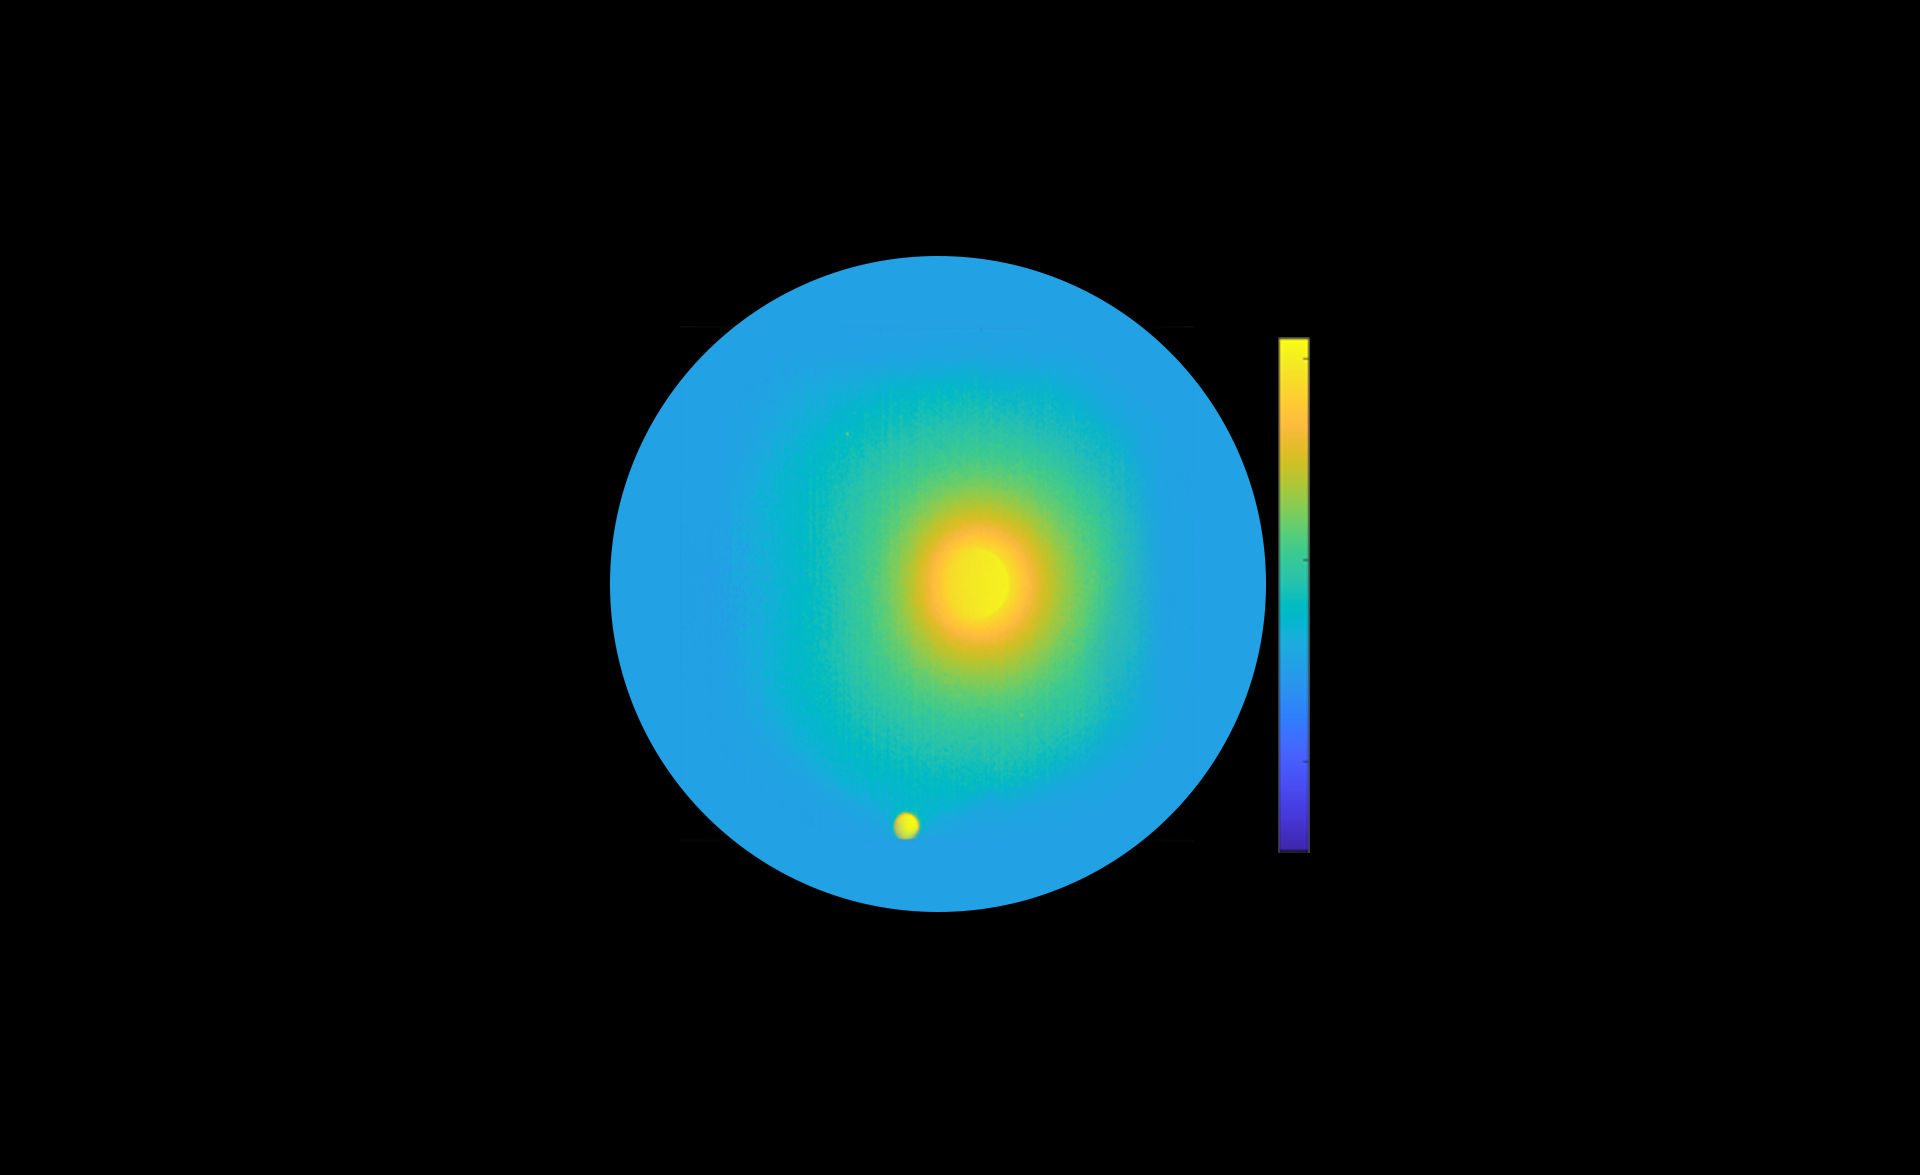
These four images constitute the “first light” for the Carruthers Geocorona Observatory mission. The images were taken on Nov. 17, 2025, from a location near the Sun-Earth Lagrange point 1 by the spacecraft’s Wide Field Imager (left column) and Narrow Field Imager (right column) in far ultraviolet light (top row) and the specific wavelength of light emitted by atomic hydrogen known as Lyman-alpha (bottom row). Earth is the larger, bright circle near the middle of each image; the Moon is the smaller circle below and to the left of it. The fuzzy “halo” around Earth in the images in the bottom row is the geocorona: the ultraviolet light emitted by Earth’s exosphere, or outermost atmospheric layer. The lunar surface still shines in Lyman-alpha because its rocky surface reflects all wavelengths of sunlight — one reason it is important to compare Lyman-alpha images with the broad ultraviolet filter. The far ultraviolet light imagery from the Narrow Field Imagery also captured two background stars, whose surface temperatures must be approximately twice as hot as the our Sun’s to be so bright in this wavelength of light.
NASA/Carruthers Geocorona Observatory
When Carruthers captured these images, the Moon was also in its field of view and slightly closer to the spacecraft than Earth was, making the Moon appear larger and closer to Earth than usual.
The specific wavelength Carruthers observed in two of the images, called Lyman-alpha, is light emitted by atomic hydrogen. The faint glow of Lyman-alpha from hydrogen in Earth’s outer atmosphere is called the “geocorona,” Latin for “Earth crown.”
In the broad-spectrum images, the Moon and Earth look similar: both are spheres with well-defined edges. However, in the Lyman-alpha filter, the Moon still appears as a crisp, sharp sphere while Earth appears surrounded by a bright “fuzz” extending out to space. This glow is the geocorona, the primary focus of the Carruthers mission. It is the only way to “see” Earth’s outermost atmospheric layer, although the light of the geocorona has only been photographed a handful of times in history. Carruthers will be the first mission to image it repeatedly, and from far enough away to see its great extent and discover how it changes over time.
These first images also offer a rare treat: sunlight reflected off the far side of the Moon, a view impossible to capture from Earth.
Original
Annotated
Original
Annotated
Carruthers Geocorona ObservatorY
A View of Earth’s Geocorona
Narrow Field Imager/Lyman-alpha filter
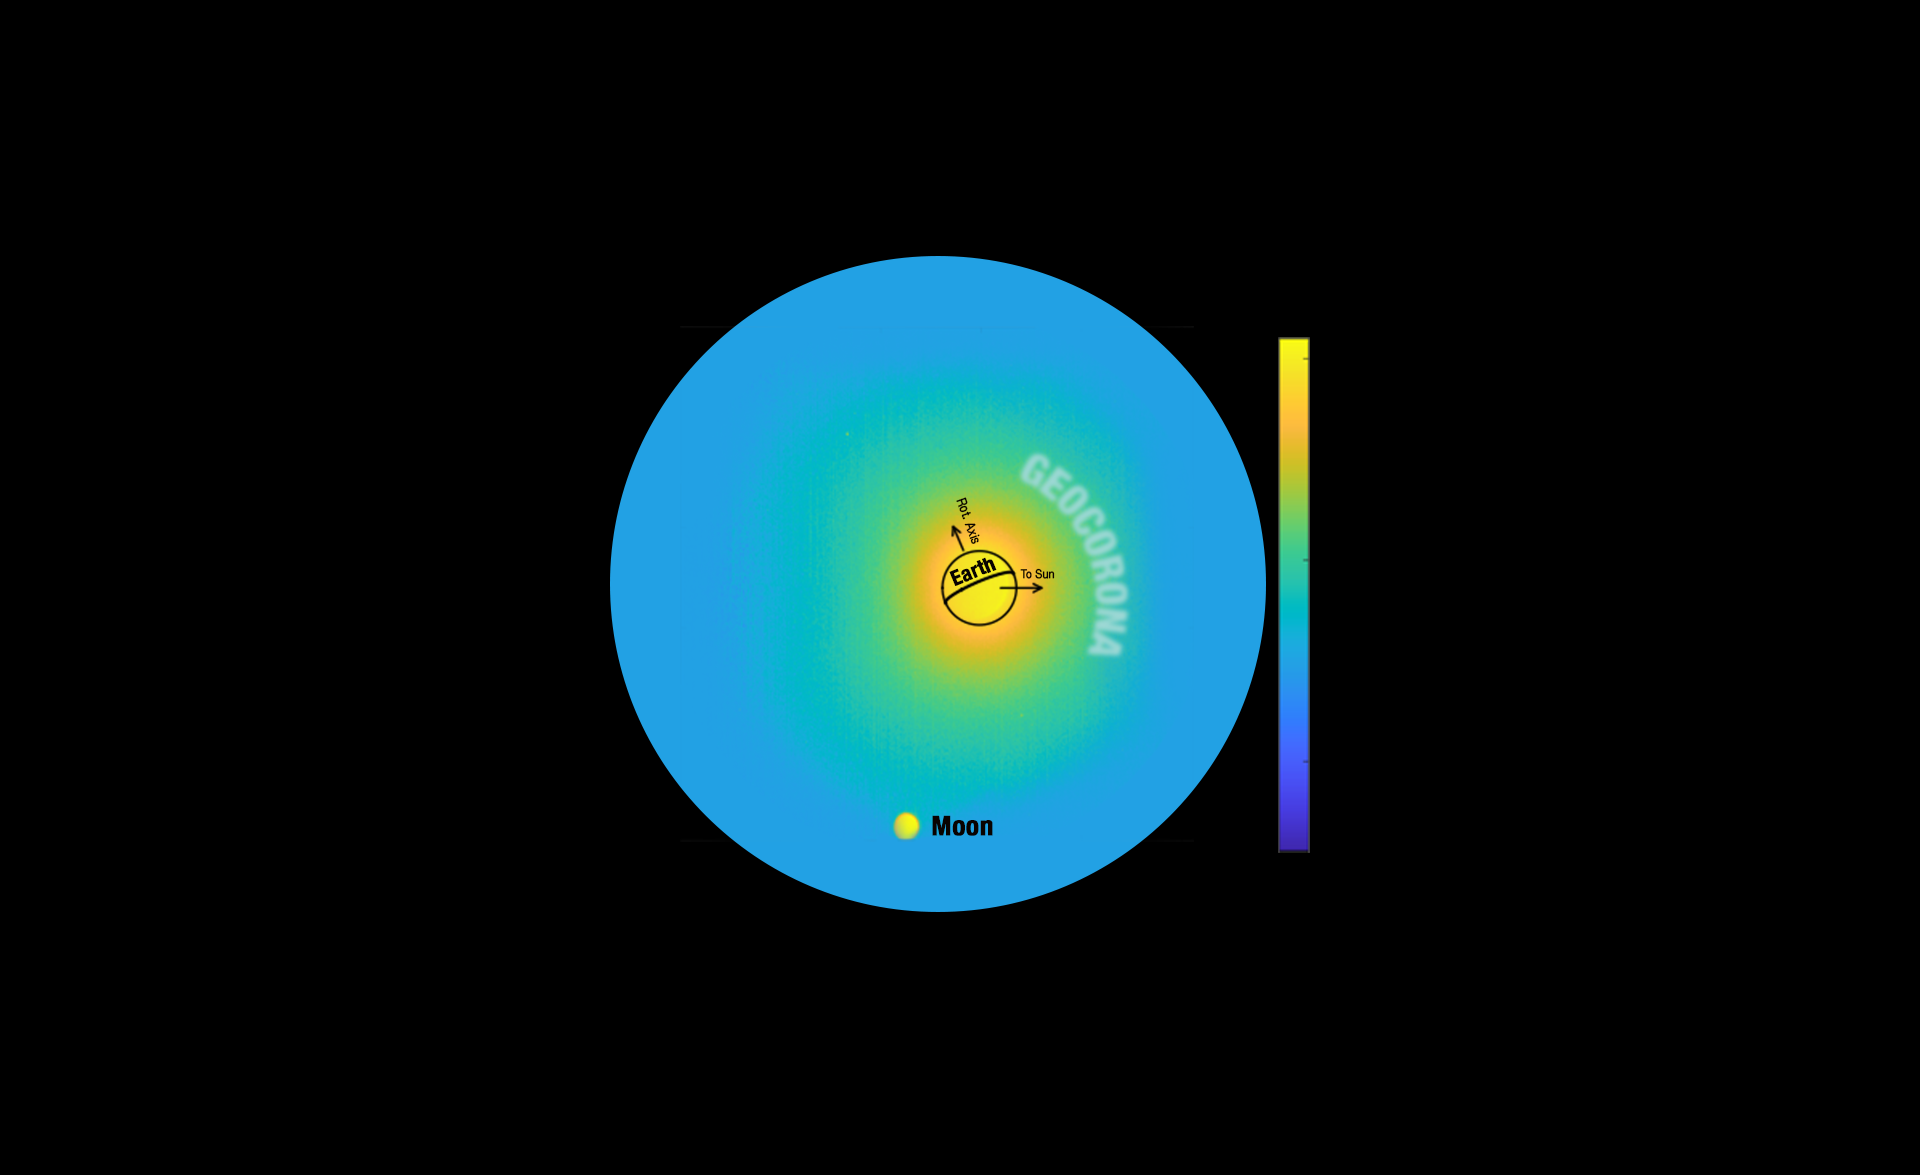
This view of the Earth, Moon, and Earth’s geocorona was captured by the Carruthers Geocorona Observatory’s Narrow Field Imager on Nov. 17, 2025. Move the slider to switch between the original version and one with overlaid annotations. In the annotated version, labels for Earth, the Moon, and Earth’s geocorona are overlaid on the image. The circle around Earth represents Earth’s surface, and the arc around Earth’s middle represents the orientation of Earth’s equator. The arrow pointing up and slightly to the left from Earth represents Earth’s rotational axis. The arrow pointing out to the right from Earth represents the direction to the Sun. The color scale indicates brightness, with brighter light appearing more yellow and dimmer light appearing more blue. The ‘glow’ that extends beyond Earth’s surface and out into space is Earth’s geocorona, which is emitted by hydrogen atoms in Earth’s exosphere in a wavelength of ultraviolet light known as Lyman-alpha.
These initial images were taken with short, five-minute exposures — just long enough to confirm that the instrument is performing well. During the main science phase, Carruthers will take 30-minute exposures, allowing it to reveal even fainter details of the geocorona and trace how Earth’s outer atmosphere responds to the changing Sun.
Carruthers launched on Sept. 24 and is just a few weeks from completing its journey to the Sun-Earth Lagrange point 1, a point of gravitational balance roughly 1 million miles closer to the Sun than Earth is. Carruthers will begin its primary science phase in March 2026, when it will begin sending back a steady stream of ultraviolet portraits of our planet’s ever-shifting outer atmosphere.
By Miles Hatfield NASA’s Goddard Space Flight Center, Greenbelt, Md.
NASA’s IMAP Mission Captures ‘First Light,’ Looks Back at Earth
All 10 instruments aboard NASA’s newly launched IMAP (Interstellar Mapping and Acceleration Probe) mission have successfully recorded their first measurements in space. With these “first light” observations, the spacecraft is now collecting preliminary science data as it journeys to its observational post at Lagrange point 1 (L1), about 1 million miles from Earth toward the Sun.
“We are extremely pleased with the initial in-flight performance of the IMAP mission. All instruments have successfully powered on and our commissioning remains on track. We have already collected useful data including exercising our near-real-time space weather data stream,” said Brad Williams, IMAP program executive at NASA Headquarters in Washington. “This successful milestone is quickly setting the stage for the start of our primary science operations.”
As a modern-day celestial cartographer, IMAP will chart the boundaries of the heliosphere — a huge bubble created by the Sun’s wind that encapsulates our entire solar system — and study how the heliosphere interacts with the local galactic neighborhood beyond.
To map the heliosphere’s boundaries, IMAP is equipped with three instruments that measure energetic neutral atoms: IMAP-Lo, IMAP-Hi, and IMAP-Ultra. These uncharged particles, called ENAs for short, are cosmic messengers formed at the heliosphere’s edge that allow scientists to study the boundary region and its variability from afar.
These partial maps of the heliosphere’s boundaries were compiled from first-light data from the IMAP-Hi, IMAP-Lo, and IMAP-Ultra instruments. These initial looks offer a first glimpse at the detail NASA’s IMAP (Interstellar Mapping and Acceleration Probe) will be able to capture. The warmer colors show regions with more energetic neutral atoms (ENAs).
NASA
“It’s just astounding that within the first couple weeks of observations, we see such clear and consistent ENA data across the factor of 10,000 in energy covered collectively by the three imagers,” said David McComas, Princeton University professor and principal investigator for the IMAP mission. “This, plus excellent first light data from all seven of the other instruments, makes for a 10 out of 10, A-plus start to the mission.”
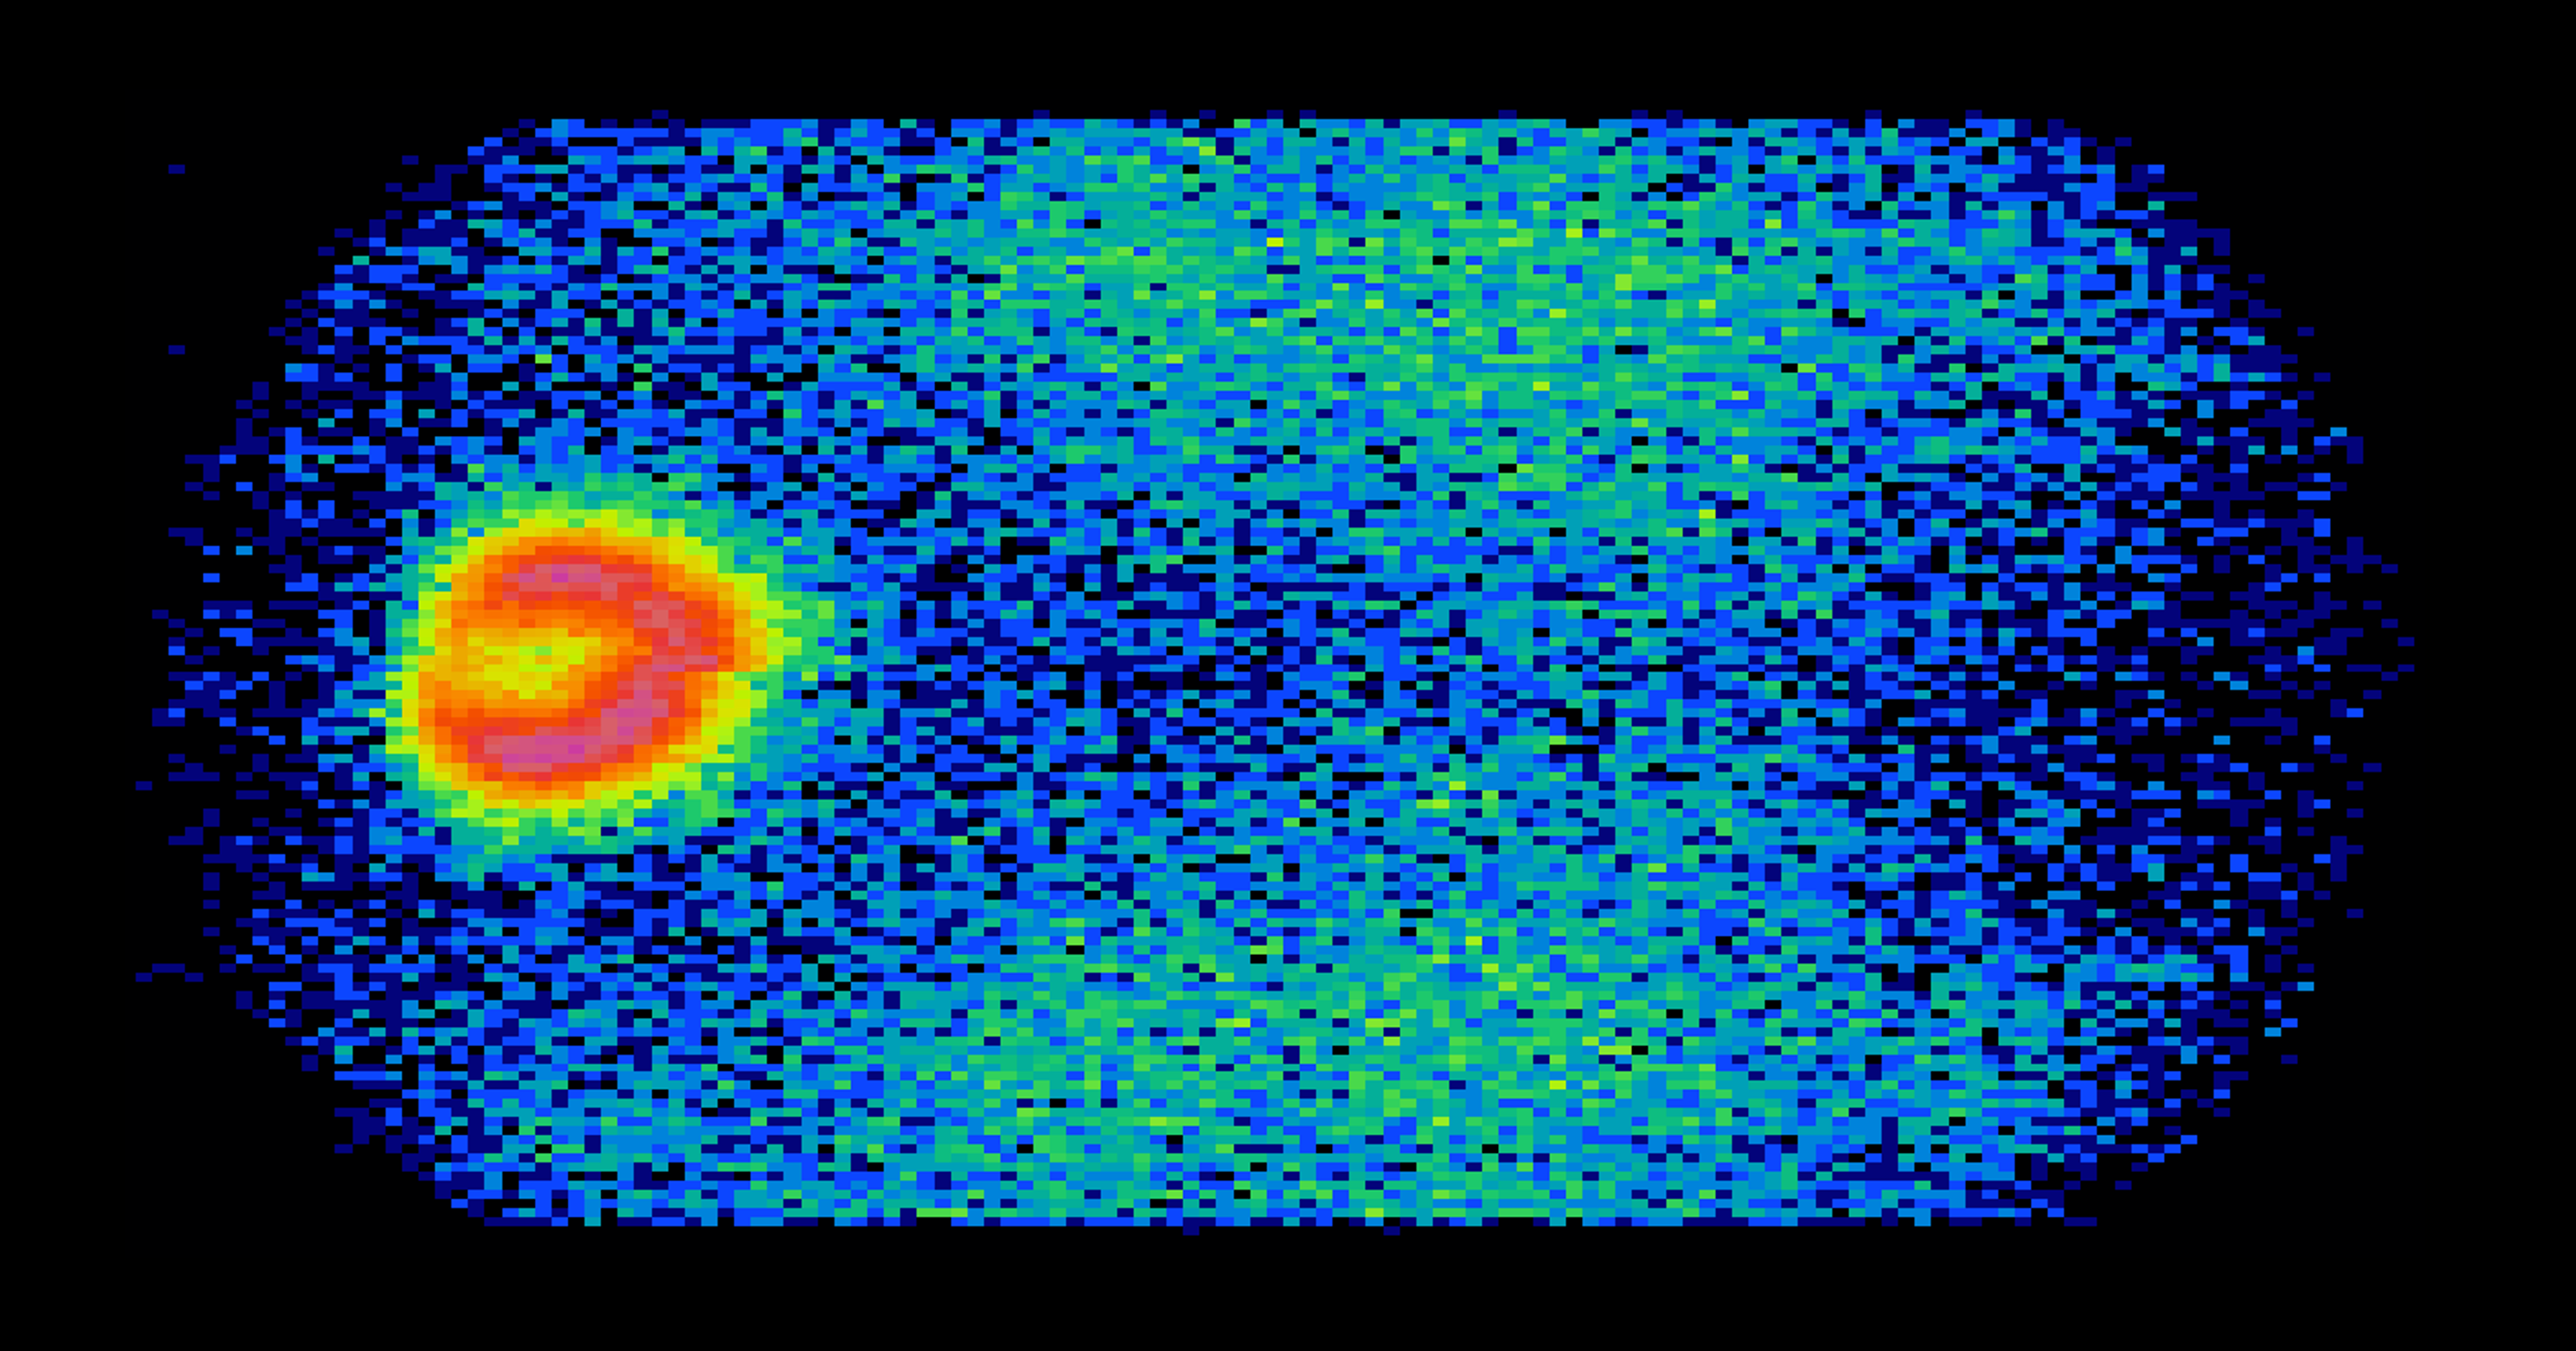
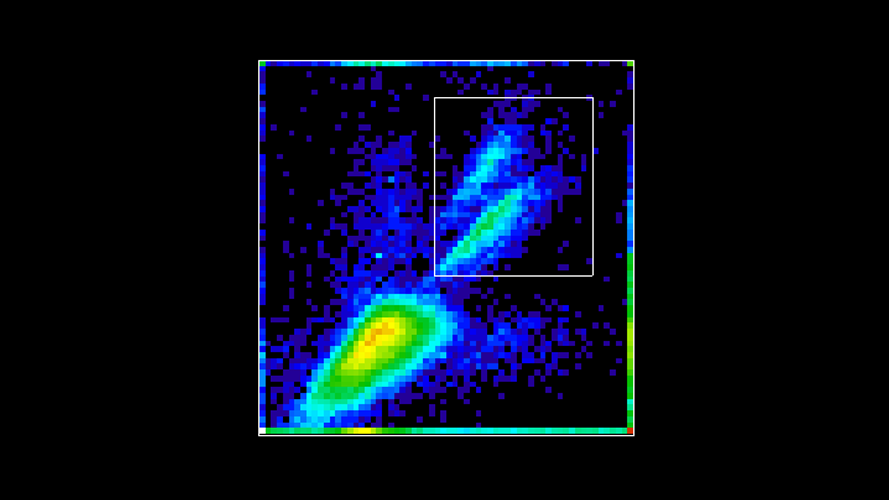
As IMAP travelled away from Earth, the IMAP-Ultra instrument looked back at the planet and picked up ENAs created by Earth’s magnetic environment. These terrestrially made ENAs, which overwhelm ENAs coming from the heliosphere in sheer numbers, is a reason why IMAP will be stationed at L1. There the spacecraft will have an unobstructed view of ENAs coming from the heliosphere’s boundaries.
Earth’s magnetic environment can be seen glowing bright in this image taken by the IMAP-Ultra instrument, which includes ENA data as well as noise. Earth sits at the center of the red donut-shaped structure. This image was taken as IMAP left Earth for its post at Lagrange point 1.
NASA
The mission will also study the solar wind, a continuous flow of charged particles coming from the Sun. Solar wind observations from five of IMAP’s instruments will be used by the IMAP Active Link for Real-Time (I-ALiRT) system to provide roughly a half hour’s warning to voyaging astronauts and spacecraft near Earth about harmful space weather and radiation coming their way. The IMAP instruments are already making near-real-time solar wind measurements that can be used to support space weather forecasts. The I-ALiRT network is being exercised and will be ready for space weather forecasters when IMAP starts its regular science mission at L1.
With all of IMAP’s instruments up and running, the mission has nearly completed its commissioning stage and will arrive at L1 in early January. The mission is now working to complete the final commissioning steps and instrument calibration with the goal of being ready to take operational science data starting Saturday, Feb. 1, 2026.
Here’s a look at IMAP’s instruments and what they’ve seen in their first-light observations.
IMAP-Lo, IMAP-Hi, and IMAP-Ultra
The three ENA (energetic neutral atom) instruments, IMAP-Lo, IMAP-Hi, and IMAP-Ultra, will help construct maps of the boundaries of the heliosphere, which will advance our understanding of how the solar wind interacts with our local galaxy. The green streak in this image from IMAP-Hi shows the instrument’s ability to separate ENAs from other particles such as cosmic rays (green and yellow blob).
NASA
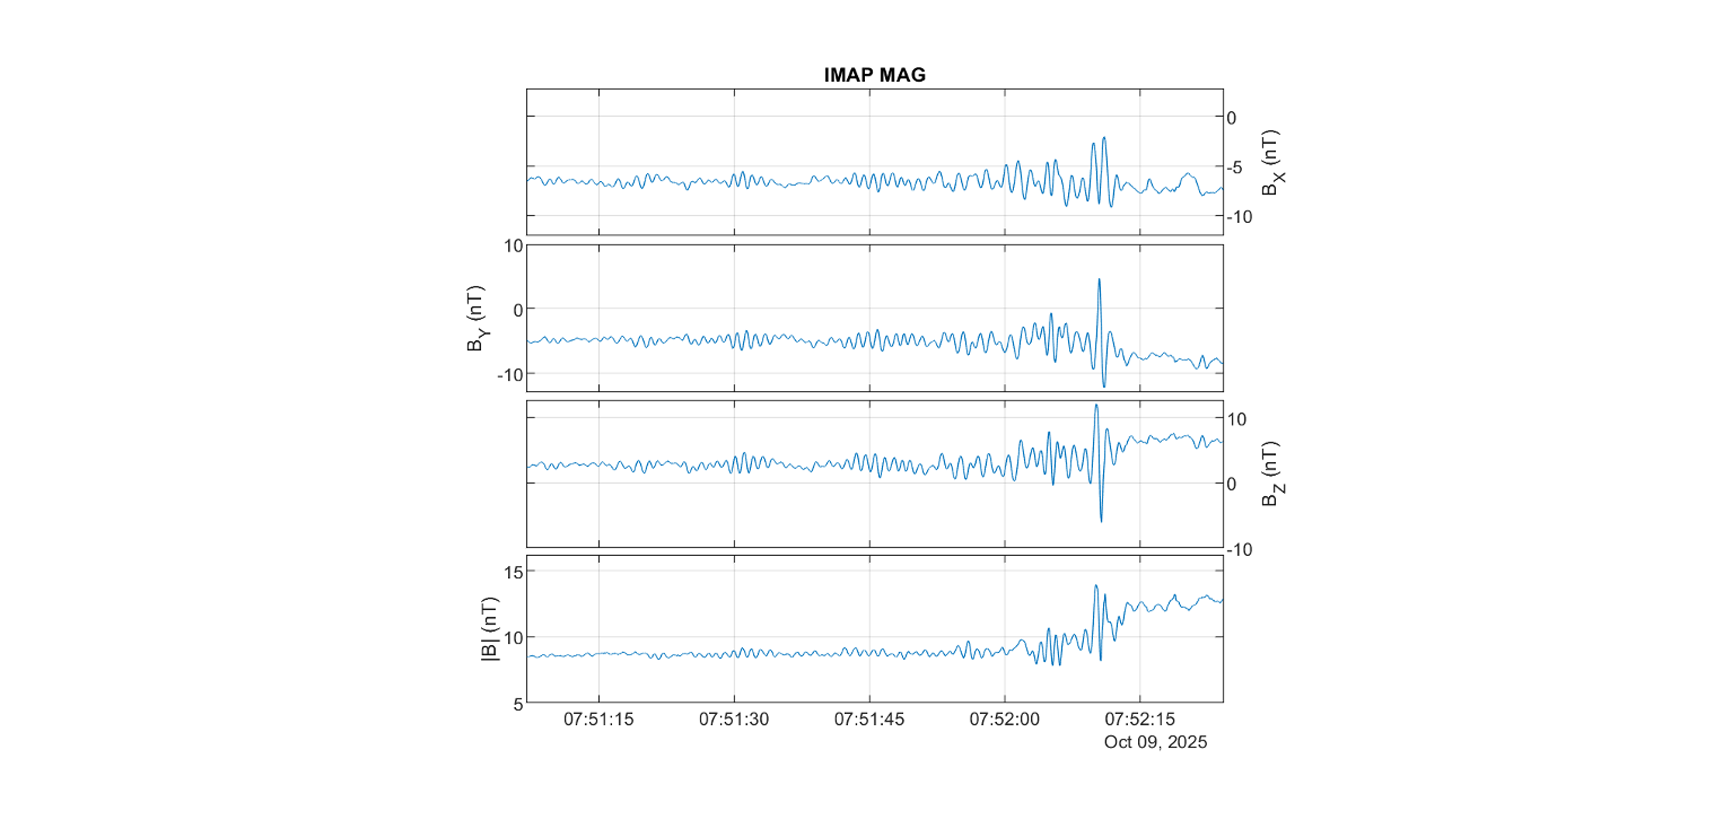
MAG
The magnetometer instrument measures magnetic fields from the Sun that stretch across the solar system. Its first-light data clearly shows dynamic changes in the solar wind’s magnetic field due to a shockwave created by the solar wind (squiggles at right).
NASA
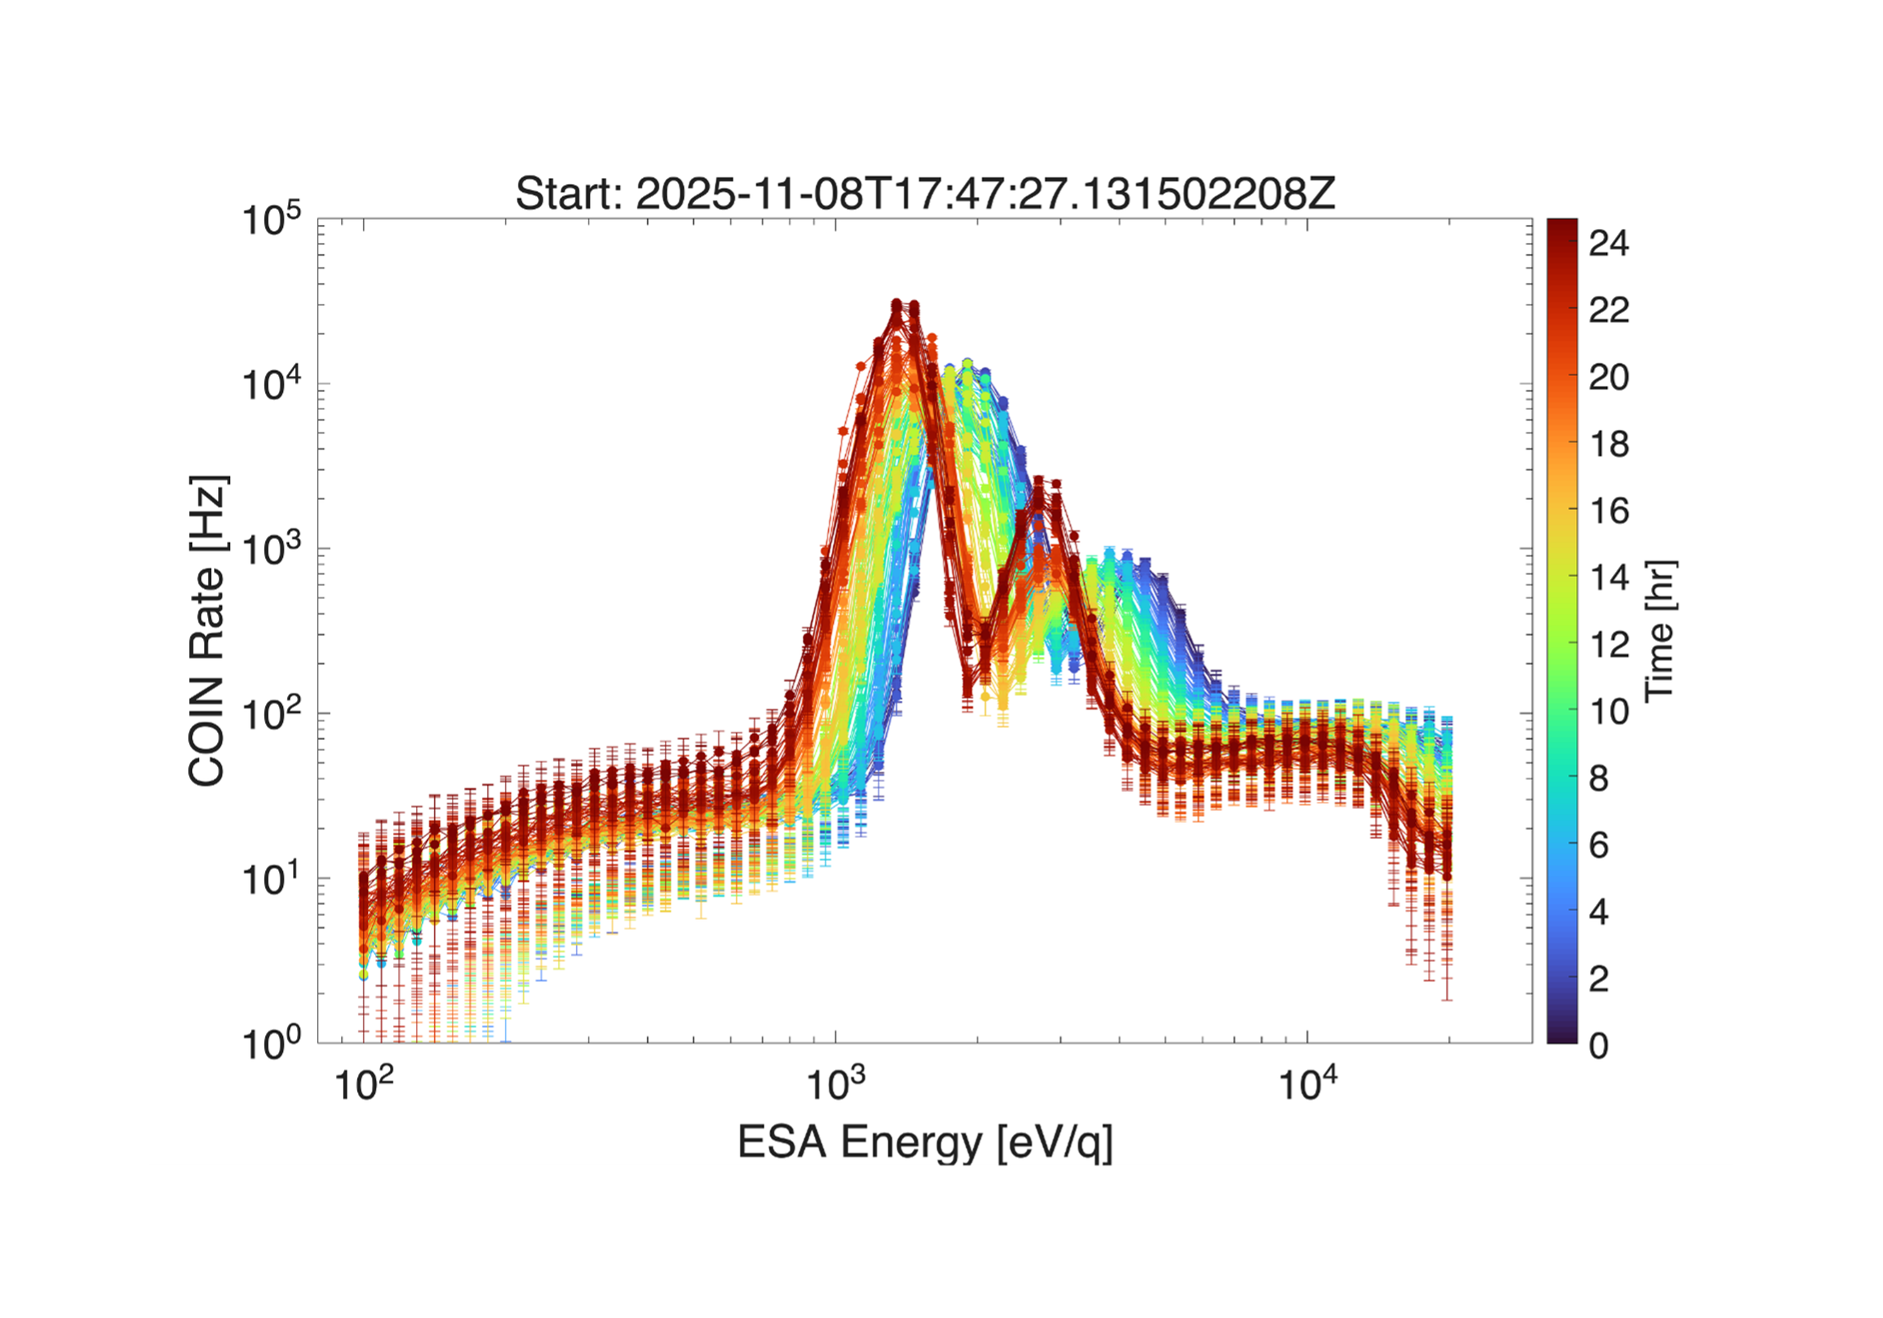
SWAPI
The Solar Wind and Pickup Ions (SWAPI) instrument measures ions from the solar wind and charged particles from beyond the solar system. Initial data from SWAPI showed a change in the composition of the solar wind over one day. This image shows particles from a coronal mass ejection on Nov. 11 and 12, 2025.
NASA
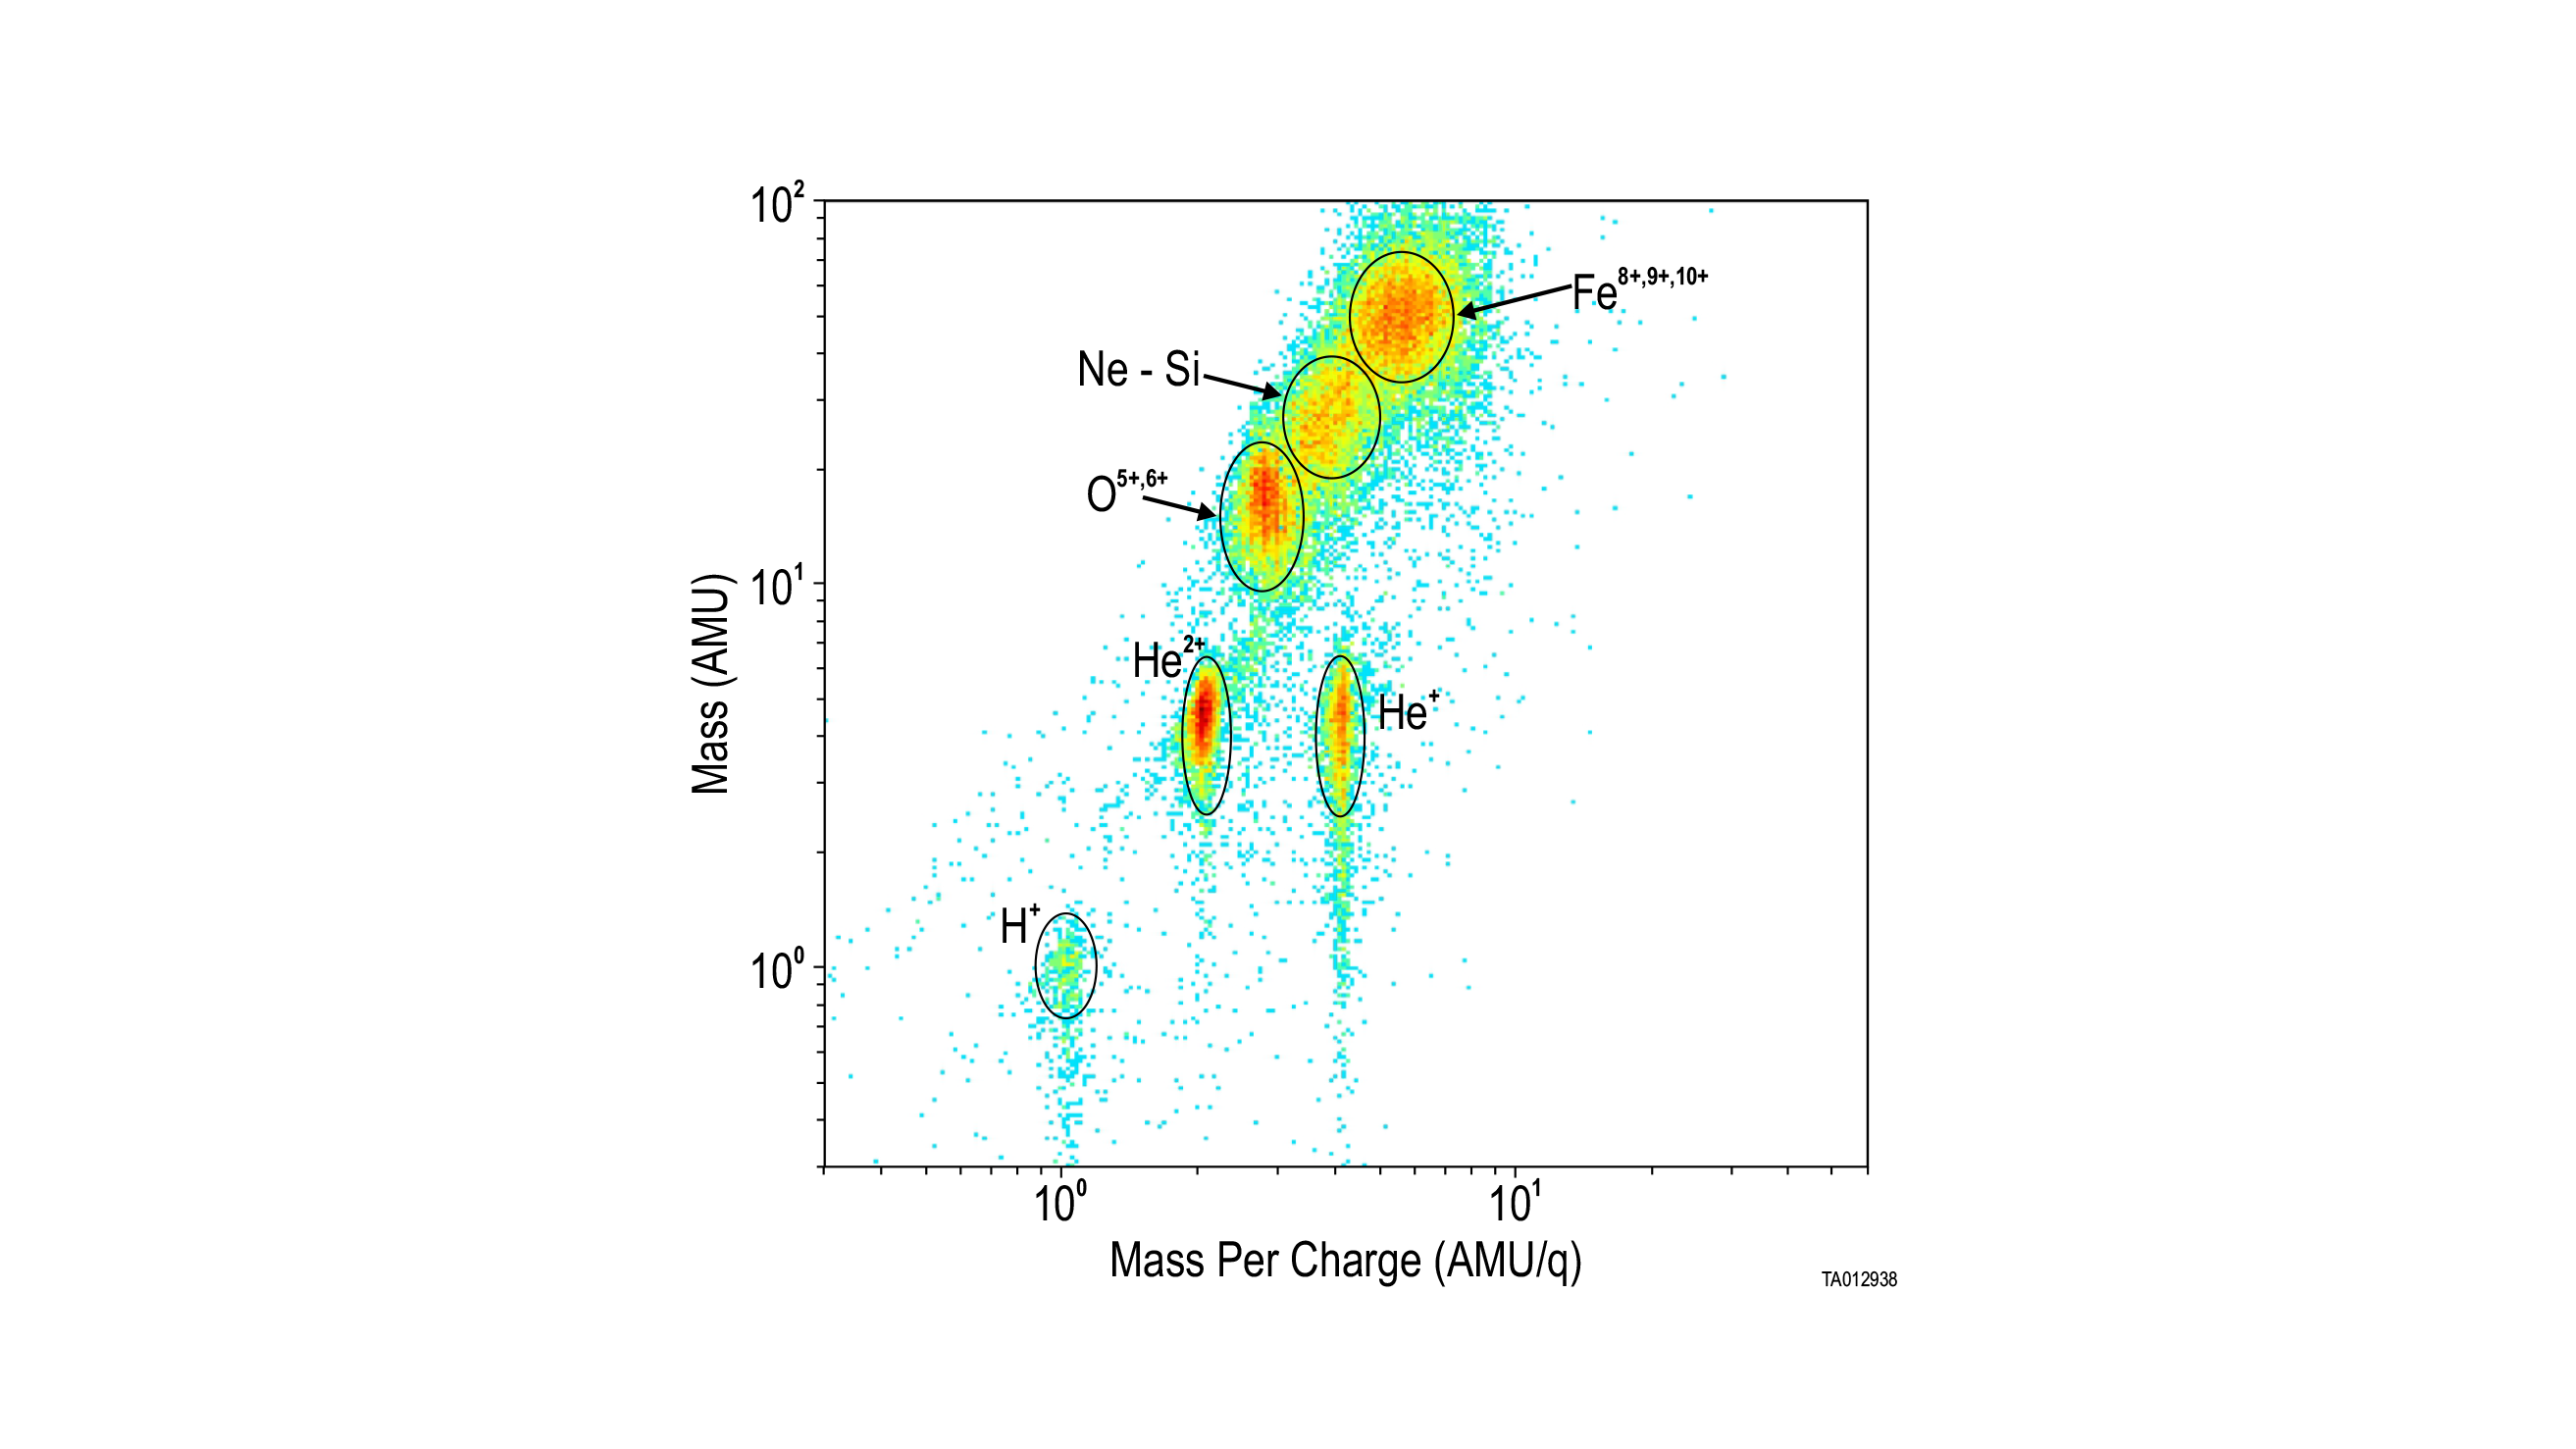
CoDICE
The Compact Dual Ion Composition Experiment (CoDICE) instrument measures ions from the solar wind and charged particles from beyond the solar system. It detected different types of oxygen, hydrogen, and helium atoms in its first-light data.
NASA
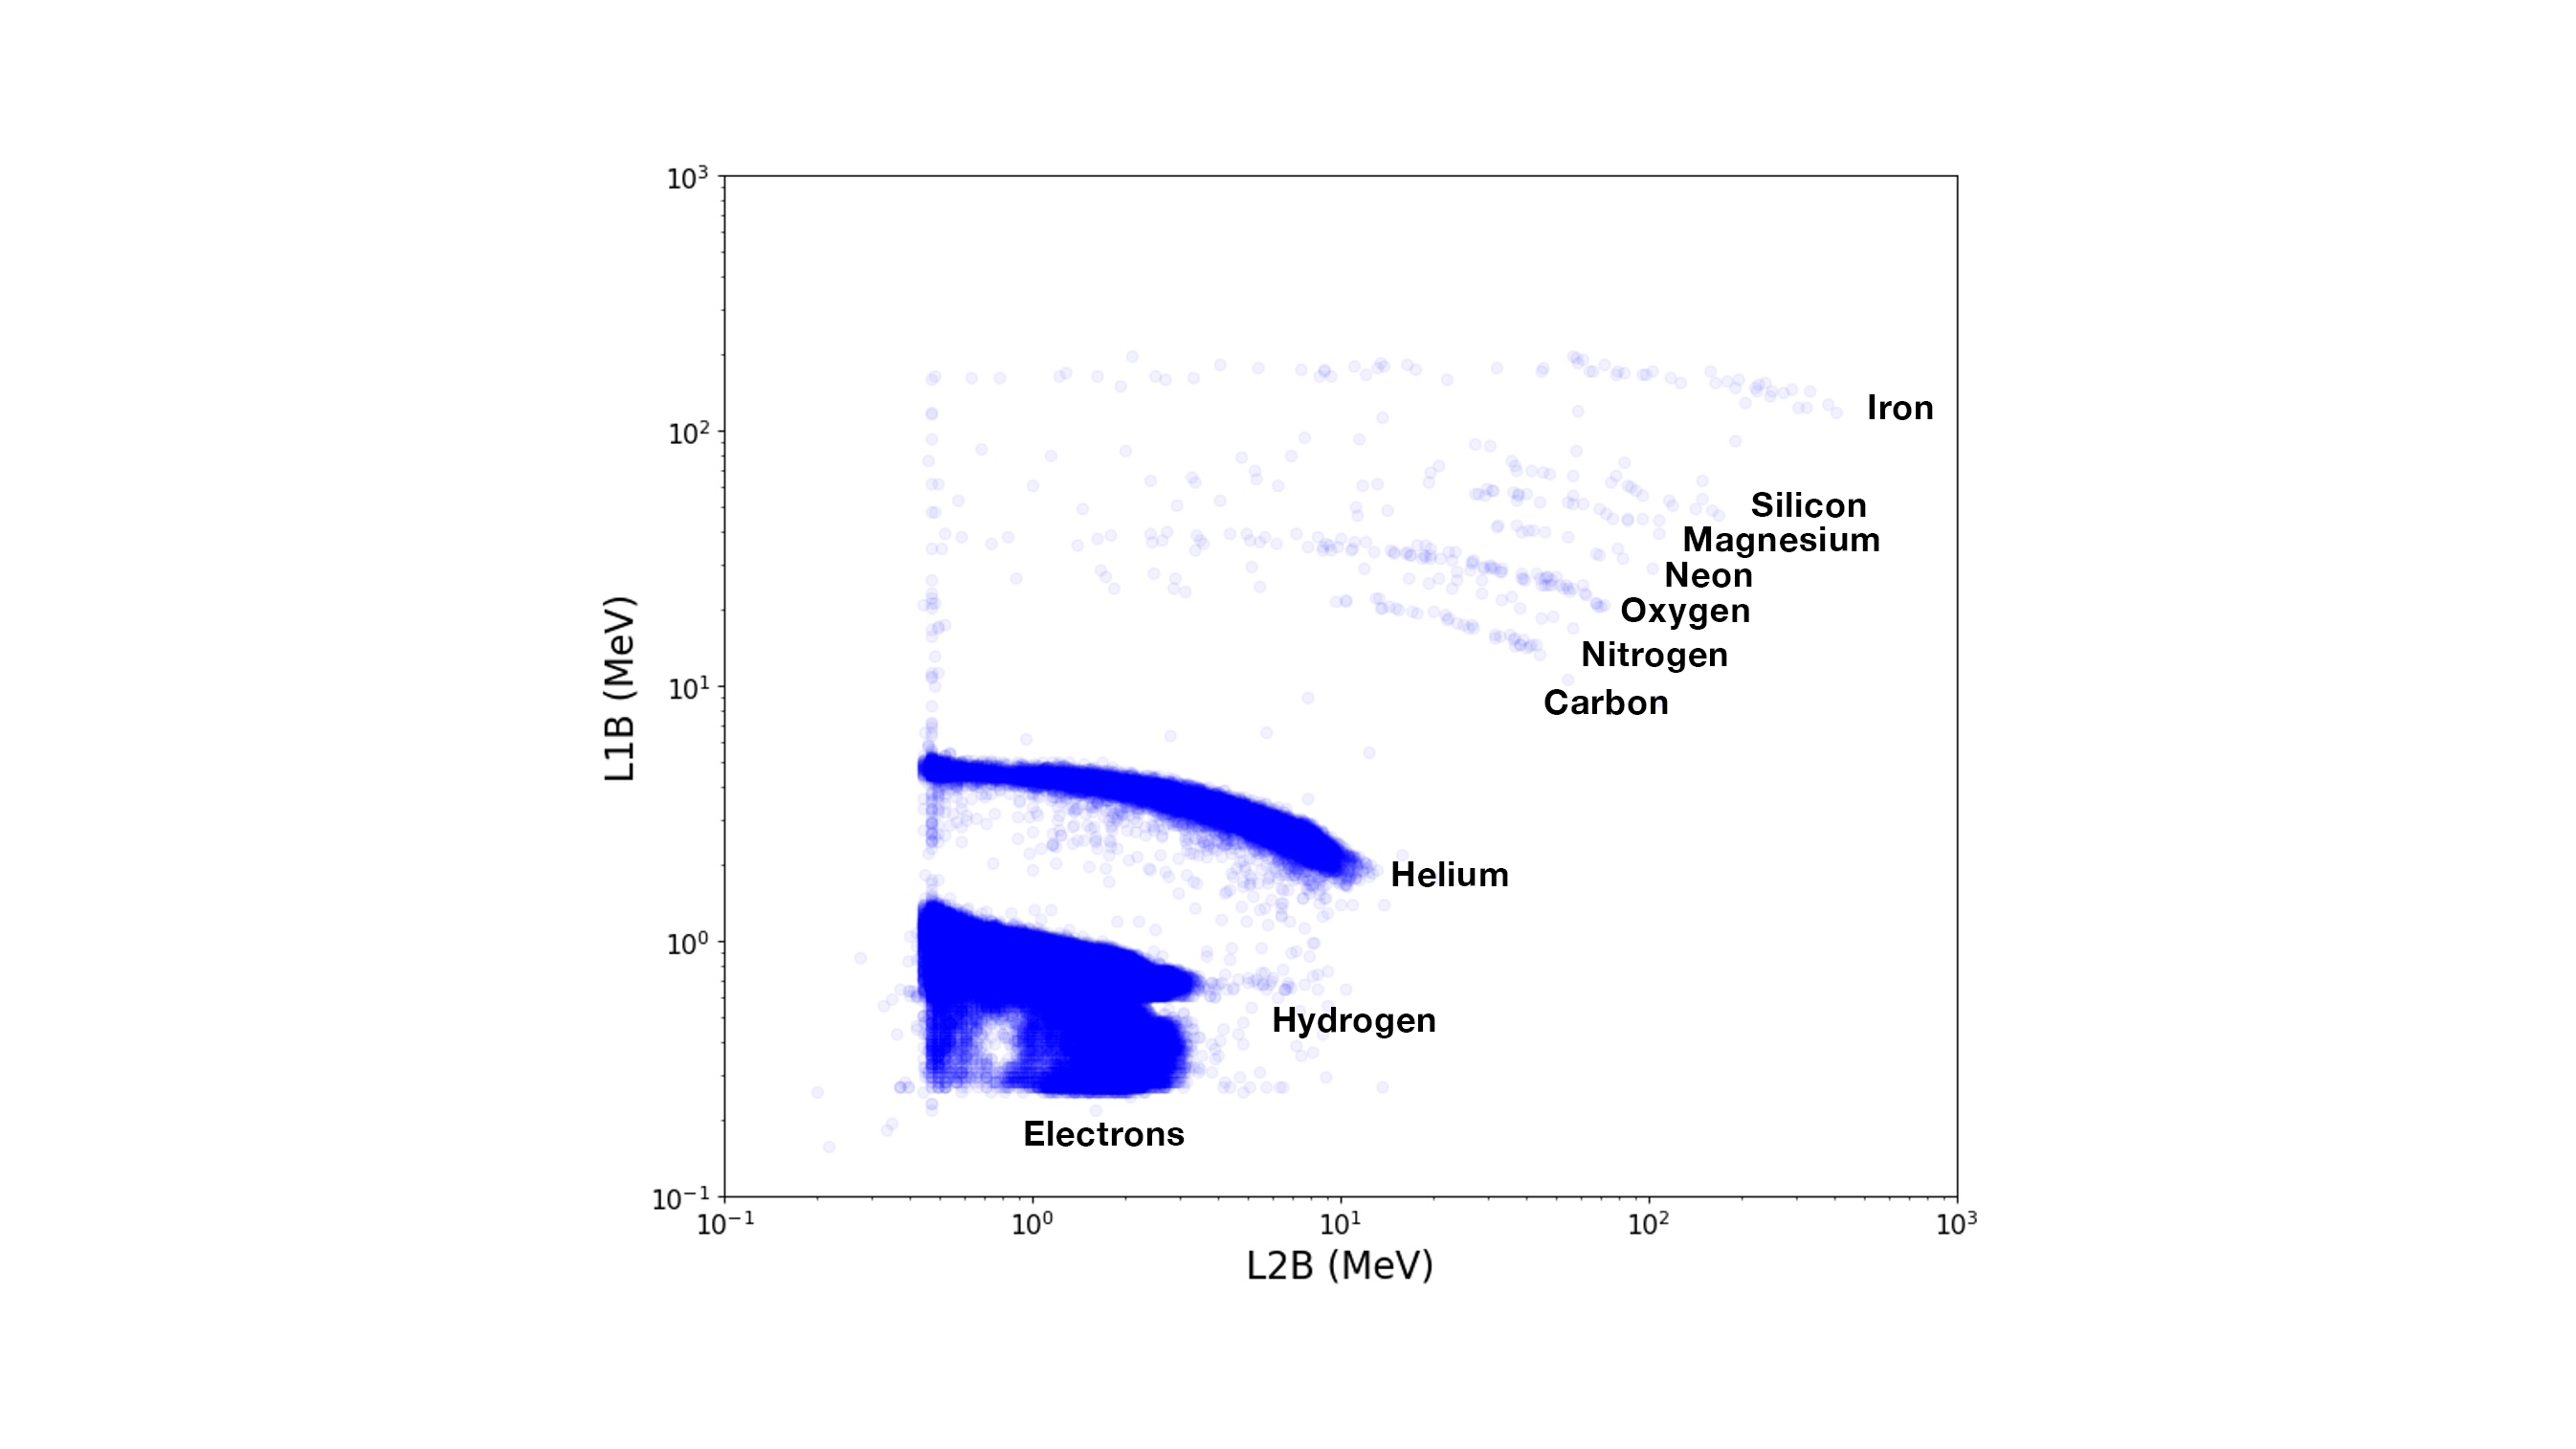
HIT
The High-energy Ion Telescope (HIT) measures energetic ions and electrons from the Sun. Early ion data shows the common elements up through iron.
NASA
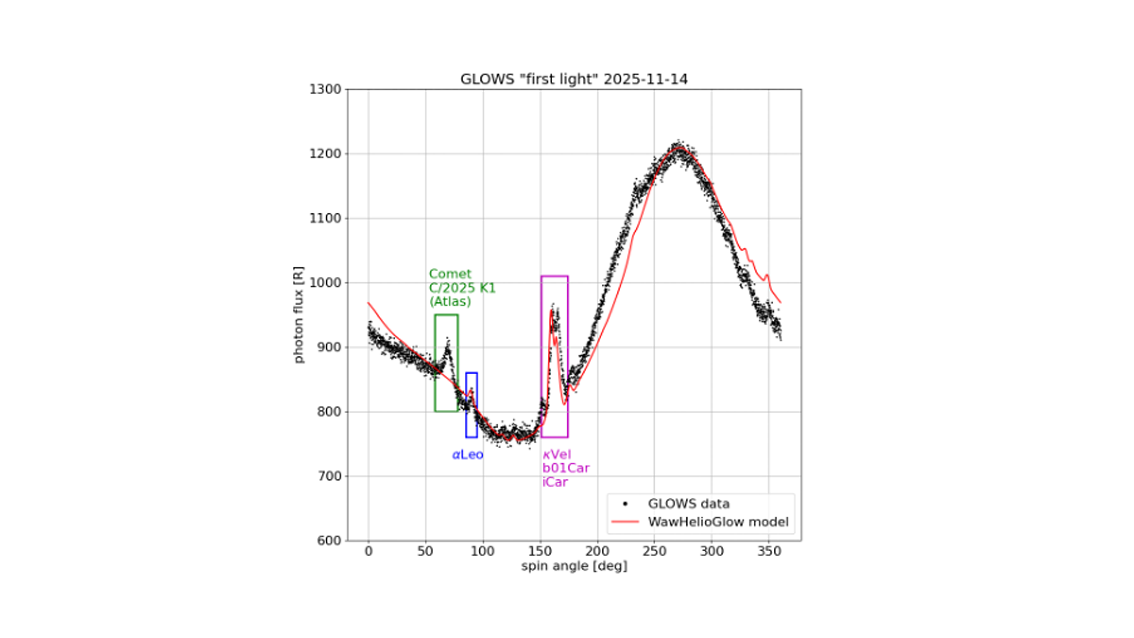
GLOWS
Unlike other IMAP instruments that study particles, the GLObal Solar Wind Structure (GLOWS) instrument images ultraviolet light called the helioglow that is created in part by the solar wind. The first data taken with GLOWS showed helioglow and bright stars, matching scientists’ expectations for the instrument. Unexpectedly, the signature of comet C/2025 K1 (ATLAS), shown by the first small bump from the left in the image, was also seen before it disappeared from GLOWS’ view.
NASA
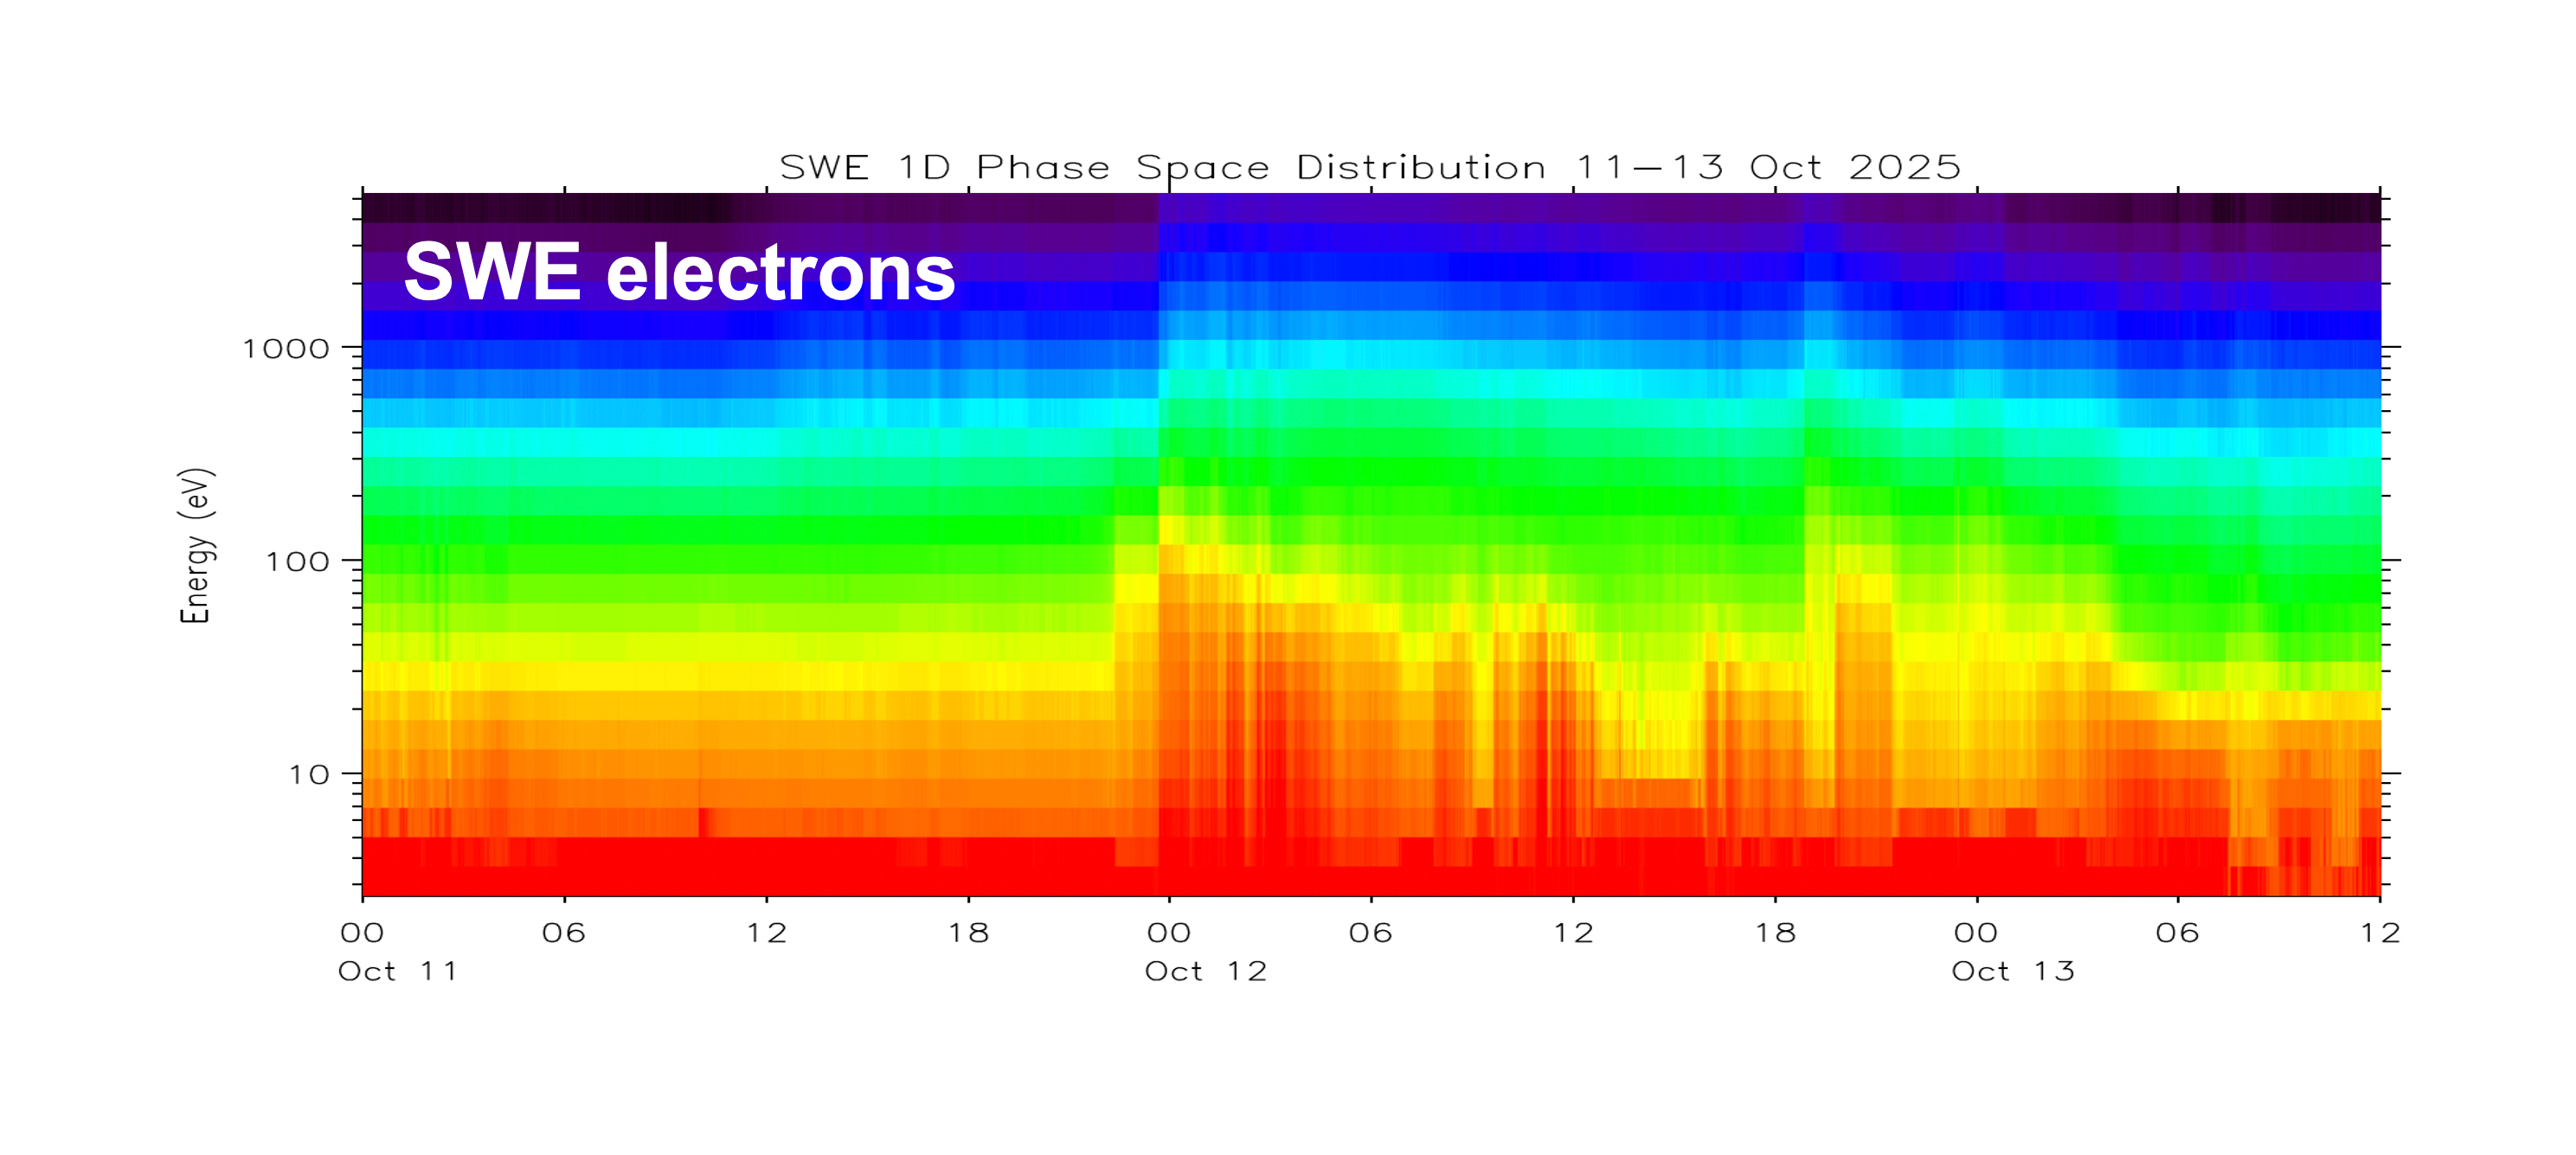
SWE
As its name suggests, the Solar Wind Electron (SWE) instrument measures electrons from the solar wind. In its first data collection, SWE successfully captured electrons at a range of energy levels. On Nov. 12, a solar storm passed through the solar system and SWE captured the resulting spike in the number of electrons at each energy level.
NASA
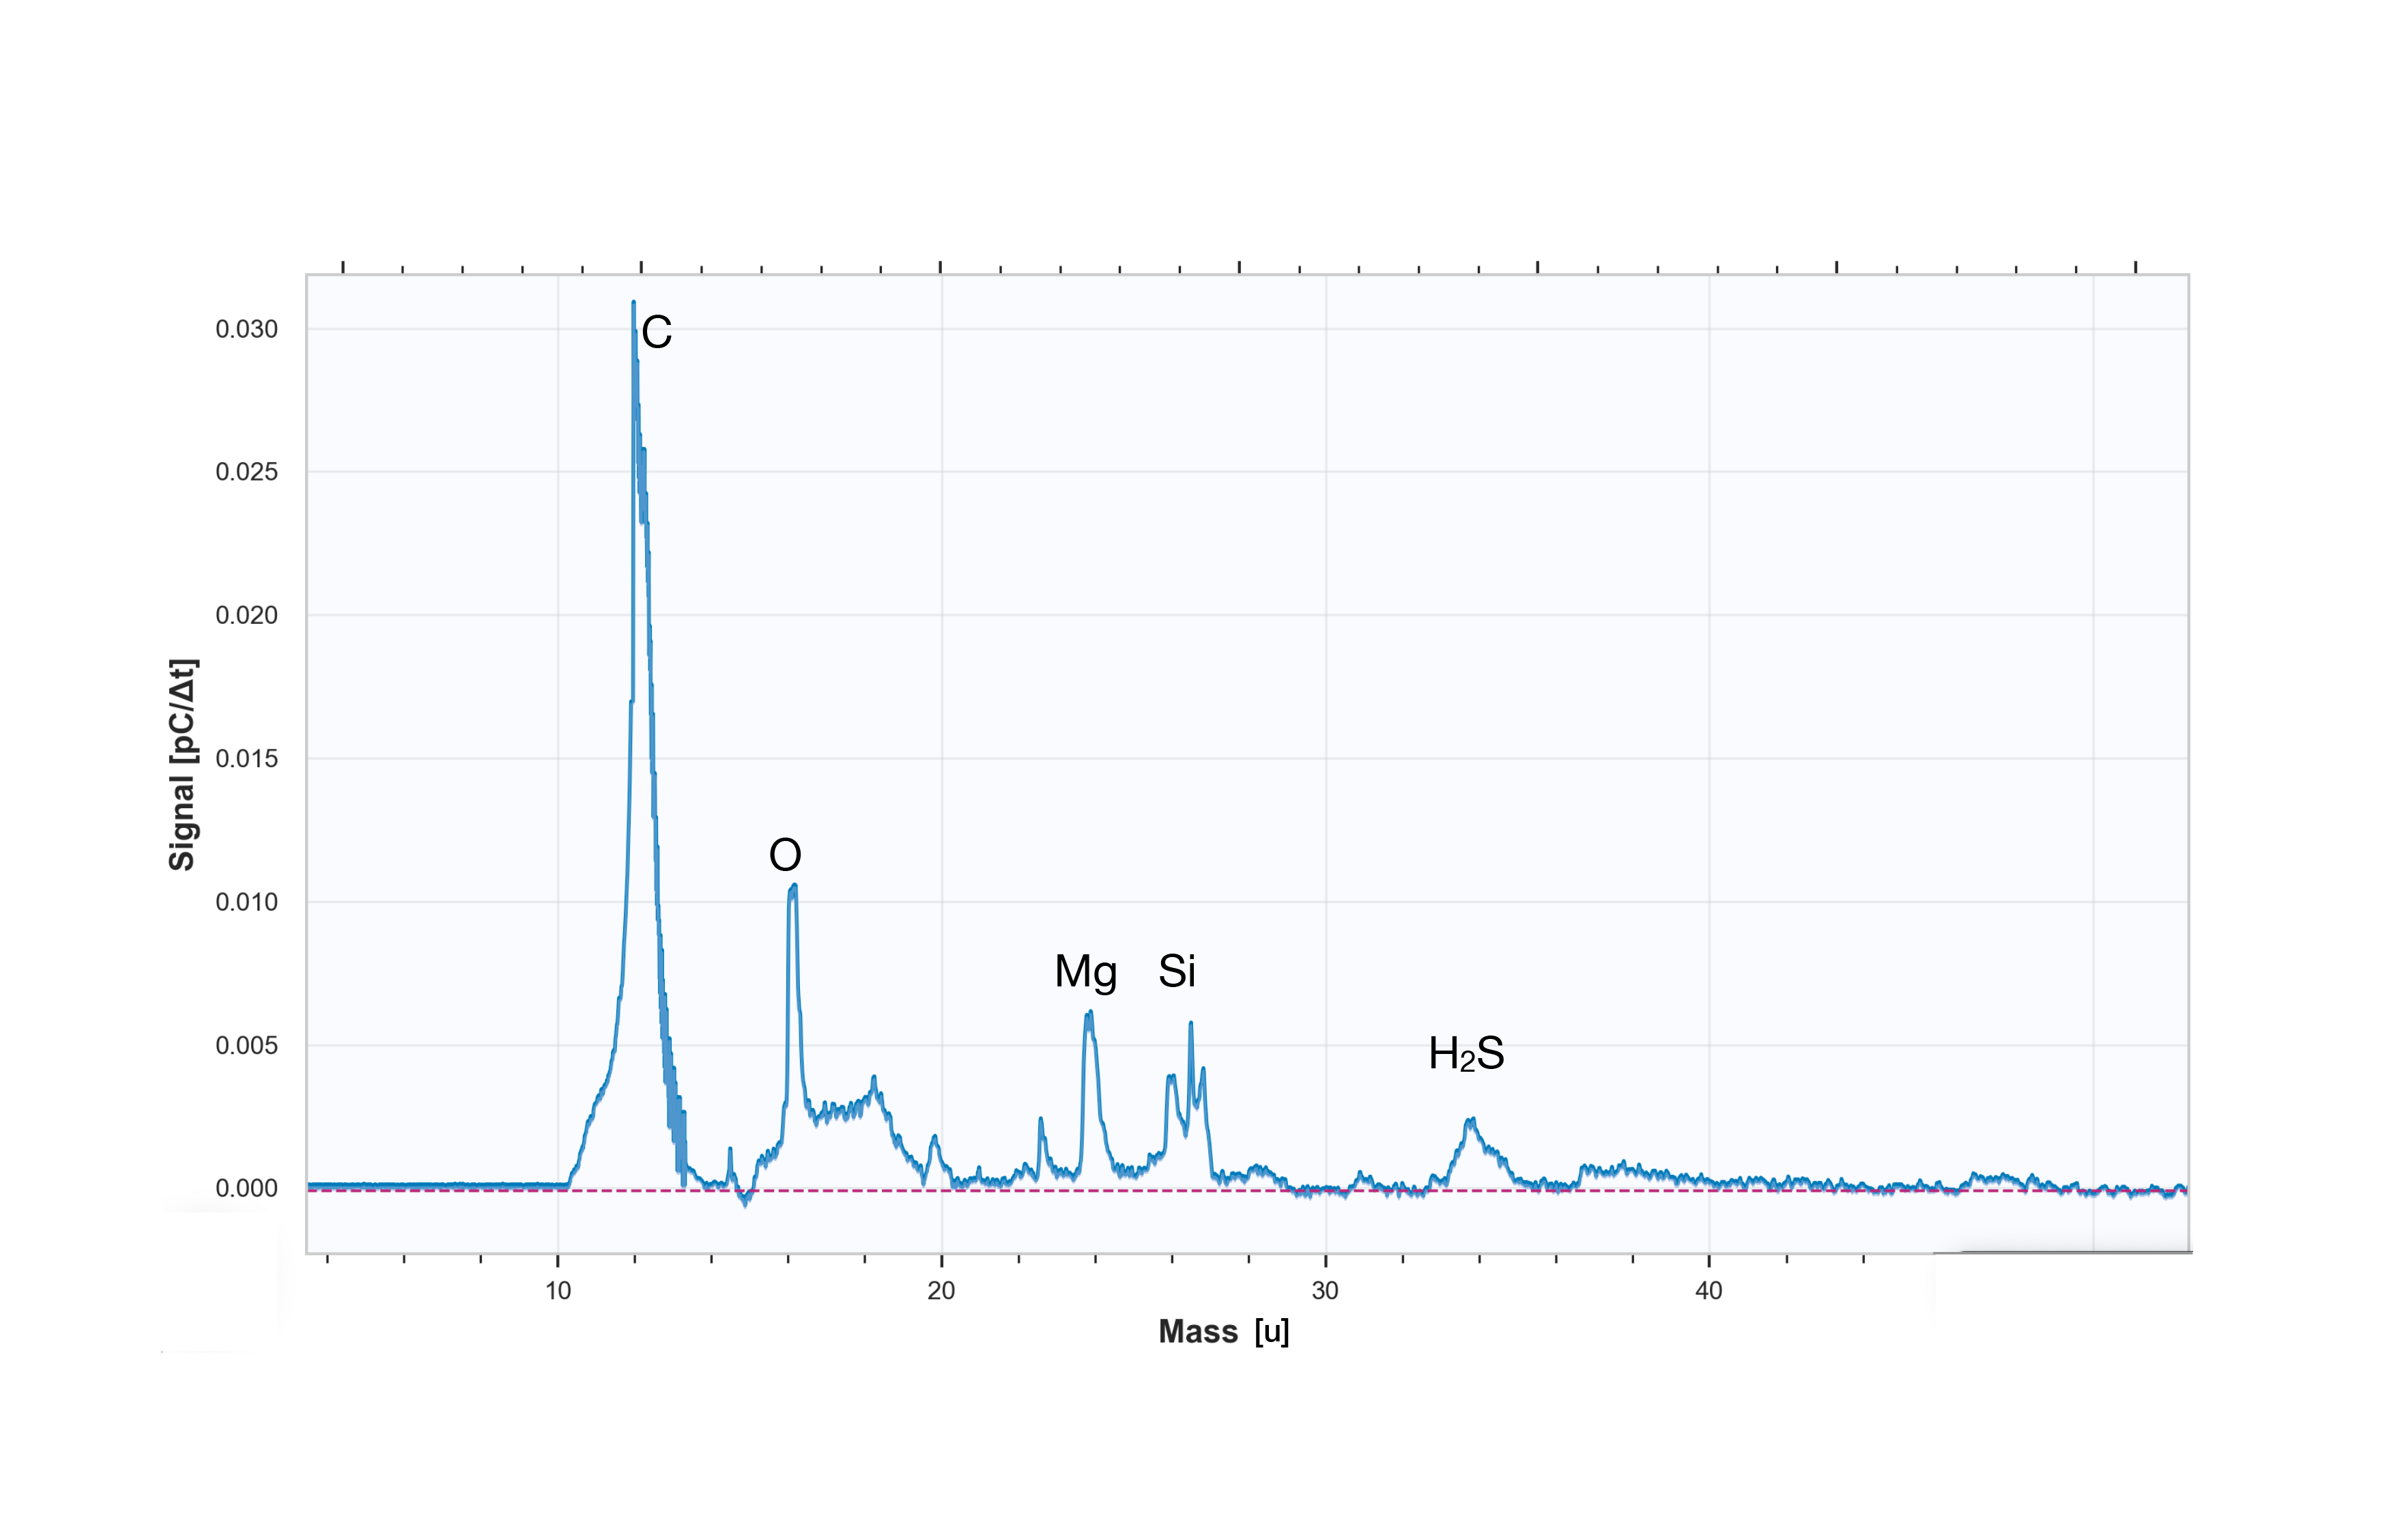
IDEX
The Interstellar Dust Experiment (IDEX) measures cosmic dust — conglomerations of particles originating outside of the solar system that are smaller than a grain of sand. Prior to IMAP, few of these dust particles had been measured. With two new detections already completed, IDEX has demonstrated its ability to become an unrivaled dust detector. This observation of one of the dust particles shows tentative identifications of the particle’s chemical composition, which includes carbon, oxygen, magnesium, silicon, and hydrogen sulfide.
NASA
By Mara Johnson-Groh NASA’s Goddard Space Flight Center, Greenbelt, Md.
Preparations for Next Moonwalk Simulations Underway (and Underwater)
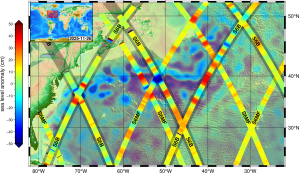
Sentinel-6B and Sentinel-6 Michael Freilich captured data on Nov. 26 of sea levels across a vast stretch of the Atlantic. Within the crisscrossing bands, red indicates higher water relative to the long-term average; blue indicates lower water. The tracks are layered atop the combined observations of other sea-level satellites.
EUMETSAT
Launched in November, Sentinel-6B will track ocean height with ultraprecision to advance marine forecasting, national security, and more.
Sentinel-6B, a joint mission by NASA and its U.S. and European partners to survey 90% of the world’s oceans for the benefit of communities and commerce, has started sending back its first measurements since launching in November. A newly published map of the data shows sea levels across a vast stretch of the Eastern Seaboard and Atlantic Ocean.
About the size of a pickup truck, Sentinel-6B extends a decades-long effort led by the United States and Europe to track ocean height down to fractions of an inch using radar altimetry. Once its instruments and algorithms are fully calibrated next year, Sentinel-6B will return actionable data for ship crews, weather forecasters, national security, and the millions of people who live and work near coastlines.
“NASA does incredible science using the unique vantage point of space every day to deliver life-saving data directly into the hands of decision-makers for storms, navigation, flooding, and more,” said Nicky Fox, associate administrator, Science Mission Directorate, NASA Headquarters in Washington. “The ocean measurements that Sentinel-6B collected during its first months in orbit benefit all, providing key insights to ensure the prosperity and security of coastal communities around the globe.”
In addition to measuring sea level, instruments aboard the satellite will gather information on wind speeds, wave heights, atmospheric temperature, and humidity. In turn, that data can be used by U.S. agencies as well as to refine the Goddard Earth Observing System atmospheric forecast models, which the NASA Engineering and Safety Center relies on to plan safer re-entry of astronauts returning from Artemis missions.
Mission teams in recent weeks have verified that Sentinel-6B and all its instruments are in good health. That includes the Poseidon-4 Synthetic Aperture Radar altimeter, the Advanced Microwave Radiometer for Climate, the Global Navigation Satellite System – Radio Occultation, and the Precise Orbit Determination Package.
In the visualization above, featuring data captured by Sentinel-6B on Nov. 26, the crisscrossing bands trace the satellite’s path as it orbits Earth. The image also shows data collected on the same day by the satellite’s twin, Sentinel-6 Michael Freilich, which launched in 2020. The data in those bands is layered over the combined observations of other sea-level satellites across the region shown. Red indicates higher water relative to the long-term average; blue areas indicate lower water. Because the spacecraft’s instruments have not been fully calibrated, the data is considered preliminary but also quite promising.
Together, Sentinel-6B and Sentinel-6 Michael Freilich make up the Copernicus Sentinel-6/Jason-CS (Continuity of Service) mission developed by NASA, ESA (European Space Agency), EUMETSAT (European Organisation for the Exploitation of Meteorological Satellites), and the National Oceanic and Atmospheric Administration (NOAA).
“These first light images from Sentinel-6B underscore the value of Earth science observations in providing life-saving and economic-empowering data to communities along our world’s coastlines, where a third of the globe’s population lives,” said Karen St. Germain, director, NASA Earth Science Division at the agency’s headquarters. “This achievement also highlights the power of partnerships with ESA, EUMETSAT, and our sister science agency NOAA in advancing our collective understanding of Earth systems and putting that Earth science understanding to work for the benefit of humanity.”
Sentinel-6/Jason-CS adds to a continuous sea level rise dataset that began in the early 1990s. Since then, the rate of sea level rise globally has doubled and currently averages about 0.17 inches (4.3 millimeters) per year. The rate differs between locations, with implications for coastal infrastructure, trade routes, and storm formation.
“The accuracy and precision of this mission’s gold-standard dataset speaks to the foresight, more than 30 years ago, of investing in the technology and expertise that make it possible,” said Dave Gallagher, director, NASA’s Jet Propulsion Laboratory in Southern California. “We’re proud to continue partnering to collect these critical measurements into another decade, and even prouder of the teams behind this most recent milestone.”
Flying 830 miles (1,336 kilometers) above Earth, Sentinel-6B is about 30 seconds behind its twin, Sentinel-6 Michael Freilich, currently the official reference satellite for sea level. Eventually, Sentinel-6B will take over that role, and Sentinel-6 Michael Freilich will move into a different orbit.
More about Sentinel-6B
Copernicus Sentinel-6/Jason-CS was jointly developed by ESA, EUMETSAT, NASA, and NOAA, with funding support from the European Commission and technical support from CNES. The mission, starting with Sentinel-6 Michael Freilich, marked the first international involvement in Copernicus, the European Union’s Earth Observation Programme.
Managed for NASA by Caltech in Pasadena, JPL contributed three science instruments for each Sentinel-6 satellite: the Advanced Microwave Radiometer, the Global Navigation Satellite System – Radio Occultation, and the laser retroreflector array. NASA also contributed launch services, ground systems supporting operation of the NASA science instruments, the science data processors for two of these instruments, and support for the international ocean surface topography community.
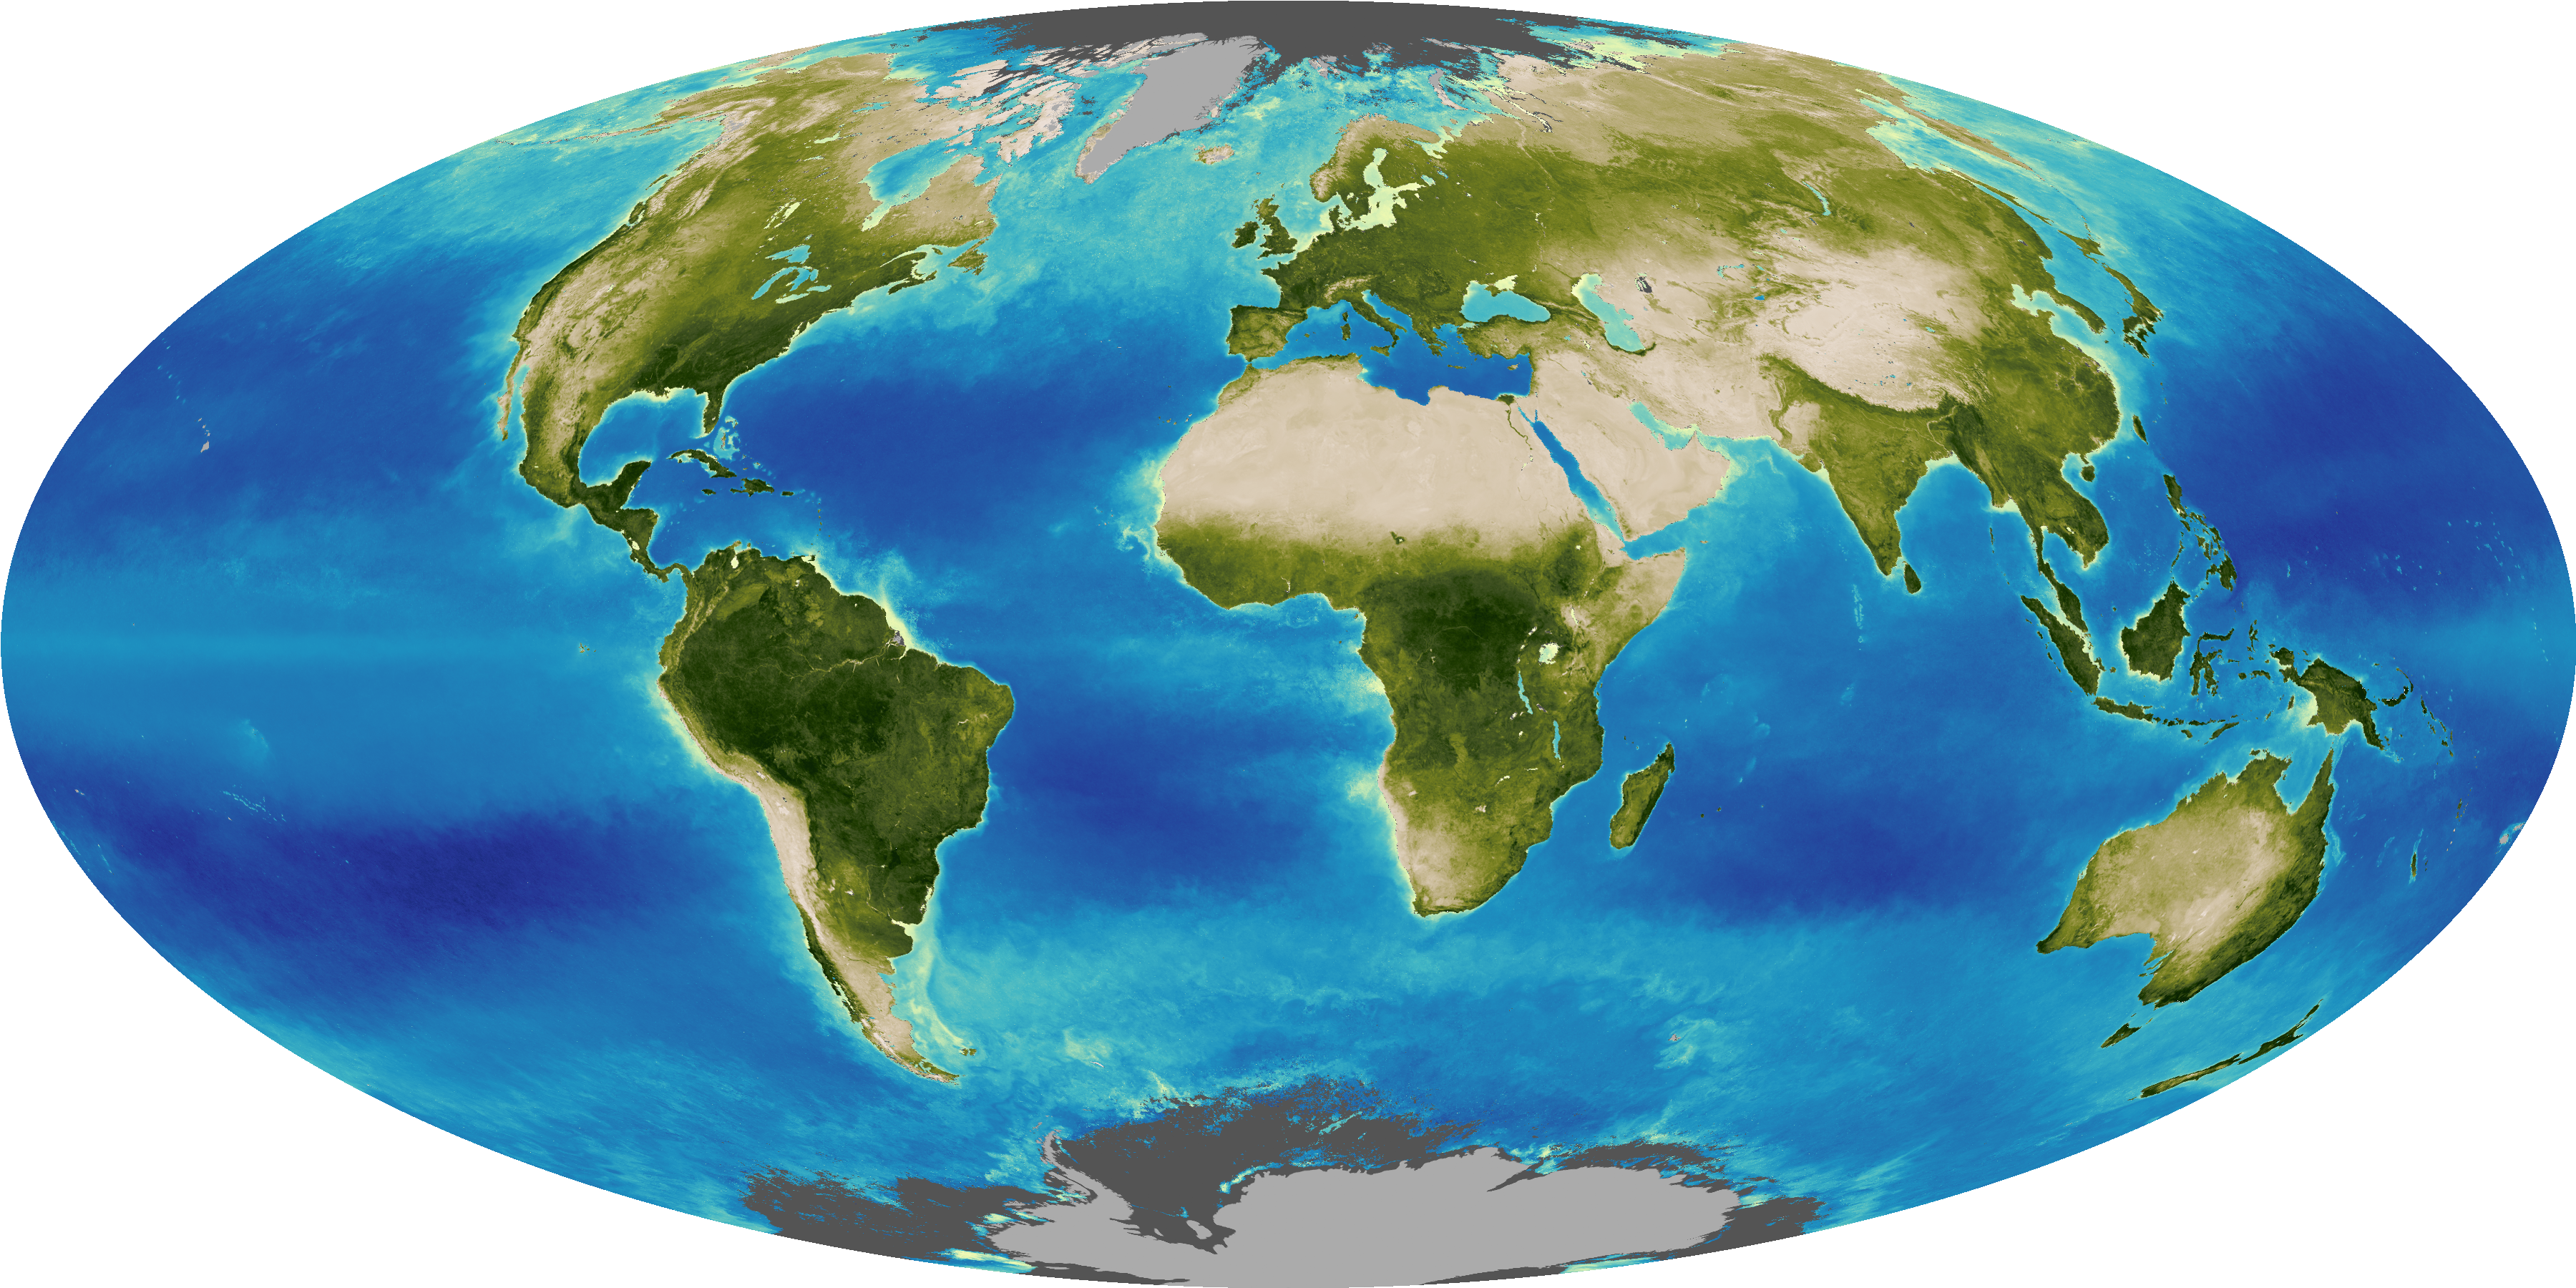
After a several-month hiatus, La Niña returned to the equatorial Pacific Ocean in September 2025 and has continued into December. However, this occurrence of El Niño’s cooler counterpart is relatively weak, and its influence on weather and climate over the next several months remains to be seen.
Part of the El Niño-Southern Oscillation (ENSO) cycle, La Niña develops when strengthened easterly trade winds intensify the upwelling of cold, deep water in the eastern tropical Pacific. This process cools large swaths of the eastern and central equatorial Pacific while simultaneously pushing warm surface waters westward toward Asia and Australia. In a report published on December 11, the NOAA Climate Prediction Center confirmed that below-average sea surface temperatures associated with La Niña conditions were present and likely to continue for another month or two.
The shifting wind patterns and the movement of heat within the ocean have a direct impact on sea level. Because cooler water is denser and occupies less volume than warm water, sea levels in the central and eastern Pacific drop during La Niña events. The map above shows sea surface height observed on December 1, 2025. Shades of blue indicate below-normal sea levels, shades of red show above-normal levels, and white represents near-normal conditions.
Data for the map were acquired by the Sentinel-6 Michael Freilich satellite and processed by scientists at NASA’s Jet Propulsion Laboratory (JPL). Signals related to seasonal cycles and long-term trends have been removed to highlight sea level changes associated with ENSO and other short-term natural phenomena. The satellite’s twin successor, Sentinel-6B, launched in November 2025 and is expected to begin contributing to ENSO research and forecasts sometime in 2026.
This equatorial surface-water cooling alters the exchange of heat and moisture between the ocean and atmosphere, reshaping global atmospheric circulation patterns. La Niña’s coupling with the ocean and atmosphere can shift mid-latitude jet streams, intensifying rainfall in some regions while bringing drought to others.
Typically, La Niña years bring below-average rainfall to the American Southwest and above-average rainfall to the Northwest. But when the event is weak—whether El Niño or La Niña—the associated weather patterns can be “notoriously difficult to predict,” said Josh Willis, an oceanographer and Sentinel-6 Michael Freilich project scientist at JPL in Southern California.
“It still has the potential to tilt our winter toward the dry side in the American Southwest,” Willis said. “But it’s never a guarantee, especially with a mild event like this one.”
NASA Earth Observatory image by Lauren Dauphin, using modified Copernicus Sentinel data (2025) processed by the European Space Agency and further processed by Josh Willis and Kevin Marlis/NASA/JPL-Caltech. Story by Kathryn Hansen.
References & Resources
NASA Earth Observatory (2025) El Niño. Accessed December 15, 2025.
NASA Earth Observatory (2025, February 6) La Niña is Here. Accessed December 15, 2025.
541715 – Research and Development in the Physical, Engineering, and Life Sciences (except Nanotechnology and Biotechnology)
NASA seeks industry-led architecture concept development, concept refinement studies, and risk-reduction activities that address Moon to Mars Architecture gaps through the Next Space Technologies for Exploration Partnerships-3 (NextSTEP-3). NASA plans to release this solicitation — NextSTEP-3 Appendix B: Moon to Mars Architectural Studies — near the beginning of calendar year 2026. For full details, consult the links under the notice ID above.
NASA’s Moon to Mars Architecture defines capabilities needed for long-term, human-led scientific discovery in deep space. The agency’s architecture approach distills agency-developed objectives into capabilities and elements that support exploration and science goals. NASA continuously evolves that blueprint for crewed exploration, setting humanity on a path to the Moon, Mars, and beyond by collaborating with experts across industry, academia, and the international community.
This proposed solicitation seeks partner participation on a recurring basis, targeting several calls per year for proposal submissions. The proposals should focus on topics addressing infrastructure, transportation, habitation, concepts of operations, and planetary science capabilities identified in the latest revision of the Architecture Definition Document. The solicitation establishes a flexible acquisition strategy that accommodates both directed-topic calls on specific areas of government interest, as well as open topic calls.
NASA anticipates the first Appendix B directed-topic study calls will focus on lunar and Mars mission concepts. NASA intends to issue a directed call for research into an integrated surface power infrastructure (or power grid) that can evolve to support increasingly ambitious lunar missions. (Note: this call excludes proposals addressing the Fission Surface Power System Announcement for Partnership Proposal but may include all technology solutions including alternate fission, solar hybrid, or other power grid approaches.)
Concurrently, NASA will issue a directed call for Mars crew transportation concept development, trade studies, and identification of risk reduction activities. This call would include in-space transportation, Mars surface access, and Mars ascent options for crew and cargo.
A camera on the International Space Station captured this Oct. 2, 2025, photo of the Bassac River in Cù Lao Dung, a river islet district in southern Vietnam. The Bassac River surrounds the district before emptying into the South China Sea. The river’s brown waters at its mouth result from massive amounts of silt, clay, and organic matter carried from upstream regions of the Mekong River Basin, combined with tidal forces from the sea that stir up sediment. This photograph was taken from as the space station orbited 260 miles above Earth.
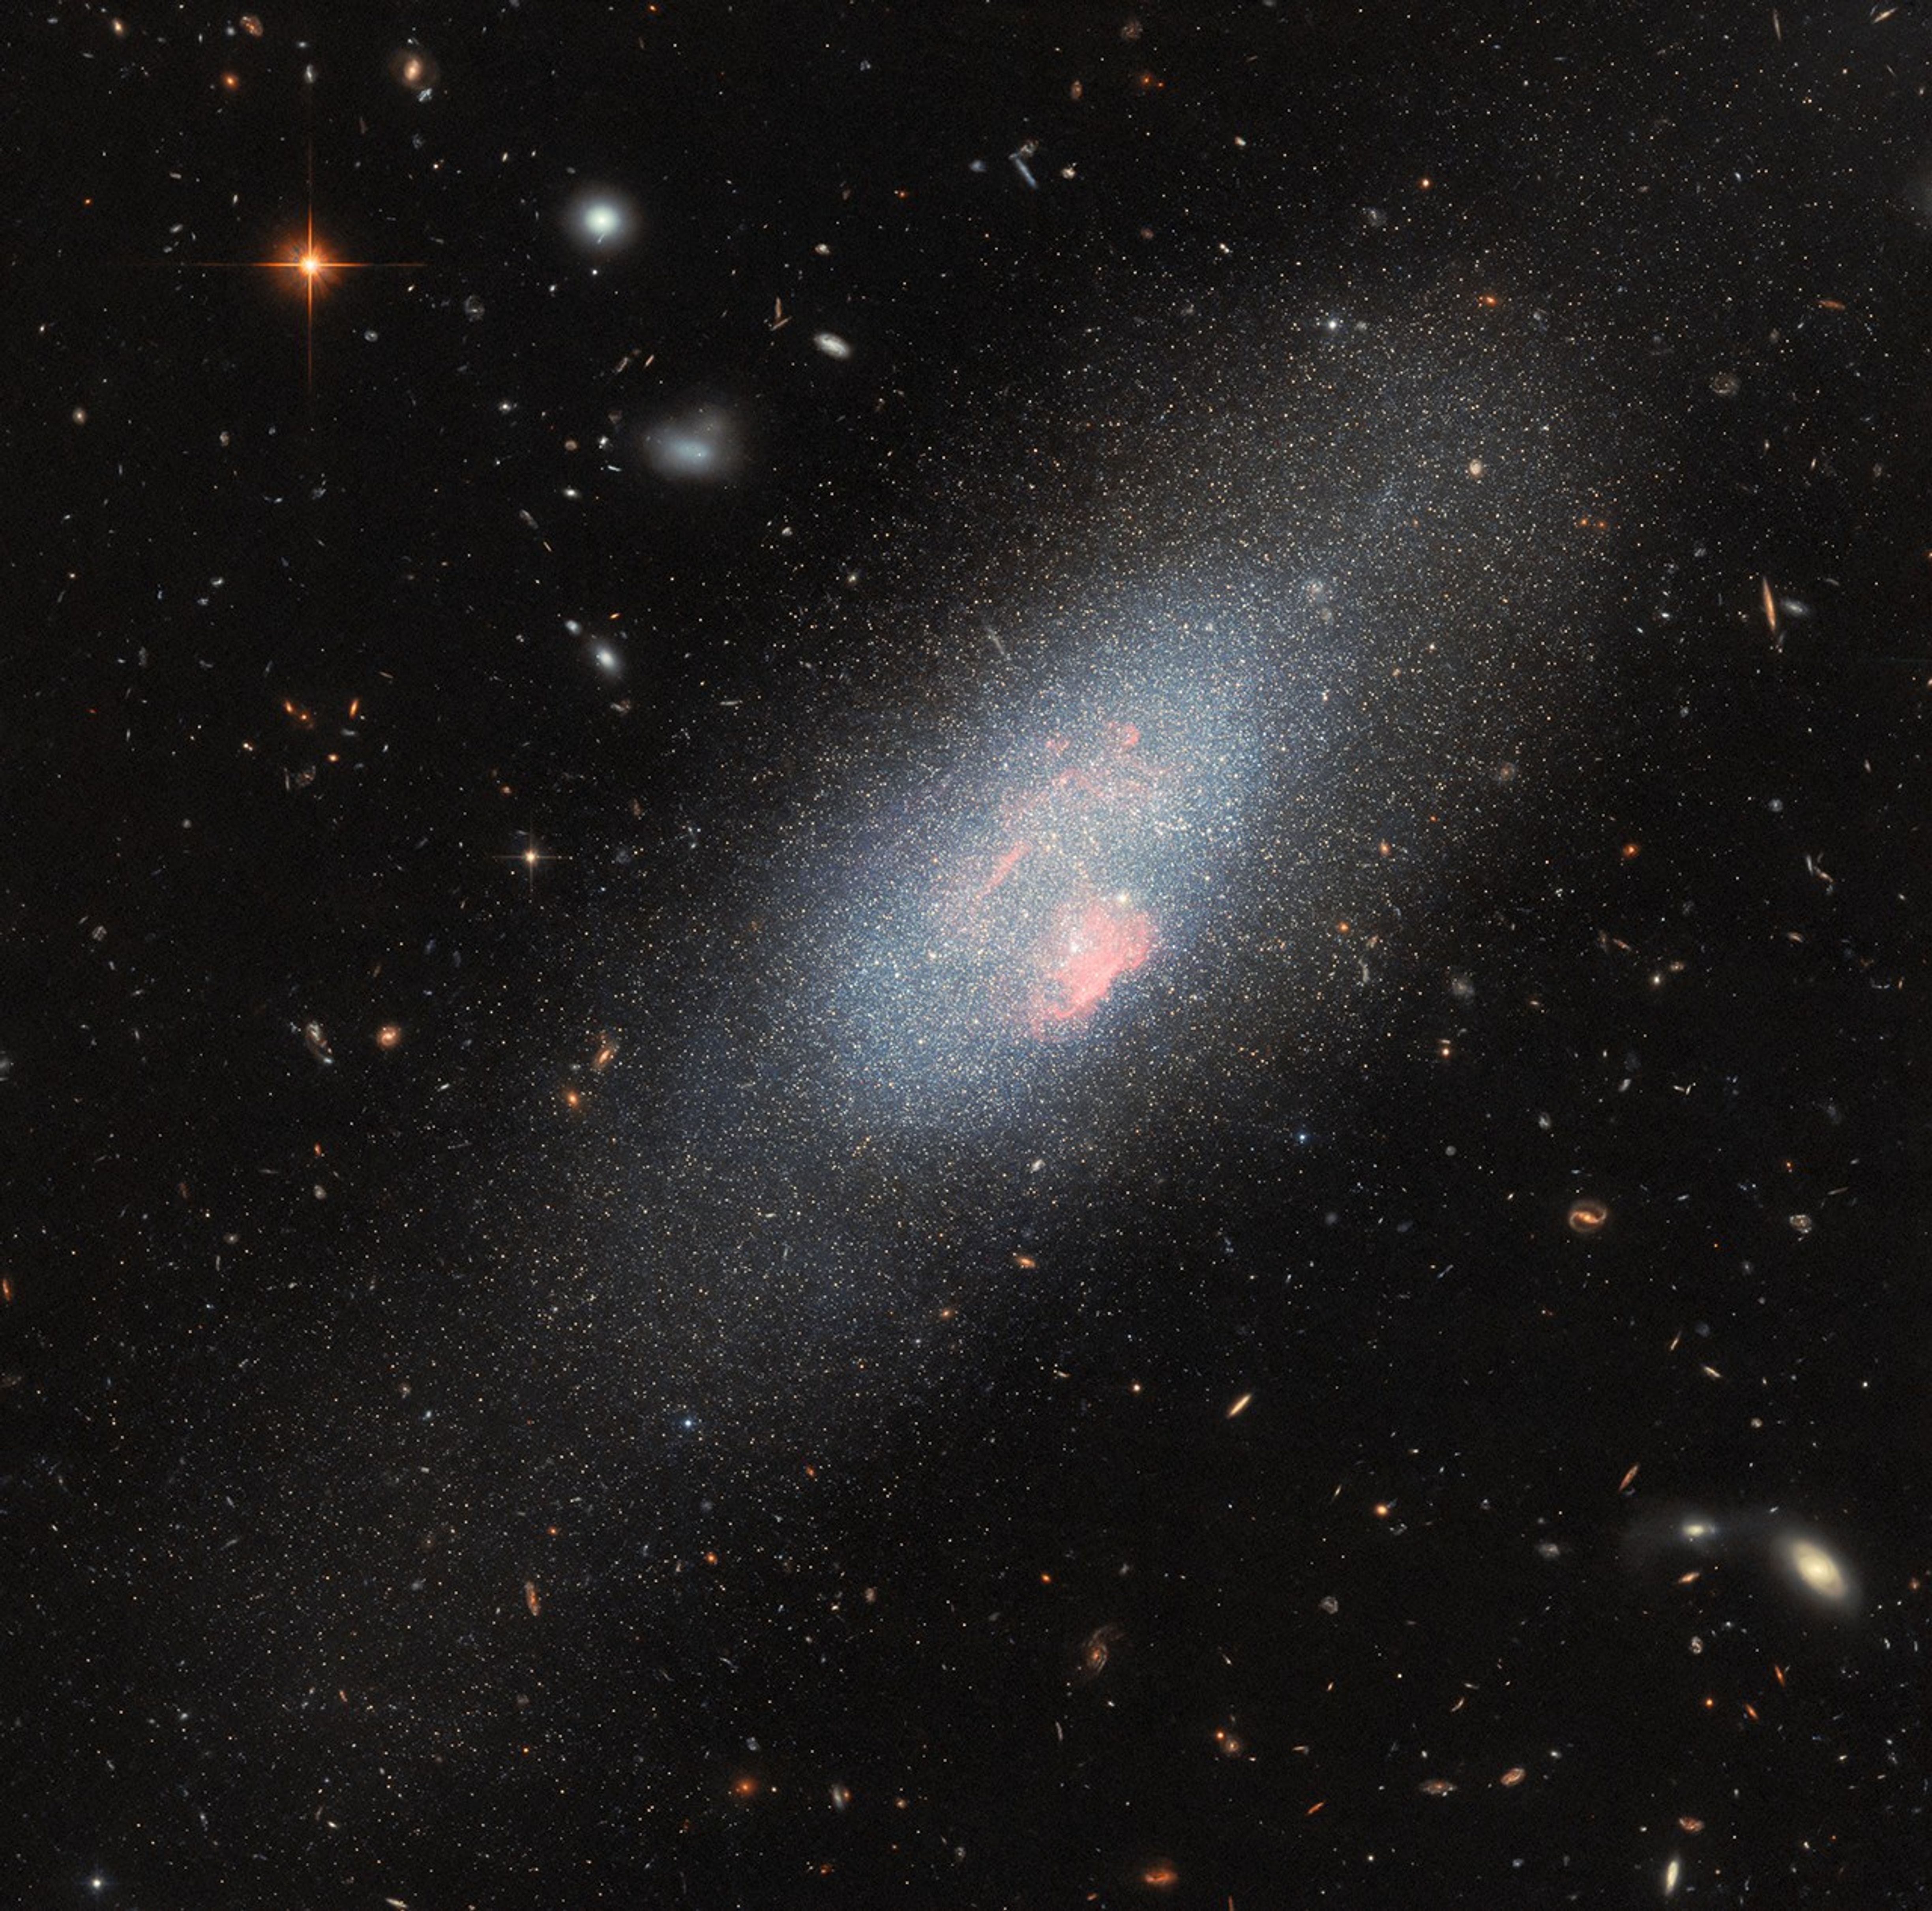
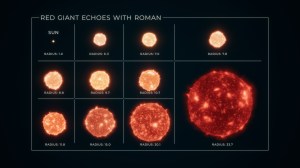
Our universe is filled with galaxies, in all directions as far as our instruments can see. Some researchers estimate that there are as many as two trillion galaxies in the observable universe. At first glance, these galaxies might appear to be randomly scattered across space, but they’re not. Careful mapping has shown that they are distributed across the surfaces of giant cosmic “bubbles” up to several hundred million light-years across. Inside these bubbles, few galaxies are found, so those regions are called cosmic voids. NASA’s Nancy Grace Roman Space Telescope will allow us to measure these voids with new precision, which can tell us about the history of the universe’s expansion.
This narrated video sequence illustrates how NASA's Nancy Grace Roman Space Telescope will be able to observe cosmic voids in the universe. These highly detailed measurements will help constrain cosmological models.
Credit: Video: NASA, STScI; Visualization: Frank Summers (STScI); Script Writer: Frank Summers (STScI); Narration: Frank Summers (STScI); Audio: Danielle Kirshenblat (STScI); Science: Giulia Degni (Roma Tre University), Alice Pisani (CPPM), Giovanni Verza (Center for Computational Astrophysics/Flatiron Inst.)
“Roman’s ability to observe wide areas of the sky to great depths, spotting an abundance of faint and distant galaxies, will revolutionize the study of cosmic voids,” said Giovanni Verza of the Flatiron Institute and New York University, lead author on a paper published in The Astrophysical Journal.
Cosmic Recipe
The cosmos is made of three key components: normal matter, dark matter, and dark energy. The gravity of normal and dark matter tries to slow the expansion of the universe, while dark energy opposes gravity to speed up the universe’s expansion. The nature of both dark matter and dark energy are currently unknown. Scientists are trying to understand them by studying their effects on things we can observe, such as the distribution of galaxies across space.
“Since they’re relatively empty of matter, voids are regions of space that are dominated by dark energy. By studying voids, we should be able to put powerful constraints on the nature of dark energy,” said co-author Alice Pisani of CNRS (the French National Centre for Scientific Research) in France and Princeton University in New Jersey.
To determine how Roman might study voids, the researchers considered one potential design of the Roman High-Latitude Wide-Area Survey, one of three core community surveys that Roman will conduct. The High-Latitude Wide-Area Survey will look away from the plane of our galaxy (hence the term high latitude in galactic coordinates). The team found that this survey should be able to detect and measure tens of thousands of cosmic voids, some as small as just 20 million light-years across. Such large numbers of voids will allow scientists to use statistical methods to determine how their observed shapes are influenced by the key components of the universe.
To determine the actual, 3D shapes of the voids, astronomers will use two types of data from Roman — the positions of galaxies in the sky and their cosmological redshift, the latter of which is determined using spectroscopic data. To convert redshift to a physical distance, astronomers make assumptions about the components of the universe, including the strength of dark energy and how it might have evolved over time.
Pisani compared it to trying to infer a cake recipe (i.e., the universe’s makeup) from the final dessert served to you. “You try to put in the right ingredients — the right amount of matter, the right amount of dark energy — and then you check whether your cake looks as it should. If it doesn’t, that means you put in the wrong ingredients.”
In this case, the appearance of the “cake” is the shape found by statistically stacking all of the voids detected by Roman on top of each other. On average, voids are expected to have a spherical shape because there is no “preferred” location or direction in the universe (i.e., the universe is both homogeneous and isotropic on large scales). This means that, if the stacking is done correctly, the resulting shape will be perfectly round (or spherically symmetric). If not, then you have to adjust your cosmic recipe.
Power of Roman
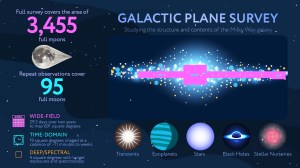
The researchers emphasized that to study cosmic voids in large numbers, an observatory must be able to probe a large volume of the universe, because the voids themselves can be tens or hundreds of millions of light-years across. The spectroscopic data necessary to study voids will come from a portion of the Roman High-Latitude Wide-Area Survey that will cover on the order of 2,400 square degrees of the sky, or 12,000 full moons. It will also be able to see fainter and more distant objects, yielding a greater density of galaxies than complementary missions like ESA’s (European Space Agency’s) Euclid.
“Voids are defined by the fact that they contain so few galaxies. So to detect voids, you have to be able to observe galaxies that are quite sparse and faint. With Roman, we can better look at the galaxies that populate voids, which ultimately will give us greater understanding of the cosmological parameters like dark energy that are sculpting voids,” said co-author Giulia Degni of Roma Tre University and INFN (the National Institute of Nuclear Physics) in Rome.
The Nancy Grace Roman Space Telescope is managed at NASA’s Goddard Space Flight Center in Greenbelt, Maryland, with participation by NASA’s Jet Propulsion Laboratory in Southern California; Caltech/IPAC in Pasadena, California; the Space Telescope Science Institute in Baltimore; and a science team comprising scientists from various research institutions. The primary industrial partners are BAE Systems, Inc. in Boulder, Colorado; L3Harris Technologies in Melbourne, Florida; and Teledyne Scientific & Imaging in Thousand Oaks, California.
By Christine Pulliam Space Telescope Science Institute, Baltimore, Md. cpulliam@stsci.edu
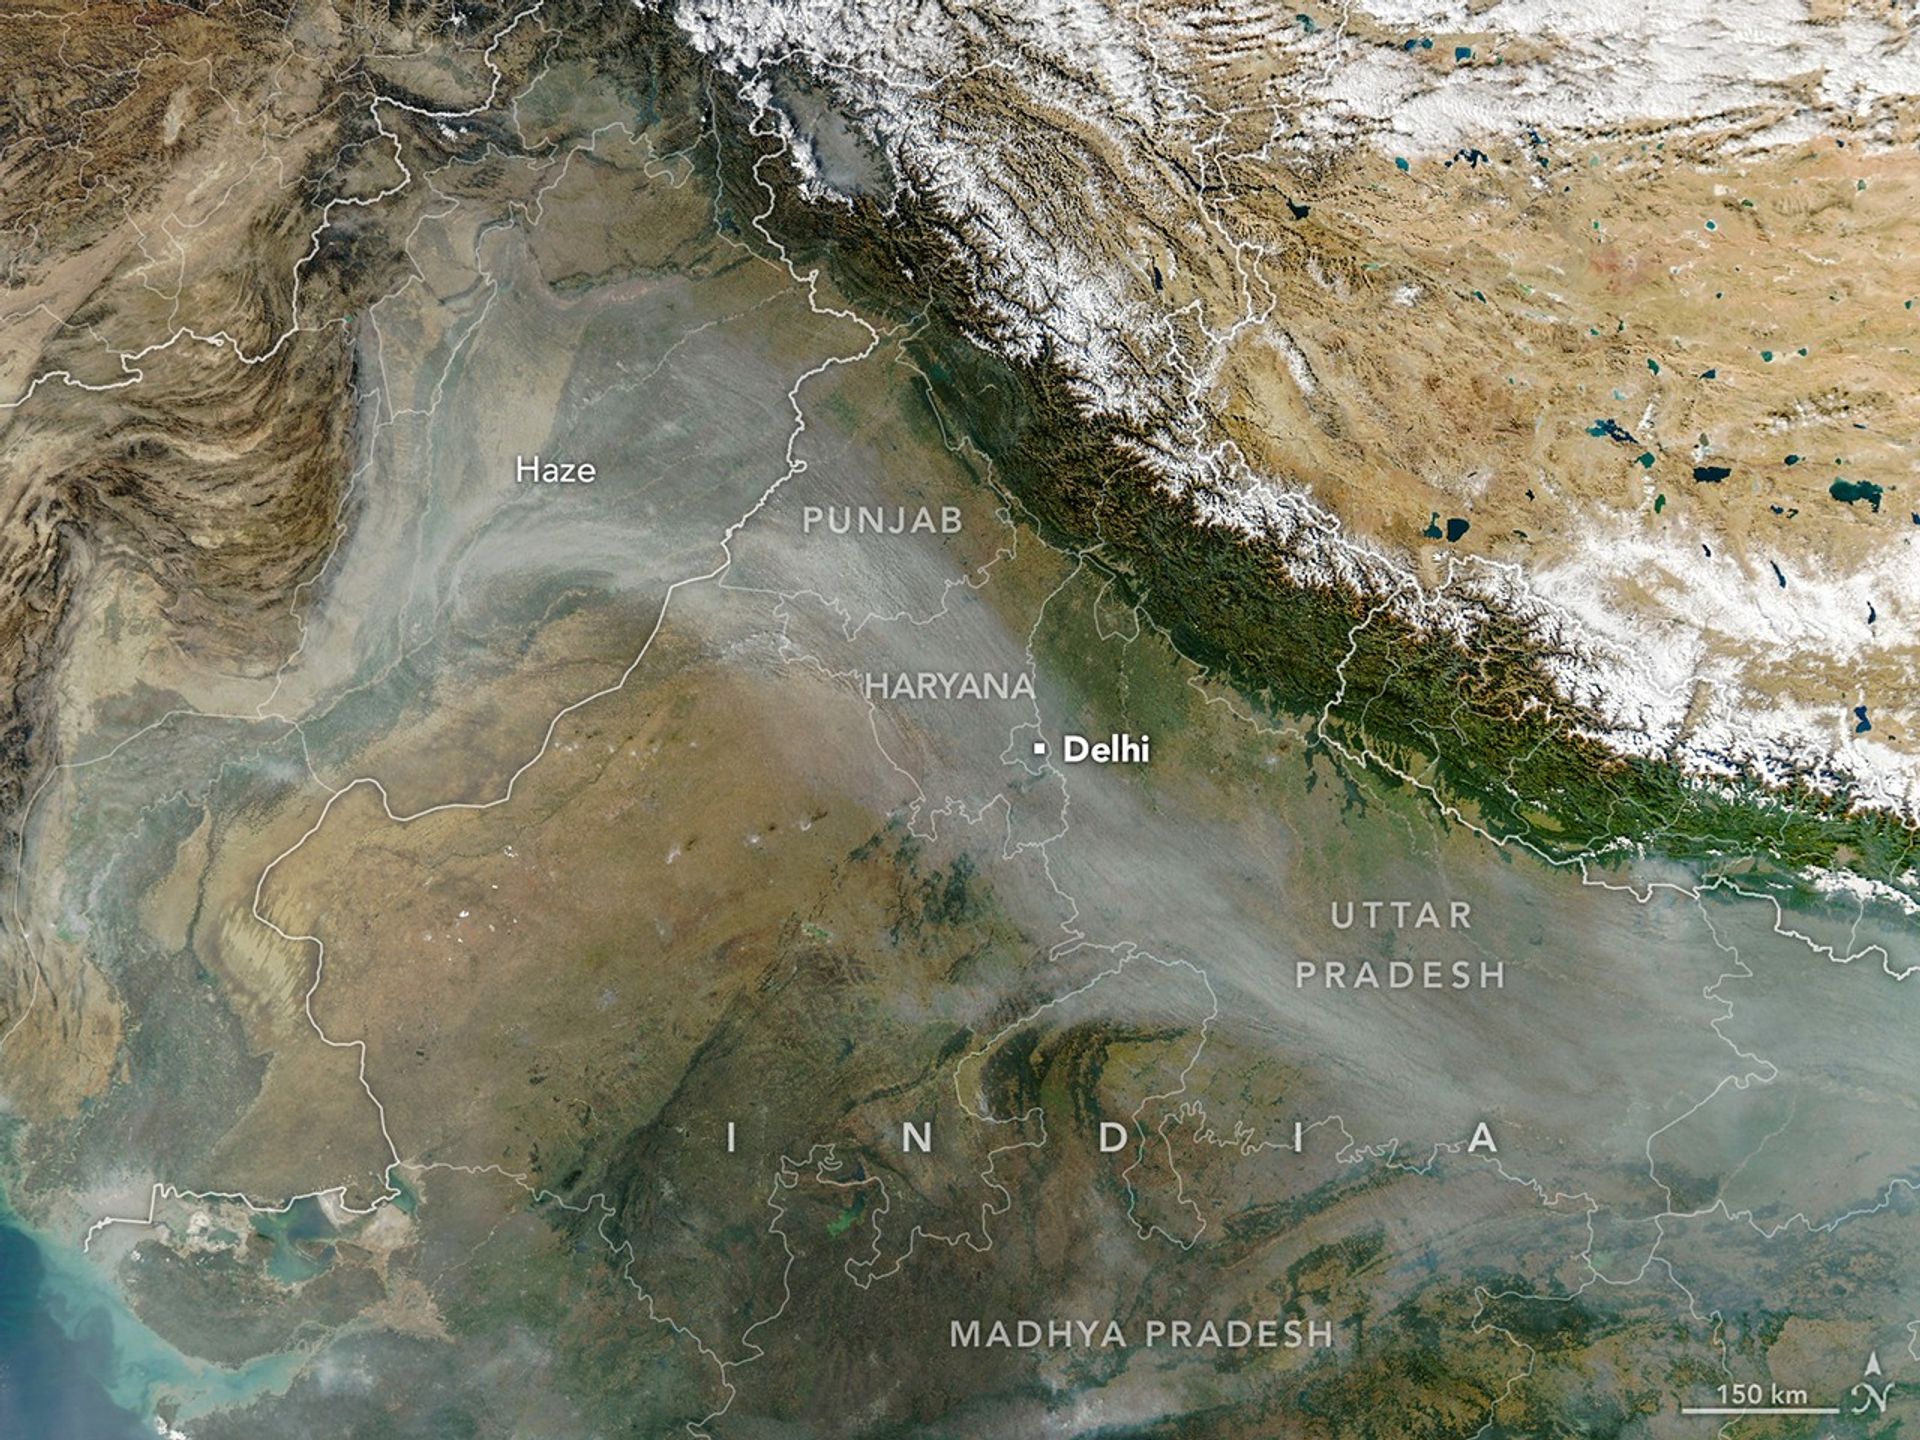
Every year for decades, long rivers of smoke and haze have spread across the Indo-Gangetic Plain in northern India from October to December. That’s when farmers in Punjab, Haryana, Uttar Pradesh, Madhya Pradesh, and other states burn off plant “stubble” after the rice harvest.
When winds are weak and the atmosphere becomes stagnant, the haze can push levels of air pollution several times higher than limits recommended by the World Health Organization. Smoke typically mixes with particles and gases from other sources, such as industry, vehicles, domestic fires (heating and cooking), fireworks, and dust storms, to form the haze, though scientists consider stubble burning to be a major factor.
In some ways, the seasonal timing of stubble fires in 2025 followed typical patterns. Air quality deteriorated in Delhi and several other cities for about a month after crop fires intensified during the last week of October, explained Hiren Jethva, a Morgan State University atmospheric scientist based at NASA’s Goddard Space Flight Center. For about a decade, Jethva has tracked the stubble burning season in India using satellites, and has made predictions about the intensity of the upcoming fire season based on vegetation observations.
The MODIS (Moderate Resolution Imaging Spectroradiometer) on NASA’s Aqua satellite captured this image of a smoky haze darkening skies over much of the plain on November 11, 2025. According to news reports, it was the first of several days in 2025 when pollution levels exceeded 400 on India’s air quality index, the strongest rating on the scale. As in past years, the poor air quality prompted officials in some areas to close schools and institute more stringent air quality controls on construction.
However, the daily timing of burning departs from what Jethva has seen in the past. He started tracking the number of fires years ago by primarily tallying observations from MODIS—which pass over locations on Earth each morning and afternoon on the Terra and Aqua satellites, respectively. Then, most fires were lit in the early afternoon between 1 p.m. and 2 p.m. local time.
But in the past few years, stubble fires have occurred progressively later in the day, Jethva said. He identified the shift by analyzing observations from GEO-KOMPSAT-2A, a South Korean geostationary satellite launched in late 2018 that collects data every 10 minutes.
Most stubble fires now happen between 4 p.m. and 6 p.m., he said, meaning that fire-monitoring systems that rely solely on MODIS, or similar sensors like VIIRS (Visible Infrared Imaging Radiometer Suite), miss many of the fires. “Farmers have changed their behavior,” he said.
His analysis of GEO-KOMPSAT-2A observations indicates that the stubble burning activity in Punjab and Haryana was moderate in 2025 compared to other recent years. This year had higher numbers of fires compared to 2024, 2020, and 2019 but fewer fires than 2023, 2022, and 2021, he found.
Indian Space Research Organization researchers have also pointed out the shift in the timing of stubble burning. In a Current Science study published in 2025, one group reported that MSG (Meteosat Second Generation) satellite observations showed a shift in peak fire activity from about 1:30 p.m. in 2020 to about 5:00 p.m. in 2024. In December 2025, researchers with the International Forum for Environment, Sustainability, & Technology (iForest) released a multi-satellite analysis that came to a similar conclusion.
Meanwhile, parsing out precisely how much stubble fires contribute to poor air quality in Delhi compared to other sources of pollution remains a topic of active study and debate among scientists. “Studies report contributions ranging from 10 to 50 percent,” said Pawan Gupta, a NASA research scientist who specializes in air quality.
Gupta estimates that the stubble burning contribution ranges from 40 to 70 percent on a given day, dropping to 20 to 30 percent if averaged over a month or burning season, and under 10 percent if averaged annually. “Meteorological conditions—like a shallow boundary layer height and low temperature—during the burning season add extra complexity,” he said.
The timing of the fires may influence the degree to which stubble burning affects air quality. Some modeling research suggests that evening fires may lead to a stronger overnight buildup of particle pollution than early-afternoon fires because the planetary boundary layer, the lowest part of the atmosphere, tends to be shallower and have weaker winds at night, allowing pollutants to accumulate.
NASA Earth Observatory image by Michala Garrison, using MODIS data from NASA EOSDIS LANCE and GIBS/Worldview. Story by Adam Voiland.
Career paths are rarely a straight line and often include some unexpected curves. That is certainly true for Erin Sholl, deputy chief of the Space Transportation Systems Division within the Safety and Mission Assurance Directorate at NASA’s Johnson Space Center in Houston. From struggling with multiplication tables in elementary school to supporting the International Space Station from the Mission Control Center, her journey has been full of twists and turns.
Erin Sholl (second from right) received the Johnson Space Center Director’s Commendation Award in 2017 for significant achievements and exemplary contributions to the International Space Station and Commercial Crew Programs as the Safety and Mission Assurance Visiting Vehicles Group lead.
NASA/James Blair
Despite her early difficulties in math and science, Sholl eventually grew to love and excel in both subjects. She planned to study chemical engineering in college – inspired by a love of chemistry and a favorite high school teacher – but discovered a greater affinity for physics once she arrived at Pennsylvania State University. She switched her major to aerospace engineering and soon met a classmate who had interned at Johnson. After that, Sholl declared, “The dream was born!”
Her first position at Johnson was as a trajectory operations officer for the Flight Operations Directorate. She spent six years supporting the space station on console in the Mission Control Center, describing the experience as “something out of the movies.” When Sholl went looking for a new challenge, she landed in the Safety and Mission Assurance Directorate.
Erin Sholl working on console as a trajectory operations officer in the Mission Control Center during the STS-128/17A mission in 2009.
NASA/Lauren Harnett
“I was drawn to the Operations and Visiting Vehicles Branch because it had many similar aspects to my previous position – real-time operations and visiting vehicles,” she said. “I worked various roles over the next 12 years, gradually taking on more responsibility, and eventually becoming a group lead, then branch chief.” Sholl also served as acting deputy chief for the Space Habitation Systems Division, which oversees the Operations and Visiting Vehicles Branch. Her performance drew the attention of the Space Transportation Systems Division’s chief. “He asked me to come be his deputy, and that is where I still am today!”
The Space Transportation Systems Division provides system safety, reliability, and risk analysis for human spaceflight programs. The division works with the different program offices to reduce risk through technical assessments and guidance on Safety and Mission Assurance requirements throughout program and project lifecycles.
Sholl works closely with the division chief to support strategic planning, budgeting, and operations. “A key part of my role is connecting with people – both inside and outside the division – to ensure smooth communication and representation of the team’s needs,” she said. She leverages her relationship-building and strategic thinking skills to lead initiatives that advance the division’s and the directorate’s goals and to mentor employees.
Erin Sholl (center) receives a certificate of achievement from Terrence Wilcutt, former director of the Office of Safety and Mission Assurance (SMA) at NASA Headquarters, and Patricia Petete, former director of SMA at Johnson, after completing requirements for the Safety and Mission Assurance Technical Excellence Program in System Safety.
Image courtesy of Erin Sholl
Sholl believes strongly in the power of mentorship. “Having various mentors, both formal and informal, has been so important throughout my career,” she said. “Listening to what these people were saying about my strengths led me to a path I’d never considered because I hadn’t seen those things in myself.” Being a mentor and advocate for team members is one of Sholl’s favorite parts of the leadership positions she has held, particularly as branch chief. “I really felt like I could connect with my people and advocate for them in a way that felt meaningful,” she said.
She encourages young professionals to seek out mentors or opportunities to shadow colleagues in different roles. “Relationships are the key to everything,” she said. “The more people you meet and the more you learn about different paths in space exploration, the better off you will be in your career.”
Susan Schuh, Flight Crew Integration Operational Habitability (OpsHab) team lead and Erin Sholl host a JSC Parenting community event in 2023.
Image courtesy of Erin Sholl
Sholl noted that professional relationships can be bolstered by activities outside of the office. She played a key role in establishing and growing JSC Parenting, a virtual community of about 600 employees who share information and support each other on issues related to caregiving, schooling, and balancing work with family life. “My leadership within the community enhances my professional leadership and positively impacts my colleagues,” she said.
Sholl also emphasized the importance of being open to trying new things, even if an opportunity seems to diverge from your expected career path. “I volunteer for everything because I am always eager to learn more and find out what else I might be good at and how else I can serve my team,” she said. “I think it’s easy to feel intimidated hearing about other people’s career paths, because they often sound so perfectly planned and successful. You rarely hear about the pivots, setbacks, or decisions made for personal reasons.”
The reality, she added, is more complex. “I tried for many roles I didn’t get, and it took a lot of trial and error to find my path to a career I really love.”