Reading view

There are new articles available, click to refresh the page.

Bitcoin’s Net Realized P/L Hits Zero Again — Is a June 2022-Style Capitulation Next?

Bitcoin is again near another critical on-chain inflection point as a key profitability indicator goes back to the levels that last occurred during one of the most painful downtrends in the history of the market.

CryptoQuant analyst Adler AM data shows that the Net Realized Profit and Loss of Bitcoin has dropped by approximately 97% after it achieved its recent high and is now approaching the levels of near-zero territory.

The situation is similar to those observed in June 2022 before BTC plummeted from about 30,000 to almost 16,000.

Net Realized P/L has dropped by 97% and returned to zero. The last time this happened was in June 2022 – right before the drop from $30K to $16K. Whales are still in profit (a 25-80% buffer), so there is no panic yet. But the market is being supported not by buyers – but by the… pic.twitter.com/ooQsnaGTCA

— Axel 💎🙌 Adler Jr (@AxelAdlerJr) January 26, 2026

Net Realized P/L tracks the balance between realized profits and losses on the Bitcoin network based on on-chain cost basis. Positive readings signal dominant profit-taking, while negative values reflect loss-driven selling.

Readings near zero suggest trades are occurring close to cost basis, indicating profit exhaustion and a balance between buyers and sellers.

Bitcoin Selling Pressure Fades, but Buyers Stay on the Sidelines

The analyst pointed out that the current setup resembles the period just before Bitcoin’s main capitulation leg in 2022. In late 2024 and early 2025, Net Realized P/L surged above $1.5 billion, reflecting an overheated profit-taking phase.

By January 26, 2026, that figure had collapsed to roughly $60 million, effectively flattening at the zero line. In 2022, a similar return to zero did not mark a bottom.

Instead, the metric continued lower into deeply negative territory, falling to around minus $350 million as the price slid another 50%.

Adler noted that the present zero reading should not be interpreted as a bullish reversal signal. Instead, it represents a pause where selling pressure from profit-takers has largely dried up, but fresh demand has not stepped in.

On-chain data suggests the market is currently being supported more by the absence of sellers than by strong buying interest, a fragile equilibrium that has historically broken lower during risk-off environments.

Source: CryptoQuant

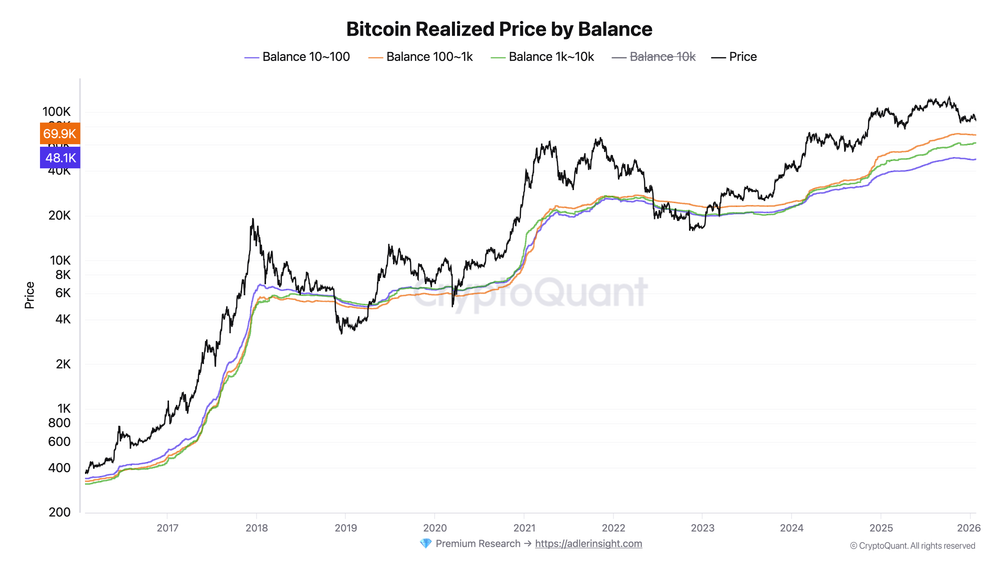
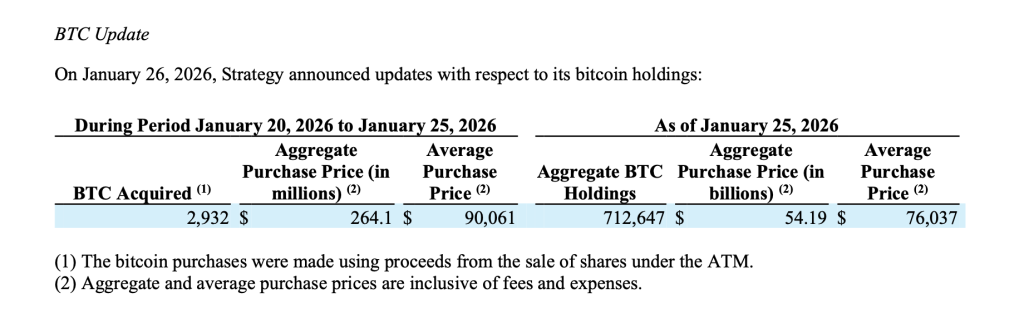
Despite the warning signals, large Bitcoin holders remain in profit, as realized price data segmented by balance size shows that all major whale cohorts are still comfortably above their average acquisition costs.

Holders with balances between 100 and 1,000 BTC have the highest realized price, near $69,900, giving them an estimated profit buffer of about 25% at current prices.

Other large cohorts, including wallets holding 10–100 BTC and those with more than 10,000 BTC, have average entry prices closer to $48,000 and $51,000, translating to unrealized gains of 70% to 80%.

This helps explain the lack of panic selling, even as price has pulled back sharply from recent highs.

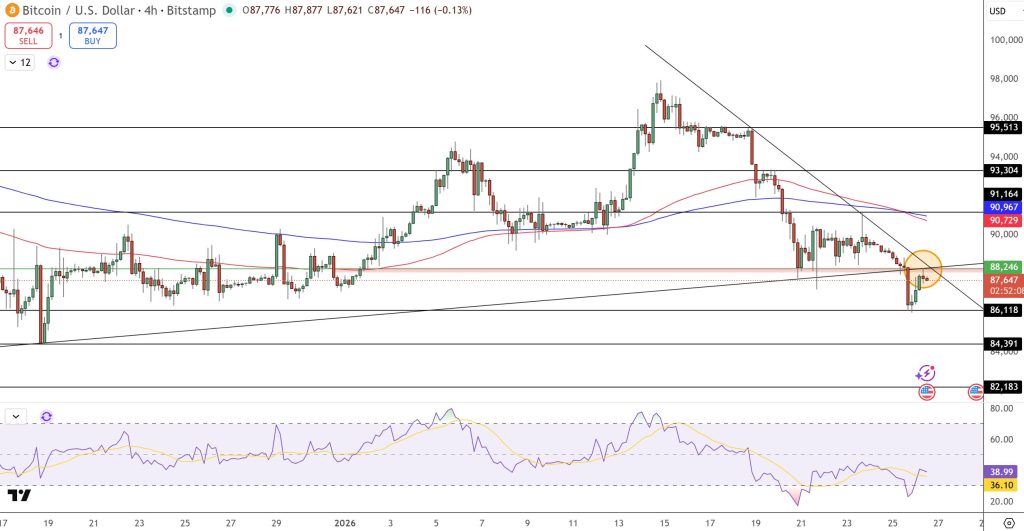
Bitcoin Slips Below $88K as Volatility Picks Up

At the time of writing, Bitcoin was priced at approximately $87,756, having fallen by approximately 1.1% in the last 24 hours and 5.7% in the last week.

Source: Cryptonews

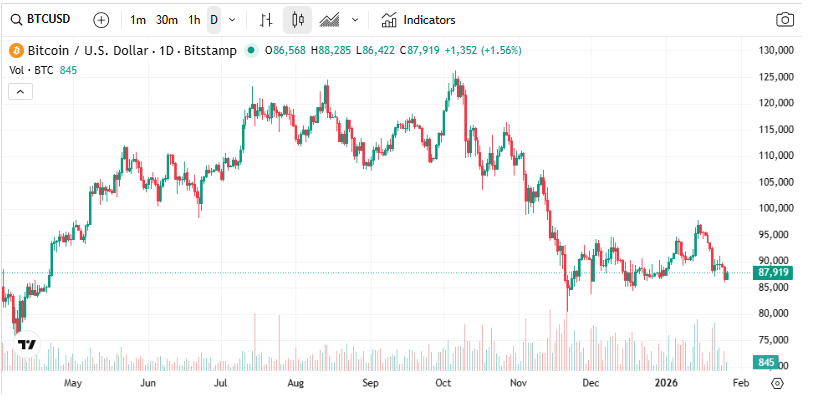
Trading volume, however, surged more than 160% day over day to $53.1 billion, pointing to heightened activity as traders reposition amid volatility.

Macro pressure has contributed to the discomfort because U.S. President Donald Trump threatened to impose 100% tariffs on any Canadian products in case Ottawa strengthens trade relations with China, and the rumors of a potential American government shutdown resurfaced.

The move triggered more than $320 million in liquidations of leveraged long positions in a matter of hours.

Also, CoinShares reported $1.73 billion in outflows from digital asset investment products last week.

📉 Digital asset investment products saw sharp outflows last week, with investors pulling $1.73B — the largest weekly decline since mid-November 2025, according to CoinShares.#BTC #ETPs https://t.co/2ni4w83evG

— Cryptonews.com (@cryptonews) January 26, 2026

Bitcoin-linked products accounted for $1.09 billion of those outflows, with the bulk coming from U.S.-based funds.

Exchange order book data shows sell-offs were absorbed with modest volume delta, indicating controlled selling.

Analysts say liquidity remains stable, with no signs yet of cascading capitulation.

The post Bitcoin’s Net Realized P/L Hits Zero Again — Is a June 2022-Style Capitulation Next? appeared first on Cryptonews.

River price defies market downturn, explodes 40% to new ATH

  • River price rose sharply as bulls defied the broader market downturn.
  • The token exploded more than 40% in 24 hours to hit a new all-time high above $87.
  • RIVER recently received backing from Justin Sun and Arthur Hayes.

Several altcoins are deep in the red amid a broader cryptocurrency market downturn that has pushed Bitcoin well under $90,000.

But as BTC struggles, River’s native token RIVER has defied the odds, with price surging 40% in the past 24 hours to reach a new all-time high above $87.

The move sees the token rank as one of the top gainers across the altcoin sector.

River price explodes to new all-time high

River is a crypto protocol building a chain abstraction stablecoin platform.

The protocol eyes traction across the ecosystem with its liquidity and yield offering.

RIVER, the native governance and utility token, has surged significantly in recent days and skyrocketed 40% over the past 24 hours to smash through resistance to a new all-time high.

The token has pumped more than 200% in the past week and by more than 2,070% in the past month.

It peaked at $87.79 across major exchanges on January 26, 2025, more than 70x off the all-time lows reached in September 2025.

River’s explosive rally comes as the token’s market capitalisation ballooned past $1.6 billion, which aligns with the robust demand highlighted by a 39% jump in daily trading volume.

CoinMarketCap data shows the altcoin’s trading volume spiked to over $108 million in the past 24 hours.

Meanwhile, total value locked (TVL) climbed to over $162 million, as DeFi users flocked to the protocol’s cross-chain offerings.

In terms of gains, River’s performance stands in stark contrast to the prevailing market sentiment.

Bitcoin, the bellwether asset, dipped below $88,000 amid macroeconomic jitters.

Ethereum and other altcoins followed suit as risk-off sentiment grips traders.

The same headwinds could see RIVER ‘s price retreat sharply.

What catalysed the RIVER price rally?

Likely catalysts for RIVER’s meteoric rise include the latest listings and major backing in a fresh round.

Of the more than $14 million in capital raised, a landmark $12 million is from a strategic funding round backed by heavyweight investors that attracted TRON DAO, Justin Sun, Maelstrom Fund founder Arthur Hayes, and The Spartan Group.

Notably, the round also drew commitments from Nasdaq-listed companies and blue-chip institutions across the United States and Europe, lending unprecedented credibility to River’s vision.

River plans to plough this capital infusion into its multi-chain expansion plans, with DeFi applications available across Sui, Ethereum, BNB Chain, and Polygon.

Amplifying the momentum for the token is fresh exchange listings.

Both HTX and OKX have injected new liquidity and retail access to the token. Bulls capitalised on this, stacking positions as open interest in RIVER perpetuals.

Resistance looms at $90, but with funding secured and listings live, RIVER could test $100 in the coming days. However, a sharp pullback is possible given profit-taking deals.


The post River price defies market downturn, explodes 40% to new ATH appeared first on CoinJournal.

[InterLink by Design #3] Retail vs. Institutions: Who Actually Holds the Power in InterLink?

The Great Alignment: How Time Becomes the Ultimate Equalizer Between Giants and Individuals


In [Part II], we established a critical principle: InterLink’s token numbers are not about price — they are about access, qualification, and time.

Participation is abundant.

Settlement is protected.

Ownership is earned.

🔗LINK[InterLink by Design #2]

[InterLink by Design #2] The 100 Billion Question: Why InterLink Built a Filter, Not a Pump

​That naturally leads to the final, and perhaps most uncomfortable, question:

Not what the system is, but who the system ultimately rewards.

AI-generated image for illustrative purposes. Not a real photograph.

📡 The Signal Shift: InterLink Enters Its “Institutional Phase”

One of the most misunderstood moments in a network’s life cycle is the arrival of institutions.

Many retail participants see this and panic: “The easy phase is over,” or “The rules will change to favor the big players.”

In InterLink, institutional participation doesn’t make entry easier; it raises the bar. 🚧

When we see Treasury-level language and settlement partnerships, we aren’t seeing “hype” — we are seeing a system preparing for durability.

Institutions don’t enter to gamble.
They enter to endure.

To them, InterLink is a tool for two things: Storing Value and Killing Risk.

This changes the game, but not in the way you might expect.

🛑 Why the System Becomes Harder — and Why That’s a Feature

As InterLink matures, the “easy rewards” begin to evaporate.

You’ll notice:

  • Higher verification standards. 🔍
  • Zero tolerance for idle or “fake” participation. ⚔️🚫
  • A heavy emphasis on consistency over random bursts of activity. ⏳

​Easy rewards attract noise;
hard qualifications protect meaning.

What you lose in short-term convenience, you gain in scarcity created by discipline.

🧍👣 The Individual’s Role: You Are a Node, Not a Miner

The most damaging misunderstanding in Web3 is linguistic. People still call themselves “miners,” implying they are here to extract resources.

InterLink is not optimized for extraction.
It is optimized to preserve signal integrity.

Your role is closer to a Network Node than a miner:

  • You accumulate verified activity over time.
  • You maintain behavioral consistency.
  • You build trust relationships (Security Groups).

Every action you take is not a “bet” — it is input data.

The question is no longer “How much did I earn today?” it becomes “What did I prove today?”

🏛️ The Institution’s Role: Custodians, Not Traders

Institutions operate under constraints that retail users often ignore. They cannot rely on sudden exits or narrative volatility.

This is why, inside InterLink, institutions don’t behave like traders — they behave like custodians.

They have no incentive to “dump” ITLG because:

  • Verified participation is the only gate to settlement access.
  • Governance rights compound over years, not weeks.
  • Treasury positioning requires stability, not liquidity spikes.

When both institutions and individuals are punished for impatience, the system achieves a rare economic balance.

🕰️ The Final Axis: Time Is Not Neutral

Most crypto systems pretend that time is neutral or a mere multiplier of interest.

InterLink treats Time as a Filter.

  • Being “early” guarantees nothing if you are inconsistent.
  • Having a “large balance” cannot override bad behavior.
  • Inactivity leads to a decay in relevance.

Time doesn’t reward your optimism; it rewards the records that survive scrutiny.

Not everyone will be early.
Not everyone will be large.
But anyone can be consistent.

🏁 Conclusion: The Rule That Binds Retail and Institutions Alike

This was never a contest between Retail and Institutions. It was a test of which behaviors survive the same rules.

InterLink does not guarantee returns, protect you from a lack of effort, or flatten outcomes to make everyone “equal.” Instead, it enforces a single, ironclad rule:

Only behavior that survives time is recognized.

If you understand the sequence — qualification before reward — you will find something much rarer than mere “yield.”

You will find Position.

🧭 Series Final Line

InterLink didn’t design a coin economy. It designed the order in which trust is allowed to matter.

About the Author

Done.T is a Web3 analyst specializing in the InterLink ecosystem.
He unpacks the underlying logic of the Human Node economy, translating complex system design into actionable, data-driven insights for a global audience.

Reference
🔗 [Chapter 2. The Deep Dive — Mechanics & Insights]​

Disclaimer: This article provides a strategic analysis of InterLink’s publicly available infrastructure and documentation.
It is not financial advice. Readers should conduct their own due diligence.


[InterLink by Design #3] Retail vs. Institutions: Who Actually Holds the Power in InterLink? was originally published in Coinmonks on Medium, where people are continuing the conversation by highlighting and responding to this story.

NordFX Receives Two More Industry Awards in 2025

By: NordFX

NordFX has been recognised with two additional international awards in 2025, confirming the company’s strong position in execution quality and broker reliability.

✔️ Best Execution Broker 2025 — Forexing Awards
✔️ Most Reliable Forex Broker Asia 2025 — Finance Derivative Awards

These honours reflect NordFX’s continued focus on stable execution, transparent operations, and long-term trust among traders worldwide.

🔗 Read more:
https://nordfx.com/company-news/nordfx-receives-two-more-awards-2025-execution-reliability


🏆 NordFX Receives Two More Industry Awards in 2025 was originally published in Coinmonks on Medium, where people are continuing the conversation by highlighting and responding to this story.

Interest Rates for Traders: The FOMC Playbook Most Beginners Miss

By: MintonFin
Interest Rates for Traders: The FOMC Playbook Most Beginners Miss

Markets don’t move because interest rates change — they move because expectations do. And every single beginner trader misses that difference.

If you’ve ever watched Bitcoin, stocks, or forex explode before an interest rate decision — or dump after “good news” — you’ve already felt the power of the Federal Open Market Committee (FOMC)… without understanding it.

This article breaks down how interest rates actually move markets, why FOMC meetings are trader liquidity events, and the exact playbook professionals use that beginners never learn.

Whether you trade crypto, equities, indices, or FX, this is the missing framework you need.

What Is the FOMC?

The Federal Open Market Committee (FOMC) is the policy-making arm of the U.S. Federal Reserve responsible for:

  • Setting interest rates (Fed Funds Rate)
  • Managing liquidity conditions
  • Guiding inflation expectations
  • Influencing global risk assets

Why this matters to traders

The U.S. dollar is the world’s reserve currency.

When the Fed changes policy, every major market reacts:

  • S&P 500
  • Nasdaq
  • Bitcoin & crypto
  • Gold
  • Forex pairs
  • Bonds & yields

Interest rates are the price of money.
When that price changes — or is expected to change — capital moves.

Interest Rates Explained Simply

Think of interest rates like gravity.

  • Low rates → money flows into risk assets
  • High rates → money flows into safety

What happens when rates rise?

  • Borrowing becomes more expensive
  • Liquidity tightens
  • Valuations compress
  • Risk assets struggle

What happens when rates fall?

  • Capital becomes cheaper
  • Leverage increases
  • Speculation rises
  • Risk assets thrive

This is why rate cycles and market cycles are inseparable.

The #1 Mistake Beginner Traders Make With FOMC

Most beginners think:

“If the Fed cuts rates, markets go up. If they hike, markets go down.”

That thinking gets traders liquidated.

Reality:

Markets move based on:

  • Expectations
  • Forward guidance
  • Powell’s tone
  • Dot plot projections
  • Liquidity positioning

The decision itself matters less than the surprise.

The FOMC Playbook (How Pros Actually Trade It)

Professional traders break FOMC into four phases:

The FOMC Playbook

Let’s break each one down:

Phase 1: Pre-FOMC Expectations (Weeks Before the Meeting)

Markets price in rate decisions weeks in advance.

Tools professionals use:

  • CME FedWatch Tool
  • Treasury yields (2Y & 10Y)
  • Dollar Index (DXY)
  • Risk sentiment indicators

Example:

If FedWatch shows a 90% probability of a rate cut, that cut is already priced in.

So when it happens?

  • Markets often sell the news

Phase 2: Liquidity Positioning (Days Before FOMC)

This is where most traps are set.

What typically happens:

  • Volatility compresses
  • Price ranges tighten
  • Fake breakouts increase
  • Retail traders over-leverage

This is because:

Institutions wait.
Retail trades noise.

This is not the time to predict direction — it’s the time to mark liquidity levels.

Phase 3: The Rate Decision (The 2:00 PM Trap)

At 2:00 PM ET, the Fed releases:

  • Interest rate decision
  • Policy statement
  • Dot plot (quarterly)

What you’ll often see:

  • Violent spike up
  • Immediate reversal
  • Stop hunts in both directions

This is algorithmic trading, not sentiment.

If you trade the first 5 minutes, you’re trading against machines.

Phase 4: Powell’s Press Conference (The Real Trade)

This is where trends are born.

Jerome Powell’s language matters more than the rate decision itself.

Traders listen for:

  • “Data dependent”
  • “Restrictive”
  • “Higher for longer”
  • “Financial conditions”
  • “Inflation progress”

Markets move on tone, not headlines.

Real Case Study: FOMC vs Bitcoin (2022–2024)

2022: Aggressive Hiking Cycle

  • Rates rose rapidly
  • Liquidity drained
  • Bitcoin fell from $69K → $15K

Not because of crypto fundamentals — but monetary tightening.

2023: Pause Narrative Begins

  • Rate hikes slow
  • Market anticipates cuts
  • Bitcoin rallies 300%+

Markets moved before cuts happened.

2024: “Higher for Longer” Shock

  • Powell signals caution
  • Risk assets stall
  • Volatility spikes

This is expectations vs reality in action.

Interest Rates and Crypto: The Hidden Correlation

Crypto traders often ignore interest rates — and pay for it.

Why rates matter for crypto

  • Stablecoin yields compete with DeFi
  • Liquidity determines speculative appetite
  • Bitcoin trades like a liquidity asset, not a currency

When real yields rise, crypto struggles.
When real yields fall, crypto breathes.

The Economic Calendar Every Trader Must Track

Bookmark this. No excuses.

High-Impact Rate Events:

  • FOMC Rate Decisions (8x/year)
  • FOMC Minutes
  • CPI (Inflation)
  • PCE Inflation
  • Non-Farm Payrolls (NFP)
  • Jackson Hole Symposium

Pro Tip:

Markets often move harder on CPI than FOMC.

Sample FOMC Trading Calendar (Example)

Sample FOMC Trading Calendar

(Always confirm dates via official Fed calendar)

How Beginners Should Trade FOMC (Safely)

This is the beginner-proof framework:

1. Do NOT predict direction

Let the market show its hand.

2. Reduce position size

Volatility kills over-leverage.

3. Trade after confirmation

Not during the announcement.

4. Watch correlated markets

DXY, yields, equities tell the truth.

Advanced Tip: Yield Curves & Risk Assets

Professionals track:

  • 2-Year Treasury Yield
  • 10-Year Treasury Yield
  • Yield curve steepening / inversion

Because:

  • Rising short-term yields = tightening
  • Falling long-term yields = recession risk
  • Risk assets respond accordingly

The Psychological Edge Most Traders Miss

FOMC events expose emotional traders.

  • Fear of missing out
  • Revenge trading
  • Overconfidence
  • News addiction

Pros stay flat. Beginners chase candles.

Frequently Asked Questions About Interest Rates & FOMC

Do interest rates affect crypto prices?

Yes. Interest rates influence liquidity, risk appetite, and capital flows, all of which directly impact crypto markets.

Why do markets move before FOMC decisions?

Markets price in expectations ahead of time using futures, yields, and macro data.

Is it safe to trade during FOMC?

For beginners, no. Volatility and algorithmic trading create high liquidation risk.

What matters more: rate decision or Powell’s speech?

Powell’s tone and forward guidance usually matter more than the rate decision itself.

Final Thoughts: Trade the Narrative, Not the Number

Interest rates are not a headline — they’re a system.

If you only watch:

  • “Rate up or down”

You’ll always be late.

If you understand:

  • Expectations
  • Liquidity
  • Positioning
  • Narrative shifts

You trade with institutions, not against them.

That’s the FOMC playbook most beginners never learn — until it’s too late.

If this helped you, clap, bookmark and share with another trader who still trades headlines.

Because markets don’t reward predictions — they reward preparation.


Interest Rates for Traders: The FOMC Playbook Most Beginners Miss was originally published in Coinmonks on Medium, where people are continuing the conversation by highlighting and responding to this story.

XRP ETFs Could Change Crypto Investing — Here’s How

By: MintonFin

XRP ETFs Could Change Crypto Investing — Here’s How

XRP ETFs

For years, XRP has lived in a regulatory gray zone — debated, sidelined, underestimated. But the rise of XRP ETFs could flip the script entirely, pulling Ripple’s token out of speculation territory and into the heart of institutional finance.

If approved, XRP exchange-traded funds (ETFs) wouldn’t just boost XRP’s visibility — they could reshape how institutions, retirement accounts, and conservative investors gain exposure to crypto.

Just as Bitcoin ETFs unlocked billions in institutional inflows, XRP ETFs may become the next major bridge between Wall Street and blockchain-based assets.

So what does this actually mean for crypto investors, portfolio managers, and long-term wealth builders?

Let’s break it down.

What Is an XRP ETF?

An XRP ETF is a regulated investment fund that tracks the price of XRP and trades on traditional stock exchanges, allowing investors to gain exposure to XRP without directly buying, storing, or managing crypto tokens.

XRP ETFs could:

  • Increase institutional demand for XRP
  • Improve market liquidity
  • Reduce volatility over time
  • Make XRP accessible to retirement accounts and wealth managers

Why XRP ETFs Matter More Than You Think

Bitcoin ETFs didn’t just boost BTC’s price — they legitimized crypto as an asset class.

XRP ETFs could have an even broader structural impact.

XRP is not positioned as “digital gold” — it’s positioned as financial infrastructure.

Ripple’s core value proposition is cross-border payments, liquidity provisioning, and settlement efficiency for banks and institutions. An ETF structure aligns perfectly with that narrative.

Key difference: Bitcoin ETFs vs XRP ETFs

Key Difference: Bitcoin ETFs vs XRP ETFs

This distinction matters enormously for long-term capital flows.

XRP ETF Institutional Demand: Why Wall Street Is Watching Closely

Institutions cannot easily buy spot XRP today

Many institutions face barriers such as:

  • Custody risk
  • Compliance restrictions
  • Internal policy bans on direct crypto holdings
  • Accounting complexities

An XRP ETF removes all of these.

What institutions can do with ETFs

  • Add XRP exposure to balanced portfolios
  • Allocate via pension funds
  • Include in 401(k)s and IRAs
  • Use XRP exposure in risk-managed strategies

This is exactly what happened after Bitcoin spot ETFs launched.

How XRP ETFs Could Impact XRP Price Dynamics

Let’s be clear: ETFs don’t guarantee price appreciation — but they do change market mechanics.

Potential effects of XRP ETFs on price

1. Increased sustained demand

  • ETFs buy and hold XRP for fund backing
  • Reduces available circulating supply

2. Lower volatility over time

  • Institutional capital is typically long-term
  • Less emotional buying/selling

3. Higher liquidity

  • Tighter spreads
  • Deeper order books

4. Narrative re-rating

  • XRP shifts from “regulatory-risk token” to “regulated investment product”

This narrative shift alone can change how XRP is valued.

Ripple, Regulation, and the ETF Approval Path

No XRP ETF conversation is complete without addressing regulation.

Ripple’s legal battles with the SEC were a major roadblock for years. But regulatory clarity — even partial — changes the landscape dramatically.

Why regulation matters for ETFs

  • ETFs require clear asset classification
  • Custodians need regulatory certainty
  • Issuers avoid legal ambiguity

As regulatory frameworks evolve globally, XRP becomes increasingly ETF-viable, especially in jurisdictions outside the U.S. first.

Global XRP ETFs: The International Advantage

Even if U.S. approval lags, international markets may move faster.

Countries with more crypto-friendly regulatory environments could:

  • Approve XRP ETFs earlier
  • Attract global capital
  • Set precedent for U.S. regulators

This mirrors what happened with Bitcoin ETFs in Canada and Europe before U.S. approval.

Most crypto investors miss this:
Price moves follow infrastructure — not the other way around. XRP ETFs aren’t about pumps, they’re about permanent demand.

Save this article if you’re building a long-term crypto strategy, not chasing headlines.

How XRP ETFs Could Change Portfolio Construction

For wealth managers, XRP ETFs unlock a new category.

XRP ETFs fit into portfolios as:

  • Alternative liquidity assets
  • Fintech exposure
  • Blockchain infrastructure allocation
  • Non-correlated growth instruments

This matters for:

  • Family offices
  • Endowments
  • Hedge funds
  • Financial advisors

Instead of treating crypto as a single high-risk bucket, XRP ETFs allow segmented crypto exposure.

XRP vs Bitcoin ETFs: Complement, Not Competition

Another misconception is that XRP ETFs would compete with Bitcoin ETFs.

In reality, they serve different roles.

Bitcoin ETFs = macro hedge
XRP ETFs = payments & liquidity

Institutions often allocate to both.

Retail Investors: Why XRP ETFs Still Matter to You

Even if you already hold XRP directly, ETFs matter.

This is because:

  • ETFs increase market legitimacy
  • More buyers = deeper markets
  • Lower volatility benefits holders
  • Institutional research coverage increases

Historically, when institutions enter a market, retail benefits indirectly.

Risks to Consider Before XRP ETFs Launch

Balanced coverage builds trust — and readers appreciate honesty.

Key risks

  • Regulatory delays
  • ETF approval rejection
  • Low initial inflows
  • Market overhype

However, even ETF discussions alone already shift sentiment.

Smart investors don’t ignore risks — they price them in.

Understanding both the upside and limitations of XRP ETFs is how real capital survives market cycles.

Clap for this reading if you value balanced crypto analysis over hype.

Long-Term Outlook: XRP ETFs as a Structural Shift

The biggest mistake investors make is thinking ETFs are just “price catalysts.” They’re not.

They are infrastructure gateways.

XRP ETFs could:

  • Cement XRP as a financial instrument
  • Lock in institutional relevance
  • Anchor long-term demand
  • Shift XRP from speculation to allocation

That’s a huge transition.

Frequently Asked Questions About XRP ETFs

Will XRP ETFs increase XRP price?

XRP ETFs may increase demand and liquidity, which can support price appreciation, but they do not guarantee it.

Are XRP ETFs approved yet?

As of now, XRP ETFs are under discussion and regulatory review in multiple jurisdictions, with approval timelines varying.

Why do institutions prefer ETFs over crypto tokens?

ETFs offer regulatory clarity, simplified custody, compliance compatibility, and easier portfolio integration.

Could XRP ETFs attract institutional demand?

Yes. XRP ETFs are specifically designed to unlock institutional capital that cannot directly hold crypto.

What Smart Investors Are Watching Right Now

Instead of obsessing over price predictions, smart investors are watching:

  • ETF filings
  • Custodian partnerships
  • Regulatory signals
  • Institutional commentary
  • Cross-border adoption metrics

That’s where the real edge lies.

Conclusion: XRP ETFs Could Redefine Crypto Exposure

XRP ETFs aren’t just another crypto product — they represent a shift in how crypto integrates with traditional finance.

If Bitcoin ETFs legitimized crypto as an asset class, XRP ETFs could legitimize crypto as financial infrastructure.

And that distinction could change everything.

Clap if this article helped clarify the XRP ETF narrative, and share with anyone still sleeping on how ETFs reshape markets.

Smart capital moves early — informed capital moves first.


XRP ETFs Could Change Crypto Investing — Here’s How was originally published in Coinmonks on Medium, where people are continuing the conversation by highlighting and responding to this story.

Most businesses don’t realize the damage until it’s too late)

Artificial intelligence was supposed to make businesses leaner, faster, and more profitable.

Instead, for many companies, it has quietly become one of the most expensive line items on the balance sheet — without delivering proportional returns.

I see this pattern over and over again.

Founders proudly announce they’re “AI-powered.”
Teams stack subscriptions like badges of innovation.
Budgets swell under the assumption that more AI equals more efficiency.

And yet… profit margins shrink.

The truth is uncomfortable:

AI doesn’t kill profit. Bad AI spending does.

This article isn’t anti-AI. Quite the opposite.
AI can be one of the most powerful leverage tools in modern business — when used correctly.

But there are five specific AI expenses that quietly drain cash, compound inefficiencies, and erode margins — often without anyone noticing until growth stalls or costs spiral out of control.

If you’re running an online business, agency, SaaS, eCommerce store, or even a content operation, this article may save you thousands — possibly tens of thousands — per year.

Let’s break them down.

1. Paying for AI Tools You’re Not Actually Using

This is the most common and the most invisible profit killer.

It starts innocently.

You sign up for an AI writing tool.
Then a design assistant.
Then a chatbot platform.
Then an automation tool.
Then a data analysis AI.
Then a “one-click growth” AI you saw on Twitter.

Each one feels cheap on its own.

£19/month
£29/month
£49/month
£99/month

But stack them together, and suddenly you’re burning £400–£1,200 per month on AI software — much of which sits idle.

The Silent Subscription Trap

AI tools are especially dangerous because:

  • They sell potential, not guaranteed outcomes
  • Most offer “unlimited” or “pro” tiers that feel necessary
  • Cancellation friction is intentionally subtle

So what happens?

  • Teams test the tool for a week
  • Use it enthusiastically for a month
  • Then revert to old workflows
  • But never cancel the subscription

Three months later, the tool is still billing.
Six months later, nobody remembers why it was purchased.
A year later, it’s still quietly draining profit.

Multiply this by 5–10 tools, and you have a serious leak.

The Fix: Usage-Based AI Audits

Every quarter, ask three brutal questions for every AI tool:

  1. Who used this in the last 30 days?
  2. What specific output did it produce?
  3. Did that output directly save time or generate revenue?

If the answer isn’t clear, measurable, and defensible — cancel it.

AI tools should earn their place on your balance sheet.
If they can’t justify their cost, they’re not “innovation.”
They’re overhead.

2. Overpaying for “All-in-One” AI Platforms

“All-in-one AI” sounds efficient.

One dashboard.
One subscription.
One solution for everything.

In reality, these platforms are often bloated, overpriced, and underperforming.

The All-in-One Illusion

Most all-in-one AI platforms promise:

  • Content creation
  • Social scheduling
  • Email marketing
  • Analytics
  • Chatbots
  • Automation

But here’s what they rarely tell you:

They’re mediocre at everything and excellent at nothing.

You end up paying premium prices for:

  • Features you don’t need
  • Tools you already have
  • Capabilities your team doesn’t use

Worst of all, these platforms often lock you into:

  • Annual contracts
  • User-based pricing
  • Artificial limits

So you pay more because you’re growing — even if output doesn’t scale proportionally.

The Hidden Cost: Flexibility

When your AI stack is locked inside a monolithic platform:

  • You can’t swap tools easily
  • You can’t optimize per task
  • You can’t adapt quickly

Your business becomes dependent on one vendor’s roadmap — not your own priorities.

That dependency is expensive.

The Fix: Modular AI Stacks

Instead of one bloated platform, build a lean, modular AI stack:

  • One strong core model (e.g., text, reasoning, analysis)
  • One automation layer (only if needed)
  • One domain-specific tool (design, video, data, etc.)

This approach:

  • Costs less
  • Scales better
  • Gives you control

The goal is precision, not consolidation.

3. Using AI to Automate the Wrong Things

This is where AI spending becomes actively harmful.

Automation is seductive.
It feels like progress.

But automating the wrong processes doesn’t save money — it multiplies inefficiency.

Automation Without Strategy

Many businesses jump straight to:

  • AI chatbots before fixing support workflows
  • AI content generation before clarifying brand voice
  • AI ads before validating offers
  • AI outreach before understanding their ICP

So what happens?

  • Bad processes become faster
  • Confusion becomes scalable
  • Errors propagate automatically

You’re no longer making mistakes manually — you’re making them at scale.

The Cost Nobody Tracks

The expense isn’t just the AI subscription.

It’s:

  • Lost leads from broken automations
  • Customer frustration from robotic responses
  • Brand damage from inconsistent messaging
  • Team time spent fixing AI-generated problems

These costs don’t show up neatly on a spreadsheet, but they hit revenue directly.

The Fix: Automate Only After Optimization

AI should be the last step, not the first.

Before automating anything, ask:

  • Is this process already working manually?
  • Is the output quality acceptable?
  • Can a human clearly define success?

If the answer is no, AI will not fix it.

AI amplifies systems.
It does not repair broken ones.

4. Paying for AI Output That Replaces Cheap Human Work

This one sounds controversial, but it’s critical.

AI is not always cheaper than humans — especially for low-value, repetitive tasks.

The False Economy of AI Replacement

Many businesses replace:

  • Virtual assistants
  • Junior content writers
  • Entry-level designers
  • Customer support agents

…with AI tools costing hundreds per month.

But let’s do the math.

A part-time VA might cost:

  • £4–£6 per hour
  • £300–£500 per month

An AI stack replacing them might cost:

  • £200–£400 per month
  • Plus setup
  • Plus maintenance
  • Plus supervision

And AI still:

  • Makes mistakes
  • Needs prompting
  • Requires review

So what did you really save?

Often, nothing.

In some cases, you paid more for worse output.

Where AI Actually Wins

AI is best used where:

  • Human labor is expensive
  • Speed matters more than perfection
  • Scale creates compounding value

Examples:

  • Research synthesis
  • Drafting (not final writing)
  • Data analysis
  • Pattern detection
  • First-pass ideation

Using AI to replace low-cost human labor is usually a profit trap, not a win.

The Fix: Human-AI Leverage, Not Replacement

The most profitable model is:

  • Humans do judgment, taste, and decision-making
  • AI handles volume, speed, and repetition

When AI augments people instead of replacing them, margins improve without quality collapse.

5. Paying for AI Without Clear ROI Metrics

This is the most dangerous expense of all.

AI feels intangible.
So businesses treat its cost as “experimental.”

That’s how profit leaks go unnoticed.

The “Innovation Budget” Mistake

AI spending often hides under labels like:

  • Innovation
  • R&D
  • Growth
  • Digital transformation

These budgets are rarely scrutinized the same way ad spend or payroll is.

As a result:

  • Tools stay active without evaluation
  • Costs accumulate quietly
  • ROI is assumed, not measured

The longer this continues, the harder it becomes to cut — because nobody wants to admit the spend didn’t pay off.

The Fix: Tie AI to One Metric Only

Every AI tool should be linked to one primary metric:

  • Time saved
  • Revenue generated
  • Cost reduced
  • Error rate lowered

If you can’t point to that metric and say,
“This tool improved this number,”
then you don’t have an AI strategy — you have a hope.

AI should justify itself like any other investment.

The Real Reason AI Kills Profit (When It Does)

AI doesn’t kill profit because it’s expensive.

It kills profit because:

  • Businesses buy it emotionally
  • Implement it randomly
  • Measure it poorly

AI is often treated as a status symbol instead of a system.

That’s the mistake.

The companies winning with AI aren’t the ones using the most tools.
They’re the ones using the fewest, intentionally.

A Simple AI Profit Framework

If you want AI to increase profit instead of eroding it, follow this framework:

  1. Identify one bottleneck
  2. Fix it manually
  3. Apply AI only where it amplifies results
  4. Measure impact monthly
  5. Cut aggressively when ROI fades

That’s it.

No hype.
No tool hoarding.
No sunk-cost loyalty.

Just disciplined leverage.

Final Thought

AI is not a magic button.

It’s a multiplier.

If your systems are messy, AI multiplies chaos.
If your spending is undisciplined, AI multiplies waste.
If your strategy is clear, AI multiplies profit.

The difference isn’t the technology.

It’s how — and why — you pay for it.

Just tell me what you want next — and whether this is going into your own publication or a partner one.

I expanded another framework into a step-by-step ebook for all who want to apply it in very good of this version — not. just read about it

Unlock the future of finance with quantum

https://samurai301.gumroad.com/l/dpgzo


Most businesses don’t realize the damage until it’s too late) was originally published in Coinmonks on Medium, where people are continuing the conversation by highlighting and responding to this story.

Gold Hits Record $5K While Bitcoin Struggles To Keep Pace

Gold shone brightly today, racing to a new high while crypto took the back seat, and the gap between the two assets opened wide.

On Monday, the precious metal moved past the $5,000 mark, registering a price point market sentinels had not witnessed before. Bitcoin, by contrast, failed to keep pace and traded well below its recent highs.

Gold Hits Record Levels

Safe-haven demand pushed gold sharply higher. Prices were up above $5k an ounce and inked roughly $5,110 at the peak. Silver, for its part, did not go unnoticed, jumping to fresh peaks near $107/ounce.

Traders pointed to simmering geopolitical friction and talk of tougher trade moves led by US President Donald Trump as fuel for the rally.

A weaker greenback made metals more attractive to customers overseas, and central bank buying provided steady backing. Liquidity in some corners were thin as investors rushed to shift cash into things that feel stable when risk elevates.

Bitcoin Falls Behind

Market numbers show Bitcoin hovering in the mid-$80,000s range, retreating from peaks seen late last year. Reports note the alpha crypto is roughly 30% below the highest level it hit reached in October 2025, leaving some holders quite jittery.

Volatility was another factor. Where bullion is being sought for safety, Bitcoin is viewed more as a growth or speculative play, and that difference in investor application becomes clear when markets tighten. Some funds slashed their crypto exposure, signaling a short reroute away from high-risk gambits.

Why Investors Are Shifting

Analysts and traders described a simple choice: shelter or swing for gains. When headlines push worry, money flows into assets that are widely trusted across markets and governments.

Metals fit that ticket. Based on market chatter, fears of a US government funding clash and fresh tariff announcements stacked pressure on stocks and added a sense of urgency to safe-haven acquisition.

Options and futures trading hinted at a more cautious perpective, with volatility indexes rising and bond yields behaving in ways that made the yellow metal look more appealing by comparison.

What Traders Are Watching

Market watchers said eyes will be glued on a few key metrics: The dollar’s path, moves by major central banks, and any sign that US politics escalates could keep metals elevated.

For Bitcoin, network activity, large wallet flows, and regulatory headlines will likely set the tone. Some traders expect swings both ways. Others caution that when risk appetite is back, crypto may bounce hard, but that outcome is not a sure thing and will be dependent on a string of policy and macro moves.

Featured image from Unsplash, chart from TradingView

Bitcoin Large Holders Lead the Way As BTC Accumulation Picks Up, Is A Rebound Brewing?

Over the weekend, volatility observed across the broader cryptocurrency market intensified, causing the price of Bitcoin to fall back to the $86,000 mark once again. Even with the bearish price action in the past few days, buying activity continues to pick up pace in the market, especially among large BTC holders.

Bitcoin’s Largest Wallets Show Conviction

Bitcoin’s price may have been struggling with heightened volatility as a result of the broader market bearish market action, but bullish sentiment remains present among investors. In the weakening condition, large BTC whales or deep-pocket investors’ sentiment turns positive and are steadily reentering the market.

Data from Santiment, a popular market intelligence and on-chain data platform, suggests that these major investors are building positions at an encouraging and steady pace, even though the broader momentum is demonstrating weakening conditions. In the past, long-term whale accumulation has typically happened in uncertain times when prices don’t accurately reflect underlying confidence.

Santiment noted that the buying activity is spotted among wallet addresses holding over 1,000 BTC. After months of consistent buying, the group has now collectively acquired about 104,340 BTC, which represents a more than 1.5% rise. 

Bitcoin

As a result of the recent purchase, the investors’ overall holdings are currently sitting at 7.17 million BTC, marking their largest level since September 15, 2025. These wealthy investors are subtly consuming available supplies rather than distributing into recent market swings, indicating confidence in Bitcoin’s medium- to long-term potential

While buying pressure is growing among large Bitcoin holders, the number of whale transactions has also experienced a massive upswing. Santiment added that the amount of +$1 million daily transfers has exploded, reaching a 2-month high level.

A Continued Drop In BTC Open Interest

A continued drop in Bitcoin’s Open Interest is coinciding with the ongoing drop in price. Darkfost, a market expert and CryptoQuant author, highlighted that open interest is steadily declining, which does not support the emergence of a new trend as seen on the weekly change basis.

Since November, the metric has remained broadly negative, suggesting that the drop has continued for several weeks. Although there was a brief improvement earlier this month, it was followed by a price reaction. 

Overall, when open interest rises, Darkfost stated that it mostly signals trend continuation to even a trend reversal, triggered by an influx of long positions. Furthermore, this is confirmed with funding rates, but this is what happens in most cases.

On Sunday, as BTC displays a steady correction, deleveraging also increased. While this is bearish in the short term, these phases simultaneously aid in cleaning the market of excessive leverage. Thus, it is critical to remember that futures are still the primary source of volume, making keeping an eye on developments there an essential move.

Bitcoin

Bitcoin Price Prediction: Rich Dad Poor Dad Author Kiyosaki Ignores Price Crash – Here’s Why He’s More Bullish Than Ever

Bitcoin is trading near $87,700, down about 1% on the day, yet Robert Kiyosaki remains unmoved by short-term price swings. The Rich Dad Poor Dad author says he continues buying Bitcoin and Ethereum regardless of volatility, arguing that price matters less than the direction of the global financial system.

In a recent post, Kiyosaki pointed to two forces shaping his strategy: the rising US national debt, now above $38.4 trillion, and the steady erosion of the dollar’s purchasing power. From his perspective, daily price movements are a distraction.

As debt expands and deficits deepen, scarce assets gain relevance. As he put it bluntly, he does not worry about market fluctuations because “the national debt keeps going up and the purchasing power of the US dollar keeps going down.”

Q: Do I care when the price of gold silver or Bitcoin go up or down?

A: No. I do not care.

Q: Why Not?

A: Because I know the national debt of the US keeps going up and the purchasing power of the US dollar keeps going down.

Q: Why worry about the price of gold, silver,…

— Robert Kiyosaki (@theRealKiyosaki) January 23, 2026

That logic explains why Kiyosaki groups Bitcoin with gold and silver, often referring to BTC as “digital gold.” While he has long favored physical metals, he now sees Bitcoin and Ethereum as modern extensions of the same hedge against monetary dilution. His long-term outlook remains bold, with Bitcoin potentially reaching $1 million over the coming years or decade.

Institutional Credibility Weakens as Investors Seek Bitcoin Hedges

Kiyosaki’s stance reflects deep skepticism toward traditional financial authorities. He has repeatedly criticized institutions such as the Federal Reserve and the US Treasury, arguing that policy decisions have fueled debt growth rather than long-term stability.

This view aligns with a broader investor shift. As inflation pressures, rising interest costs, and geopolitical uncertainty persist, capital has increasingly moved toward assets outside the traditional financial system. Bitcoin’s fixed supply of 21 million coins, with more than 19.98 million already in circulation, continues to attract investors who see scarcity as protection rather than speculation.

Bitcoin Price Prediction: $87K Base Forms as Trendlines Hint at a Springboard Move

While the long-term narrative remains intact, Bitcoin’s short-term chart sits at a critical junction. After pulling back from the $95,500–$96,000 zone, BTC is consolidating between $86,000 and $88,000, an area where multiple technical levels converge.

On the 4-hour chart, price is pressing against the lower boundary of a descending wedge while still respecting a rising long-term support line that has guided the broader uptrend since late 2025. Recent candles near $86,100 show long lower wicks, suggesting dip-buying rather than forced liquidation.

BTC/USD Price Chart – Source: Tradingview

Momentum remains soft, with RSI hovering near 39–40, but it has begun to turn higher. A sustained hold above $88,000 would open a path toward $90,700 and $93,300, with a potential retest of $95,500. A break below $86,000 would delay that recovery and expose $84,300, without undermining the broader structure.

Taken together, Kiyosaki’s long-term conviction and Bitcoin’s developing technical base suggest the market is pausing, not peaking. For investors focused beyond short-term noise, this consolidation may be the kind of quiet reset that precedes the next expansion phase.

Bitcoin Hyper: The Next Evolution of BTC on Solana?

Bitcoin Hyper ($HYPER) is bringing a new phase to the BTC ecosystem. While BTC remains the gold standard for security, Bitcoin Hyper adds what it always lacked: Solana-level speed. The result: lightning-fast, low-cost smart contracts, decentralized apps, and even meme coin creation, all secured by Bitcoin.

Audited by Consult, the project emphasizes trust and scalability as adoption builds. And momentum is already strong. The presale has surpassed $31 million, with tokens priced at just $0.013635 before the next increase.

As Bitcoin activity climbs and demand for efficient BTC-based apps rises, Bitcoin Hyper stands out as the bridge uniting two of crypto’s biggest ecosystems. If Bitcoin built the foundation, Bitcoin Hyper could make it fast, flexible, and fun again.

Click Here to Participate in the Presale

The post Bitcoin Price Prediction: Rich Dad Poor Dad Author Kiyosaki Ignores Price Crash – Here’s Why He’s More Bullish Than Ever appeared first on Cryptonews.

Billionaire Michael Saylor’s Strategy Buys 2,932 Bitcoin for $264M

Michael Saylor’s Strategy has expanded its Bitcoin treasury again, acquiring an additional 2,932 BTC for approximately $264.1 million during the period from Jan. 20 to Jan. 25.

Strategy has acquired 2,932 BTC for ~$264.1 million at ~$90,061 per bitcoin. As of 1/25/2026, we hodl 712,647 $BTC acquired for ~$54.19 billion at ~$76,037 per bitcoin. $MSTR $STRC https://t.co/RooLfEvniX

— Michael Saylor (@saylor) January 26, 2026

The company disclosed that the purchases were made at an average price of $90,061 per Bitcoin, inclusive of fees and expenses.

The update reinforces Strategy’s position as the largest corporate holder of Bitcoin globally, continuing its multi-year accumulation strategy that has become central to its balance sheet approach.

Total Bitcoin Holdings Reach 712,647 BTC

Following the latest acquisition, Strategy reported that it now holds a total of 712,647 BTC as of Jan. 25.

The company said its aggregate Bitcoin purchases total roughly $54.19 billion, with an average acquisition price of $76,037 per Bitcoin. The figures show the scale of Strategy’s long-term bet on Bitcoin as a treasury reserve asset, accumulated across multiple market cycles.

Strategy’s growing holdings show its belief that Bitcoin represents a superior store of value over time, particularly amid concerns around currency debasement and global macro uncertainty.

Purchases Funded Through Share Sales Under ATM Program

Strategy disclosed that the recent Bitcoin purchases were funded through proceeds generated from the sale of shares under its at-the-market offering program.

During the Jan. 20–25 period, the company sold approximately 1.57 million shares of its Class A common stock, generating net proceeds of about $257 million. Strategy also issued roughly 70,201 shares of its variable rate preferred stock, raising an additional $7 million.

In total, the company generated about $264 million in net proceeds, which were then deployed toward Bitcoin accumulation.

The disclosure also shows that Strategy retains major remaining capacity for future issuances, including billions of dollars available across multiple stock and preferred equity programs.

Corporate Bitcoin Accumulation Continues Into 2026

Strategy’s continued purchases come as institutional adoption of Bitcoin remains a major theme entering 2026, with more companies exploring crypto as a long-term balance sheet asset.

The firm has consistently framed Bitcoin as a scarce, inflation-resistant reserve that can outperform cash and traditional holdings over extended time horizons. While the strategy remains controversial due to Bitcoin’s volatility, Strategy has maintained its commitment to accumulation even during periods of market weakness.

With over 712,000 BTC now on its balance sheet, Strategy’s exposure to Bitcoin price movements is unmatched among public companies, making it a key bellwether for corporate crypto adoption.

As the company continues leveraging equity issuance to fund purchases, investors will closely watch how its aggressive treasury strategy evolves alongside broader market conditions in 2026.

The post Billionaire Michael Saylor’s Strategy Buys 2,932 Bitcoin for $264M appeared first on Cryptonews.

Crypto Wallet Maker Ledger Preps $4B US IPO – Can It Win Wall Street?

Ledger is preparing for a potential U.S. initial public offering that could value the crypto wallet maker at more than $4 billion, according to reports.

The Paris-based company has enlisted major Wall Street banks, including Goldman Sachs, Jefferies, and Barclays, to advise on the deal, with a potential listing later this year.

The move comes as Ledger increases its presence in the U.S., where capital markets activity and institutional interest in digital asset firms are especially concentrated in New York.

❗@Ledger eyes U.S. IPO at a $4B+ valuation: @FT

Hardware #wallet maker #Ledger is preparing for a potential U.S. #IPO, reportedly working with Goldman Sachs, Jefferies, and Barclays on the deal, which could take place as early as this year pic.twitter.com/hjJQcnXxfh

— Charged Ventures (@ChargedVentures) January 23, 2026

Wall Street Banks Line Up for Ledger’s IPO Push

Ledger’s IPO ambitions reflect a belief that it has reached sufficient scale to withstand public-market scrutiny from Wall Street.

In an earlier interview, CEO Pascal Gauthier said the company had grown to a point where a listing was realistic, adding that the U.S. stood out as the natural venue.

Roughly 40% of Ledger’s business now comes from North America, a figure that has shaped both its listing strategy and operational expansion in New York.

Ledger US IPO - Regional Insights 2025 map
Source: Coherent Market Insights

Gauthier has also said the firm is weighing a U.S. IPO alongside a potential private funding round, keeping multiple capital-raising paths open.

“Money is in New York today for crypto, it’s nowhere else in the world, certainly not in Europe,” Gauthier told the Financial Times.

He reiterated that view in November 2025 when the company first flagged the IPO plans, emphasizing that his increased time in New York was driven by where crypto financing is now concentrated.

From Nano Wallets to Triple-Digit Millions in Revenue

Founded in 2014 by Éric Larchevêque, Joël Pobeda, and Thomas France, Ledger built its reputation on hardware wallets designed to keep private keys offline.

Its early success came from the Ledger Nano series, which gained traction as hacks and exchange failures highlighted the risks of custodial storage.

The company has since broadened its product lineup, launching the Ledger Stax, a touchscreen device aimed at long-term holders and institutional users.

It has also rolled out an iOS app for enterprise clients and recently completed a major rebranding alongside the release of the Ledger Nano Gen5.

Ledger said its revenues reached triple-digit millions in 2025, marking its strongest performance to date, with further growth expected this year.

Over the past decade, the firm estimates it has sold more than seven million devices globally and now safeguards around 20% of global crypto assets, including over $100 billion worth of bitcoin.

Potential Ledger IPO closing market cap?

– raised $3m in 2019, $380m in 2021, $109m at $1.4b in Mar 2023
– seeking $4b valuation in IPO (~3x valuation from last raise)

currently the liquidity for this market on @Polymarket is limited, though interesting to see how high it goes… https://t.co/Pmv5JIR4XA pic.twitter.com/k5G6UGHf9E

— cs_defier (@cs_defier) January 23, 2026

The company was last valued at $1.5 billion in 2023 after raising a $108 million extension to its Series C round, bringing total funding in that round close to $500 million.

While Ledger has since said its valuation has increased, it has not disclosed an updated figure ahead of the reported IPO preparations.

Fees, Data Exposure, and the Self-Custody Debate

As Ledger expands beyond pure hardware, it has reframed its devices as “Ledger signers,” positioning them as tools for securing digital assets and online identities in an AI-driven environment.

That shift has not been without controversy, particularly around new monetization features.

Last October, Ledger revealed that its Multisig app would charge a flat $10 fee per transaction, excluding token transfers, which would instead incur a 0.05% variable fee.

😡 @Ledger’s new Multisig app sparked backlash for adding a $10 flat fee per transaction and a 0.05% token transfer fee, on top of gas costs.#Ledger #Cryptohttps://t.co/b72bb5ZwXw

— Cryptonews.com (@cryptonews) October 26, 2025

The charges are applied on top of standard blockchain gas fees, prompting backlash from users who argue that self-custody should not come with recurring platform costs.

Security concerns have also resurfaced following a recent data exposure incident involving a third-party provider.

On January 5, 2026, blockchain researcher ZachXBT said personal information of Ledger customers was accessed in a hack on Global-e, a payment processor used by the company.

While no funds were compromised, researchers warned that the exposure heightens the risk of phishing and social engineering attacks.

The post Crypto Wallet Maker Ledger Preps $4B US IPO – Can It Win Wall Street? appeared first on Cryptonews.

XRM could dip below the January low of $413: Check forecast

Key takeaways

  • Monero is down 4.5% in the last 24 hours and risks dropping below the January low.
  • The coin has lost 42% of its value since hitting an all-time high price of $798 twelve days ago.

XMR continues to decline as the market remains bearish

XMR, the native coin of the Monero blockchain, is one of the worst performers among the top 20 cryptocurrencies by market cap in the last 24 hours. It has lost 4.5% since Sunday and now trades below $460.

The bearish performance comes as the broader cryptocurrency market continues to underperform. XMR defied market conditions in December and early January, rallying to a new all-time high of $798 on January 14.

Its rally was fueled by growing demand for privacy-focused cryptocurrencies, with DASH, ZEC, and ZCash also rallying during that period.

However, the rally has died, and XMR has lost 42% of its value since then. It is currently trading at $459 and risks dropping below the January low of $413 if the bearish trend continues. 

Monero could dip below the 100-day EMA support

The XMR/USD 4-hour chart is bearish and efficient as it has lost 42% in the last two weeks, suggesting reduced demand for the privacy coin.

Currently, XMR is hovering above $450, stabilizing above the 100-day EMA at $437, after a 10% drop on Sunday. 

If the bearish trend continues, XMR could drop below the January low of $413, wth the 200-day EMA at $383 still the primary trend floor. 

XMR/USD4H Chart

The MACD line stays below the signal with both falling toward the zero line, flagging firm bearish momentum. Furthermore, the RSI at 32 indicates a bearish shift as sellers retain the near-term edge without oversold conditions. 

On the flip side, if the bulls regain control, XMR could rally above the 50-day EMA at $485, clearing the path for further pump above $500.

The post XRM could dip below the January low of $413: Check forecast appeared first on CoinJournal.

Metaplanet boosts forecasts despite Bitcoin write-down clouding annual results

  • The company lifted its 2025 operating income guidance to $40 million.
  • A non-cash Bitcoin impairment of $680 million to $700 million is expected for 2025.
  • Metaplanet projected a $632 million ordinary loss and $491 million net loss for 2025.

Metaplanet, a Tokyo-listed Bitcoin treasury company, has raised its revenue and operating income forecasts for 2025 and issued much higher guidance for 2026, even as it flagged a large non-cash Bitcoin write-down that is set to dominate its annual results.

In a notice released on Monday, the company said its Bitcoin income generation business is expected to deliver stronger-than-expected performance, particularly in the final quarter of the year.

However, Metaplanet also projected a steep ordinary loss and net loss for 2025, driven largely by accounting adjustments tied to Bitcoin’s valuation at year-end.

The company is scheduled to file its full-year results on Feb. 16.

Revenue upgrade driven by Bitcoin income generation

Metaplanet said it now expects 2025 revenue of 8.905 billion Japanese yen, or around $58 million, based on its updated guidance.

The company also raised its operating income forecast to $40 million, signalling improved performance at the operating level despite broader market volatility affecting its holdings.

Management said Q4 2025 revenue from its Bitcoin income generation business “is expected to significantly exceed initial projections,” which led it to lift full-year revenue guidance for that segment to about $55 million.

That compares with around $40 million previously announced, showing a sharp upgrade in the contribution from its Bitcoin-linked revenue stream.

Large impairment set to drive headline loss

Even with the stronger operating forecasts, Metaplanet expects to report a deep annual loss for 2025.

The company projected an ordinary loss of $632 million and a net loss of $491 million. These figures are largely attributed to a Bitcoin impairment loss estimated at roughly $680 million to $700 million, which is expected to be recognised in its year-end reporting.

Metaplanet explained that the impairment is a “non-cash accounting adjustment reflecting period-end price fluctuations” and said it has no direct impact on its cash flows or day-to-day operations.

The notice linked the impairment to quarter-end mark-to-market accounting treatment and referenced Bitcoin holdings valued at year-end prices, with Bitcoin shown at $87,876 in the disclosure.

BTC holdings and treasury metrics expand sharply

Metaplanet also reported rapid growth in its Bitcoin treasury business during 2025, underlining how the company has built up its exposure to Bitcoin while developing income generation activities around its holdings.

BTC holdings rose from 1,762 BTC at the end of 2024 to 35,102 BTC at the end of 2025, showing a significant increase in the company’s balance sheet allocation.

It also reported BTC yield per diluted share of 568% for the year. The company uses this metric to measure how much Bitcoin backing each diluted share has increased, offering a per-share view of its Bitcoin accumulation.

While the impairment is expected to weigh heavily on reported net results, Metaplanet’s updated figures suggest it is still expanding its treasury position and Bitcoin-linked operations at a pace.

2026 guidance rises but earnings remain uncertain

For 2026, Metaplanet forecast revenue of around $103 million and operating income of $73 million, representing a sharp step up from its 2025 targets.

The company said almost all of its 2026 revenue is expected to come from the Bitcoin income generation business, reinforcing the segment’s central role in its business model.

Metaplanet also projected selling, general and administrative expenses of about $29 million for 2026 as it ramps up operations.

However, it said it will not provide guidance for ordinary income or net income for 2026 due to the difficulty of forecasting Bitcoin prices, signalling that future reported earnings could remain volatile even if operating performance strengthens.

The company added that it publishes daily data on its BTC holdings, unrealised gains and losses, and related metrics, offering investors regular visibility into how price swings affect its treasury position.

The post Metaplanet boosts forecasts despite Bitcoin write-down clouding annual results appeared first on CoinJournal.

Zilliqa (ZIL) price slides amid exchange delistings and supply update

  • Zilliqa price drops 3.6%, extending a 7-day downtrend amid weak market sentiment.
  • Binance delisting and Upbit supply increase reduce liquidity and add pressure.
  • Technicals show ZIL below key EMAs with RSI near oversold levels.

Zilliqa (ZIL) has seen a sharp dip in its price over the past 24 hours.

The token is currently trading at $0.004822, down 3.6%, underperforming the broader cryptocurrency market, which fell by 0.9%.

This decline extends a seven-day downtrend of approximately 7.75%, signalling sustained bearish sentiment.

Exchange delistings and market liquidity

One of the main drivers behind ZIL’s recent weakness is exchange delistings.

On January 23, 2026, Binance removed the ZIL/BTC spot trading pair as part of its market quality optimisation.

This followed a prior delisting of the ZIL/BTC margin pair in June 2025.

Delisting reduces liquidity and arbitrage opportunities for traders.

It also signals declining exchange support, often prompting sell-offs as market participants adjust their positions.

With fewer direct BTC and ETH trading pairs, ZIL now relies heavily on USD-stable pairs like ZIL/USDT for trading volume.

Traders are closely watching whether liquidity consolidates or further fragments on these remaining pairs.

Supply update adds to the downward pressure

Another factor influencing ZIL’s decline is a recent circulating supply update.

Upbit reported an increase of 443,195,861 ZIL in the first quarter of 2025.

This adjustment raised the circulating supply from roughly 19.905 billion to 20.349 billion ZIL.

The increase, representing about 2.2% of the quarterly supply, reflects staking rewards, protocol inflation, and team token unlocks.

A larger supply can dilute the value of each token if demand does not increase proportionally.

Public confirmation of the supply increase often renews focus on potential sell-side pressure, especially during periods of market weakness.

Combined with reduced exchange liquidity, the supply update has amplified bearish sentiment among traders.

ZIL technical analysis

Technical indicators further reinforce ZIL’s short-term bearish trend.

The token is trading below all major exponential moving averages on the daily chart.

Its 7-day simple moving average sits at $0.00497, while the 30-day SMA is at $0.00519, both above the current price.

The 14-day relative strength index (RSI) is 38.37, suggesting that the token is approaching oversold conditions.

Zilliqa price analysis
Zilliqa price chart | Source: TradingView

Meanwhile, the weekly RSI stands at 47.00, indicating neutral market conditions.

The MACD histogram is negative at –0.000095, confirming continued bearish momentum.

These technical signals suggest that selling pressure remains, although short-term consolidation could occur due to the oversold conditions.

Zilliqa price forecast

Traders should keep a close eye on key support and resistance levels in the coming days.

The immediate support is near the recent swing low of $0.0045846, which may act as a floor for further declines, according to analysts.

On the upside, the first significant resistance is at $0.0669, a level that ZIL must close above to trigger a potential trend reversal.

Market participants should also monitor trading volumes on remaining pairs to gauge whether the sell-off is stabilising.

Short-term price action will likely be influenced by liquidity trends, supply dynamics, and technical momentum.

Until a bullish catalyst emerges, ZIL may continue to face pressure, with consolidation around current levels being the most probable scenario.

The post Zilliqa (ZIL) price slides amid exchange delistings and supply update appeared first on CoinJournal.

❌