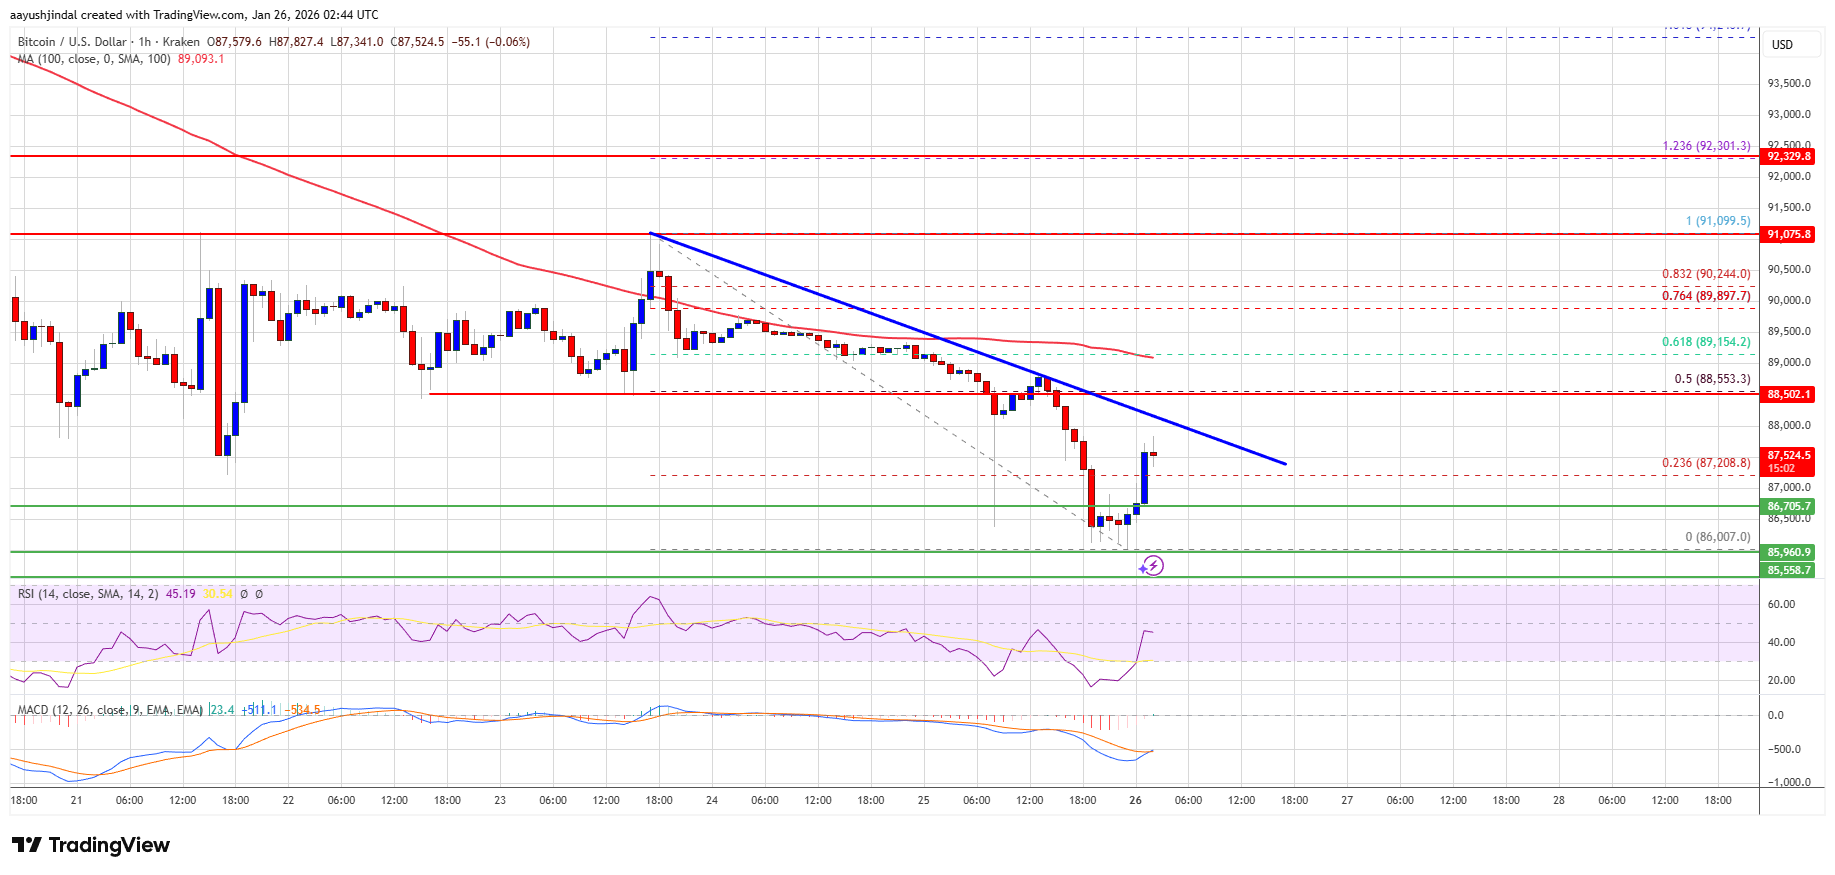
[LIVE] Crypto News Today: Latest Updates for Jan. 26, 2026 – BTC Slumps 11% From Monthly High Below $87K Amid Market Wide Slump
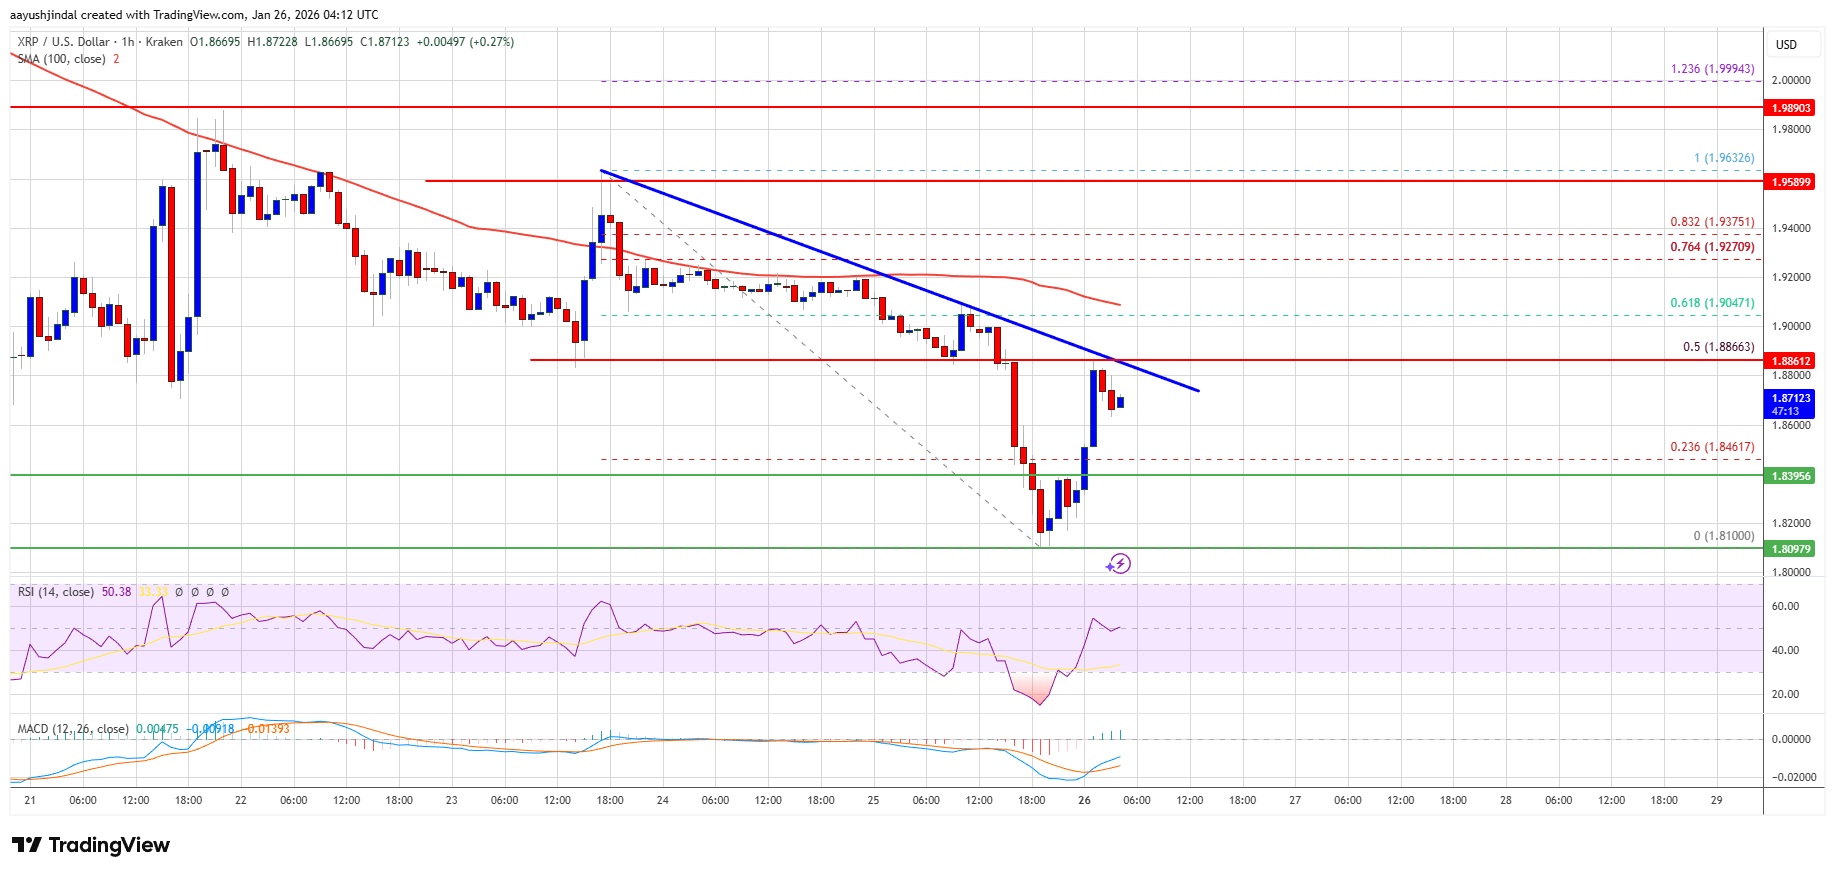
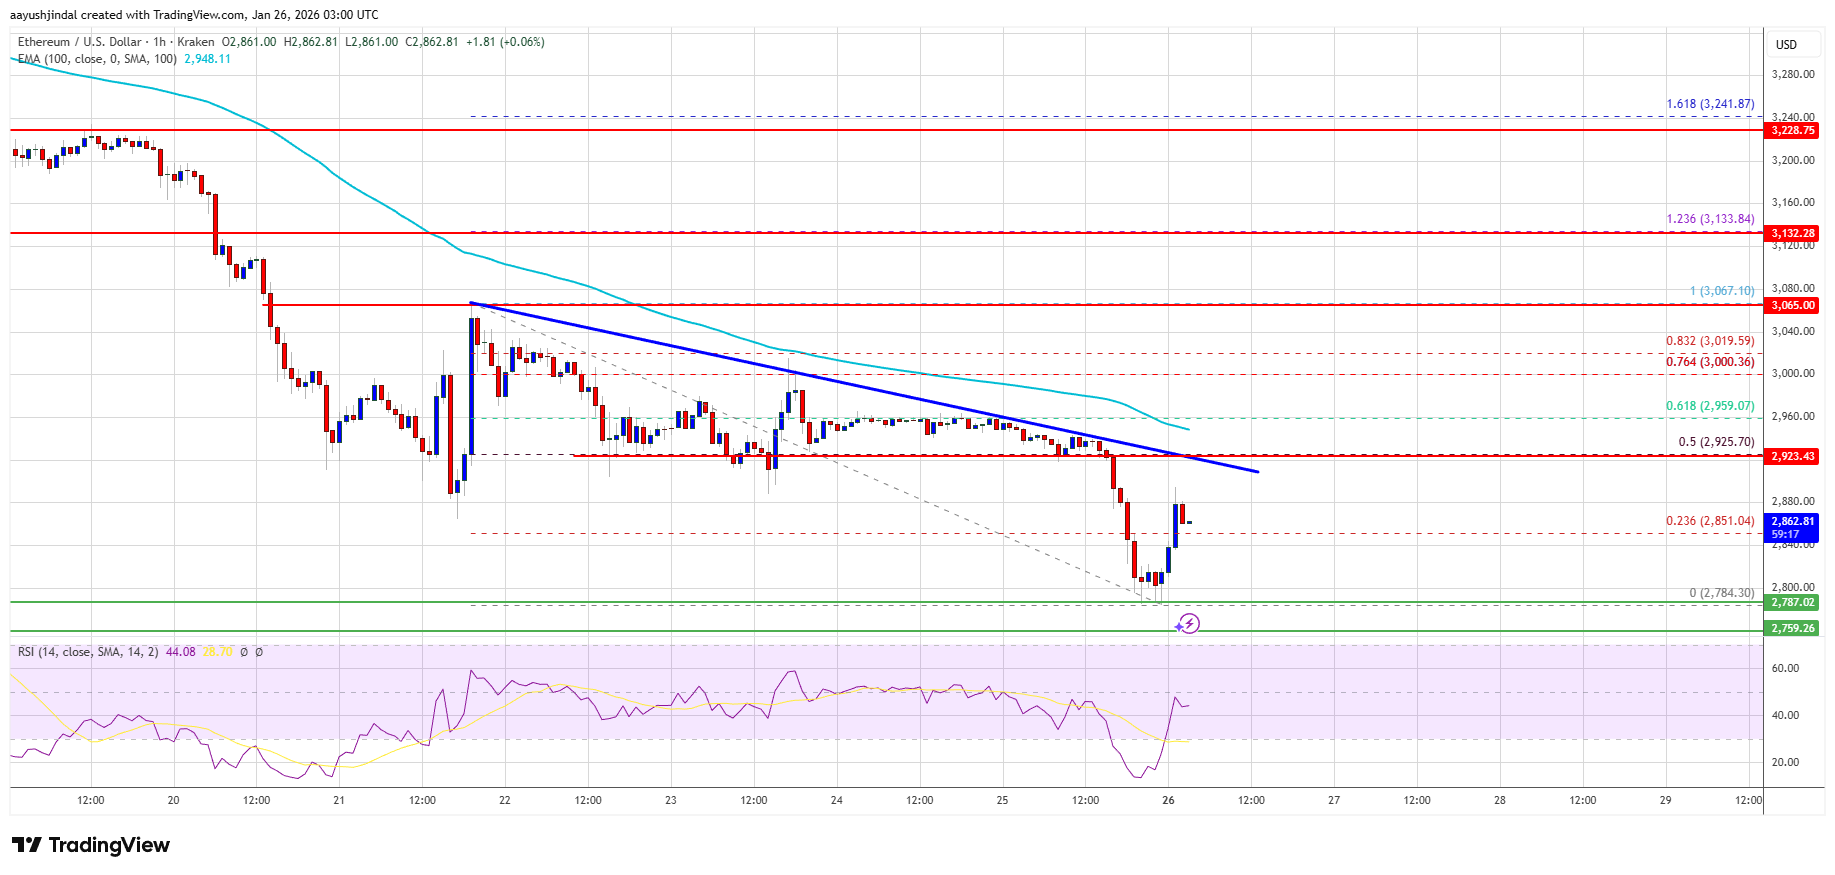
The cryptocurrency market faced a sharp correction in the early hours of January 26, with BTC erasing its entire monthly progress. After peaking at $97,000 on January 14, Bitcoin slid approximately 10.9% to briefly dip below the $87,000 mark. This volatility has pushed the January return to -0.5%, reflecting a broader “risk-off” sentiment across the digital asset space. The pullback is being attributed largely to rising uncertainty around U.S. government shutdown, alongside broader risk-off sentiment across global markets.The GameFi sector bore the brunt of the sell-off, dropping nearly 5%, led by double-digit losses in Axie Infinity (AXS). While Ethereum fell below $2,900, some assets showed resilience; notably, River (RIVER) surged 30% and Beam (BEAM) rose 19%, suggesting that despite the macro-level decline, specific project catalysts continue to drive isolated pockets of growth.
But what else is happening in crypto news today? Follow our up-to-date live coverage below.
The post [LIVE] Crypto News Today: Latest Updates for Jan. 26, 2026 – BTC Slumps 11% From Monthly High Below $87K Amid Market Wide Slump appeared first on Cryptonews.


 En primicia, Valora Analitik conoció que Protección se prepara para lanzar desde Colombia un fondo con exposición a Bitcoin. El producto no estará enfocado en la especulación de corto plazo, sino en ampliar las opciones de diversificación con una gestión integral de riesgos y…