Ether supply squeeze looms with exchanges holding lowest levels since 2015

Ether exchange balances dropped to a decade low of 8.7% as more ETH moved into staking and custody, setting up a potential supply squeeze.
Ether exchange balances dropped to a decade low of 8.7% as more ETH moved into staking and custody, setting up a potential supply squeeze.
The MiCA implementation has enhanced regulatory clarity, boosting euro stablecoin adoption and potentially stabilizing the crypto market.
The post Euro stablecoins double in market cap post-MiCA implementation, led by EURS and EURC: Report appeared first on Crypto Briefing.

The narrative around XRP has definitively moved past the era of pure retail speculation. While the global financial system is accelerating its transition to real-time settlement, XRP is emerging as a contender for enterprise-level treasury flows. As Ripple’s institutional network continues to expand, the altcoin is stepping into a role where digital assets can enhance liquidity management and power the next generation of global value transfer.
The bearish view of XRP is clouding the bigger transformation happening behind the scenes. Analyst Xfinancebull has mentioned on X that XRP is embedding itself into the financial engines where global treasury systems teams move trillions. With the GTreasury acquisition, Ripple gains access to the operational layer where $12.5 trillion in enterprise liquidity flows.
This is about the altcoin becoming a native rail inside the financial command centers of over 1,000 multinational giants where trillions move. Treasury teams move real money, not just $100 payments, but payroll, supply chain financing, and liquidity management across continents.
The XRP niche is that it moves trillions fast, 24/7, across borders. Meanwhile, Ripple now controls the infrastructure platform that interacts with BNY Mellon to move trillions and automates finance at scale.
According to Xfinancebull, the token goes from a speculative asset to invisible plumbing. This shift doesn’t make the front-page headlines, but it moves everything behind them. Most analysts won’t notice that this has unlocked the token to become a standard settlement rail in the GTreasury automation stack, making its utility broader, invisible, and massive.
Founder of Lux Lions NFT and host of the crypto Blitz YouTube show, RipBullWinkle, stated that the Federal Reserve has officially halted its Quantitative Tightening (QT) measures, ending the two-year liquidity drain that weighed down the entire crypto sector.
Vanguard, the world’s second-largest asset manager with $11 trillion in AUM, has reversed course and will now allow clients to have access to the regulated crypto ETFs. This single move clears the path for trillions in passive capital, a macro environment of liquidity, compliance, and global settlement that XRP is engineered for.
While the crypto market has been struggling to find its footing, an observer and researcher of the current tech shift, SMQKE, has noted that WisdomTree data shows that XRP is the only major cryptocurrency posting positive year-to-date returns in 2025. On a year-to-date basis, where the broader markets were pulling back, the altcoin has stood out as the lone performer, holding onto a modest +4% gain year-to-date.
In a challenging year for most large-cap digital assets, it has emerged as the top-tier asset with a positive year-to-date performance. Even after experiencing drawdowns in line with the broader market during Q4, XRP has demonstrated remarkable relative resilience and remains up +4% YTD and +12% over the past 12 months.


ETF expert Eric Balchunas argued Bitcoin's 17-year track record and multiple recoveries make tulip mania comparisons obsolete despite recent criticism.
Ethereum's significant inflows highlight its growing dominance and potential to drive broader blockchain adoption and innovation in digital finance.
The post Ethereum tops 24-hour net inflows with $138.7M: Artemis appeared first on Crypto Briefing.

Bitcoin finds itself at a critical crossroads, hovering between two major price zones that could define its next big move. Buyers and sellers are locked in a tight battle, and the market now waits for a decisive break. A push above key resistance could open the door to $107,000, while weakness at support risks a deeper slide toward $71,000.
Kamile Uray, in her latest update on Bitcoin, noted that BTC failed to hold above the $90,720 level on the hourly chart, triggering the expected decline. The first immediate support now sits at $87,644, while the deeper support range lies between $83,822 and $82,477. If buyers defend this zone successfully, Bitcoin could attempt another climb toward the pink box region and retest the descending trendline overhead.
Uray explained that a sustained move above the pink box resistance on the daily timeframe would open the door for Bitcoin to challenge the descending blue trendline. A confirmed breakout from this area could strengthen bullish momentum, pushing the price toward the next major resistance levels at $98,200 and $107,500. A break above $107,500 alongside the descending trendline would serve as a strong signal that the broader uptrend is ready to continue.

However, she warned that a daily close below $82,477 would shift the market structure toward further weakness, placing Bitcoin at risk of revisiting lower levels. Even so, Uray highlighted one critical area of strength: the $74,496–$71,237 zone. This region represents the key breakout top from November 2024 and is considered a strong historical support. In this area, buyers may step in aggressively, potentially setting the stage for an upward reversal.
According to Crypto Candy, Bitcoin’s latest price action has been unfolding precisely in line with expectations. After facing rejection in the $93,000–$95,000 resistance zone, BTC dipped sharply and nearly touched the anticipated support range at $86,000–$87,500. This move reflects the broader market’s reaction to heavy selling pressure near the upper resistance band.
Crypto Candy emphasized that the $86,000–$87,500 zone now serves as a crucial pivot area. If buyers successfully defend this support and the price stabilizes above it, Bitcoin could once again revisit the $93,000–$95,000 range, or even push beyond it.
Such a rebound would signal renewed bullish momentum and set the stage for another attempt at breaking higher resistance levels. However, the analyst also warned that failure to hold the $86,000–$87,500 support could trigger deeper downside movement. If the level gives way, Bitcoin may slide to lower price zones in the coming days as bearish pressure strengthens.


Bitcoin’s liveliness indicator reached new peaks, suggesting strong demand despite lower prices and signaling the bull market cycle may not be over yet.
Jake Claver, CEO of Digital Ascension Group, says ultra-wealthy families are rapidly accumulating XRP, and he believes most XRP holders still don’t realize how rare their position is. In a video posted on X, Claver revealed that his firm has been in recent conversations with large family offices that are now making significant allocations into XRP.
His comments arrive at a moment when XRP’s long-term narrative is witnessing increased interest due to ETFs, and they highlight a shift happening among investors who have always avoided cryptocurrencies altogether.
Claver explained that XRP ownership is currently extremely limited relative to the global population, noting that only around 8 million wallets exist on the XRPL. Half of those wallets contain fewer than 100 XRP, which makes existing holders far more uncommon than they may think. He contrasted this with Bitcoin’s widespread ownership, arguing that XRP is still early in its adoption curve.
He said the wealthy families showing interest are not looking for quick profits. According to him, they have already built their fortunes and instead see XRP as a form of insurance. According to his post, these families are buying crypto, not to get richer, but to protect the wealth they already have.
He described their interest in cryptocurrencies as a hedge. These investors want something uncorrelated in their portfolios ahead of any potential shock in traditional markets.
When asked where he sees the price of XRP going, Claver stated that he believes the cryptocurrency could be trading at $10,000 by late 2026 or early 2027. He tied this prediction to how much ecosystem infrastructure becomes active on the XRPL over the next two years.
He said the network would need substantial institutional-grade utilities, including XRP treasury systems, Evernorth’s launch, on-chain borrowing mechanisms, and new amendments to the XRP Ledger that will bring in additional compliance layers and smart-contract features.
His projection assumes that rising network volume will require higher liquidity levels and that price stability at four- and five-figure ranges will only be achievable if the ledger is handling large-scale financial flows. He also pointed to ETFs as a major factor in shaping supply and demand, noting that as ETF adoption grows, more XRP will be locked away in long-term institutional products.
Speaking of ETFs, Spot XRP ETFs are now approaching $1 billion in total net assets and could cross that threshold within the next few days. Since their debut, these funds have taken in about $897.35 million worth of XRP from exchanges and OTC desks, and they have yet to record a single day of outflows.
This growing demand ties directly into a quiet change happening among institutions, a trend Ripple’s CEO Brad Garlinghouse recently highlighted. He explained that Ripple is seeing notable activity through Ripple Prime, where long-watching institutions that once stayed out due to regulatory uncertainty or simple risk aversion are finally beginning to step in.
Featured image from Unsplash, chart from TradingView

A crypto analyst has predicted another devastating Bitcoin price crash that could see the leading cryptocurrency slide back below $85,000. With its weak performance over the past few months and price action showing signs of exhaustion, the analyst has predicted that the next major support level lies more than 33% below all-time highs.
TradingView crypto expert ‘EliteGoldAnalysis’ has released a fresh chart study on Bitcoin’s next selling move, warning that the cryptocurrency’s downtrend may not be over yet. The analyst’s breakdown highlights a key support level he believes Bitcoin could crash to if its current downward momentum persists.
EliteGoldAnalysis outlines a price structure on the chart that begins with a weak high, a technical condition that often reflects a liquidity grab before a reversal. The appearance of a weak high near the top of Bitcoin’s most recent rally indicates that buyers may have been swept out before the momentum fully shifted. This pattern is accompanied by a steadily forming lower high, hinting at a developing bearish structure.

From his perspective, the analyst explains that a short bias becomes relevant only after a clear confirmation of a bearish trend. Based on the Bitcoin price chart, such confirmation could include a break of minor support beneath the weak high, followed by a retest of that level. EliteGoldAnalysis also noted that a bearish rejection through wick actions or a strong bearish close would strengthen the case for a temporary Bitcoin price crash.
While the analyst’s breakdown is just an interpretation of the chart rather than a trading call, Bitcoin’s price structure still hints at a possible retracement amid strengthening sell-side pressure.
In his TradingView chart, EliteGoldAnalysis outlined critical zones that could dictate Bitcoin’s next bearish moves. The first region to watch is the potential “target level” marked in the purple zone above $85,000. The analyst views this level as a demand or imbalance area. Should Bitcoin reach and hold this target, it may act as the first checkpoint before the market decides whether to correct downwards or push higher.
Just beneath the $85,000 region lies a “strong support level” highlighted in blue at $84,000 on the chart. EliteGoldAnalysis predicts that Bitcoin could decline to as low as this $84,000 support area. The analyst suggests that this level is the final retracement target, potentially representing a significant liquidity pool that could attract buyers if the price declines.
A decisive drop toward this level would reflect a more than 6% decline from current levels above $89,000. Such a move would also mark the completion of the downside move implied by the chart structure. Over the past 24 hours, the price of Bitcoin has fallen roughly 3%, meaning a crash to $84,000 would further prolong the ongoing downtrend.
Featured image from Unsplash, chart from TradingView

The Bitcoin market structure is believed to have undergone a massive shift since the significant price downturn seen on October 10, 2025. While the premier cryptocurrency has been on something resembling a recovery path since the market bloodbath, some sectors believe that the bear season has already kicked off.
With BTC sitting beneath its opening price of 2025, it is becoming increasingly difficult to make a bullish case for the world’s largest cryptocurrency. Moreover, an interesting data point about a relevant class of Bitcoin investors has emerged, further adding credence to the beginning of a possible bear market.
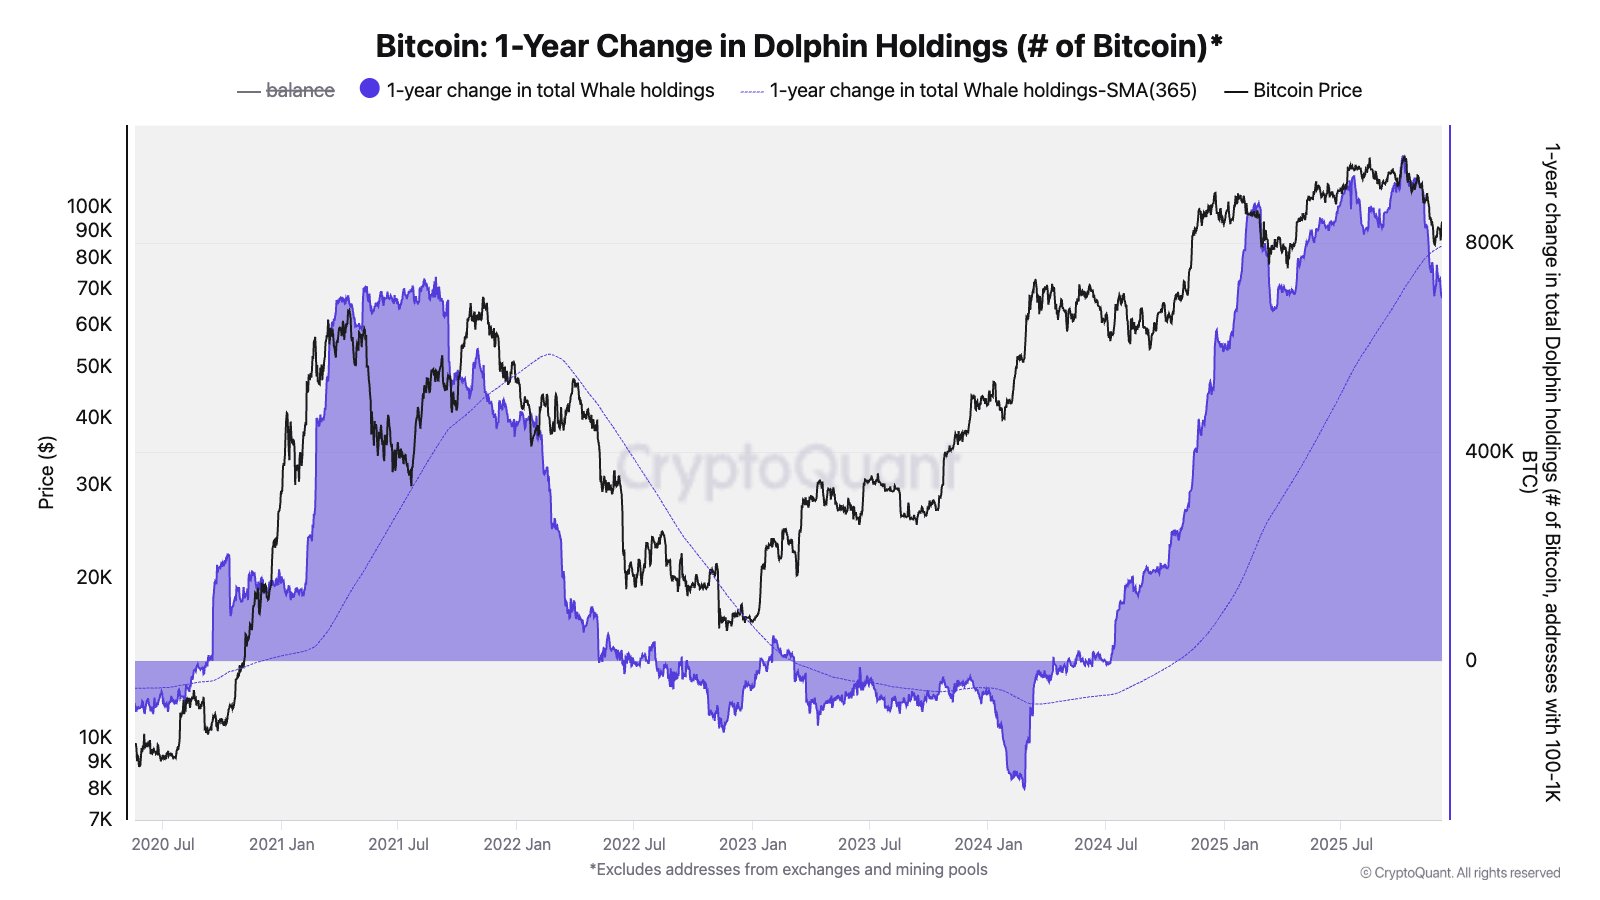
In a new post on X, CryptoQuant’s Head of Research, Julio Moreno, shared an on-chain insight to support the hypothesis that the Bitcoin bear market has started. This conclusion is based on the Balance Growth of an investor group known as the “dolphins.”
Dolphins refer to a group of crypto investors holding substantial amounts of a coin, placing them between small investors (shrimps) and the largest investors (whales). Specifically, Moreno described dolphins as wallet addresses with significant BTC holdings between 100 – 1,000 coins.
According to the latest data from CryptoQuant, the growth in the Dolphins’ BTC holdings has slowed down in the past year and appears to be in a downward trend. Moreno believes that this negative change points to the emergence of a Bitcoin bear market.
Moreno revealed that these Dolphin addresses had increased year-over-year by roughly 965,000 BTC when the BTC price hit its current all-time high around $125,000. Now that the BTC price is nearly 30% below its record high, the Bitcoin Dolphins’ balance stands at around 694,000 coins.
Moreno wrote on X:
This address cohort includes ETFs and Treasury companies, which have also stopped buying.
More interestingly, the CryptoQuant Head of Research revealed that this investor group consists of ETF issuers and Treasury companies, which have stopped purchasing Bitcoin. According to data from SoSoValue, the US-based Bitcoin exchange-traded funds have posted net outflows in five out of the last six weeks.
Meanwhile, BTC and crypto treasury companies have struggled in the past few months, with retail investors losing tens of billions to the hype. While there have been rarely reports of crypto treasury sell-offs, this decline in these Dolphins’ holdings tells an entirely different story.
As of this writing, the price of BTC stands at around $89,151, reflecting an over 3% decline in the past 24 hours.

Ethereum is gaining momentum, and several technical signals suggest that a significant move could be on the way. With key support levels holding and bullish patterns forming, the market may be setting up for a notable upside.
In a recent update on X, analyst Luca referenced his recent market commentary, noting that Ethereum price action unfolded exactly as he had anticipated, with the price tapping into the lost high-timeframe support range. This range aligned with the golden pocket between the 0.5 and 0.618 Fibonacci retracement levels, and the price rejected there, confirming the high-risk scenario he had highlighted in advance.
Since that rejection, the price has broken below the key 0.618 Fibonacci Point of Interest (POI). However, the asset is still managing to hold above the crucial 1-Day Bull Market Support Band. Luca stressed that this band has historically served as a strong reversal spot over the last couple of months. Thus, he believes the current low-timeframe market structure is not yet fully invalidated.

Despite this technical hold, the analyst reiterated his cautious approach, stating that until he sees clear signs of strength on the low-timeframes, signs that can durably confirm the bottom is in and that key support levels are properly reclaimed, he won’t scale out of his edges.
Luca concluded that until that concrete bullish confirmation materializes, the most likely outcome for the immediate future remains further consolidation. The market needs time to absorb the recent volatility and build a new base before a more durable reversal to the upside can take hold.
Crypto analyst Paramatik outlined that a major structural event has occurred on the ETH/BTC charts: a falling trend breakout. This is a highly significant development, although Paramatik suggests that a retest of this broken trendline may occur before the upcoming Federal Reserve meeting.
The analyst provided clarity on what this breakout means for the broader market. First and foremost, this situation is interpreted as a strengthening signal for Ethereum. When ETH begins to gain value relative to Bitcoin, it typically indicates that the market’s overall risk appetite is returning, as investors shift capital from BTC to ETH.
Secondly, the gained strength in Ethereum is often the key trigger for the start of the much-anticipated altcoin season. This is because investors first shift funds from BTC to ETH, and then move capital into the riskier, smaller altcoins in hopes of achieving higher returns.
Paramatik summarized his findings by stating that this breakout in the ETH/BTC pair is not merely a technical line break; it is a harbinger of a market direction change. The analyst concluded with an analogy that the market has reached a state where every external event, even humorously irrelevant ones, could affect crypto prices.

According to remarks made at the Founders Summit, Fidelity’s chief executive Abigail Johnson offered a rare look at how the firm moved from curiosity to a full crypto business and why she keeps a personal stake in Bitcoin. The account ties early, small bets to later services now offered to advisors and clients.
Around 2013, a small group inside Fidelity began meeting to learn what Bitcoin might mean for the firm. They mapped out 52 possible uses. Most ideas did not survive testing. One early result — accepting Bitcoin donations for charity — gave the team credibility outside the company and opened doors for deeper work.
That early credibility made it easier for the firm to test bigger ideas without waiting for orders from the top.
Johnson pushed for a $200,000 purchase of Antminer hardware at a time many inside opposed the move. Reports say that mining effort became “probably the single highest IRR business” Fidelity has had.
The decision put staff into Bitcoin’s technical layers, giving them real experience with wallets, security, and the plumbing of the network long before many rivals caught up.
Company Moves Into CustodyBased on reports, demand from financial advisors drove Fidelity toward custody services. Advisors wanted secure ways to help clients hold and pass on Bitcoin, and Fidelity responded by building custody, custody-adjacent products, and support across asset management and research.
Johnson told the audience she owns Bitcoin personally and described it as a core digital asset that could play a role in people’s savings plans. She calls it crypto’s “gold standard.”
Exchange Supply Drops As Accumulation ContinuesMarket data referenced in the session showed Bitcoin trading above $89,000 while balances on centralized exchanges fell to roughly 1.8 million BTC — a level not seen since 2017, according to aggregated CryptoQuant and Glassnode figures cited by BRN Research.
Realized-cap growth stayed positive on a monthly basis, which analysts interpret as fresh capital entering the market even when price moves stay contained.
Shark Wallets And Network Growth For EthereumReports also pointed to Ethereum strength. ETH climbed past $3,200 as so-called shark wallets holding between 1,000 and 10,000 ETH resumed accumulation.
Daily new addresses briefly neared 190,000 following the Fusaka upgrade, a spike that analysts say often lines up with stronger demand for ETH.
Market Signals And What’s MissingAnalysts quoted in the briefing noted that supply leaving exchanges and steady accumulation point to longer-term holders taking control. What the market lacks, they said, is a decisive push into the roughly $96K to $106K band that would signal a broader breakout. For now, accumulation continues while prices trade in a tighter range.
Based on reports from the conference, Fidelity’s crypto path reads like a slow build: small internal experiments grew into real operations, and a handful of early bets — including a $200,000 mining play — gave the firm practical know-how.
Combined with current on-chain signs of accumulation, the picture suggests established players and patient holders are shaping market supply even as price momentum waits for a clearer trigger.
Featured image from Pexels, chart from TradingView


The largest corporate Ether holder continues to buy the dip, as the industry’s most profitable traders continue to bet millions on ETH’s short-term decline.
According to the latest report, the lower house of Poland’s parliament has failed to overturn the President’s veto of the Crypto-Asset Market Act. Earlier this week, the Polish President, Karol Nawrocki, vetoed a bill aimed at setting strict rules in the country’s digital assets market.
On Friday, December 5, Bloomberg reported that the lower house of the Polish parliament couldn’t secure the required three-fifths majority vote to override the President’s veto of the Crypto-Asset Market Act. This bill, introduced in June 2025, aimed to align Poland with the European Union’s MiCA framework for the digital asset markets.
Related Reading: Key Updates On The US Crypto Market Structure Bill: What You Need To Know
However, President Nawrocki decided against signing the crypto market legislation due to concerns that it may pose a real threat to the freedom of Poles, their property, and the stability of the country. According to the country’s leader, “overregulation” is one way to drive away new companies and investors, while seriously slowing innovation.
As Bitcoinist earlier reported, the crypto community in Poland had already raised concerns about the regulation as early as September, especially as the bill surpassed the European Union (EU) minimum regulatory requirements.
For instance, the bill’s messaging read that all Crypto Asset Service Providers are required to obtain a license from the Polish Financial Service Authority (KNF). Meanwhile, the bill proposed heavy fines and potential prison time for market participants who break the law.
According to the Bloomberg report, supporters of the bill have also voiced out the need to provide regulatory oversight of Poland’s digital assets industry. Their belief is that clear, comprehensive rules are critical to fight fraud and avoid potential misuse of digital assets by bad actors.
Rafael Leskiewicz, the press secretary of the President, took to the social media platform to react to the lawmakers’ failure to override the veto. The presidential spokesperson said the Crypto-Asset Market Act is a legal fiasco, while calling the attempt to overturn the president’s veto a political maneuver.
Leskiewicz said in a statement:
The President, by vetoing this act, exposed the low quality of the legislation being created. This market should be subject to monitoring and control, but certainly, bad law should not be created that restricts the freedom to conduct business activities.
President Nawrocki, who was elected earlier in June, had always portrayed himself as a pro-Bitcoin leader who would rather veto regulatory restrictions than create new digital asset laws. According to market data, the adoption of crypto assets by Polish households has continued to grow in recent years, with the number of domestic users expected to hit 7.9 million by this year’s end.

Dogecoin has been bleeding lower in recent days, grinding back toward the mid-$0.13 band. Sellers have been in control of most candles in the past 24 hours, and each attempt at a rebound has faded quickly, leaving Dogecoin stuck near the bottom of a range.
One crypto analyst on X has focused attention on an important technical level on the 2-day chart. Even though price action looks weak, Dogecoin is now sitting right on a long-term support zone inside a descending triangle pattern, and this area could become the launchpad for a strong upside move if buyers react from here. The chart shared with the analysis highlights exactly where Dogecoin is resting and why this region matters.
Technical analysis of Dogecoin’s price action on the 2-day candlestick timeframe chart shows the meme coin has been trading in a clear descending triangle since December 2024. A downward-sloping trendline has capped every rally this year, leading to the creation of a series of lower highs that reflect persistent selling pressure throughout the year. At the same time, a horizontal support zone underneath in the mid-$0.135 to $0.14 region has caught multiple drops and prevented a deeper breakdown.
Right now, Dogecoin is pressing that lower border again. The candles on the 2-day chart cluster just above the dashed support band, and the analyst, who goes by Butterfly on X, circled this cluster in green to show how closely the price is hugging the level.

Each prior visit to this zone has produced at least a temporary bounce, which is why the current test is notable. The price action is tightening, and there is less room left for sideways movement before a decisive break happens.
In the post on X, the analyst notes that this support has been “respected multiple times” and that bulls are “getting ready to step in.” The most important thing is for the lower support to hold again, and the descending triangle may flip from a slow grind lower into a springboard for a strong reaction.
A firm defense of this zone would mean that sellers are running out of momentum at these prices. From there, even a modest wave of buying could drive Dogecoin back toward the descending resistance line that cuts across the chart from the $0.25 to $0.26 area. A break and close above that trendline would mark the first clean higher high in months and would confirm that the triangle has resolved to the upside.
The analyst’s green arrow on the chart sketches out this potential path. The path shows Dogecoin lifting from the current support band, breaking above resistance, and reaching as high as $0.4 in one swift move.

Bitcoin’s price action has been grossly dramatic throughout the year. After reaching its current all-time-high price of $126,000 in early October, the world’s leading cryptocurrency saw a rapid flip to the downside. Since reaching its October high, Bitcoin spiraled to as low as $80,500, a more than 15% negative deviation in reviewing year on year growth.
As the market sentiment thus ostensibly leans bearish, an on-chain analysis has recently been published, proffering reasons to believe that the negative sentiment among investors could be growing stronger.
In a QuickTake post on CryptoQuant, crypto pundit GugaOnChain brings to light the expiry of about $3.4 billion in Bitcoin options. This expiration event, which took place on Friday, 5th December, is one that typically triggers a “gravitational force” which attracts price to itself. By extension, price tends to move towards a specific price level referred to as the Maximum Pain Point, where option buyers incur the greatest losses, and sellers realize the most profits.

In this scenario, the Maximum Pain Point stood at approximately $91,000. As such, the Bitcoin price saw a rapid decline towards this mark. However, by the end of the session, Bitcoin had already slipped beneath its “gravitational force,” reaching as low as $89,500, and entering a range that amplified its buyers’ losses, while also maximizing its sellers’ (market makers) gains.
GugaOnChain also references readings from the Bitcoin: Funding Rates metric, which tracks the average funding rate across all major perpetual futures exchanges. As the analyst explains, this metric is useful in reading the prevalent market sentiment. For example, negative Funding Rates, such as the current reading of -0.001206, typically indicate the willingness of short traders to pay the longs for their positions. As such, it is evident that the market sentiment is more bearish than bullish.
There appears to be an alignment between the negative funding rates and the sell pressure supplied by the $3.4 billion expired options and breach of the $91,000 Maximum Pain Point. GugaOnChain explains that such a correlation further strengthens the narrative that the Bitcoin market could see an additional significant drop in its price.
While the long-term market direction may be well-defined, its short-term sentiment, however, reflects a more modest stance of utmost caution. As of press time, Bitcoin is valued at about $89,250. Over the past 24 hours, the premier cryptocurrency has lost approximately 3.38% of its value, per CoinMarketCap data.
Featured image from Shutterstock, chart from Tradingview


In a not-so-surprising turn of events, the bearish orientation of the Bitcoin price has continued into the month of December, suggesting that the premier cryptocurrency could end the year in the red. Interestingly, recent on-chain data has offered insights into the likely direction of Bitcoin based on the integrity of an important price level.
In a December 5 post on the X platform, market analyst Burak Kesmeci shared an interesting outlook on the direction of the Bitcoin price.
The analyst disclosed that whatever happens around the $82,000 mark could make or mar Bitcoin’s trajectory in the near term. To demonstrate why this price region is so important, Kesmeci pointed out that it appears to be the convergence point of two highly influential cost bases in Bitcoin’s history.
Kesmeci revealed that the Bitcoin spot exchange-traded funds have an average purchase cost of approximately $82,000. Because ETFs are one of Bitcoin’s strongest demand sources, tracking the values of their average cost-basis could serve as a good means to tell where the market stands institutionally.
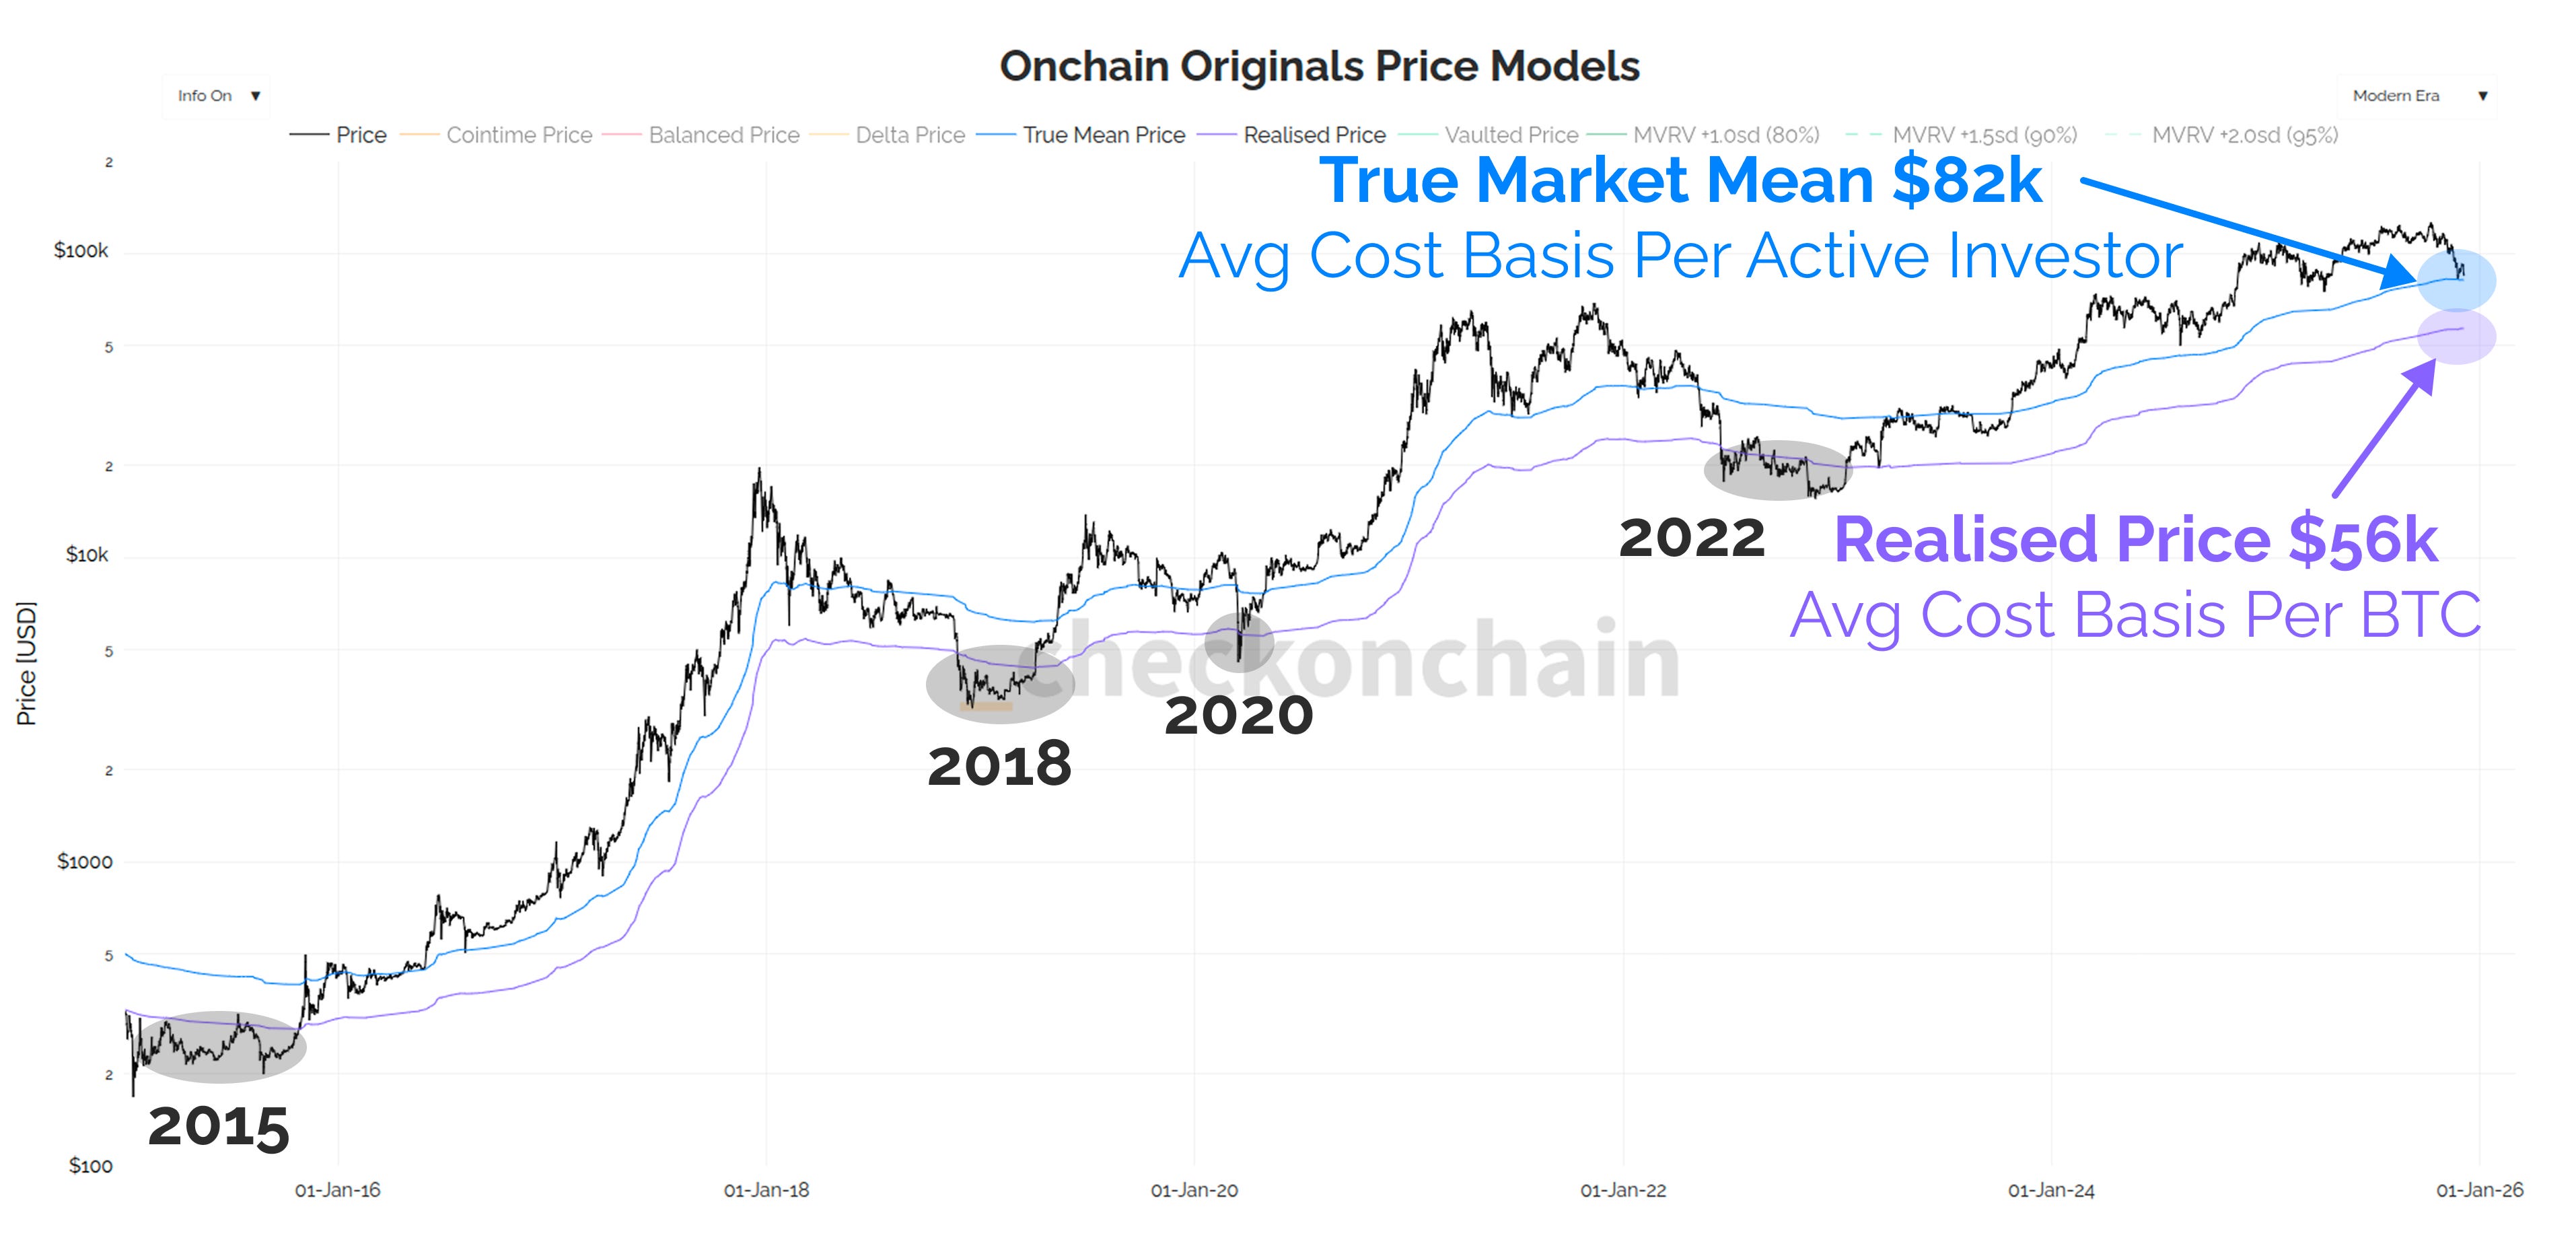
The crypto pundit also referenced the Bitcoin True Market Mean metric, which monitors the cost at which active investors procured their holdings—except for mined or rarely-moved BTC. Notably, in the current market cycle, Bitcoin’s active participants mostly purchased their coins around a valuation of $82,000.
Usually, when price slips beneath any major price support, there is, in turn, an increase in overall selling pressure, as buy-side liquidity is converted to bearish momentum via losses incurred by investors. Hence, in the scenario where $82,000 fails to hold, a wave of bearish pressure is expected to ensue, as Bitcoin’s active investors try to cut their losses.
However, Kesmeci expects something even more specific to follow. According to historical data, whenever Bitcoin falls beneath its active market participant cost basis, it often falls further downwards, as though it is targeting its Realized Price.
At the moment, the Bitcoin Realized Price sits near $56,000 — a price level significantly beneath its investors’ average cost basis. Kesmeci therefore warned that a slip beneath $82,000 could precede Bitcoin’s sharp downturn towards $56,000.
This would represent an almost 40% decline from the current price point. As of this writing, the price of BTC stands at around $89,310, reflecting an over 3% dip in the past 24 hours.