Threat landscape for industrial automation systems in Q3 2025
![]()
Statistics across all threats
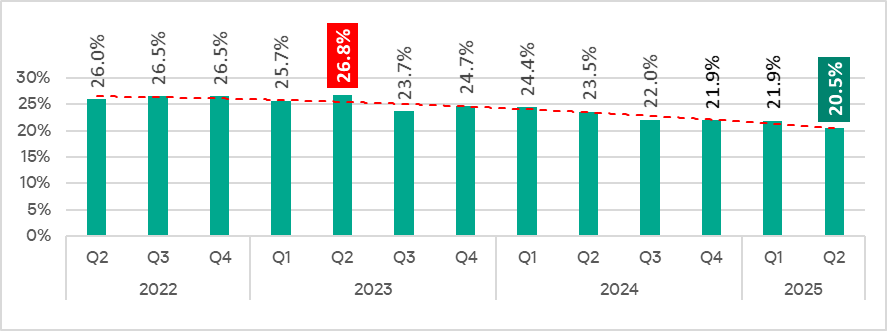
In Q3 2025, the percentage of ICS computers on which malicious objects were blocked decreased from the previous quarter by 0.4 pp to 20.1%. This is the lowest level for the observed period.
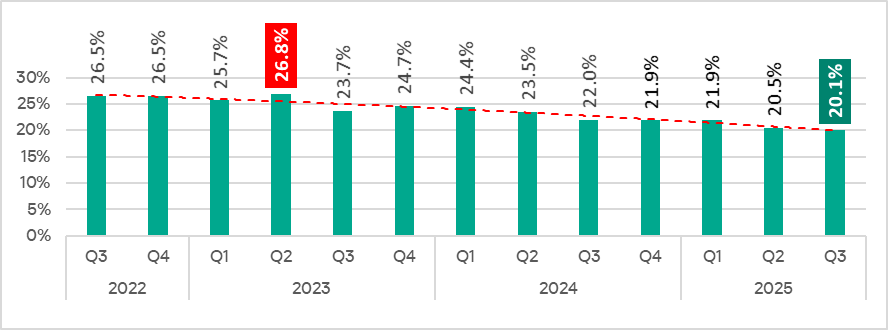
Percentage of ICS computers on which malicious objects were blocked, Q3 2022–Q3 2025
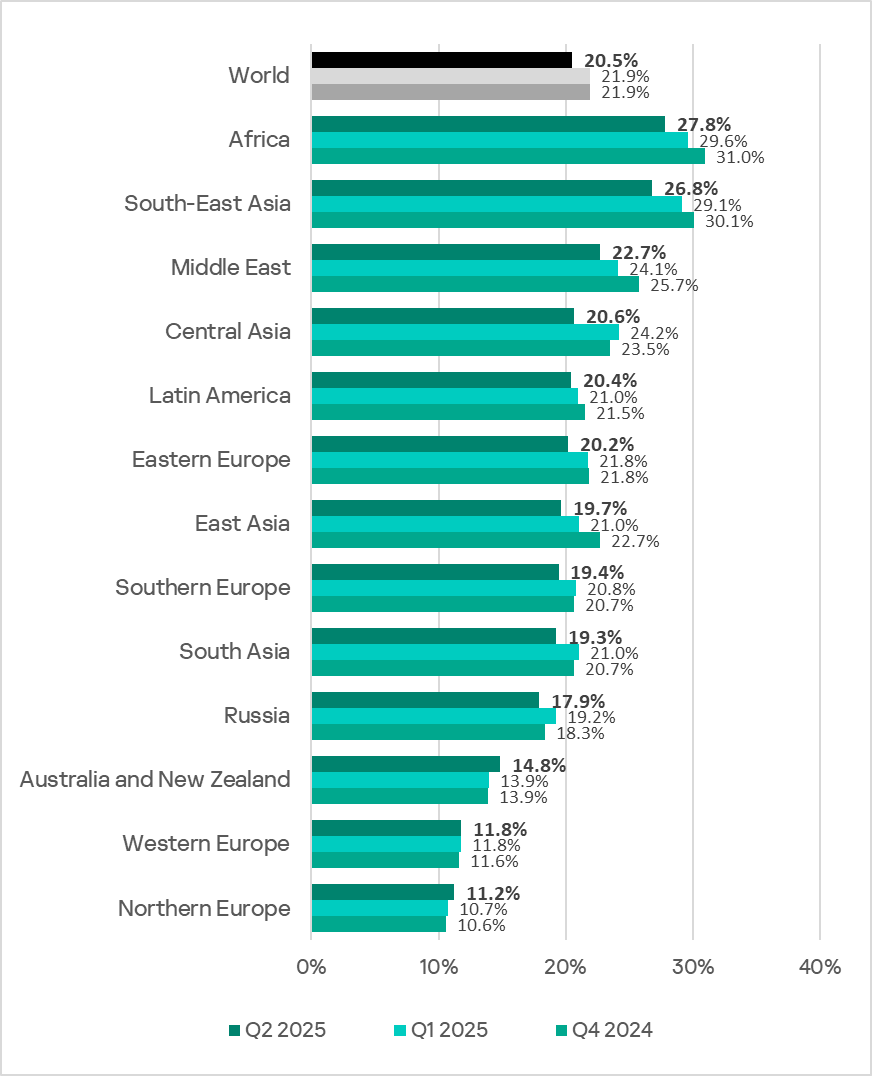
Regionally, the percentage of ICS computers on which malicious objects were blocked ranged from 9.2% in Northern Europe to 27.4% in Africa.
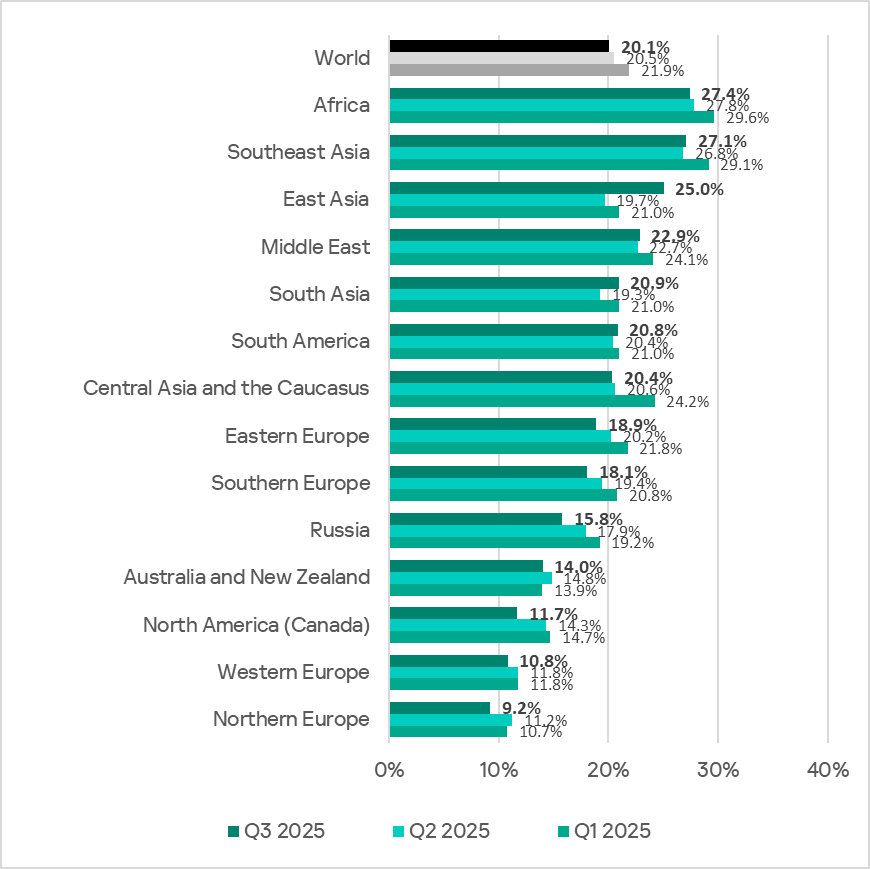
Regions ranked by percentage of ICS computers on which malicious objects were blocked
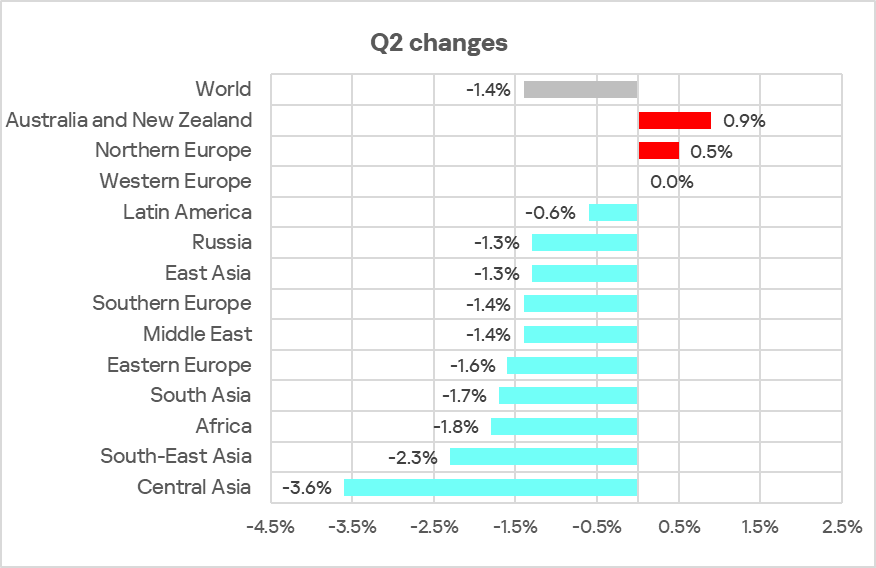
In Q3 2025, the percentage increased in five regions. The most notable increase occurred in East Asia, triggered by the local spread of malicious scripts in the OT infrastructure of engineering organizations and ICS integrators.
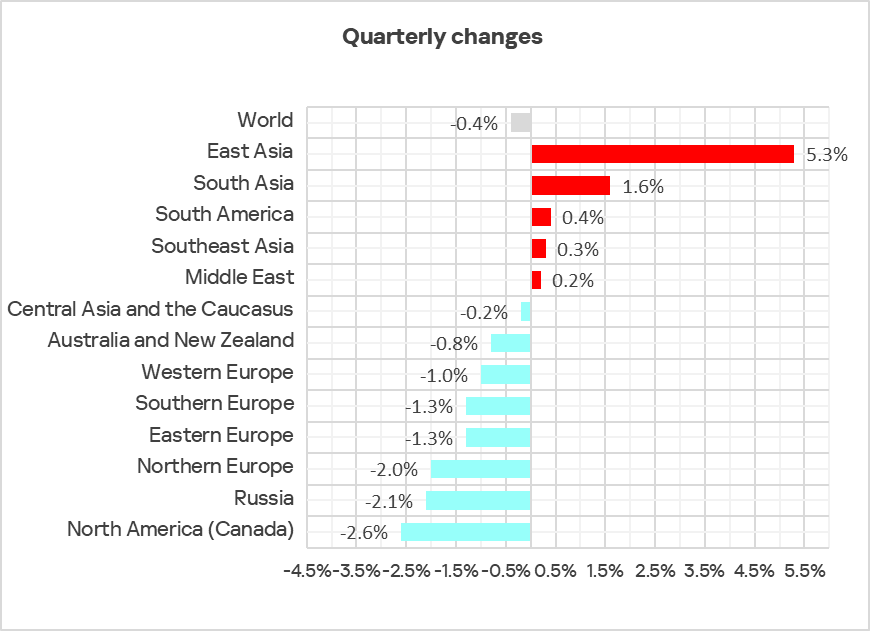
Changes in the percentage of ICS computers on which malicious objects were blocked, Q3 2025
Selected industries
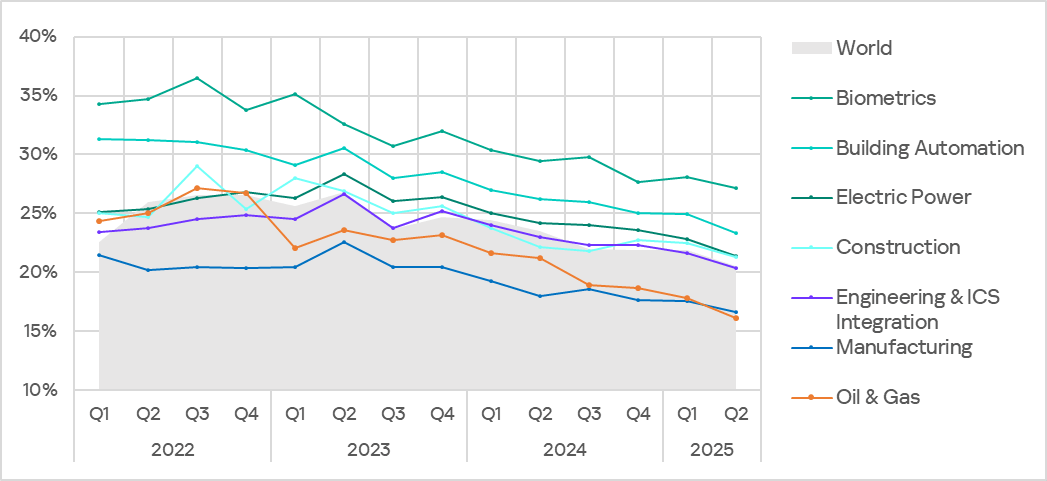
The biometrics sector traditionally led the rankings of the industries and OT infrastructures surveyed in this report in terms of the percentage of ICS computers on which malicious objects were blocked.
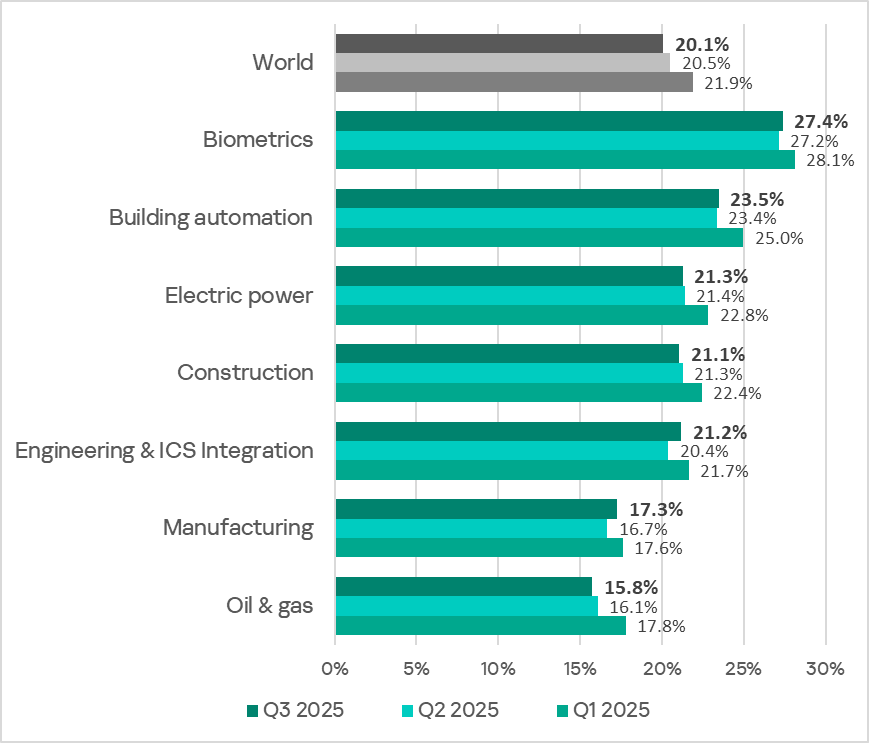
Rankings of industries and OT infrastructures by percentage of ICS computers on which malicious objects were blocked
In Q3 2025, the percentage of ICS computers on which malicious objects were blocked increased in four of the seven surveyed industries. The most notable increases were in engineering and ICS integrators, and manufacturing.
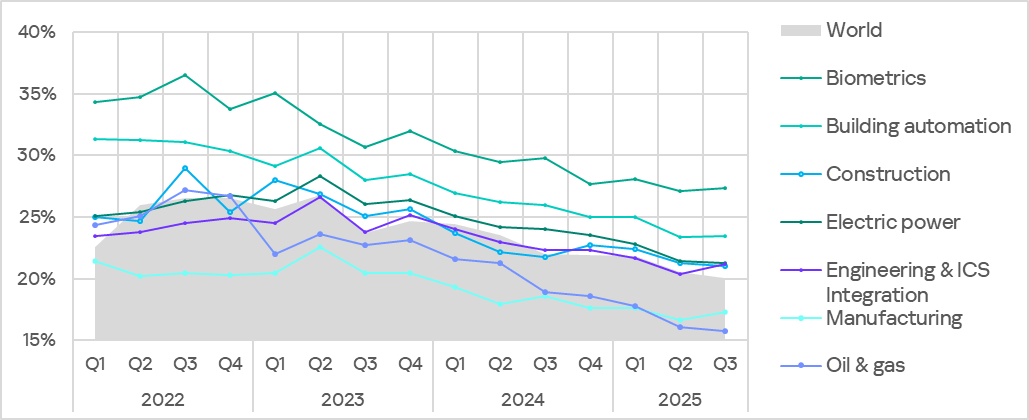
Percentage of ICS computers on which malicious objects were blocked in selected industries
Diversity of detected malicious objects
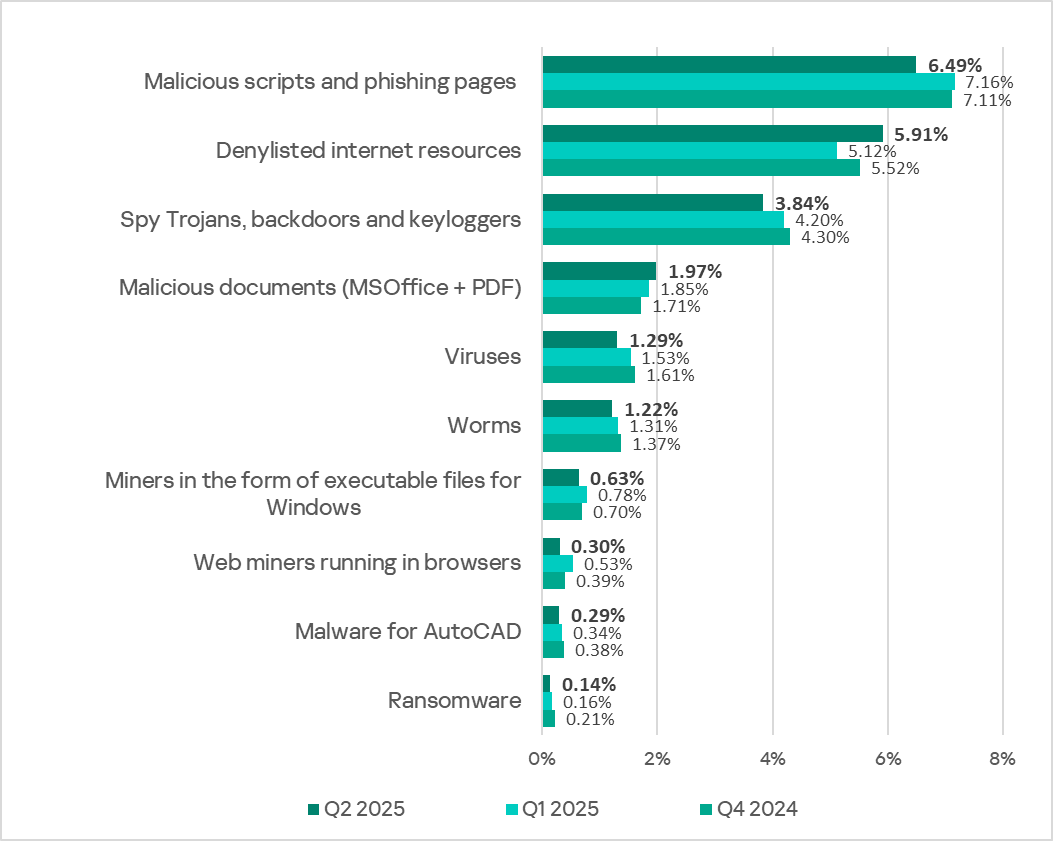
In Q3 2025, Kaspersky protection solutions blocked malware from 11,356 different malware families of various categories on industrial automation systems.
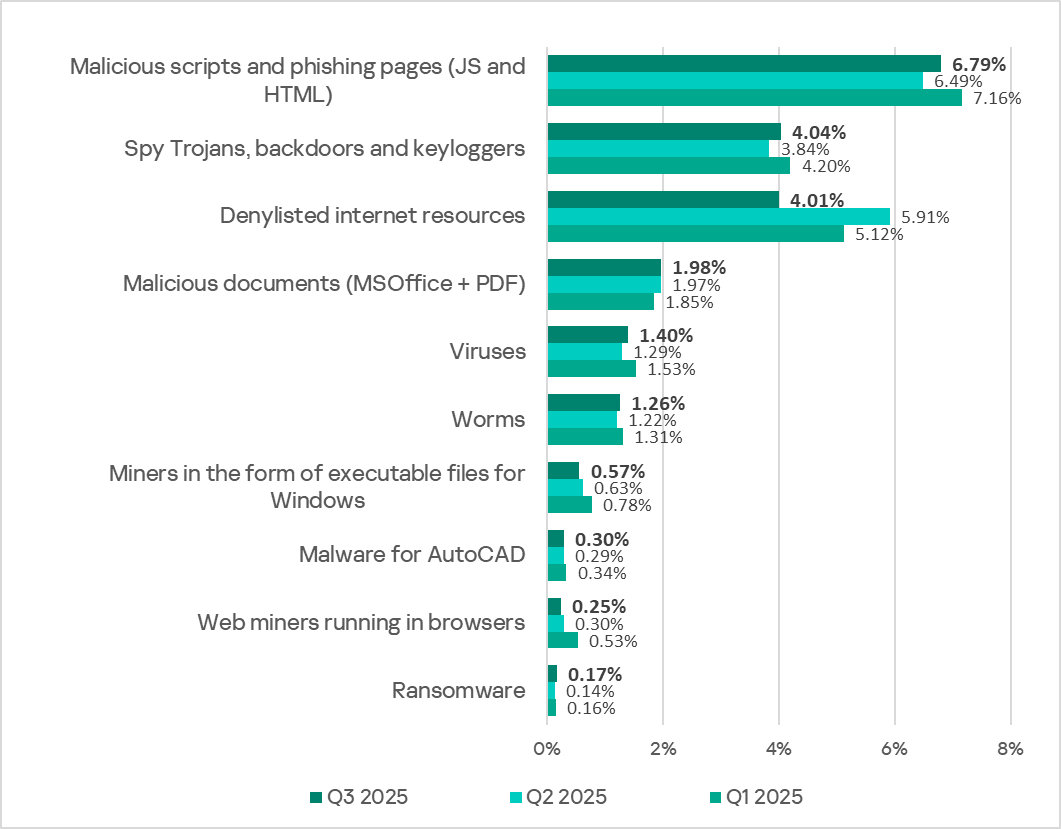
Percentage of ICS computers on which the activity of malicious objects of various categories was blocked
In Q3 2025, there was a decrease in the percentage of ICS computers on which denylisted internet resources and miners of both categories were blocked. These were the only categories that exhibited a decrease.
Main threat sources
Depending on the threat detection and blocking scenario, it is not always possible to reliably identify the source. The circumstantial evidence for a specific source can be the blocked threat’s type (category).
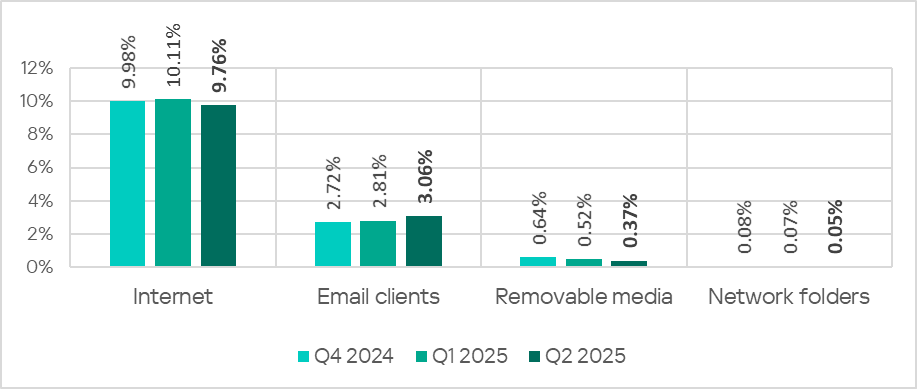
The internet (visiting malicious or compromised internet resources; malicious content distributed via messengers; cloud data storage and processing services and CDNs), email clients (phishing emails), and removable storage devices remain the primary sources of threats to computers in an organization’s technology infrastructure.
In Q3 2025, the percentage of ICS computers on which malicious objects from various sources were blocked decreased.
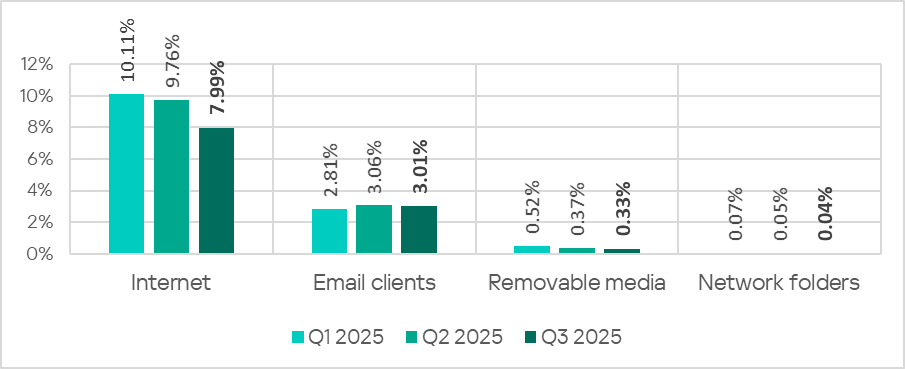
Percentage of ICS computers on which malicious objects from various sources were blocked
The same computer can be attacked by several categories of malware from the same source during a quarter. That computer is counted when calculating the percentage of attacked computers for each threat category, but is only counted once for the threat source (we count unique attacked computers). In addition, it is not always possible to accurately determine the initial infection attempt. Therefore, the total percentage of ICS computers on which various categories of threats from a certain source were blocked can exceed the percentage of threats from the source itself.
- The main categories of threats from the internet blocked on ICS computers in Q3 2025 were malicious scripts and phishing pages, and denylisted internet resources. The percentage ranged from 4.57% in Northern Europe to 10.31% in Africa.
- The main categories of threats from email clients blocked on ICS computers were malicious scripts and phishing pages, spyware, and malicious documents. Most of the spyware detected in phishing emails was delivered as a password-protected archive or a multi-layered script embedded in an office document. The percentage of ICS computers on which threats from email clients were blocked ranged from 0.78% in Russia to 6.85% in Southern Europe.
- The main categories of threats that were blocked when removable media was connected to ICS computers were worms, viruses, and spyware. The percentage of ICS computers on which threats from this source were blocked ranged from 0.05% in Australia and New Zealand to 1.43% in Africa.
- The main categories of threats that spread through network folders were viruses, AutoCAD malware, worms, and spyware. The percentages of ICS computers where threats from this source were blocked ranged from 0.006% in Northern Europe to 0.20% in East Asia.
Threat categories
Typical attacks blocked within an OT network are multi-step sequences of malicious activities, where each subsequent step of the attackers is aimed at increasing privileges and/or gaining access to other systems by exploiting the security problems of industrial enterprises, including technological infrastructures.
Malicious objects used for initial infection
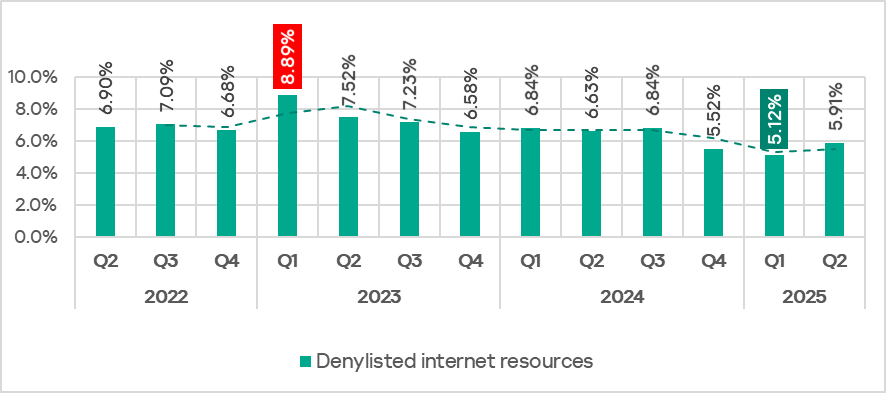
In Q3 2025, the percentage of ICS computers on which denylisted internet resources were blocked decreased to 4.01%. This is the lowest quarterly figure since the beginning of 2022.
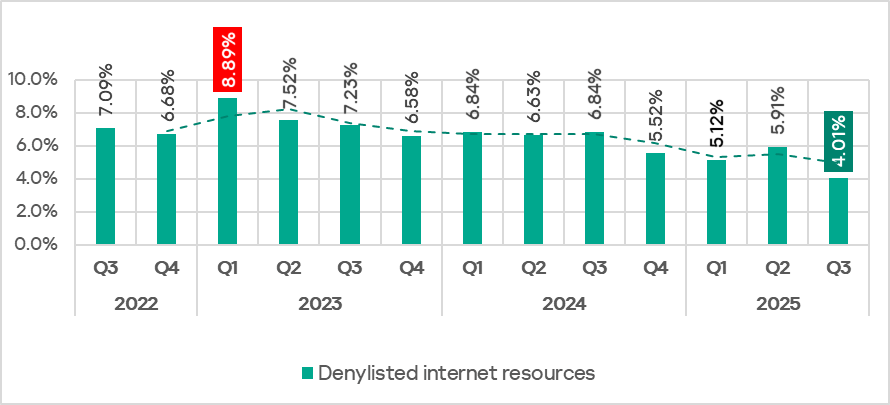
Percentage of ICS computers on which denylisted internet resources were blocked, Q3 2022–Q3 2025
Regionally, the percentage of ICS computers on which denylisted internet resources were blocked ranged from 2.35% in Australia and New Zealand to 4.96% in Africa. Southeast Asia and South Asia were also among the top three regions for this indicator.
The percentage of ICS computers on which malicious documents were blocked has grown for three consecutive quarters, following a decline at the end of 2024. In Q3 2025, it reached 1,98%.
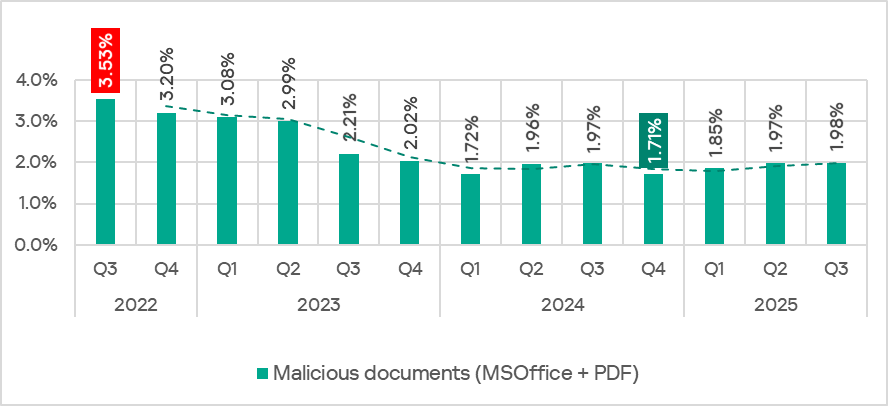
Percentage of ICS computers on which malicious documents were blocked, Q3 2022–Q3 2025
The indicator increased in four regions: South America, East Asia, Southeast Asia, and Australia and New Zealand. South America saw the largest increase as a result of a large-scale phishing campaign in which attackers used new exploits for an old vulnerability (CVE-2017-11882) in Microsoft Office Equation Editor to deliver various spyware to victims’ computers. It is noteworthy that the attackers in this phishing campaign used localized Spanish-language emails disguised as business correspondence.
In Q3 2025, the percentage of ICS computers on which malicious scripts and phishing pages were blocked increased to 6.79%. This category led the rankings of threat categories in terms of the percentage of ICS computers on which they were blocked.
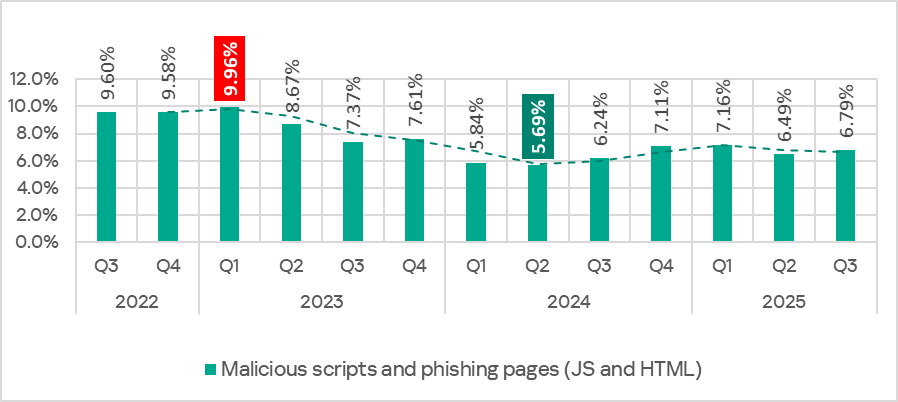
Percentage of ICS computers on which malicious scripts and phishing pages were blocked, Q3 2022–Q3 2025
Regionally, the percentage of ICS computers on which malicious scripts and phishing pages were blocked ranged from 2.57% in Northern Europe to 9.41% in Africa. The top three regions for this indicator were Africa, East Asia, and South America. The indicator increased the most in East Asia (by a dramatic 5.23 pp) as a result of the local spread of malicious spyware scripts loaded into the memory of popular torrent clients including MediaGet.
Next-stage malware
Malicious objects used to initially infect computers deliver next-stage malware — spyware, ransomware, and miners — to victims’ computers. As a rule, the higher the percentage of ICS computers on which the initial infection malware is blocked, the higher the percentage for next-stage malware.
In Q3 2025, the percentage of ICS computers on which spyware and ransomware were blocked increased. The rates were:
- spyware: 4.04% (up 0.20 pp);
- ransomware: 0.17% (up 0.03 pp).
The percentage of ICS computers on which miners of both categories were blocked decreased. The rates were:
- miners in the form of executable files for Windows: 0.57% (down 0.06 pp), it’s the lowest level since Q3 2022;
- web miners: 0.25% (down 0.05 pp). This is the lowest level since Q3 2022.
Self-propagating malware
Self-propagating malware (worms and viruses) is a category unto itself. Worms and virus-infected files were originally used for initial infection, but as botnet functionality evolved, they took on next-stage characteristics.
To spread across ICS networks, viruses and worms rely on removable media and network folders in the form of infected files, such as archives with backups, office documents, pirated games and hacked applications. In rarer and more dangerous cases, web pages with network equipment settings, as well as files stored in internal document management systems, product lifecycle management (PLM) systems, resource management (ERP) systems and other web services are infected.
In Q3 2025, the percentage of ICS computers on which worms and viruses were blocked increased to 1.26% (by 0.04 pp) and 1.40% (by 0.11 pp), respectively.
AutoCAD malware
This category of malware can spread in a variety of ways, so it does not belong to a specific group.
In Q3 2025, the percentage of ICS computers on which AutoCAD malware was blocked slightly increased to 0.30% (by 0.01 pp).
For more information on industrial threats see the full version of the report.
![]()
![]()
![]()
![]()