Forensic journey: hunting evil within AmCache
![]()
Introduction
When it comes to digital forensics, AmCache plays a vital role in identifying malicious activities in Windows systems. This artifact allows the identification of the execution of both benign and malicious software on a machine. It is managed by the operating system, and at the time of writing this article, there is no known way to modify or remove AmCache data. Thus, in an incident response scenario, it could be the key to identifying lost artifacts (e.g., ransomware that auto-deletes itself), allowing analysts to search for patterns left by the attacker, such as file names and paths. Furthermore, AmCache stores the SHA-1 hashes of executed files, which allows DFIR professionals to search public threat intelligence feeds — such as OpenTIP and VirusTotal — and generate rules for blocking this same file on other systems across the network.
This article presents a comprehensive analysis of the AmCache artifact, allowing readers to better understand its inner workings. In addition, we present a new tool named “AmCache-EvilHunter“, which can be used by any professional to easily parse the Amcache.hve file and extract IOCs. The tool is also able to query the aforementioned intelligence feeds to check for malicious file detections, this level of built-in automation reduces manual effort and speeds up threat detection, which is of significant value for analysts and responders.
The importance of evidence of execution
Evidence of execution is fundamentally important in digital forensics and incident response, since it helps investigators reconstruct how the system was used during an intrusion. Artifacts such as Prefetch, ShimCache, and UserAssist offer clues about what was executed. AmCache is also a robust artifact for evidencing execution, preserving metadata that indicates a file’s presence and execution, even if the file has been deleted or modified. An advantage of AmCache over other Windows artifacts is that unlike them, it stores the file hash, which is immensely useful for analysts, as it can be used to hunt malicious files across the network, increasing the likelihood of fully identifying, containing, and eradicating the threat.
Introduction to AmCache
Application Activity Cache (AmCache) was first introduced in Windows 7 and fully leveraged in Windows 8 and beyond. Its purpose is to replace the older RecentFileCache.bcf in newer systems. Unlike its predecessor, AmCache includes valuable forensic information about program execution, executed binaries and loaded drivers.
This artifact is stored as a registry hive file named Amcache.hve in the directory C:\Windows\AppCompat\Programs. The metadata stored in this file includes file paths, publisher data, compilation timestamps, file sizes, and SHA-1 hashes.
It is important to highlight that the AmCache format does not depend on the operating system version, but rather on the version of the libraries (DLLs) responsible for filling the cache. In this way, even Windows systems with different patch levels could have small differences in the structure of the AmCache files. The known libraries used for filling this cache are stored under %WinDir%\System32 with the following names:
- aecache.dll
- aeevts.dll
- aeinv.dll
- aelupsvc.dll
- aepdu.dll
- aepic.dll
It is worth noting that this artifact has its peculiarities and limitations. The AmCache computes the SHA-1 hash over only the first 31,457,280 bytes (≈31 MB) of each executable, so comparing its stored hash online can fail for files exceeding this size. Furthermore, Amcache.hve is not a true execution log: it records files in directories scanned by the Microsoft Compatibility Appraiser, executables and drivers copied during program execution, and GUI applications that required compatibility shimming. Only the last category reliably indicates actual execution. Items in the first two groups simply confirm file presence on the system, with no data on whether or when they ran.
In the same directory, we can find additional LOG files used to ensure Amcache.hve consistency and recovery operations:
- C:\Windows\AppCompat\Programs\Amcache.hve.*LOG1
- C:\Windows\AppCompat\Programs\Amcache.hve.*LOG2
The Amcache.hve file can be collected from a system for forensic analysis using tools like Aralez, Velociraptor, or Kape.
Amcache.hve structure
The Amcache.hve file is a Windows Registry hive in REGF format; it contains multiple subkeys that store distinct classes of data. A simple Python parser can be implemented to iterate through Amcache.hve and present its keys:
#!/usr/bin/env python3

import sys
from Registry.Registry import Registry

hive = Registry(str(sys.argv[1]))
root = hive.open("Root")

for rec in root.subkeys():
    print(rec.name())
The result of this parser when executed is:
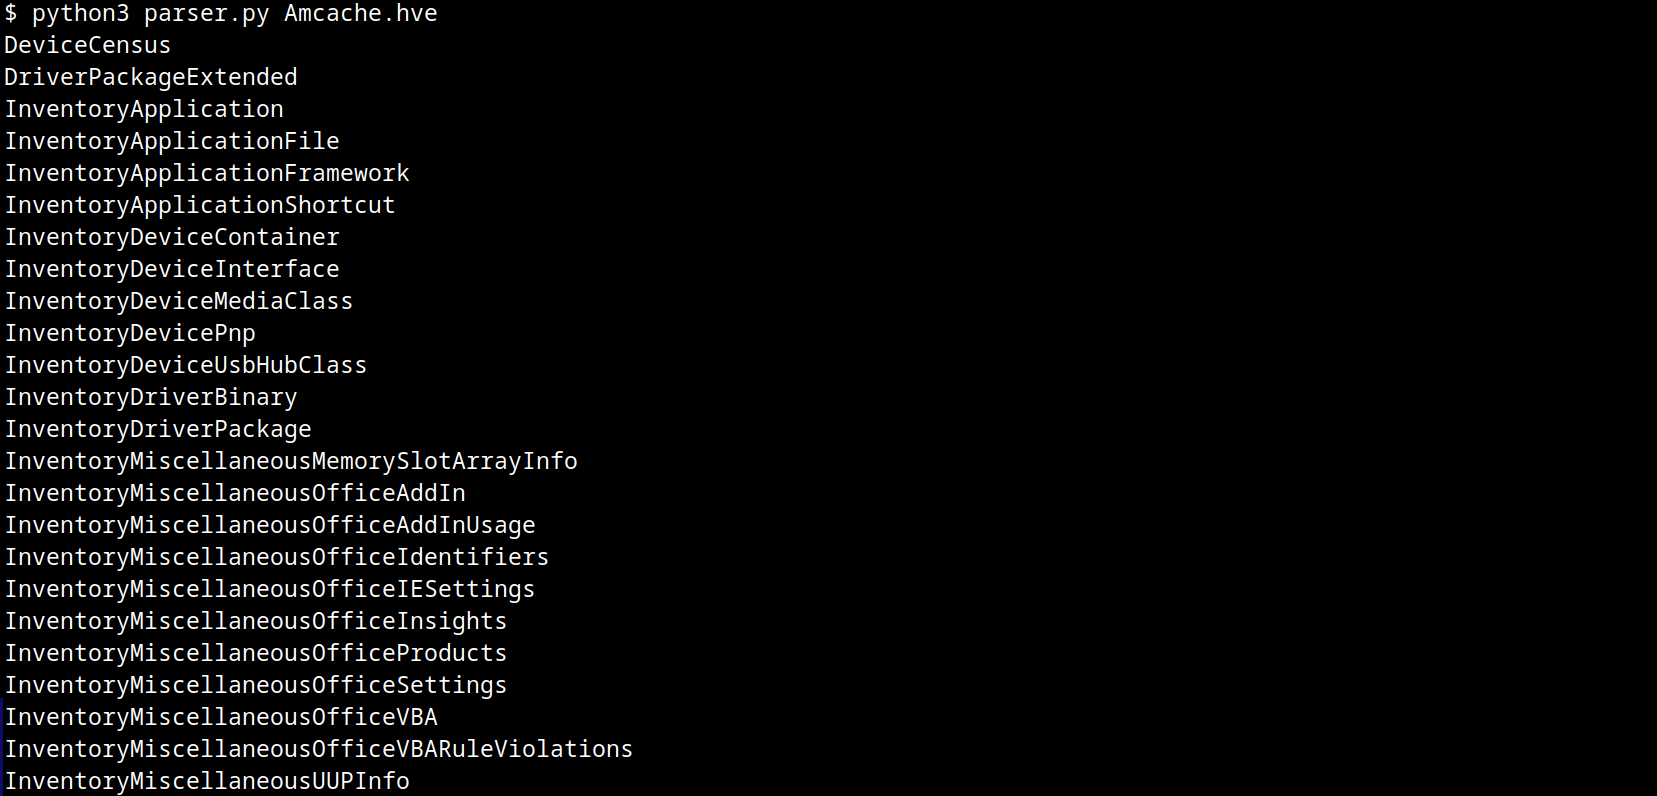
AmCache keys
From a DFIR perspective, the keys that are of the most interest to us are InventoryApplicationFile, InventoryApplication, InventoryDriverBinary, and InventoryApplicationShortcut, which are described in detail in the following subsections.
InventoryApplicationFile
The InventoryApplicationFile key is essential for tracking every executable discovered on the system. Under this key, each executable is represented by its own uniquely named subkey, which stores the following main metadata:
- ProgramId: a unique hash generated from the binary name, version, publisher, and language, with some zeroes appended to the beginning of the hash
- FileID: the SHA-1 hash of the file, with four zeroes appended to the beginning of the hash
- LowerCaseLongPath: the full lowercase path to the executable
- Name: the file base name without the path information
- OriginalFileName: the original filename as specified in the PE header’s version resource, indicating the name assigned by the developer at build time
- Publisher: often used to verify if the source of the binary is legitimate. For malware, this subkey is usually empty
- Version: the specific build or release version of the executable
- BinaryType: indicates whether the executable is a 32-bit or 64-bit binary
- ProductName: the ProductName field from the version resource, describing the broader software product or suite to which the executable belongs
- LinkDate: the compilation timestamp extracted from the PE header
- Size: the file size in bytes
- IsOsComponent: a boolean flag that specifies whether the executable is a built-in OS component or a third-party application/library
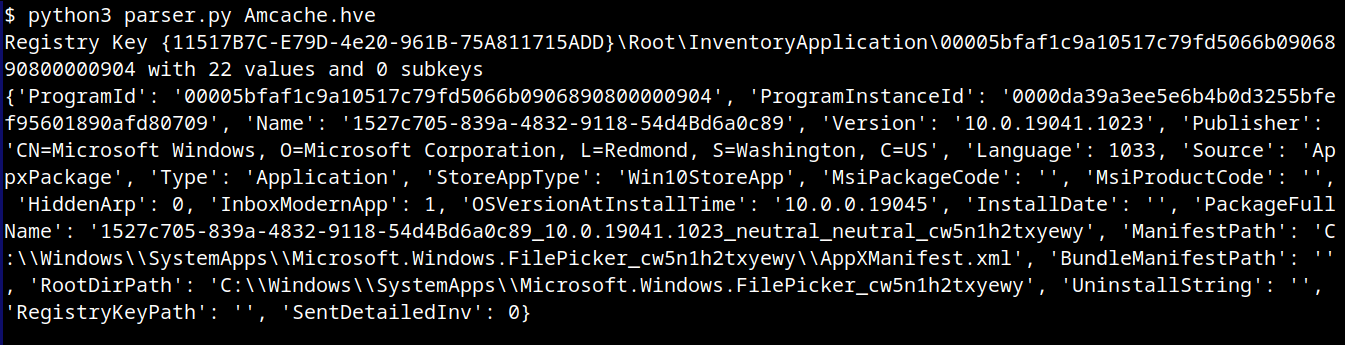
With some tweaks to our original Python parser, we can read the information stored within this key:
#!/usr/bin/env python3

import sys
from Registry.Registry import Registry

hive = Registry(sys.argv[1])
root = hive.open("Root")

subs = {k.name(): k for k in root.subkeys()}
parent = subs.get("InventoryApplicationFile")

for rec in parent.subkeys():
   vals = {v.name(): v.value() for v in rec.values()}
   print("{}\n{}\n\n-----------\n".format(rec, vals))
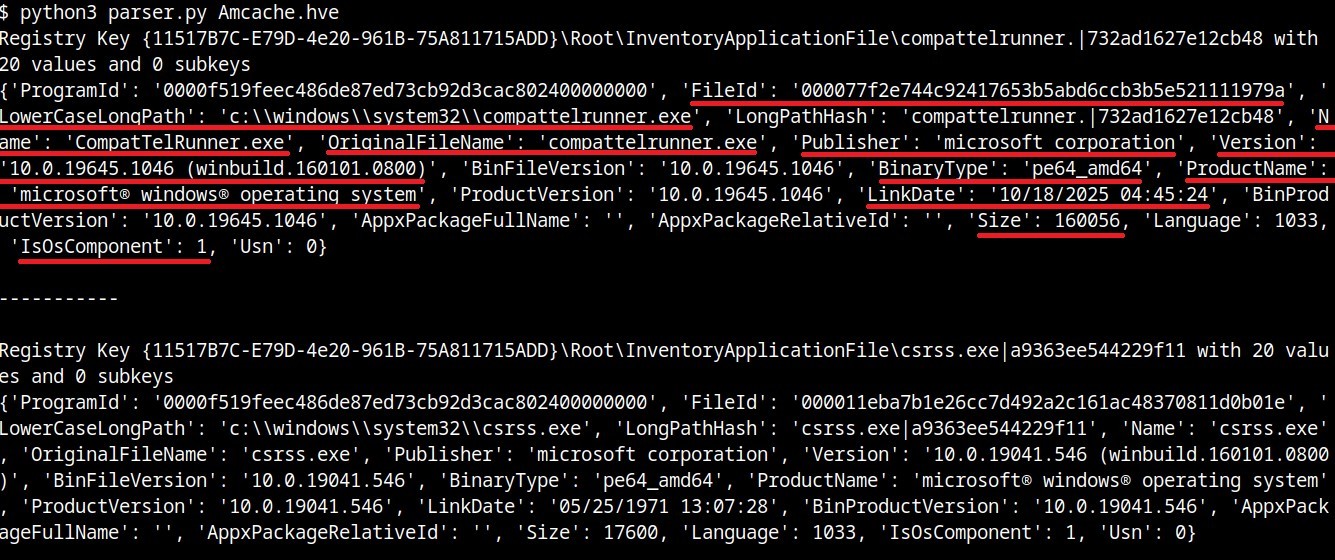
InventoryApplicationFile subkeys
We can also use tools like Registry Explorer to see the same data in a graphical way:
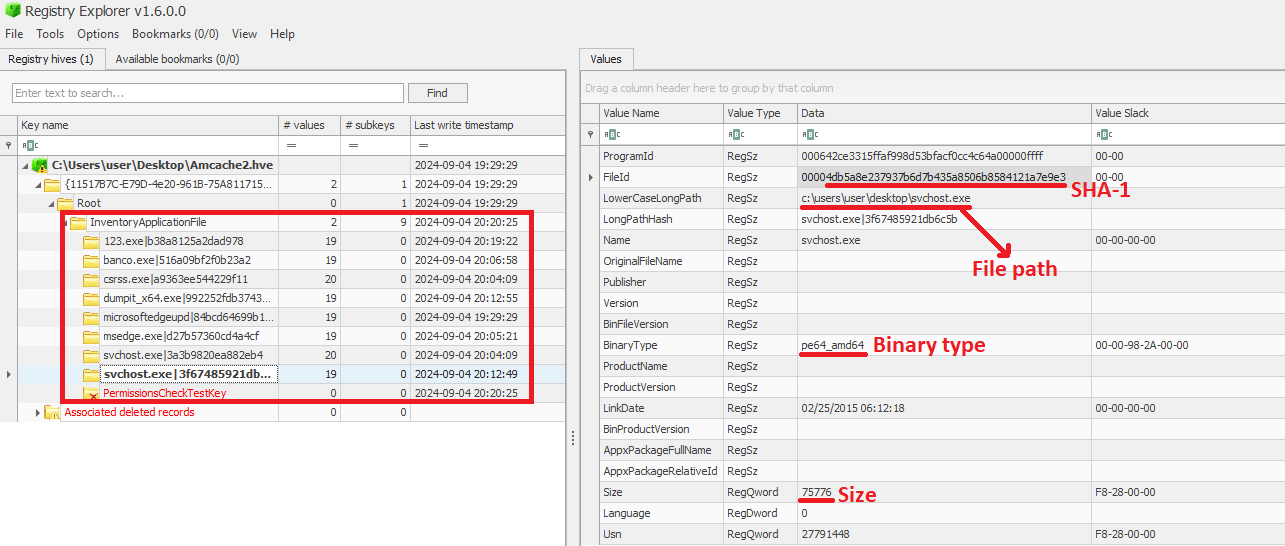
InventoryApplicationFile inspected through Registry Explorer
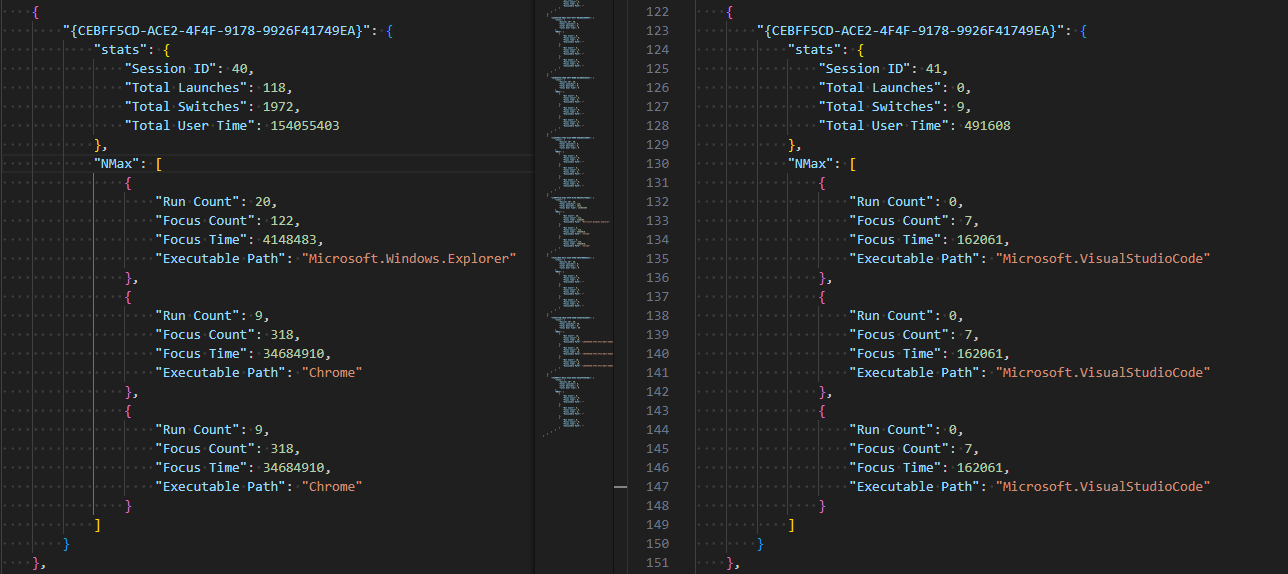
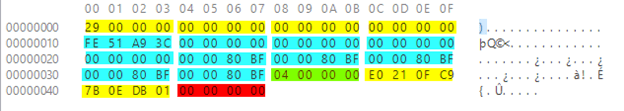
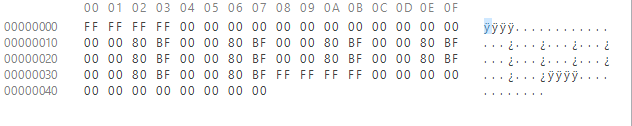
As mentioned before, AmCache computes the SHA-1 hash over only the first 31,457,280 bytes (≈31 MB). To prove this, we did a small experiment, during which we got a binary smaller than 31 MB (Aralez) and one larger than this value (a custom version of Velociraptor). For the first case, the SHA-1 hash of the entire binary was stored in AmCache.
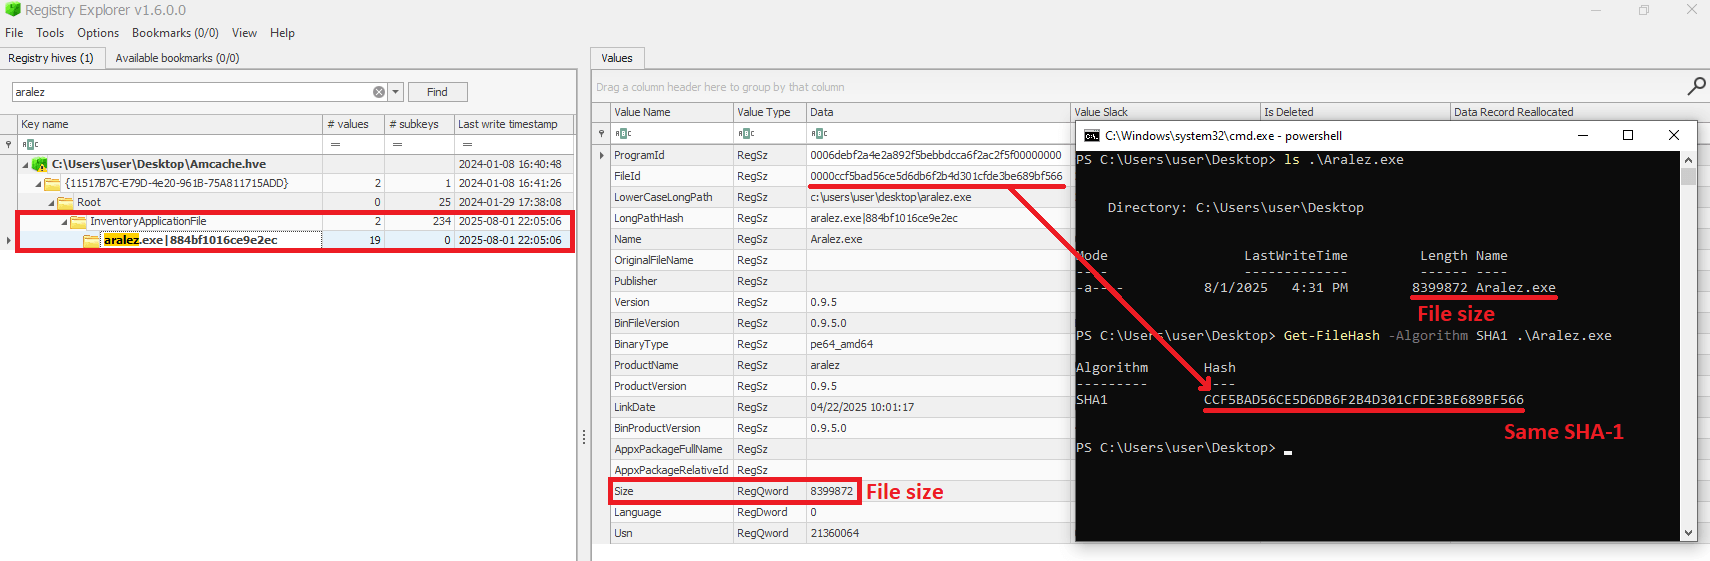
First AmCache SHA-1 storage scenario
For the second scenario, we used the dd utility to extract the first 31 MB of the Velociraptor binary:
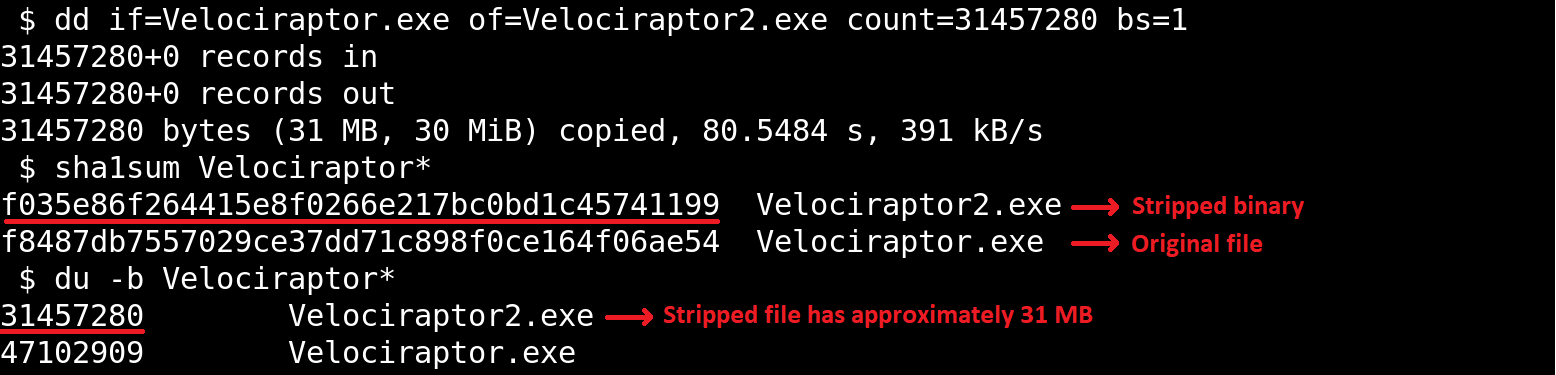
Stripped binary
When checking the Velociraptor entry on AmCache, we found that it indeed stored the SHA-1 hash calculated only for the first 31,457,280 bytes of the binary. Interestingly enough, the Size value represented the actual size of the original file. Thus, relying only on the file hash stored on AmCache for querying threat intelligence portals may be not enough when dealing with large files. So, we need to check if the file size in the record is bigger than 31,457,280 bytes before searching threat intelligence portals.
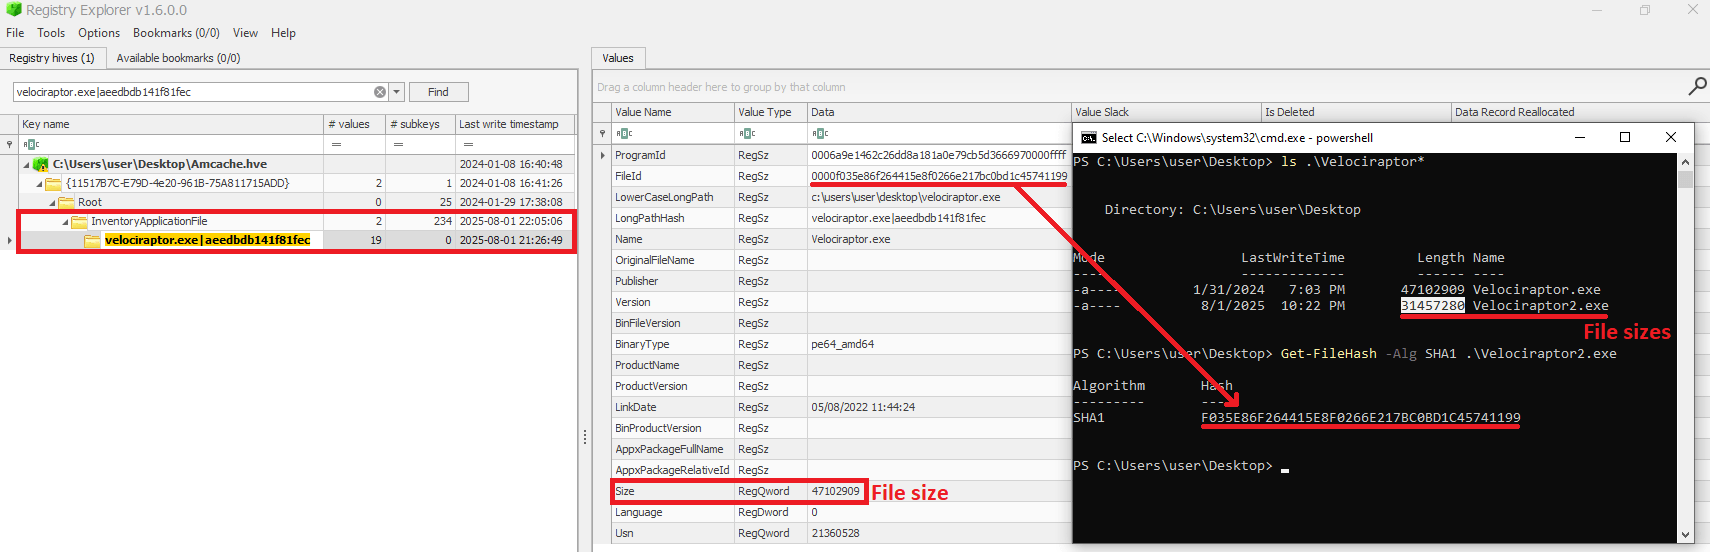
Second AmCache SHA-1 storage scenario
Additionally, attackers may take advantage of this characteristic to purposely generate large malicious binaries. In this way, even if investigators find that a malware was executed/present on a Windows system, the actual SHA-1 hash of the binary will still be unknown, making it difficult to track it across the network and gathering it from public databases like VirusTotal.
InventoryApplicationFile – use case example: finding a deleted tool that was used
Let’s suppose you are searching for a possible insider threat. The user denies having run any suspicious programs, and any suspicious software was securely erased from disk. But in the InventoryApplicationFile, you find a record of winscp.exe being present in the user’s Downloads folder. Even though the file is gone, this tells you the tool was on the machine and it was likely used to transfer files before being deleted. In our incident response practice, we have seen similar cases, where this key proved useful.
InventoryApplication
The InventoryApplication key records details about applications that were previously installed on the system. Unlike InventoryApplicationFile, which logs every executable encountered, InventoryApplication focuses on those with installation records. Each entry is named by its unique ProgramId, allowing straightforward linkage back to the corresponding InventoryApplicationFile key. Additionally, InventoryApplication has the following subkeys of interest:
- InstallDate: a date‑time string indicating when the OS first recorded or recognized the application
- MsiInstallDate: present only if installed via Windows Installer (MSI); shows the exact time the MSI package was applied, sourced directly from the MSI metadata
- UninstallString: the exact command line used to remove the application
- Language: numeric locale identifier set by the developer (LCID)
- Publisher: the name of the software publisher or vendor
- ManifestPath: the file path to the installation manifest used by UWP or AppX/MSIX apps
With a simple change to our parser, we can check the data contained in this key:
<...>
parent = subs.get("InventoryApplication")
<...>
InventoryApplication subkeys
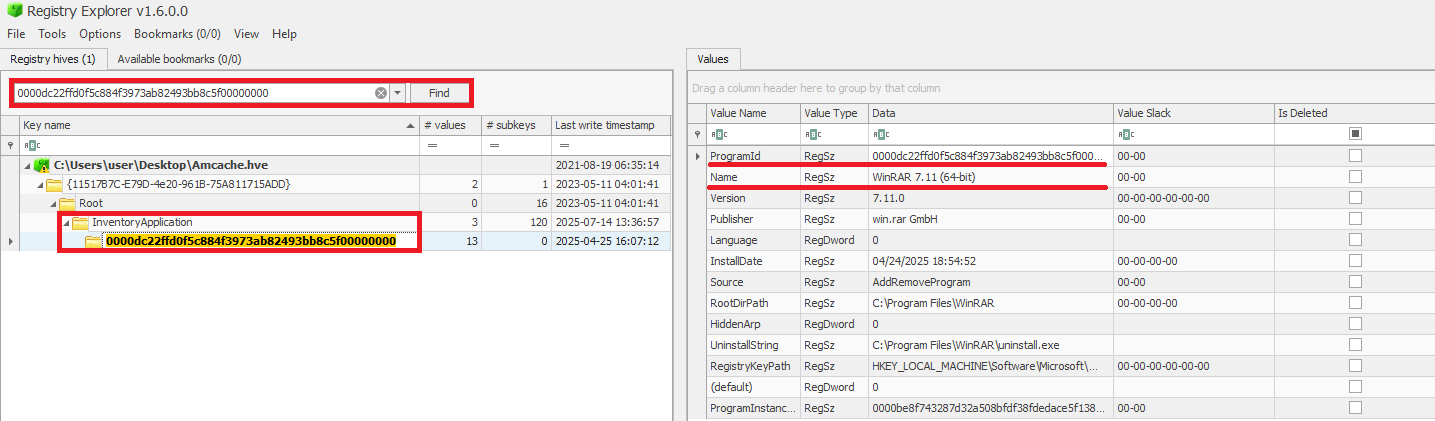
When a ProgramId appears both here and under InventoryApplicationFile, it confirms that the executable is not merely present or executed, but was formally installed. This distinction helps us separate ad-hoc copies or transient executions from installed software. The following figure shows the ProgramId of the WinRAR software under InventoryApplicationFile.
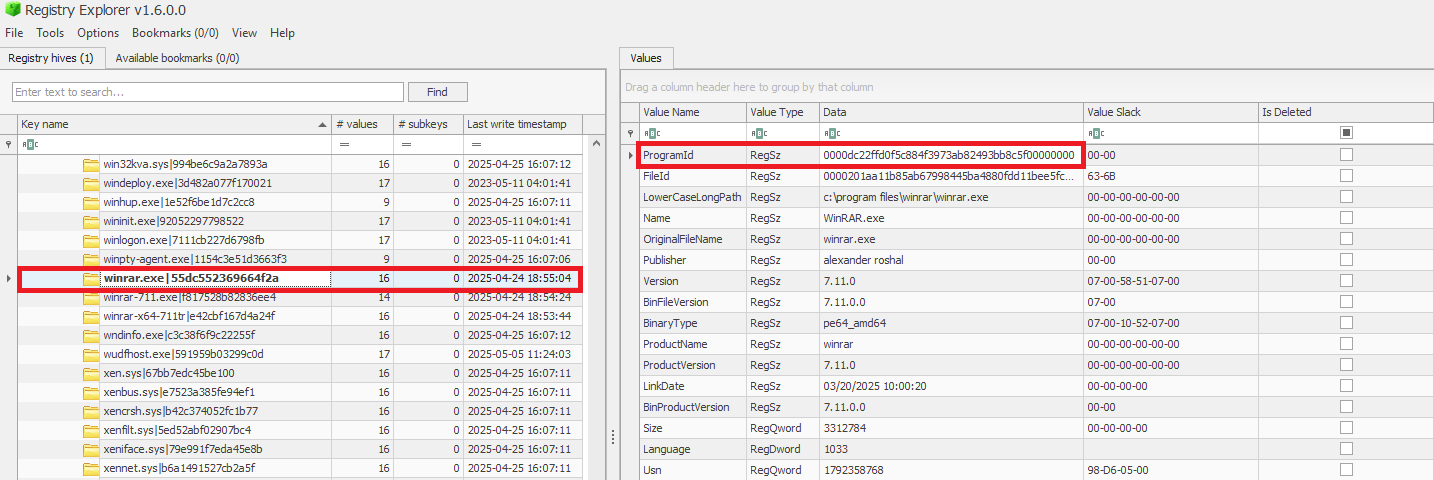
When searching for the ProgramId, we find an exact match under InventoryApplication. This confirms that WinRAR was indeed installed on the system.
Another interesting detail about InventoryApplication is that it contains a subkey named LastScanTime, which is stored separately from ProgramIds and holds a value representing the last time the Microsoft Compatibility Appraiser ran. This is a scheduled task that launches the compattelrunner.exe binary, and the information in this key should only be updated when that task executes. As a result, software installed since the last run of the Appraiser may not appear here. The LastScanTime value is stored in Windows FileTime format.
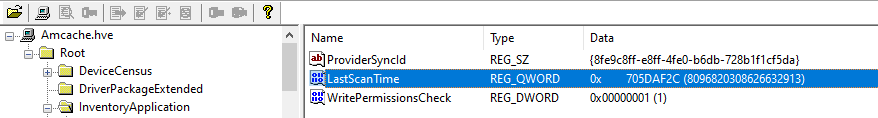
InventoryApplication LastScanTime information
InventoryApplication – use case example: spotting remote access software
Suppose that during an incident response engagement, you find an entry for AnyDesk in the InventoryApplication key (although the application is not installed anymore). This means that the attacker likely used it for remote access and then removed it to cover their tracks. Even if wiped from disk, this key proves it was present. We have seen this scenario in real-world cases more than once.
InventoryDriverBinary
The InventoryDriverBinary key records every kernel-mode driver that the system has loaded, providing the essential metadata needed to spot suspicious or malicious drivers. Under this key, each driver is captured in its own uniquely named subkey and includes:
- FileID: the SHA-1 hash of the driver binary, with four zeroes appended to the beginning of the hash
- LowerCaseLongPath: the full lowercase file path to the driver on disk
- DigitalSignature: the code-signing certificate details. A valid, trusted signature helps confirm the driver’s authenticity
- LastModified: the file’s last modification timestamp from the filesystem metadata, revealing when the driver binary was most recently altered on disk
Because Windows drivers run at the highest privilege level, they are frequently exploited by malware. For example, a previous study conducted by Kaspersky shows that attackers are exploiting vulnerable drivers for killing EDR processes. When dealing with a cybersecurity incident, investigators correlate each driver’s cryptographic hash, file path, signature status, and modification timestamp. That can help in verifying if the binary matches a known, signed version, detecting any tampering by spotting unexpected modification dates, and flagging unsigned or anomalously named drivers for deeper analysis. Projects like LOLDrivers help identify vulnerable drivers in use by attackers in the wild.
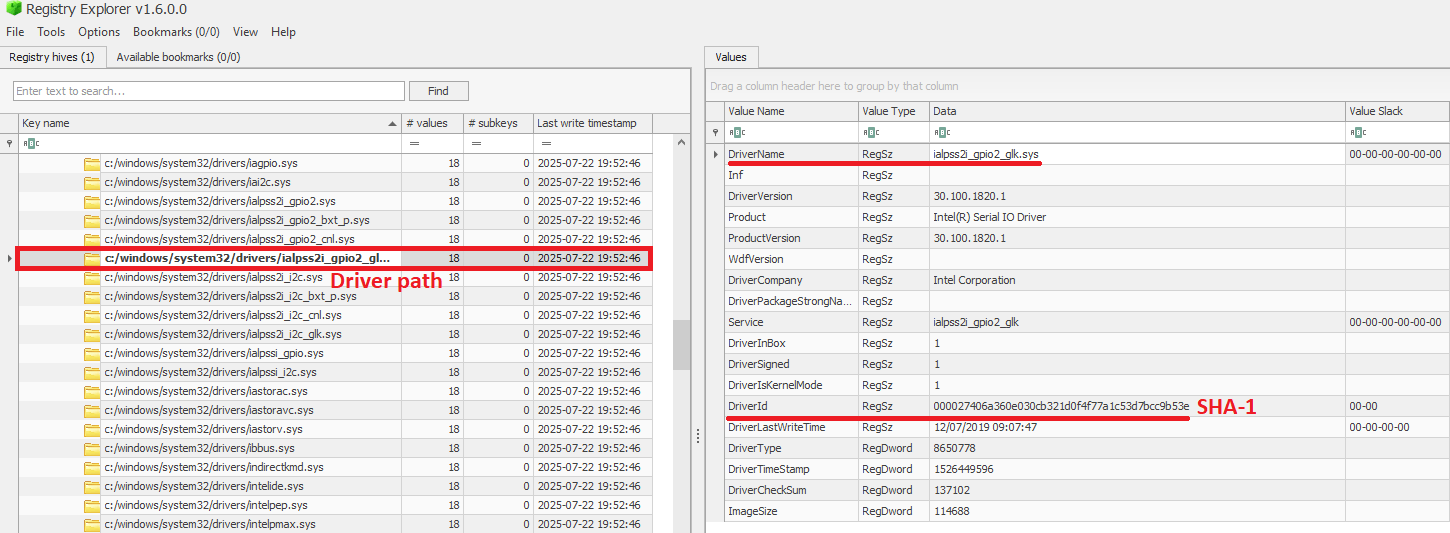
InventoryDriverBinary inspection
In addition to the InventoryDriverBinary, AmCache also provides the InventoryApplicationDriver key, which keeps track of all drivers that have been installed by specific applications. It includes two entries:
- DriverServiceName, which identifies the name of the service linked to the installed driver; and
- ProgramIds, which lists the program identifiers (corresponding to the key names under
InventoryApplication) that were responsible for installing the driver.
As shown in the figure below, the ProgramIds key can be used to track the associated program that uses this driver:
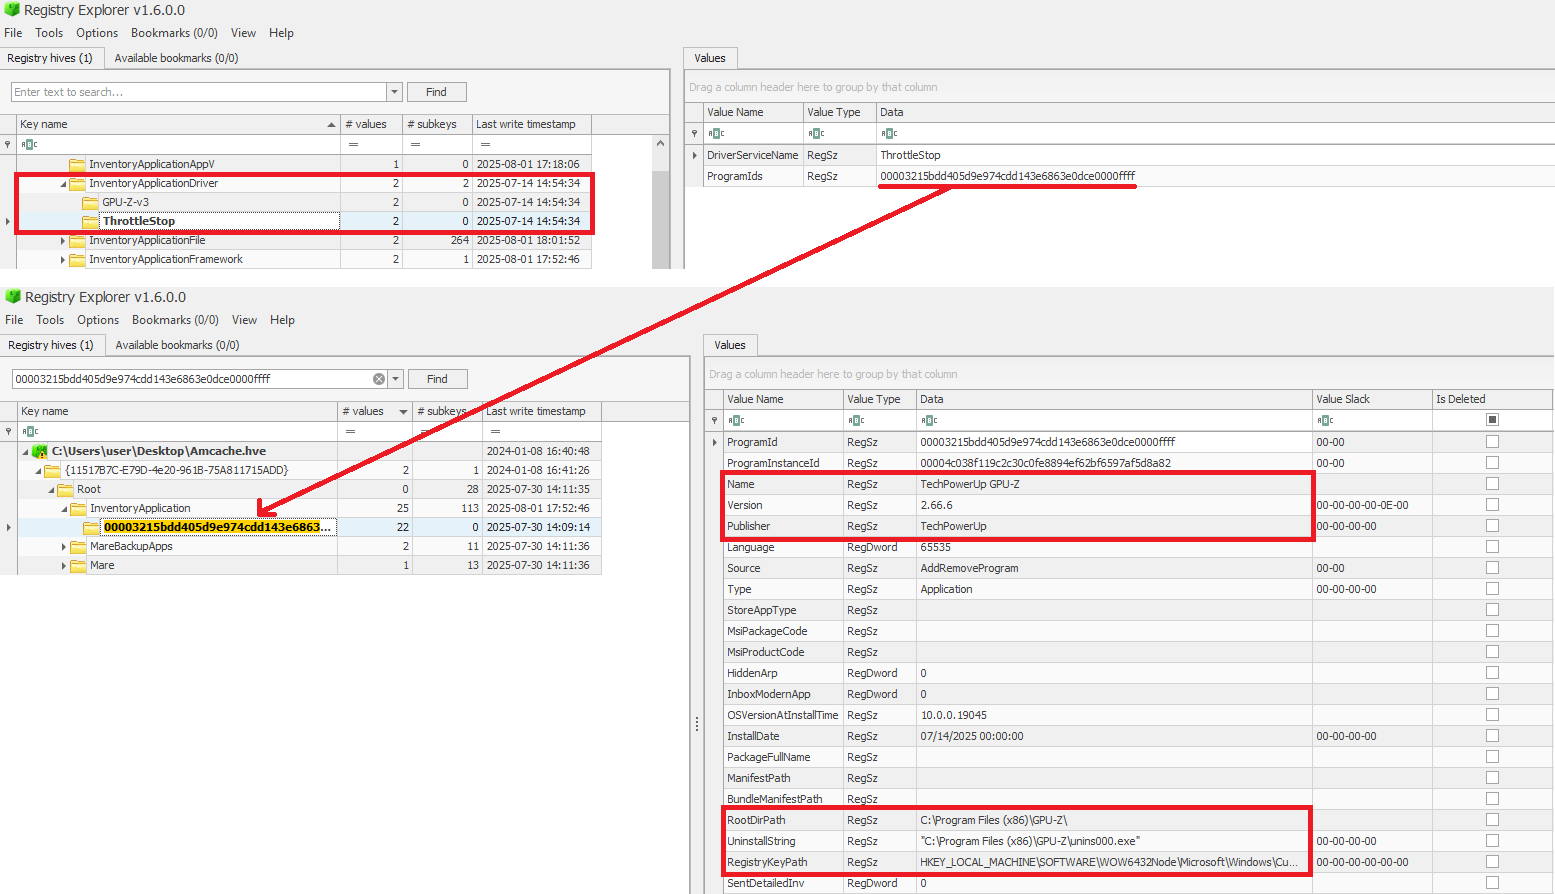
Checking program information by ProgramIds
InventoryDriverBinary – use case example: catching a bad driver
If the system was compromised through the abuse of a known vulnerable or malicious driver, you can use the InventoryDriverBinary registry key to confirm its presence. Even if the driver has been removed or hidden, remnants in this key can reveal that it was once loaded, which helps identify kernel-level compromises and supporting timeline reconstruction during the investigation. This is exactly how the AV Killer malware was discovered.
InventoryApplicationShortcut
This key contains entries for .lnk (shortcut) files that were present in folders like each user’s Start Menu or Desktop. Within each shortcut key, the ShortcutPath provides the absolute path to the LNK file at the moment of discovery. The ShortcutTargetPath shows where the shortcut pointed. We can also search for the ProgramId entry within the InventoryApplication key using the ShortcutProgramId (similar to what we did for drivers).
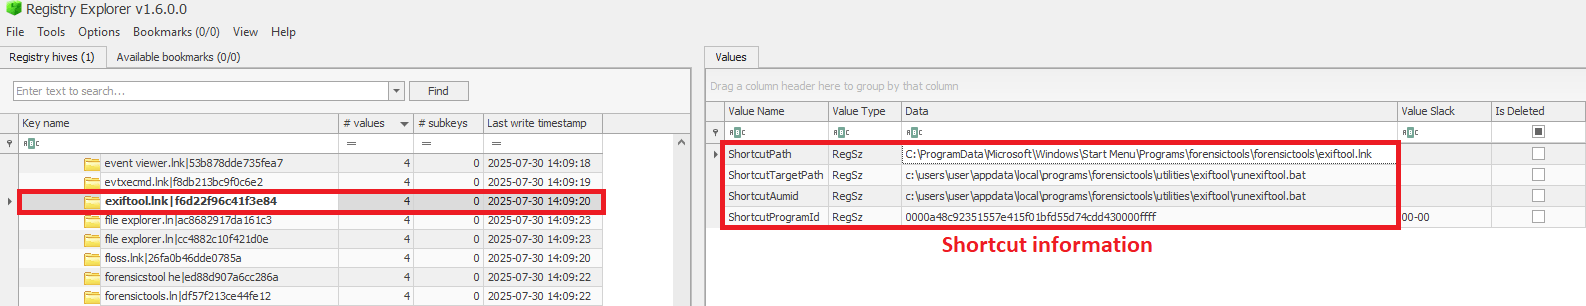
InventoryApplicationShortcut key
InventoryApplicationShortcut – use case example: confirming use of a removed app
You find that a suspicious program was deleted from the computer, but the user claims they never ran it. The InventoryApplicationShortcut key shows a shortcut to that program was on their desktop and was accessed recently. With supplementary evidence, such as that from Prefetch analysis, you can confirm the execution of the software.
AmCache key comparison
The table below summarizes the information presented in the previous subsections, highlighting the main information about each AmCache key.
| Key | Contains | Indicates execution? |
| InventoryApplicationFile | Metadata for all executables seen on the system. | Possibly (presence = likely executed) |
| InventoryApplication | Metadata about formally installed software. | No (indicates installation, not necessarily execution) |
| InventoryDriverBinary | Metadata about loaded kernel-mode drivers. | Yes (driver was loaded into memory) |
| InventoryApplicationShortcut | Information about .lnk files. | Possibly (combine with other data for confirmation) |
AmCache-EvilHunter
Undoubtedly Amcache.hve is a very important forensic artifact. However, we could not find any tool that effectively parses its contents while providing threat intelligence for the analyst. With this in mind, we developed AmCache-EvilHunter a command-line tool to parse and analyze Windows Amcache.hve registry hives, identify evidence of execution, suspicious executables, and integrate Kaspersky OpenTIP and VirusTotal lookups for enhanced threat intelligence.
AmCache-EvilHunter is capable of processing the Amcache.hve file and filter records by date range (with the options --start and --end). It is also possible to search records using keywords (--search), which is useful for searching for known naming conventions adopted by attackers. The results can be saved in CSV (--csv) or JSON (--json) formats.
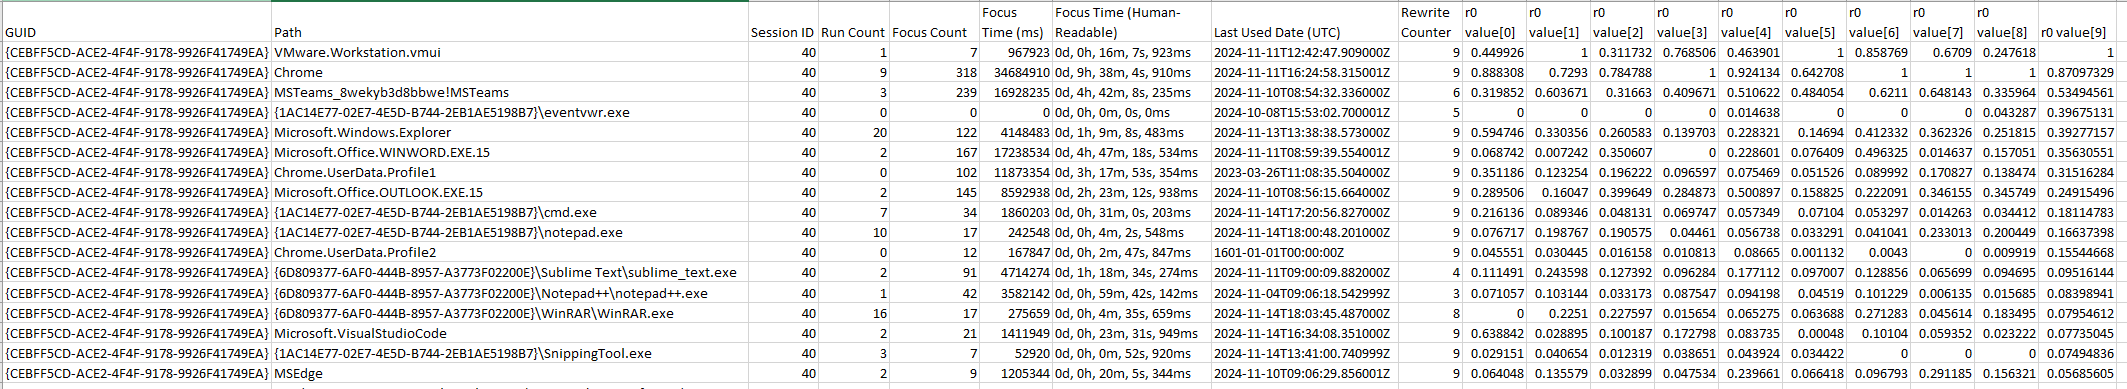
The image below shows an example of execution of AmCache-EvilHunter with these basic options, by using the following command:
amcache-evilhunter -i Amcache.hve --start 2025-06-19 --end 2025-06-19 --csv output.csv
The output contains all applications that were present on the machine on June 19, 2025. The last column contains information whether the file is an operating system component, or not.
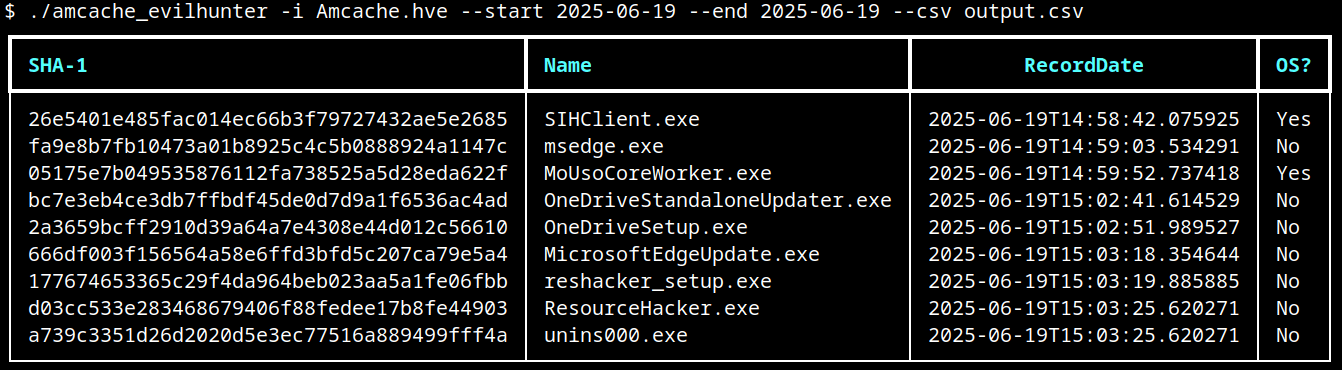
Basic usage of AmCache-EvilHunter
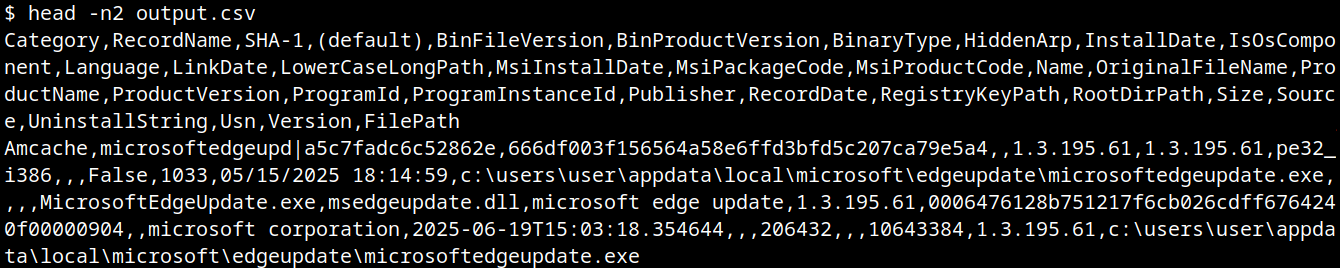
CSV result
Analysts are often faced with a large volume of executables and artifacts. To narrow down the scope and reduce noise, the tool is able to search for known suspicious binaries with the --find-suspicious option. The patterns used by the tool include common malware names, Windows processes containing small typos (e.g., scvhost.exe), legitimate executables usually found in use during incidents, one-letter/one-digit file names (such as 1.exe, a.exe), or random hex strings. The figure below shows the results obtained by using this option; as highlighted, one svchost.exe file is part of the operating system and the other is not, making it a good candidate for collection and analysis if not deleted.
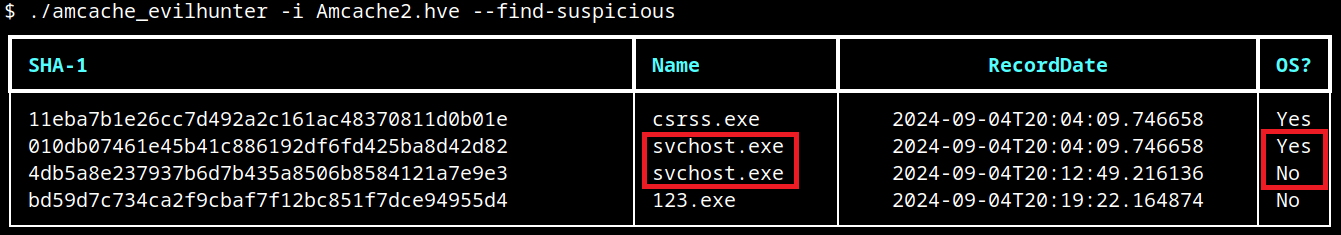
Suspicious files identification
Malicious files usually do not include any publisher information and are definitely not part of the default operating system. For this reason, AmCache-EvilHunter also ships with the --missing-publisher and --exclude-os options. These parameters allow for easy filtering of suspicious binaries and also allow fast threat intelligence gathering, which is crucial during an incident.
Another important feature that distinguishes our tool from other proposed approaches is that AmCache-EvilHunter can query Kaspersky OpenTIP (--opentip ) and VirusTotal (--vt) for hashes it identifies. In this way, analysts can rapidly gain insights into samples to decide whether they are going to proceed with a full analysis of the artifact or not.
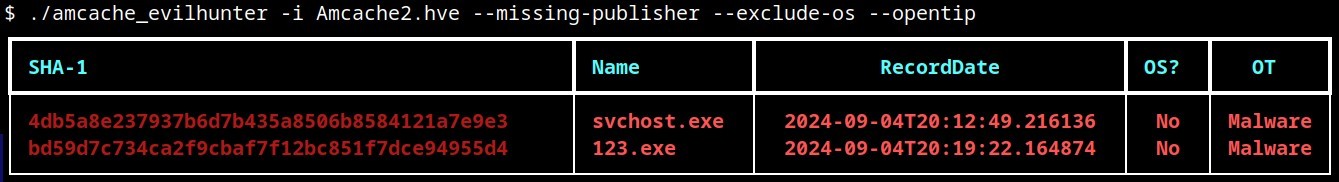
Threat intel lookup
Binaries of the tool are available on our GitHub page for both Linux and Windows systems.
Conclusion
Amcache.hve is a cornerstone of Windows forensics, capturing rich metadata, such as full paths, SHA-1 hashes, compilation timestamps, publisher and version details, for every executable that appears on a system. While it does not serve as a definitive execution log, its strength lies in documenting file presence and paths, making it invaluable for spotting anomalous binaries, verifying trustworthiness via hash lookups against threat‐intelligence feeds, and correlating LinkDate values with known attack campaigns.
To extract its full investigative potential, analysts should merge AmCache data with other artifacts (e.g., Prefetch, ShimCache, and Windows event logs) to confirm actual execution and build accurate timelines. Comparing InventoryApplicationFile entries against InventoryApplication reveals whether a file was merely dropped or formally installed, and identifying unexpected driver records can expose stealthy rootkits and persistence mechanisms. Leveraging parsers like AmCache-EvilHunter and cross-referencing against VirusTotal or proprietary threat databases allows IOC generation and robust incident response, making AmCache analysis a fundamental DFIR skill.
![]()
![]()
![]()
![]()