Normal view

There are new articles available, click to refresh the page.
Today — 9 December 2025NewsBTC

All Eyes On Ethereum: Price Attempts Key Breakout As BlackRock Files For Staked ETH ETF

9 December 2025 at 03:00

After weeks of speculation, BlackRock, the world’s largest asset manager, has officially filed for a staked Ethereum (ETH) Exchange-Traded Fund (ETF) with the US Securities and Exchange Commission (SEC). Amid the bullish news, the King of Altcoins’ price is attempting to break out of a two-month resistance, which could set the stage for a retest of higher levels.

BlackRock Files For Staked Ethereum ETF

BlackRock has submitted an S-1 form with the US SEC to get approval for its iShares Ethereum Staking Trust (ETHB), which “seeks to reflect generally the performance of the price of ether and rewards from staking a portion of the Trust’s ether, to the extent the Sponsor in its sole discretion determines that the Trust may do so without incurring undue legal or regulatory risk.”

Filed on December 5, BlackRock’s registration statement explains that, if approved, the proposed fund aims to stake 70% to 90% of its Ethereum holdings, distributing staking rewards to stakeholders at least quarterly.

Coinbase Custody Trust will serve as the custodian for the Trust’s ETH holdings, the filing noted, while Anchorage Digital Bank will be an available alternative custodian for the Trust’s ether holdings. Meanwhile, the Bank of New York Mellon will serve as the custodian for the Trust’s cash holdings and the administrator of the Trust.

Notably, BlackRock’s ETHB will operate separately from its spot ETH fund, the iShares Ethereum Trust ETF (ETHA), which is the largest in its category with $11 billion in assets under management (AUM).

It’s worth noting that the crypto community began speculating about BlackRock’s upcoming staked ETH fund after the leading asset manager registered the name in Delaware last month.

In a November report, 10x Research argued that the potential introduction of a staked Ethereum ETF by BlackRock would bring “increased scrutiny” to “the economics of DATs” as retail investors would reallocate to a low-cost source of yield.

The report added that many investors are unaware that Digital Asset Treasury (DATs)’s embedded costs “far exceed” the management fee charged by asset managers like BlackRock on its Bitcoin (BTC) and ETH ETFs.

ETH Nears Key Downtrend Line

Ethereum’s price started the week attempting to reclaim a crucial area after managing to hold the $3,000 level as support despite the volatility during the weekend. The cryptocurrency surged nearly 3% in the daily timeframe, hitting $3,180 before retracing on Monday.

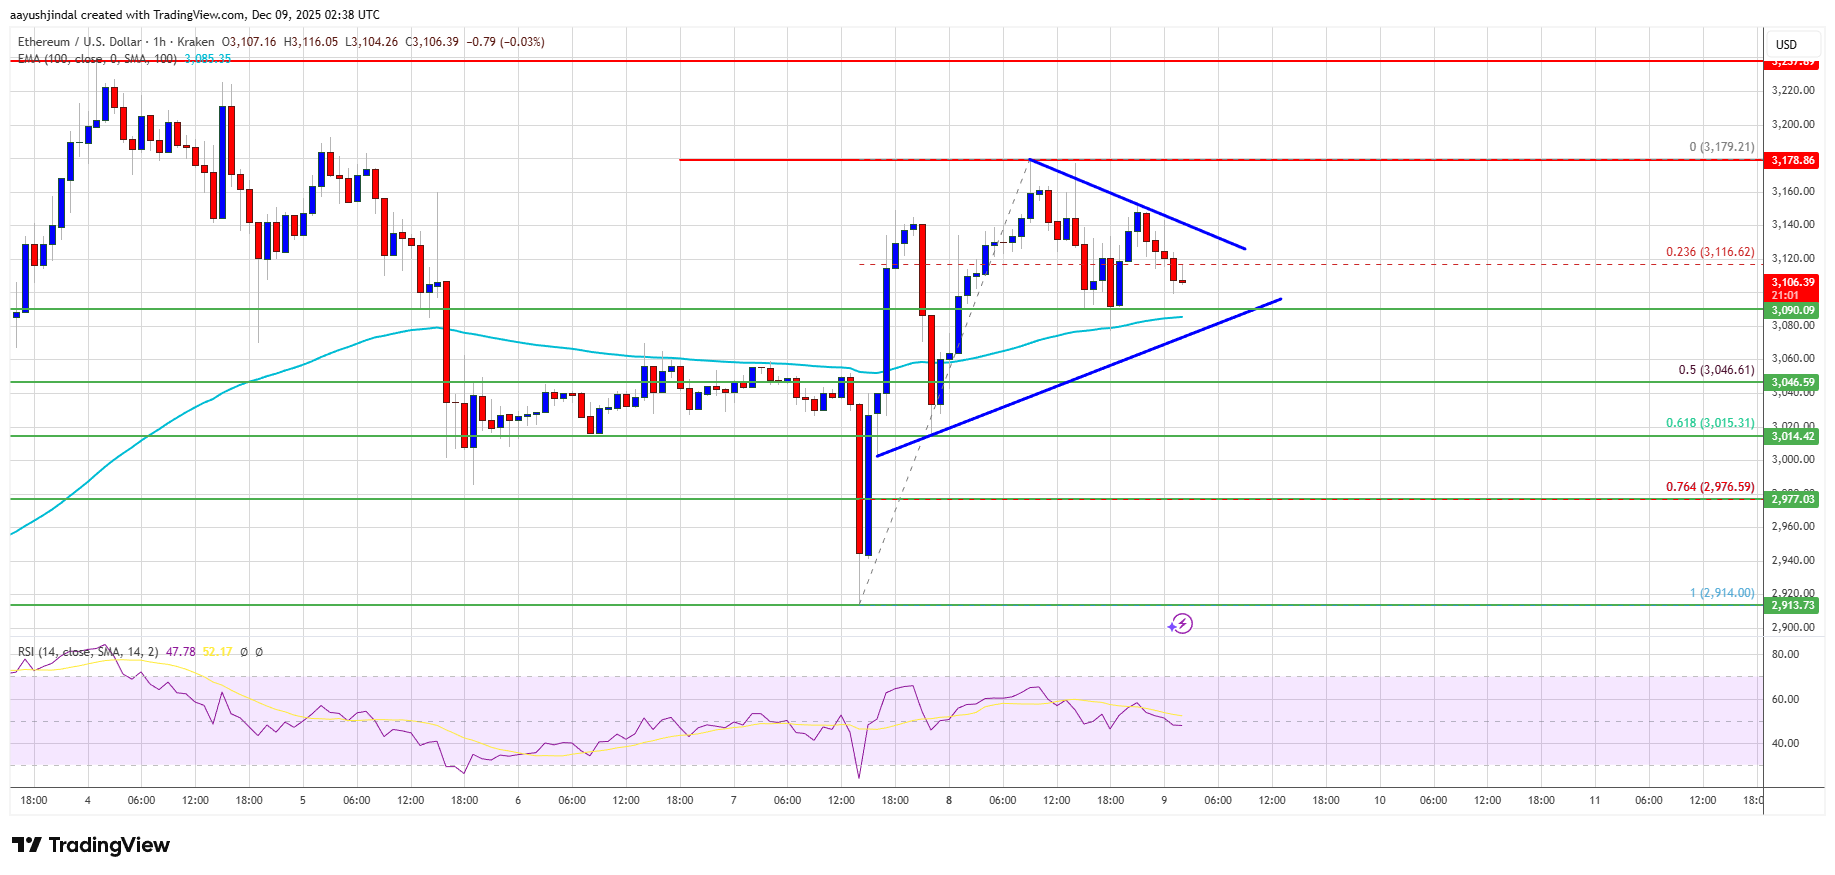
Amid this performance, analyst Ali Martinez suggested that “it’s time to pay attention to ETH,” noting that it nears a key level that could push the price to higher zones. Per the chart, Ethereum briefly broke out of its two-month downtrend line, which has served as resistance since early October.

Over this period, the King of Altcoins has attempted to break out of this level twice, but has ultimately been rejected during each attempt. On Monday morning, ETH briefly broke above the trendline before being rejected a third time.

However, if Ethereum reclaims the $3,120-$3,130 levels and turns the downtrend into support, it could build the base for a retest of the $3,200-$3,300 horizontal levels, which marks the lower boundary of its Q3 and early Q4 price range.

Meanwhile, Rekt Capital asserted that Ethereum Dominance (ETHDOM) continues to move within its macro consolidation range, holding support at the 11.67% level. He previously affirmed that if “ETHDOM can maintain itself above 10.05% then it should be positioned for higher market dominance levels over time.”

The analyst added that although history suggests a potential 2.5% drop to the consolidation range lows, this dip would occur “in the context of a macro move to 18%-20%” in the future.

As of this writing, Ethereum is trading at $3,114, a 13.7% increase on the weekly timeframe.

Ethereum, eth, ethusdt

Did 2025 Mark A Bear Market For Bitcoin? Predictions Point To A $150,000 Rally In 2026

9 December 2025 at 02:00

As Bitcoin (BTC) experienced significant volatility throughout the year, reaching new all-time highs (ATHs) before enduring sharp corrections of up to 30%, the cryptocurrency community has become increasingly polarized regarding its future direction. 

Many analysts are raising concerns about a potential bear market emerging in 2026; however, market expert Shanaka Anslem has offered a different perspective on social media platform X (formerly Twitter), questioning whether 2025 has already represented the real bear market.

A Sign Of Cycle Change

In his analysis, Anslem highlights key evidence. For the first time in history, Bitcoin breached its all-time high prior to the Halving event in April of this year, which he argues isn’t a bullish signal but rather an indication of the cycle inverting. 

According to him, 2024 should not be viewed as the beginning of a new bull run; instead, it was a period of what he calls “political repricing” as the market factored in a pro-crypto administration with President Donald Trump’s reelection. 

The characteristics of a bear market have been evident in 2025, according to Anslem. Bitcoin’s dominance has reached multi-year highs while altcoins continue to struggle, leading to quarter-after-quarter declines in their values. 

Additionally, a massive $3.5 billion in exchange-traded fund (ETF) outflows occurred within just one month. This year saw a significant 29% drawdown from its October highs, paired with extreme fear readings on various sentiment indices.

Anslem insists that while the four-year Halving cycle remains relevant, its impact has evolved. With $120 billion in ETF interconnected with the Federal Reserve’s (Fed) liquidity, the Halving continues to dictate BTC’s supply, but demand now aligns with broader economic narratives rather than the more crypto-specific factors.

Major Bitcoin Rally Ahead? 

What does Anslem’s “cycle inversion” theory implies for 2026? If the bear market has already transpired, masked by nominal highs, the next logical phase might be a genuine blow-off top. 

His predictions suggest Bitcoin’s price could soar to between $150,000 and $200,000, particularly as global liquidity continues to expand and directs capital toward hard assets. Anslem believes that many in the market are currently positioned for a downturn that has already occurred.

However, dissenting opinions exist. Analyst Mr. Wall Street argues that the bottom for Bitcoin has not yet arrived and won’t be realized in the coming weeks or months. 

He highlights that the critical support level has been breached, indicated by the weekly exponential moving-average (EMA50) closing below the threshold. 

He asserts that the market has entered the early stages of a substantial bear market, predicting that it will only abate once Bitcoin reaches the $54,000 to $60,000 range, which he expects might occur in the fourth quarter of 2026. 

Despite this bearish outlook, he remains cautiously optimistic about Bitcoin in the short term. He expects a potential upward movement to retest the EMA50 Weekly, which currently stands at approximately $100,000, while maintaining that mid-term targets are much lower. 

Bitcoin

At the time of writing, BTC was trading at $90,352, which represents a 28% difference between current valuations and ATH levels. 

Featured image from DALL-E, chart from TradingView.com 

Bitcoin Active Addresses Slide As ETF Era Rewires Market Participation — Here’s Why

9 December 2025 at 01:00

Bitcoin’s on-chain activity has shown a sharp slowdown since spot Bitcoin exchange-traded funds (ETFs) launched. While institutional inflows into these products have accelerated, the number of active BTC addresses has declined. As Wall Street embraces BTC exposure, the network’s grassroots participation appears to be undergoing a significant transformation.

In an X post, the CEO of SwanDesk, financial analyst Jacob King, pointed out that Bitcoin active addresses have been in a steady decline since the US spot BTC ETFs launched in January 2024, and the irony is obvious.

Why Retail Participation Shows Signs Of Fatigue

 For years, BTC maximalists have pushed for Wall Street adoption, believing institutional involvement would unlock the next wave of mass usage. Instead, on-chain participation has dropped sharply as retail lost interest.

King noted that these Bitcoiners have piled into the ETF for a quick, early FOMO bump, and then bailed, leaving behind a market where the asset is increasingly traded by proxy. According to King, ETF investing kills BTC’s core principles. While investors no longer hold or control their own assets as banks do, which is the very system BTC was designed to challenge, greed always beats ideology.

Bitcoin

Market watcher Crypto Seth has revealed that the net inflows into BlackRock and Fidelity’s spot BTC ETFs have been relatively subdued since October 10, when the largest liquidation events happened. Seth believes that this might turn into a momentum reversal soon, as the US stock market is at 1% below new highs despite retail sentiment remaining stuck in extreme fear.

Seth also pointed out that the macro backdrop is shifting in BTC’s favor. This is because the Federal Reserve ended its Quantitative Tightening (QT) program on December 1, 2025, wrapping up a multi-year effort that shaved nearly $3 trillion from the balance sheet since 2022. 

Since the US Fed rate is still at 4.00%, more interest rate cuts are on the horizon, which is higher than both Europe and China. The BlackRock iShares BTC Trust (IBIT), which was launched in January 2024, is currently the firm’s most profitable exchange-traded fund (ETF) based on annual fee revenue, despite being less than two years old.

Unlocking Bitcoin Without Compromising Its Core Principles

Bitcoin is seeing key initiatives that improve its ecosystem. Every market cycle that has promise to unlock Bitcoin for decentralized finance (DeFi), RioSwap is one of the few products built on infrastructure that was capable of unlocking it in a truly decentralized way. 

According to Mintlayer, this was powered by Mintlayer’s native HTLC architecture, as RioSwap introduces a Decentralized Exchange (DEX) that allows BTC to move directly into decentralized markets without wrapping, unbridging, and is fully in the user’s control. With the RioSwap testnet now live, Mintlayer sees this as the start of a new liquidity phase for BTC where the asset will become an active participant in the decentralized market on its own terms.

Bitcoin

Dogecoin (DOGE) Knocked Back From Resistance—Can Bulls Regain Control?

9 December 2025 at 00:08

Dogecoin started a recovery wave above the $0.140 zone against the US Dollar. DOGE is now facing hurdles near $0.1450 and might struggle to continue higher.

  • DOGE price started a decent upward move above $0.140 and $0.1410.
  • The price is trading above the $0.140 level and the 100-hourly simple moving average.
  • There is a bullish trend line forming with support at $0.1405 on the hourly chart of the DOGE/USD pair (data source from Kraken).
  • The price could extend losses if it stays below $0.140 and $0.1380.

Dogecoin Price Faces Resistance

Dogecoin price started a recovery wave from the $0.1350 zone, like Bitcoin and Ethereum. DOGE climbed above the $0.1380 and $0.140 resistance levels.

There was a decent upward move above the 23.6% Fib retracement level of the downward move from the $0.1532 swing high to the $0.1351 low. However, the bears seem to be active near the $0.1440 and $0.1450 levels. Dogecoin price is now trading above the $0.1410 level and the 100-hourly simple moving average. There is also a bullish trend line forming with support at $0.1405 on the hourly chart of the DOGE/USD pair.

If there is a recovery wave, immediate resistance on the upside is near the $0.1450 level and the 50% Fib retracement level of the downward move from the $0.1532 swing high to the $0.1351 low. The first major resistance for the bulls could be near the $0.1490 level.

Dogecoin Price

The next major resistance is near the $0.1530 level. A close above the $0.1530 resistance might send the price toward the $0.1620 resistance. Any more gains might send the price toward the $0.170 level. The next major stop for the bulls might be $0.1720.

Another Decline In DOGE?

If DOGE’s price fails to climb above the $0.1450 level, it could continue to move down. Initial support on the downside is near the $0.140 level and the trend line. The next major support is near the $0.1380 level.

The main support sits at $0.1350. If there is a downside break below the $0.1350 support, the price could decline further. In the stated case, the price might slide toward the $0.1265 level or even $0.1250 in the near term.

Technical Indicators

Hourly MACD – The MACD for DOGE/USD is now losing momentum in the bullish zone.

Hourly RSI (Relative Strength Index) – The RSI for DOGE/USD is now below the 50 level.

Major Support Levels – $0.1400 and $0.1350.

Major Resistance Levels – $0.1450 and $0.1530.

XRP Selloff: Whales Shed Coins Worth $1 Billion In A Week

9 December 2025 at 00:00

On-chain data shows the XRP whales have distributed a significant amount during the past week, a sign of negative sentiment among large holders.

XRP Whales Have Shed 510 Million Tokens From Their Holdings

As announced by analyst Ali Martinez in a new post on X, XRP whales have participated in a notable amount of selling recently. A “whale” is typically defined as an XRP investor holding between 1 million and 10 million tokens. At the current exchange rate of the cryptocurrency, this range converts to $2 million at the lower end and $20 million at the upper one.

Given the size of the range, the only investors who would qualify for the cohort would be the big-money hands. These holders can carry some influence in the market, making the group a key one for the network.

Now, here is the chart from on-chain analytics firm Santiment shared by Martinez that shows how the supply of the XRP whales has changed over the last few months:

XRP Whales

As displayed in the above graph, the XRP whale supply has been following a downtrend since mid-November, indicating that the large holders have been distributing. The trend has continued during the past week, with entities belonging to the group collectively selling 510 million coins, worth more than $2 billion at the latest price.

At the same time as the selloff over the last few weeks, XRP has witnessed some net bearish price action, implying that the whales may have had a role to play in it.

Given that these humongous entities haven’t shown any signs of slowing down recently, it’s possible that the coin could see a further drop. It only remains to be seen, however, how whale behavior will develop in the coming days.

In some other news, XRP could be set up for a 16% move according to a technical analysis (TA) pattern, as Martinez has pointed out in another X post.

XRP Triangle

From the chart, it’s visible that XRP has roughly been traveling inside a Symmetrical Triangle on the 1-hour timeframe since November. A Symmetrical Triangle is a consolidation channel that involves two converging trendlines approaching each other at an equal and opposite slope.

The coin is already more than halfway through the channel, meaning that its range is getting narrow. A narrower range means retests of the support and resistance levels become more frequent, making either more probable.

Based on the height of the channel, the analyst has noted that a breakout could lead to a 16% move for XRP. It now remains to be seen which direction the asset will exit, and whether the pattern will hold.

XRP Price

XRP has again found a rebound since its retest of the $2.00 level, as its price is now back at $2.09.

XRP Price Chart

Yesterday — 8 December 2025NewsBTC

XRP Price Hesitates at Resistance—Are Bulls Running Out of Time?

8 December 2025 at 23:18

XRP price started a recovery wave above $2.080. The price is now consolidating and might struggle to clear the $2.10 resistance.

  • XRP price started a recovery wave above the $2.060 zone.
  • The price is now trading above $2.050 and the 100-hourly Simple Moving Average.
  • There is a bearish trend line forming with resistance at $2.0850 on the hourly chart of the XRP/USD pair (data source from Kraken).
  • The pair could continue to move up if it settles above $2.10.

XRP Price Faces Rejection

XRP price remained supported above $2.020 and started a recovery wave, like Bitcoin and Ethereum. The price was able to climb above $2.050 and $2.060 to enter a positive zone.

There was also a spike above the 50% Fib retracement level of the downward move from the $2.2130 swing high to the $1.990 low. The bears defended a close above the $2.10 level and the price reacted to the downside. There is also a bearish trend line forming with resistance at $2.0850 on the hourly chart of the XRP/USD pair.

The price is now trading above $2.050 and the 100-hourly Simple Moving Average. If there is a fresh upward move, the price might face resistance near the $2.10 level and the trend line. The first major resistance is near the $2.120 level.

XRP Price

A close above $2.120 could send the price to $2.160 and the 76.4% Fib retracement level of the downward move from the $2.2130 swing high to the $1.990 low. The next hurdle sits at $2.20. A clear move above the $2.20 resistance might send the price toward the $2.2650 resistance. Any more gains might send the price toward the $2.280 resistance. The next major hurdle for the bulls might be near $2.350.

Another Drop?

If XRP fails to clear the $2.10 resistance zone, it could start a fresh decline. Initial support on the downside is near the $2.050 level. The next major support is near the $2.0150 level.

If there is a downside break and a close below the $2.0150 level, the price might continue to decline toward $1.950. The next major support sits near the $1.920 zone, below which the price could continue lower toward $1.850.

Technical Indicators

Hourly MACD – The MACD for XRP/USD is now gaining pace in the bearish zone.

Hourly RSI (Relative Strength Index) – The RSI for XRP/USD is now below the 50 level.

Major Support Levels – $2.050 and $2.0150.

Major Resistance Levels – $2.10 and $2.160.

Banking Meets Bitcoin: French Banking Giant Offers Crypto To Millions

8 December 2025 at 23:00

Based on reports, France’s second-largest banking group has started letting customers trade crypto in its mobile apps. BPCE opened the service on Monday for selected users of Banque Populaire and Caisse d’Épargne.

Around 2 million people in four regional banks can now buy and sell Bitcoin, Ethereum, Solana and USDC through the apps.

Measured Limited Rollout

The launch covers the Provence-Alpes-Côte-d’Azur branch of Caisse d’Épargne and the Île-de-France division of Banque Populaire, among others.

BPCE has said it will watch early use closely. That controlled approach is meant to catch technical issues and fix the user flow before wider availability. If all goes to plan, the bank intends to extend the feature across its 25 remaining regional entities by 2026, reaching a retail base of roughly 12 million clients.

🔴 EXCLUSIVE @TheBigWhale_: BPCE now lets customers buy crypto assets.

Starting this Monday, the French bank’s customers will be able to purchase BTC, ETH, SOL, and USDC: https://t.co/J2C4UnWi68@GroupeBPCE, one of Europe’s leading banks, is rolling out this service in a first… pic.twitter.com/3olRgVoot4

— Raphaël Bloch 🐳 (@Raph_Bloch) December 6, 2025

BPCE has set up a separate unit, Hexarq, to handle customer crypto accounts. Each user will have a dedicated in-app digital-asset account that is managed by Hexarq rather than being routed to outside exchanges or third-party wallets.

The arrangement keeps custody within the bank’s ecosystem. It also comes with a monthly fee of €2.99 and a trading commission of 1.5% on transactions.

Banks Face Fintech Pressure

Reports have pointed to the rise of fintech rivals as a driving reason for the move. Companies such as Revolut, Deblock, Bitstack and Trade Republic built early crypto offerings and attracted many retail users.

Traditional lenders now risk losing younger customers unless they match those services. Some banks in Europe already offer in-app trading: BBVA supports Bitcoin and Ethereum,

Openbank under Santander lists five cryptocurrencies, and Raiffeisen in Vienna provides similar features through a tie-up with Bitpanda. BPCE’s entry follows this trend and could push other big lenders to act.

The fees set by BPCE are higher than what many crypto-first platforms charge. Yet many consumers may accept that in exchange for having crypto tied directly to their bank accounts and day-to-day services. For many users, trust and convenience matter more than the lowest possible fee.

Featured image from Unsplash, chart from TradingView

Ethereum Price Cooling Off: Healthy Consolidation or Momentum Fading?

8 December 2025 at 22:18

Ethereum price started a fresh increase above $3,050. ETH is now consolidating gains and might aim for more gains if it clears the $3,180 resistance.

  • Ethereum started a fresh increase above the $3,020 and $3,050 levels.
  • The price is trading above $3,075 and the 100-hourly Simple Moving Average.
  • There is a short-term contracting triangle forming with resistance at $3,150 on the hourly chart of ETH/USD (data feed via Kraken).
  • The pair could continue to move up if it settles above the $3,180 zone.

Ethereum Price Faces Resistance

Ethereum price managed to stay above $2,950 and started a fresh increase, like Bitcoin. ETH price gained strength for a move above the $3,020 and $3,050 resistance levels.

However, the bears were active below $3,200. A high was formed at $3,179 and the price is now consolidating. There was a minor drop below the 23.6% Fib retracement level of the upward wave from the $2,914 swing low to the $3,179 low.

Ethereum price is now trading above $3,075 and the 100-hourly Simple Moving Average. If there is another upward move, the price could face resistance near the $3,150 level. There is also a short-term contracting triangle forming with resistance at $3,150 on the hourly chart of ETH/USD.

Ethereum Price

The next key resistance is near the $3,180 level. The first major resistance is near the $3,220 level. A clear move above the $3,220 resistance might send the price toward the $3,350 resistance. An upside break above the $3,350 region might call for more gains in the coming days. In the stated case, Ether could rise toward the $3,450 resistance zone or even $3,500 in the near term.

Downside Break In ETH?

If Ethereum fails to clear the $3,180 resistance, it could start a fresh decline. Initial support on the downside is near the $3,080 level. The first major support sits near the $3,015 zone and the 61.8% Fib retracement level of the upward wave from the $2,914 swing low to the $3,179 low.

A clear move below the $3,015 support might push the price toward the $2,975 support. Any more losses might send the price toward the $2,920 region. The next key support sits at $2,840 and $2,820.

Technical Indicators

Hourly MACDThe MACD for ETH/USD is losing momentum in the bullish zone.

Hourly RSIThe RSI for ETH/USD is now below the 50 zone.

Major Support Level – $3,015

Major Resistance Level – $3,180

Ethereum Inches Toward A Critical Decision Point: Bullish Break Or Deeper Dive?

8 December 2025 at 22:00

Ethereum is edging closer to a major decision point as price action tightens between key support and resistance levels. Momentum is building, but the market now awaits to see whether bulls can force a breakout or if a deeper pullback ensues.

Ethereum Holds The Line: $3,000 Support Ignites Fresh Upside

According to a recent update by analyst Ted Pillows, Ethereum has demonstrated resilience in the face of recent market volatility. The asset successfully held up the crucial $3,000 level and is now showing signs of moving higher, suggesting that this level remains a strong foundation for the current price action.

Ted highlighted a significant external factor contributing to the upward pressure: some large whales have reportedly opened ETH long positions. This institutional or large-scale buying interest has been identified as a major driver fueling the current price move, suggesting that deep-pocketed investors anticipate further appreciation.

Ethereum

The analyst provided a clear trigger zone for the next significant leg up. If ETH can break decisively above the $3,300–$3,400 level, it will serve as structural confirmation, expected to trigger a swift rally to the next resistance zone between $3,700 and $3,800.

However, Ted also outlined the risk scenario. A failure to break above the $3,300–$3,400 zone could result in the asset turning back down for another retest of the foundational $3,000 zone.

Upside Reaction Expected From Major Support Zone

In an earlier update, More Crypto Online highlighted that Ethereum is currently reacting from a major weekly support zone, suggesting that an upside move remains likely. However, the analysis also noted the possibility of one more low before a stronger reaction takes shape, keeping both scenarios firmly in play.

The key resistance area above remains the most important region to watch. Once ETH approaches this zone, the market will essentially be forced to decide which direction it will take over. Both bullish and bearish scenarios remain valid based on the broader market structure. 

What ultimately shifts the probability toward one side is how ETH behaves at these critical levels. A sustained hold and strong reaction could reinforce the bullish case, while weakness or rejection could signal the opposite.

For now, the market is still in the phase before major confirmation. If Ethereum loses support and forms a clear five-wave decline to the downside, the bearish “white scenario” becomes the leading outlook. Until then, the chart simply outlines the conditions that will reveal the market’s preferred path once price makes its next decisive move.

Ethereum

Bitcoin Price Stumbles at $92K: Are Bears Gaining the Upper Hand?

8 December 2025 at 21:37

Bitcoin price struggled to stay above $92,000. BTC is now consolidating gains and might dip again if there is a clear move below $89,500.

  • Bitcoin started a downside correction from the $92,500 zone.
  • The price is trading below $91,000 and the 100 hourly Simple moving average.
  • There is a contracting triangle forming with support at $90,000 on the hourly chart of the BTC/USD pair (data feed from Kraken).
  • The pair might continue to move up if it settles above the $92,500 zone.

Bitcoin Price Dips Again

Bitcoin price managed to stay above the $90,000 zone and started a fresh increase. BTC gained strength for a move above the $91,500 and $92,000 levels.

However, the bears were active near $92,500. A high was formed at $92,269 and the price recently corrected some gains. There was a drop below the 50% Fib retracement level of the upward move from the $87,777 swing low to the $92,269 high.

However, the bulls were active near the $90,000 support. Bitcoin is now trading below $90,000 and the 100 hourly Simple moving average. Besides, there is a contracting triangle forming with support at $90,000 on the hourly chart of the BTC/USD pair.

Bitcoin Price

If the bulls remain in action, the price could attempt another increase. Immediate resistance is near the $90,800 level. The first key resistance is near the $91,200 level. The next resistance could be $92,000. A close above the $92,000 resistance might send the price further higher. In the stated case, the price could rise and test the $92,500 resistance. Any more gains might send the price toward the $93,500 level. The next barrier for the bulls could be $94,200 and $94,500.

More Losses In BTC?

If Bitcoin fails to rise above the $92,000 resistance zone, it could start another decline. Immediate support is near the $90,000 level. The first major support is near the $89,500 level and the 61.8% Fib retracement level of the upward move from the $87,777 swing low to the $92,269 high.

The next support is now near the $88,800 zone. Any more losses might send the price toward the $87,500 support in the near term. The main support sits at $86,500, below which BTC might accelerate lower in the near term.

Technical indicators:

Hourly MACD – The MACD is now gaining pace in the bearish zone.

Hourly RSI (Relative Strength Index) – The RSI for BTC/USD is now below the 50 level.

Major Support Levels – $90,000, followed by $89,500.

Major Resistance Levels – $91,200 and $92,000.

Dogecoin Flirts With Long-Term Breakdown At Monthly Ichimoku Floor

8 December 2025 at 21:00

Dogecoin is trading directly on top of a long-term support band defined by its monthly Ichimoku cloud, according to a chart shared by crypto analyst Cantonese Cat (@cantonmeow) via X. The analyst summed it up by saying DOGE is “licking the bottom of its monthly Ichimoku cloud.”

Dogecoin Hovers At Key Monthly Ichimoku Support

The 1-month DOGE/USDT chart on Binance, captured on 7 December 2025, shows Dogecoin at around $0.14050, down about 3.8% for the month so far. The monthly candle opened at $0.14599, reached a high of $0.15340 and a low of $0.13177, underlining relatively tight but clearly downward monthly price action.

Dogecoin Ichimoku cloud analysis

On the chart, the Ichimoku indicator uses standard 9-26-52-26 settings. The fast conversion line (Tenkan-sen) currently sits near $0.20092, and the base line (Kijun-sen) around $0.27491. The leading spans that form the cloud are plotted near $0.23792 and $0.26674, producing a forward-projected red Kumo that extends well into 2026.

With DOGE at roughly $0.14, price is trading far below both Tenkan and Kijun and is positioned just at the lower boundary of the projected cloud.

That lower cloud edge, which bends into the low-$0.12 to mid-$0.13 area before flattening, is the zone highlighted by Cantonese Cat. The October monthly candle shows a long lower wick that briefly pierced deep below, toward the mid-$0.06 region, but closed back above the cloud floor. The current, still-forming candle again tests just under that boundary and is, at the time of the snapshot, holding marginally above it around $0.14.

For Ichimoku practitioners, the lower Kumo boundary is often treated as the final structural support in a still-constructive higher-timeframe trend. In this case, the implication of the chart is clear: as long as monthly closes remain above roughly $0.12–$0.14, the multi-year structure can still be interpreted as a long-term bottoming zone rather than a completed breakdown.

In other words, for this analyst, Dogecoin’s prospective bottom hinges on whether that monthly Ichimoku support band in the $0.12–$0.14 range continues to hold.

DOGE Sits Inside Key Support Zone In The Weekly Chart

On the weekly DOGE/USDT chart, price is sitting directly in the highlighted red support zone around $0.135–$0.145. This band coincides with a prior multi-week consolidation area and a former horizontal resistance level that capped price before the last major breakout.

Over the past several candles, weekly closes have clustered inside this zone while wicks repeatedly probe through it, underlining how aggressively the market is testing this level. The current candle trades near $0.14392, keeping Dogecoin inside the upper half of the support block but still below the 20-, 50-, 100- and 200-week EMAs, with the 200-week EMA at $0.15563 now just overhead.

At the same time, DOGE has clearly lost the rising black trendline that had connected higher lows from the left side of the chart. After breaking beneath this trend support, the DOGE price dropped sharply. The intersection of the broken trendline and the nearby moving averages now forms an overhead supply region, meaning price is compressing between these levels and the red horizontal support zone.

Dogecoin price

Bitcoin Alert: Saylor Signals New Purchase As His Favorite Indicator Returns

8 December 2025 at 20:00

Michael Saylor’s hint about a fresh Bitcoin purchase has renewed talk among traders and investors, even as on-chain stress signals point to a tougher stretch for the network. The mix of heavy buying by public firms and signs of miner strain is drawing attention from both bulls and bears.

Saylor’s Tracker Signals

According to a StrategyTracker chart shared by Michael Saylor, Strategy holds about 650,000 BTC with a portfolio value near $58 billion. The chart lists an average purchase price of $74,436 and shows 88 confirmed buy events over time.

Saylor captioned the image “Back to Orange Dots?” — a short, familiar cue that has often come before a new accumulation round.

Strategy’s most recent reported move was a 130 BTC buy, which fits the company’s long habit of adding during periods of market fear. That pattern matters because when an entity repeatedly buys through downswings, it shapes how other investors react.

₿ack to Orange Dots? pic.twitter.com/npB0NWSZ52

— Michael Saylor (@saylor) December 7, 2025

Corporate Buying Continues

Based on reports from BitcoinTreasuries.NET, the top 100 public firms now hold about 1,059,453 BTC combined. ABTC reportedly added 363 BTC, the largest increase this week, while Cango Inc. purchased 130.6 BTC.

Other names cited in recent filings include Bitdeer, BitFuFu, Hyperscale Data, Genius Group, and Bitcoin Hodl Co. These moves show that some companies keep expanding reserves even when prices wobble.

For market watchers, steady corporate accumulation can be a calming force, though it does not erase broader sell pressure.

On-Chain Stress Indicators

According to Glassnode charts shared by the Bitcoin Archive, the Hash Ribbon has shifted bearish again, a sign that some miners are facing stress or even pausing operations.

Short-Term Holder NUPL has fallen below zero, meaning many recent buyers are holding coins at a loss. Historically, episodes where miners are squeezed at the same time new holders are underwater have appeared near significant lows.

That outcome is not certain, but the combination of technical miner strain and unrealized losses among short-term wallets is the kind of setup traders watch closely.

What Traders Are Watching Now

Traders are monitoring whether the miner stress and losses among fresh buyers will coincide with renewed buying by big holders.

Some expect that corporate purchases and purchases by Strategy could blunt downside and spark a rebound. Others remain cautious because on-chain indicators point to real strain.

Market action around major events, like central bank announcements, has also shown Bitcoin can stall before policy moves and then move sharply after.

Featured image from Unsplash, chart from TradingView

Smart Whales Align: Top Performers Go All-In On Ethereum Long Positions With Over $425M in Exposure

8 December 2025 at 19:00

Ethereum has reclaimed the $3,150 level after a volatile stretch, offering a rare sign of strength in an otherwise uncertain market. The broader crypto landscape remains sharply divided: some analysts argue that ETH and the rest of the market still face downward continuation, potentially setting new local lows, while others believe this correction is simply a reset before a much larger bull cycle—possibly extending into 2026.

Yet one signal stands out clearly amid the noise: smart whales are unanimously going long on ETH. On-chain data shows that several of the most profitable and consistent whale traders—each with tens of millions in realized gains—have opened substantial long positions, collectively exceeding hundreds of millions of dollars. Their coordinated behavior indicates confidence that Ethereum’s recent lows represent opportunity rather than danger.

This alignment among top-performing whales introduces a compelling counterpoint to bearish narratives. While retail sentiment remains fragile, the most sophisticated market participants appear to be positioning for a larger move ahead. As Ethereum stabilizes above $3,150, the question now becomes whether whale conviction will prove to be early—or correct.

Top Performers Load Up on Ethereum

According to Hyperdash data shared by Lookonchain, some of the most successful and influential whales in the market are aggressively accumulating Ethereum—sending a strong signal that high-conviction players expect upside ahead.

One of the most notable is BitcoinOG, the trader widely recognized for shorting the market during the violent 10/10 crash, a move that earned him significant credibility. With a total realized PNL of $105 million, BitcoinOG is now positioned firmly on the bullish side, holding 54,277 ETH worth approximately $169.48 million.

BitcoinOG Ethereum Position | Source: Hyperdash

Another major player is the well-known Anti-CZ whale, named for his historical pattern of taking the opposite side of positions favored by Binance founder Changpeng Zhao. With an impressive $58.8 million in total PNL, this whale is currently long 62,156 ETH—a massive $194 million position. His trades have often been early indicators of broad market direction, adding weight to this shift toward bullish exposure.

Finally, pension-usdt.eth, a consistently profitable whale address with $16.3 million in realized gains, is long 20,000 ETH valued at $62.5 million.

Taken together, these positions reflect a unified stance among top-performing whales: despite market uncertainty, they are positioning for Ethereum strength.

Weekly Structure Shows Early Signs of Stabilization

Ethereum’s weekly chart reveals a market attempting to regain its footing after a sharp multi-week decline from the $4,500 region. The recent reclaim of $3,150 is a meaningful development, as this level aligns closely with prior weekly support from mid-2024 and sits just above the 50-week moving average—an area that often acts as a trend-defining zone. ETH briefly dipped below this region during the November selloff, but buyers stepped in aggressively, producing a strong weekly wick that signals demand at lower levels.

ETH consolidates around critical level Source: ETHUSDT chart on TradingView

Despite this recovery attempt, ETH remains below key resistance levels. The 20-week and 100-week moving averages are positioned above the current price and converging, creating a zone of potential rejection unless momentum strengthens. For now, ETH is trading in a transitional structure: no longer trending downward aggressively, but not yet showing a confirmed bullish reversal on high timeframes.

Volume patterns also support this interpretation. Selling volume has diminished compared to the capitulation phase, while recent green candles show moderate but steady buying interest—suggesting accumulation rather than full risk-on behavior.

If ETH can establish consecutive weekly closes above $3,200–$3,300, the chart opens the door for a retest of the $3,600–$3,800 range. Failure to hold $3,150, however, risks another move toward $2,800 support.

Featured image from ChatGPT, chart from TradingView.com

Solana Price Faces Critical Test Near $140 While Analysts Track KOL Indicators and Liquidity Shifts

8 December 2025 at 18:00

The Solana price is entering a decisive phase as its action tightens below the $140 barrier, a level that has repeatedly capped attempts at recovery. After months of sustained selling pressure and increased whale activity, the market is now watching whether Solana can hold its recent gains or slip back toward lower support zones.

Related Reading: What’s Happening With XRP And Why Did Its Spot ETF Crash 20%?

This comes at a time when analysts, on-chain trackers, and market participants are also assessing the broader influence of KOL (Key Opinion Leader) predictions, many of which have dramatically misaligned with Solana’s actual price trajectory over the past two months.

Solana SOLUSD_2025-12-08_13-43-26

Solana Price Stalls Below Key Resistance

SOL is currently trading just under $138 after a modest recovery from the $128 low. Technical data indicates that the Solana price is struggling beneath a dense cluster of moving averages, with the 20-day EMA at $138 repeatedly rejecting upward attempts.

The intraday structure remains corrective, as rallies tend to fade before gaining traction. A sustained close above $140 remains the key threshold. Clearing it could open immediate targets near $142 and later $150. However, failure at this level risks renewed pullbacks toward $132, and deeper weakness could revisit $128 region.

Short-term indicators offer mixed signals. The hourly RSI remains above 50, while the MACD leans slightly bullish, suggesting that momentum exists but lacks conviction.

KOL Predictions Scrutinized as Market Cap Declines

Solana’s market cap has fallen roughly 40.5% over the past two months, contradicting bullish influencer claims made earlier in the quarter. Data from Santiment shows how traders predict a near-term all-time high, only for SOL to continue its downward slide.

This divergence is leading analysts to lean more heavily on tools like the KOLs_Tracker, which ranks influencer performance and helps identify when certain calls may function as contrarian signals.

The gap between predictions and actual performance has added an extra layer of volatility to Solana’s narrative, as traders use social sentiment data alongside traditional indicators to gauge market direction. With network activity and flows still subdued, traders are approaching such predictions with increased caution.

Liquidity Shifts Highlight Whale Influence

On-chain activity shows notable movement from large holders, including a whale that recently transferred 100,000 SOL to Binance, part of a broader trend that has seen over 600,000 SOL moved to exchanges since April.

While not enough to move the market on its own, such consistent selling reinforces resistance zones and limits recovery momentum. The address still holds more than 700,000 SOL, meaning additional liquidity could enter the market if the Solana price approaches previously favored selling levels.

Related Reading: Ethereum Founder Breaks Silence With Major Upgrade Proposal

As the Solana price deals with this tight range, market participants remain focused on whether buyers can establish a base above $138–$140. Until then, resistance remains firm, sentiment remains cautious, and the path forward depends on both technical confirmation and the broader crypto market direction.

Cover image from ChatGPT, SOLUSD chart from Tradingview

Bitcoin RSI Shows Shocking Similarities To 2012-2015, But What Happened Last Time?

8 December 2025 at 17:00

A crypto analyst has revisited long-term charts from 2012-2015, noting that the current Bitcoin (BTC) cycle shows striking similarities to this timeline, in terms of the Relative Strength Index (RSI) and price action. During the 2017-2015 bull run, BTC experienced one of the strongest multi-year advances before bottoming out. The market expert claims that the same sequence of peaks and pullbacks observed in that timeline is now unfolding again in this cycle. 

Bitcoin RSI Comparison Signals Bottoming Structure

Bitcoin’s latest momentum study by crypto analyst Tony Severino has drawn significant attention from market watchers. In his X post on December 6, Severino highlighted surprising similarities between the RSI trend and price movements of the 2023-2026 cycle and those observed from 2012 to 2015. 

His comparison focuses on the timing of several major points that appeared in both cycles. These include the moment a price bottom began to form, the first price peak, a subsequent momentum peak, and finally a Bearish Divergence that typically precedes deeper corrective phases.

Severino shared a chart from the 2012-2015 cycle showing that Bitcoin’s RSI had gradually climbed, with several short bursts of sharper upward momentum along the way. Eventually, momentum faded, and the indicator declined for an extended period before settling in a mid-range zone at the 44 level. 

Bitcoin

In the current cycle, which began in 2023, the RSI also climbed sharply before reaching a notable peak. Since then, the indicator has been gradually declining, currently sitting around 38. This level is similar to the mid-range RSI values observed in the former cycle before Bitcoin advanced again. 

Sharing a second chart, Severino also pointed to Bitcoin’s price action relative to its RSI performance across both cycles. During the earlier cycle, Bitcoin’s price sat around $233.54, while in the recent cycle, it has declined to $89,352. The analyst argues that the alignment between the RSI movements and price action in both timelines strengthens his theory that Bitcoin may be approaching a meaningful bottom soon. 

Severino also suggested that if history repeats in the 2023-2026 cycle, traders could be looking at the early stages of a year-long accumulation phase, similar to what played out a decade ago. Nevertheless, he acknowledged that there is no guarantee that the current cycle will mirror past patterns completely. 

Analyst Flags New BTC Bullish Crossover

Crypto analyst AO has shared a more optimistic outlook for Bitcoin, highlighting the formation of a Bullish Crossover—a key technical signal that has historically preceded significant price surges. According to him, each time the Stochastic RSI on US10Y*CN10Y experiences a Bullish Crossover, Bitcoin enters a significant bull run.

AO presented a chart showcasing four previous Bullish Crossovers, each followed by a massive price increase. The first crossover appeared in 2013 and coincided with an early surge. The second came in 2017, marking the start of a multi-month bull run. The third occurred in late 2020, shortly before BTC’s record-breaking run in 2021. The most recent signal has not emerged in 2025, suggesting the potential for a similar upward move.

Bitcoin

Ethereum Loses Momentum While OI Holds Steady: Binance Data Shows A Market Reset

8 December 2025 at 16:00

Ethereum has reclaimed the $3,150 level after a volatile Sunday session that left traders divided on what comes next. Some analysts warn that ETH’s recent bounce is nothing more than a temporary pause before the downtrend resumes, while others see signs of a potential bullish reversal forming at current levels.

Fresh data from Binance reveals that Ethereum is now entering a delicate phase. Price momentum has clearly weakened, yet open interest remains relatively high despite the decline from the $3,900 region. This disconnect highlights a major shift in futures market behavior: traders are holding positions, but not aggressively increasing them.

The 30-day open interest Z-Score currently sits at 0.50, indicating that OI is just slightly above its 30-day average—well within normal volatility bands. Unlike previous corrections, where open interest surged during heavy selling, the current reading suggests neither extreme leverage buildup nor panic-driven position closures.

This unusual combination—weakening momentum paired with stable open interest—underscores a market in transition. Whether Ethereum resumes its downtrend or begins carving out a recovery will depend on how quickly momentum returns to spot and futures markets in the days ahead.

Open Interest Stability Signals a Market in Repositioning

According to the Arab Chain report on CryptoQuant, Ethereum’s $6.61 billion in open interest highlights that traders are still holding a substantial share of their positions despite the sharp decline from $3,900 to below $3,200. This divergence—falling price but steady OI—is characteristic of market repositioning phases, where traders reduce activity without fully exiting the market.

The supporting metrics reinforce this view: the OI avg30 sits at $6.44 billion, and the OI std30 at $329 million, indicating that current fluctuations remain well within normal volatility ranges. There is no sign of aggressive position buildup or liquidation pressure.

Binance Ethereum Open Interest Z-Score | Source: CryptoQuant

With the Z-Score at 0.50, the modest rise in open interest does not suggest overwhelming bearish leverage. Instead, it shows that traders are still engaging with the market and selectively building new positions as price declines. This level of participation is important: it signals that the derivatives market is active but not overheated.

Ethereum’s price weakness, driven by fading momentum after failing to sustain its previous highs, leaves the market at an inflection point. If large traders are predominantly short, stable OI could support the continuation of downward pressure. However, if long positions dominate, this same stability may lay the groundwork for a rebound once momentum returns.

Testing Momentum as Bulls Attempt to Reclaim Control

Ethereum is attempting to stabilize above the $3,150–$3,160 zone after a volatile multi-week decline. The chart shows ETH rebounding from a local low near $2,750, forming a short-term rising structure. However, momentum remains fragile. The 50-day SMA continues to slope downward and sits well above current price action, reinforcing the broader downtrend. Until ETH can break and close above this moving average, upside attempts will likely face resistance.

ETH conolidates around key level | Source: ETHUSDT chart on TradingView

The 100-day SMA is also declining, converging with the $3,350–$3,400 region—an area that could act as the next major ceiling for any bullish continuation. Meanwhile, the 200-day SMA remains flat but sits just above price, creating an additional barrier around $3,250–$3,300. This cluster of resistance levels confirms that Ethereum is still operating within a corrective structure despite the recent bounce.

Volume has tapered off noticeably compared to the heavy sell-side spikes seen in November. This suggests that the rebound may be driven more by diminishing selling pressure than strong spot demand. If volume remains weak, ETH may struggle to build enough momentum for a sustained recovery.

Featured image from ChatGPT, chart from TradingView.com

Analysts Split on XRP Future Outlook as Centralization Debate Intensifies

8 December 2025 at 15:00

The outlook for XRP is becoming increasingly polarized as traders, analysts, and industry critics weigh in on its price trajectory, governance model, and growing institutional interest.

Recent market activity reflects a complex environment where both technical signals and structural concerns are shaping sentiment. As whale sell-offs, ETF inflows, and a revived decentralization debate collide, XRP finds itself at a critical moment that is testing assumptions about its long-term viability.

Ripple XRP XRPUSD XRPUSD_2025-12-08_13-21-40

New Participation Models and Market Volatility

A wave of alternative yield platforms, including BlackchainMining, has entered the market offering “XRP mining” rewards, despite XRP not being a mineable asset. These models rely on token lock-ups rather than computational work, with platforms distributing returns from liquidity operations or other investment strategies.

While they appeal to holders seeking passive income, they introduce counterparty and operational risks, especially given their reliance on centralized management rather than transparent network mechanics.

At the same time, XRP’s spot price continues to react to whale activity. Recent sell-offs pushed the token toward the $2 level before stabilizing, reflecting short-term volatility driven by large holders. In contrast, long-term investors appear unfazed, maintaining positions that help steady the circulating supply.

Institutional demand through XRP ETFs adds yet another dimension. U.S.-listed funds have seen nearly $900 million in inflows, indicating that larger players are continuing to build exposure despite market turbulence.

Technical Setups and Derivatives Data Show Mixed Sentiment

Analysts tracking XRP’s long-term chart structure note parallels with the 2017 bull cycle. A multi-year symmetrical triangle forming between 2018 and 2025 has created expectations of a breakout, with some projecting potential upside should historical patterns repeat.

The current price action around $2.05 reflects a tightening consolidation, and a 16% move in either direction is considered possible after the pattern resolves.

However, derivatives markets present a contrasting picture. Coinglass data shows that XRP is the most aggressively shorted major asset, with roughly 96% of open interest positioned against it.

Despite this, XRP has held modest gains, supported by sustained ETF inflows. Analysts warn that such extreme positioning increases the likelihood of a short squeeze if even minor catalysts shift sentiment.

Centralization Concerns Resurface

Beyond price action, structural criticism has resurfaced following sharp commentary from analyst Justin Bons, who argues that XRP is “centralized in every way,” citing validator distribution and governance limitations.

Supporters counter that XRP’s model is designed for institutional settlement rather than maximal decentralization, but the debate highlights a longstanding divide between crypto-native expectations and enterprise-focused blockchain design.

Whether XRP evolves through technical breakouts, institutional adoption, or renewed scrutiny over its governance will determine how the asset is perceived moving forward. Currently, the market remains divided, with both opportunity and uncertainty moulding the path ahead.

Cover image from ChatGPT, XRPUSD chart from Tradingview

Confirming The Bitcoin Price Direction: Analyst Reveals What You Should Look Out For

8 December 2025 at 13:30

After breaking below $90,000 again, the next direction of the Bitcoin price is being hotly debated once again. This comes with the added burden of a number of major events coming around this week, as well as investor sentiment being stuck in the negative territory for an extended period of time. Crypto analyst, MarcPMarkets, shares his thoughts on the current state of the market and what investors should be looking out for as the next direction is determined.

The Bearish And Bullish Scenarios

In the analysis shared on the TradingView website, MarcPMarkets highlights the different scenarios that could determine where the Bitcoin price could be headed next. Cautioning investors to watch out for confirmation, the first level that the analyst highlights is the $93,500 area, where the Bitcoin price had failed to reclaim a high.

Since the price fell below $90,000 over the weekend, the next major level now lies at $88,000, and it is where bulls must protect their support. In the event that bulls lose this support and the price breaks decisively below this point, the crypto analyst warns investors to expect the Bitcoin price to crash another $10,000. Next would be the $78,000 area, where the cryptocurrency is likely to secure its next support.

On the flip side, where the Bitcoin price could turn bullish once again, the crypto analyst points to the $95,000 resistance. Investors are to pay attention to this resistance, because if broken, then it would mean that strength is building back up, completely canceling out the bearish scenario highlighted above.

The major targets in the case of a bullish takeover would first be $105,581. Above this lies the next major level of $113,213, and then finally, the $120,850 target that would be the final hit before momentum fizzles out.

Bitcoin price

Developments That Could Affect The Bitcoin Price

Beyond the price action, some events that could affect Bitcoin’s trajectory are expected to unfold this week. The FOMC meeting is drawing closer, with the Fed expected to announce its stance on the financial markets going forward.

If, at the completion of the press conference, the Fed takes on a dovish stance, then the crypto analyst expects that prices will begin to move upward again. Additionally, quantitative tightening ended at the start of December, ushering the markets into an era of quantitative easing, which has always been bullish for risk assets as new liquidity is pumped into the market.

Bitcoin price chart from Tradingview.com

Crypto Market On Alert As This Week’s Fed Decision Isn’t Just About Rates

8 December 2025 at 12:30

Crypto markets head into this week’s Federal Reserve meeting focused less on rate cut and more on whether Jerome Powell quietly declares the start of quantitative easing (QE). The key question on Wednesday for macro-sensitive traders is whether the Fed shifts into a bill-heavy “reserve management” regime that starts rebuilding dollar liquidity, even if it refuses to call it QE.

Futures markets suggest the rate decision itself is largely a foregone conclusion. According to the CME FedWatch Tool, traders are assigning roughly 87.2% odds to a 0.25 percentage point cut, underscoring that the real uncertainty is not about the size of the move, but about what the Fed signals on reserves, T-bill purchases and the future path of its balance sheet.

Former New York Fed repo specialist and current Bank of America strategist Mark Cabana has become the focal point of that debate. His latest client note argues that Powell is poised to announce a program of roughly 45 billion dollars in monthly Treasury bill purchases. For Cabana, the rate move is secondary; the balance-sheet pivot is the real event.

Cabana’s argument is rooted in the Fed’s own “ample reserves” framework. After years of QT, he contends that bank reserves are skirting the bottom of the comfortable range. Bill purchases would be presented as technical “reserve management” to keep funding markets orderly and repo rates anchored, but in practice they would mark a turn from draining to refilling the system. That is why many in crypto describe the prospective move as “stealth QE,” even though the Fed would frame it as plumbing.

What This Means For The Crypto Market

James E. Thorne, Chief Market Strategist at Wellington Altus, sharpened the point in X post. “Will Powell surprise on Wednesday?” he asked, before posing the question that has been echoing across macro desks: “Is Powell about to admit on Wednesday that the Fed has drained the system too far and now has to start refilling the bathtub?” Thorne argues that this FOMC “is not just about another token rate cut; it is about whether Powell is forced to roll out a standing schedule of bill-heavy ‘reserve management’ operations precisely because the Fed has yanked too much liquidity out of the plumbing.”

Thorne ties that directly to New York Fed commentary on funding markets and reserve adequacy. In his reading, “By Powell’s own framework, QT is done, reserves are skirting the bottom of the ‘ample’ range bordering on being too tight, and any new bill buying will be dressed up as a technical tweak rather than a confession of error, even though it will plainly rebuild reserves and patch the funding stress that the Fed’s own over-tightening has triggered.” That framing goes to the heart of what crypto traders care about: the direction of net liquidity rather than the official label.

Macro analysts followed closely by digital-asset investors are already mapping the next phase. Milk Road Macro on X has argued that QE returns in 2026, potentially as early as the first quarter, but in a much weaker form than the crisis-era programs.

They point to expectations of roughly 20 billion dollars a month in balance-sheet growth, “tiny compared to the 800bn per month in 2020,” and stress that the Fed “will be buying treasury bills, not treasury coupons.” Their distinction is blunt: “Buying treasury coupons = real QE. Buying treasury bills = slow QE.” The takeaway, in their words, is that “the overall direct effect on risk asset markets from this QE will be minimal.”

That distinction explains the tension now gripping crypto markets. A bill-only, slow-paced program aimed at stabilizing short-term funding is very different from the broad-based coupon buying that previously compressed long-term yields and turbo-charged the hunt for yield across risk assets. Yet even a modest, technically framed program would mark a clear return to balance-sheet expansion.

For Bitcoin and the broader crypto market, the immediate impact will depend less on Wednesday’s basis-point move and more on Powell’s language around reserves, Treasury bill purchases and future “reserve management” operations. If the Fed signals that QE is effectively starting and the bathtub is starting to be refilled, the liquidity backdrop that crypto trades against in 2026 may already be taking shape this week.

At press time, the total crypto market cap was at $3.1 trillion.

Total crypto market cap

Here’s How High The Dogecoin Price Will Go Once The MACD Bullish Cross Happens

8 December 2025 at 11:30

The Dogecoin price has been drifting through a subdued stretch over the past few days, holding around the mid-$0.13 to $0.14. The recent decline has slowed down in the past 48 hours, and the chart now shows the meme coin attempting to steady itself after weeks of persistent selling pressure.

Trader Tardigrade, a well-known crypto analyst on X, shared a new three-day chart suggesting that an important MACD signal is on the verge of forming, and historical performance shows that Dogecoin tends to move bullish once this signal appears.

Approaching The MACD Bullish Cross

Dogecoin’s quiet phase in the past 48 hours has become increasingly important because one of Dogecoin’s higher-timeframe indicators is beginning to show early signs of life.  According to Trader Tardigrade, Dogecoin’s MACD indicator on the 3-day candlestick price chart has not yet confirmed a bullish cross, but it is very close to doing so. 

The chart he shared shows the MACD lines converging at the lower boundary of the recent downtrend, and the blue line is approaching the red line. The blue line is about to cross over the red one, mirroring the exact setup that preceded previous breakouts earlier this year. 

Even with Dogecoin trading quietly in recent days, the compression of the MACD indicator hints that bearish momentum is fading. Once the cross officially forms, the trend will shift into a bullish one. This gradual tightening of price movement is also characteristic of an accumulation phase, and this is shown by an important Dogecoin metric.

Dogecoin price

Dogecoin Price Chart, MACD Cross. Source: @TATrader_Alan On X

How High The Dogecoin Price Could Go

The chart reveals a clear pattern: every time Dogecoin printed a three-day MACD bullish cross in 2025, the price responded with a significant upward move. The first cross was in April, and this preceded a rally that pushed Dogecoin’s price from below $0.14 into a breakout to $0.26. 

A second cross followed during mid-summer in July, and once again the price climbed aggressively shortly afterward. This saw the Dogecoin price rally from around $0.16 to $0.30 very briefly. 

Both events are circled on the chart above, showing how the momentum flipped swiftly once the MACD crossed above the signal line. These repeated reactions strengthen the case that Dogecoin could be preparing for another sizeable run if the indicator confirms a cross in the coming days.

The projection area drawn on the right side of the chart points to a climb that extends well above $0.20. This suggests that the next wave may revisit the upper levels where Dogecoin last traded during its late-summer rally.

The analyst’s chart outlines a wide upward arc, indicating that the expected move would not be a minor rebound but a structured uptrend similar to the earlier surges this year. In terms of a price target, the projection shows Dogecoin reaching a price target around $0.35 in the next few weeks. This would translate to a 140% increase from Dogecoin’s current price of $0.142.

Dogecoin price chart from Tradingview.com

❌
❌